Market Minds Advisory
Asia-Pacific Fintech Market

Asia-Pacific Fintech Market: The State Built The Rails And Gave Them Away

Governments across this region mandated a merchant fee of zero on their instant payment rails. Every fintech revenue model here had to move somewhere the state was not already competing for free.

Lead Analyst

Published

September 2026

Make Smarter Decisions with Customized Research Insights

Request a free sample report and evaluate market opportunities, growth trends, and competitive dynamics relevant to your business needs.

2025 MARKET VALUE$172.0BMarket Size 2025
2036 FORECAST VALUE$672.7BBase Case , 2026 to 2036
CAGR 2026 TO 203613.2 %Bull 14.4% / Bear 12.0%
INCREMENTAL OPPORTUNITY$478.0BNet 10- year value creation
EXPANSION MULTIPLE3.46x2036 value over 2026 base
Strategic Levers
M&A Pipeline
Regional Outlook
Country Rankings
Competitive Intelligence
Segmental Deep-dive
Call-Us : 91 93563 13602

Executive Snapshot and Market Trajectory

Payments here are a public utility rather than a business. One national rail carries around 16 billion transactions a month at a mandated merchant charge of zero, which removed the revenue layer Western fintech was built on. Western fintech never once faced anything like that.
South Asia and Pacific holds 42% of value and East Asia 41%, both far above their usual bands because this is a region-scoped market. Digital lending and credit grows at 19.8%, half again the market rate of 13.2%, because it is where the money went once payments stopped being able to earn anything at all. Payments simply became an acquisition channel rather than anything at all that anybody could charge for out here anywhere.
Concentration reaches only 34% because there is no regional market, only a dozen national ones with genuinely incompatible rules. Singapore licenses openly, India regulates by sudden directive, and a firm operating across both is running two companies wearing the same brand. Treating this as one market is the most common analytical error made about it, and almost every regional strategy deck begins by making exactly that same mistake anyway.
Market Definition
The market covers revenue earned by financial technology providers across Asia-Pacific, spanning digital lending and credit, wealth and investment platforms, cross-border payments and remittance, business financial software and infrastructure, insurance distribution technology, and domestic payments and wallets. Traditional bank net interest income earned outside technology channels, securities exchange operations, insurance underwriting risk margin, cryptoasset trading and custody, and public payment infrastructure operated by central banks or state entities are excluded.
Base Year Value
$172.0B in 2025 (MMA Primary Research Dataset, August 2026)
Forecast Period
2026 to 2036, eleven discrete annual values
CAGR
13.2% base case. Bull 14.4%. Bear 12.0%.
Fastest Growth Segment
Digital Lending and Credit: 19.8% CAGR
Fastest Growth Country
India: 15.2% CAGR
Fastest Growth Region
South Asia and Pacific: 15.4% CAGR
Largest Region
South Asia and Pacific: 42% of 2025 global value
Market Leaders
Ant Group, Grab Financial Group, Paytm, SeaMoney, GoTo Financial. Source: MMA Analysis based on disclosed fintech revenue across Asia-Pacific, company annual reports 2025.
Primary Survey
n=3,800 procurement and R&D decision-makers, Q4 2025, six countries
Methodology
Demand-side build-up, cross-validated against public data, 47 expert interviews

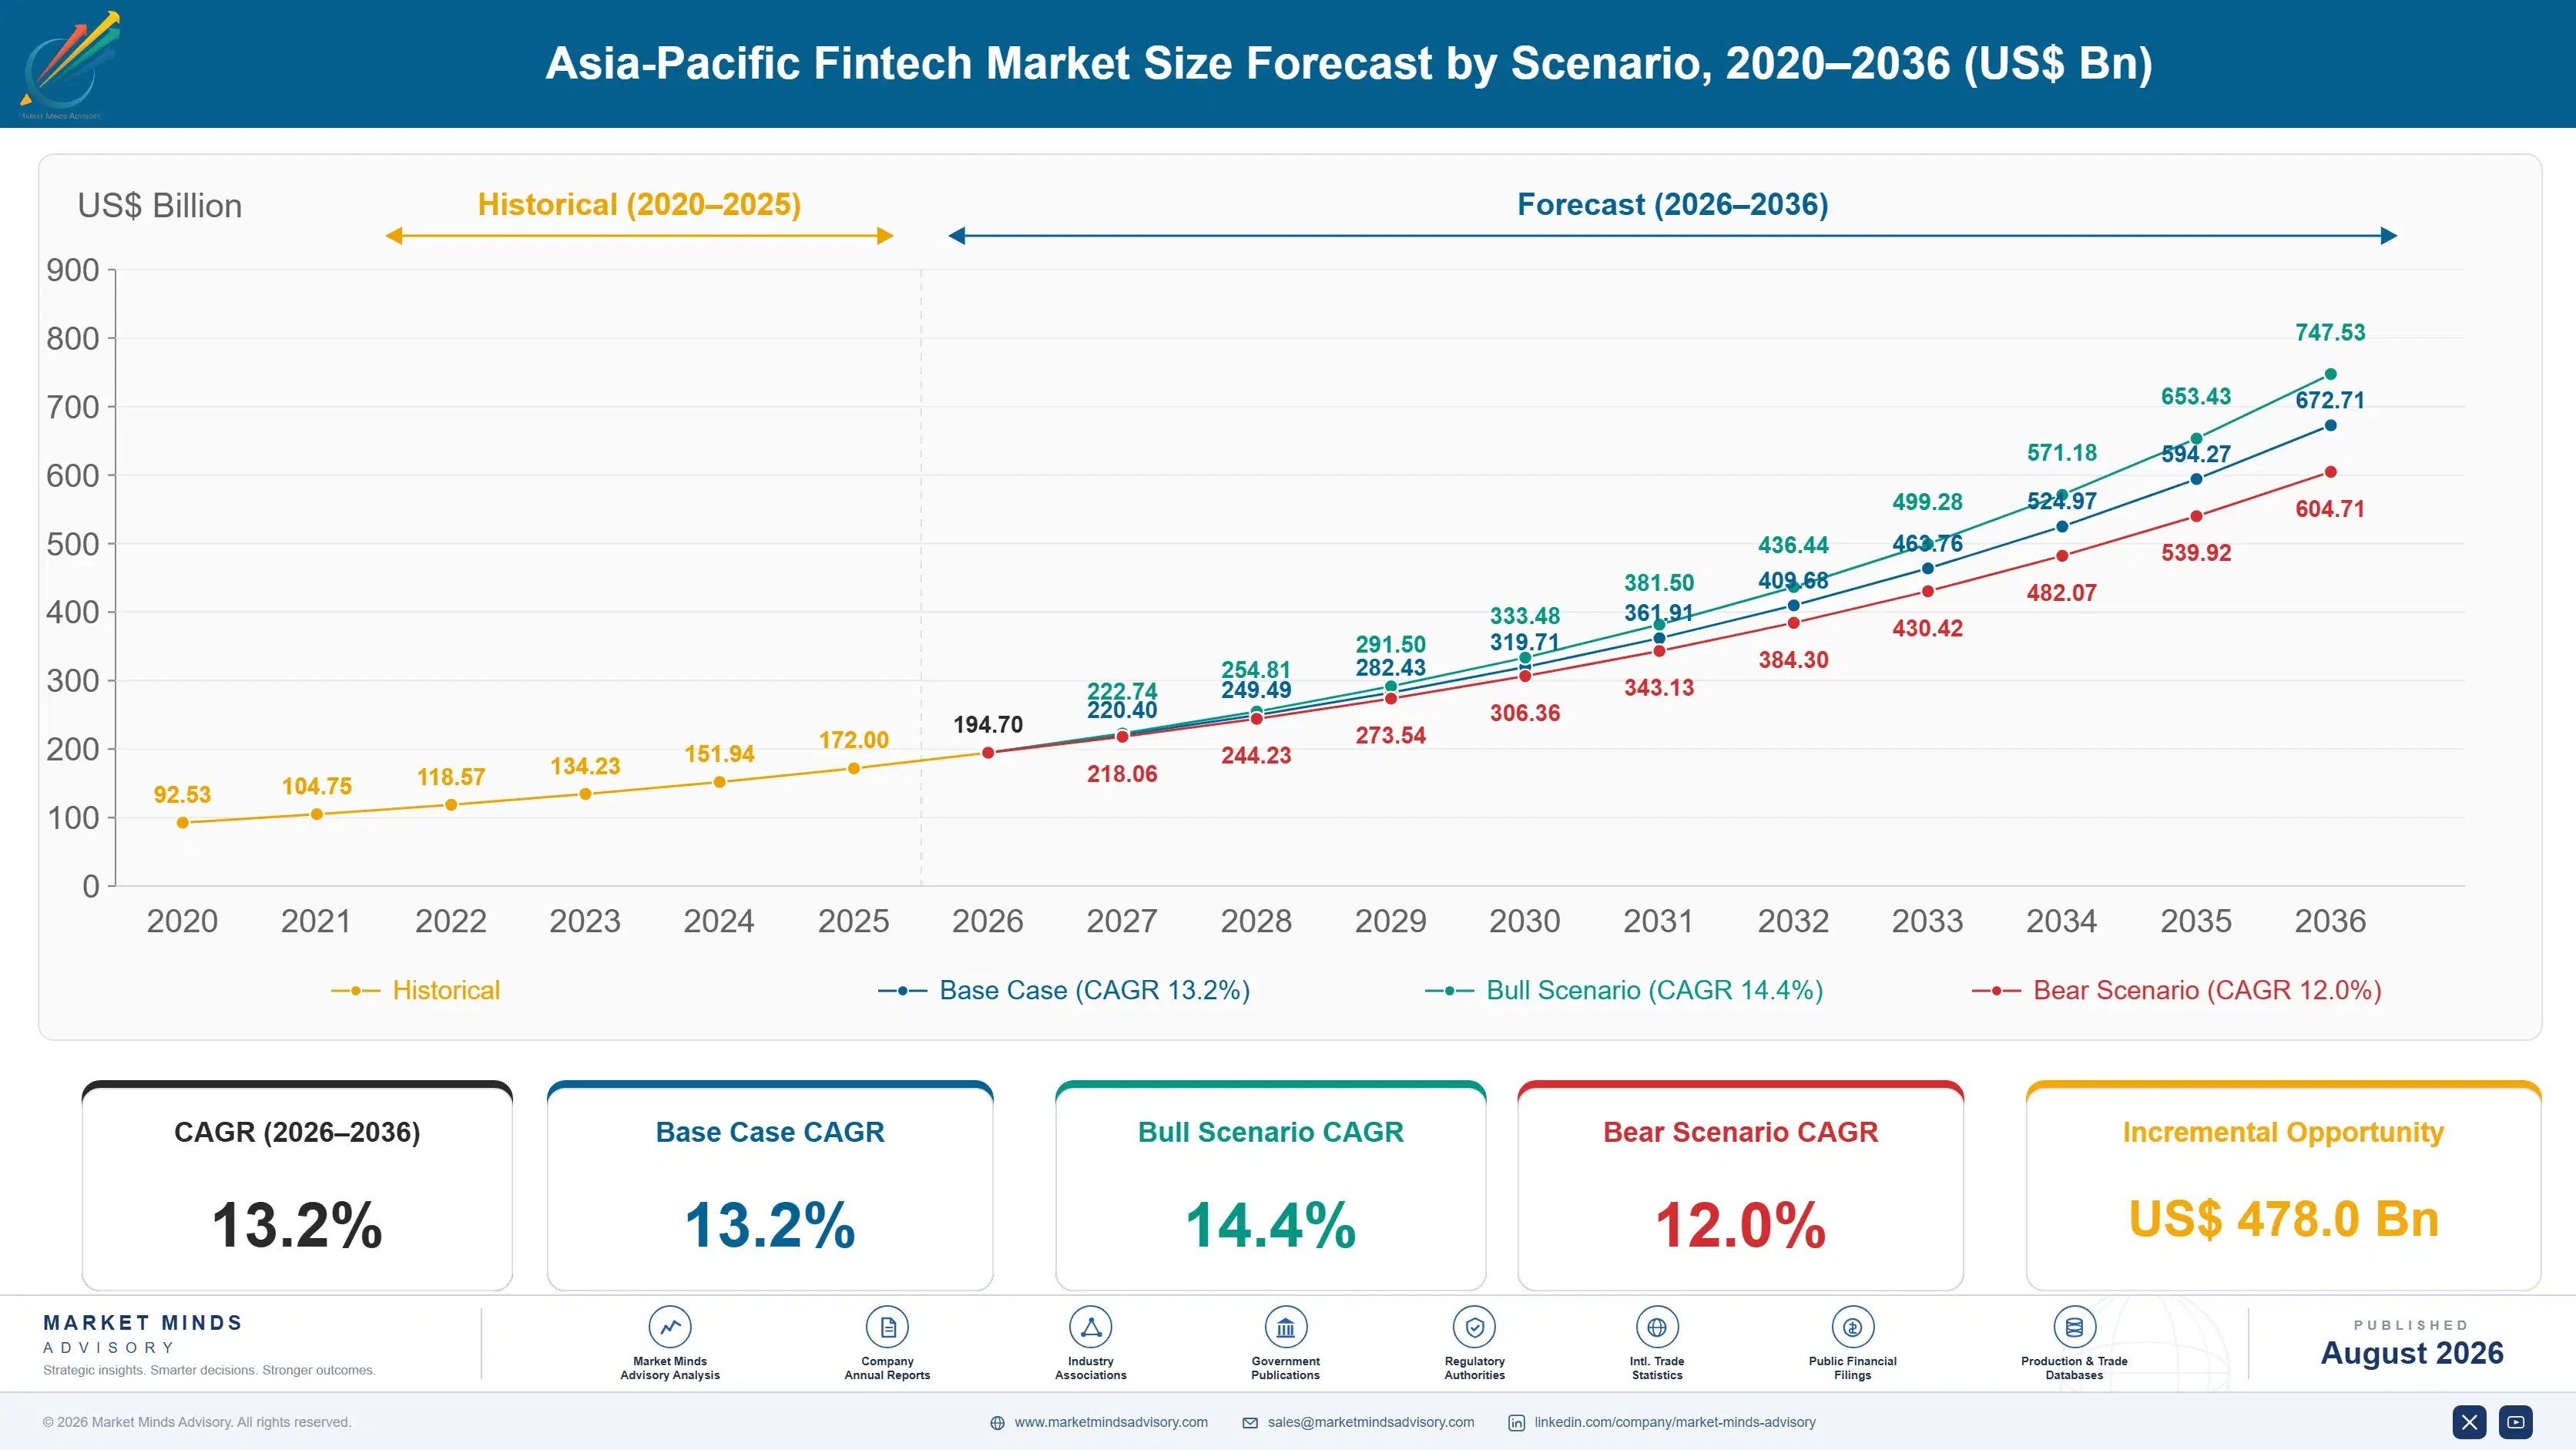
Asia-Pacific Fintech Market Forecast Scenarios

asia-pacific-fintech-market-size-forecast-scenario-1787915981122
Growth from 2020 to 2025 ran at 12.0% and public policy shaped most of it. Governments mandated zero merchant fees on instant rails and capped charges for the smallest merchants, which removed payment revenue as a viable business almost overnight. Firms pivoted into lending. Regulators then intervened repeatedly, restricting default loss guarantee arrangements and acting against individual licensed entities with limited warning.
The 13.2% base case rests on three mechanisms. Digital lending keeps growing because payment history from free rails makes borrowers assessable who were previously invisible to anybody. Wealth platforms keep growing as first-time investors arrive with small balances that no traditional broker wanted. And cross-border corridors keep expanding on remittance and trade flows that remain among the largest anywhere in the world. None of the three depends on payments ever earning anything again.
The bull case at 14.4% assumes regulatory frameworks stabilise enough for firms to plan across more than one budget cycle. The bear case at 12.0% is further directives arriving without notice, which has happened repeatedly and which removes business lines rather than merely constraining them, alongside superapp parents cutting fintech investment as their other divisions continue failing to produce profit.

Free Rails, Paid Everything Else

The single most important fact here is that payments cannot earn anything. Governments across the region built instant transfer rails, mandated a merchant charge of zero on the largest of them and capped fees for micro merchants at around 0.3% elsewhere. One rail alone carries roughly 16 billion transactions a month. Western fintech built businesses on the payment layer. Here that layer was effectively nationalised and handed out free.
FIVE-FIRM CONCENTRATION34%Share of category revenue held by the largest regional providers
MANDATED PAYMENT FEE0%Charge permitted on the largest instant payment rail
LENDING REVENUE SHARE46%Category income arising from credit rather than payments
MONTHLY INSTANT TRANSACTIONS16Billions moving across one national rail each month
REMITTANCE CORRIDOR COST5.8%Average charge on sending money into the region
MICRO MERCHANT FEE CAP0.3%Ceiling applied to the smallest accepting businesses here
So the revenue moved, and it moved to lending. Around 46% of category income now comes from credit rather than from moving money, because the free rails generate transaction histories that make previously invisible borrowers assessable. Payments became customer acquisition rather than a product. Firms describing themselves as payment companies are describing a marketing channel and reporting revenue from something else.
There is no regional market and treating it as one is the most common analytical error made here. Singapore licenses transparently and predictably. India regulates through directives that arrive without consultation and occasionally remove a business line in a fortnight. Indonesia and the Philippines are permissive, Australia runs a consumer data right, and Japan and Korea barely resemble any of them. A firm operating across four markets runs four companies.
"Everybody writes about Asian fintech as though it were one thing. Ask any operator which regulator they are most afraid of and you get four different answers, and each of them will tell you the other three markets are considerably easier than their own."
Director, Asia Digital Finance Practice · MMA Financial Technology and Digital Finance Practice · August 2026

Market Trends

Credit Became The Business Payments Could Not Be

With merchant charges mandated at zero on the largest rails and capped near 0.3% for the smallest merchants, revenue migrated into lending, which now supplies around 46% of category income. Free payment rails produce the transaction history that makes thin-file borrowers assessable, so the utility that destroyed one business model quietly enabled another. Firms still describing themselves as payment companies are reporting lending revenue underneath a payments brand. Nobody planned that migration and nobody in the region would reverse it now even if a regulator suddenly permitted charging for it again.
Market Impact: Undercuts a 5.8% corridor cost

Wealth Platforms Take Balances Brokers Never Wanted

First-time investors arriving with balances of a few hundred dollars were never economic for a traditional broker to serve, and digital platforms serve them at costs that make the accounts viable from the first deposit. That segment grows at 16.2%. Revenue per account is tiny and the account count is enormous, which is a shape that only works with genuinely automated onboarding, custody and reporting throughout. Several well-funded entrants discovered that after launch rather than before it, and withdrew from markets they had spent a great deal of money entering.
Market Impact: Drives lending toward 19.8% growth

Market Opportunities and Growth Drivers

Remittance Corridors Here Are The Largest Anywhere

Inflows into India, the Philippines, Bangladesh and Pakistan are among the biggest remittance flows in the world, and average corridor costs of roughly 5.8% leave considerable room for anybody who can deliver the same service more cheaply. India grows fastest at 15.2%. Competition on transparency rather than headline fees has begun reshaping the corridors, since senders comparing total cost rather than advertised charges reach different conclusions entirely. The proportion of senders who actually compare total cost rises every single year, and nobody in this business expects that trend to stop anywhere.
Market Impact: Removed lines within 2 weeks

Superapp Parents Need Their Fintech Arms To Pay

Listed regional superapps have pivoted from growth to profitability and their mobility, delivery and commerce divisions produce very little margin, which leaves the financial services arm carrying expectations it was never originally built to meet. Lending is where those expectations get satisfied. That pressure has driven credit expansion faster than underwriting capability developed, and several parents are discovering the difference during their first genuine credit cycle. Pressure from a parent company is not a credit strategy, and the difference between the two becomes visible only when losses arrive rather than beforehand.
Market Impact: Requires 4 separate operating models

Market Restraints and Challenges

Directives Arrive Without Warning And Remove Business Lines

Regulators across several markets act by directive rather than by consultation, and interventions restricting default loss guarantee arrangements or acting against individual licensed entities have removed business lines within weeks rather than constraining them gradually. Root cause is supervisory philosophy rather than any hostility to the sector. Commercial impact is that planning horizons compress to a single budget cycle. Mitigation involves licence diversification and capital buffers, both of which cost growth. Nobody plans a five year strategy in a market where a directive can arrive next month without any warning.
Market Impact: Supplies 46% of category income

Four Markets Means Four Companies Wearing One Brand

Licensing, product rules, data requirements and consumer protection differ so completely between markets that regional operation means running parallel organisations with a shared logo and very little else in common. Root cause is that no regional framework exists or is being negotiated. Commercial impact is that scale economies mostly do not arrive. Mitigation is deliberate market selection rather than regional ambition, which few investors have wanted to hear. Investors generally prefer a map showing eight markets to an operator explaining why three of them would be better run properly instead.
Market Impact: Grows wealth platforms at 16.2%
3 additional market trends, 4 additional growth drivers, and 2 additional restraints and challenges are covered in the full report. Contact sales@marketmindsadvisory.com to access the complete intelligence.

Segment CAGR and Growth Architecture

Segmentation follows service line, since revenue model, regulatory treatment and capital requirement all differ by line rather than by market or customer type. Six categories cover the market without overlap. Country, customer segment and distribution channel are treated as separate commercial dimensions throughout this report rather than as segmentation logic in their own right.
asia-pacific-fintech-market-market-share-analysis-1787915981665

Digital Lending and Credit

Digital lending grows at 19.8%, half again the market rate of 13.2%, and now supplies around 46% of category income because payments were mandated free and the revenue had to go somewhere that regulation had not already made worthless. Free rails generate the transaction history that makes thin-file borrowers assessable at all. The risk is that superapp parents pushed credit expansion faster than underwriting capability developed, and several are meeting their first genuine credit cycle with books nobody has stress tested. Regulators have intervened in this line more often than in any other, restricting risk sharing arrangements and acting against individual entities with almost no notice given to anybody at all.
CAGR 19.8%

Wealth and Investment Platforms

Wealth platforms grow at 16.2% by serving first-time investors with balances of a few hundred dollars whom no traditional broker ever wanted to onboard at any price. Revenue per account is tiny and account counts are enormous, which works only where onboarding, custody, reporting and tax handling are automated end to end. Any manual step anywhere in that chain destroys the economics immediately, which is why several well-funded entrants withdrew after discovering exactly that. Balances accumulate and compound rather than repaying and ending, which makes this the only genuinely accumulating revenue anywhere in the region and the reason so many lending-led firms keep on trying to build one themselves too.
CAGR 16.2%
Full segment breakdown across 6 segments available in the complete report.

Regional Architecture and Country Demand Map

This is a region-scoped market and the distribution reflects where fintech revenue is actually earned, with modest outward exposure through corridors, vendor relationships and offshore capital. The two Asian regions between them carry essentially everything and yet behave nothing at all like one another here.

North America

Share sits at 6%, far below the standard regional band, because this is a region-scoped market and American activity appears through outbound remittance corridors, venture capital and vendor technology rather than any operating presence. That justification is definitional. The capital relationship matters considerably more than the revenue: American investors funded much of the regional build and have become markedly more selective, which has slowed expansion plans across several markets simultaneously. Outbound remittance corridors from North American diaspora populations into South and Southeast Asia carry substantial volume at costs that have fallen but remain above what any domestic transfer would charge, which is where most of the outward revenue attributed here actually originates.
Share: 6% | CAGR: 12.0% (2026 to 2036)

Western Europe

Share sits at 5%, far below the standard regional band, for the same definitional reason applying to every non-Asian region here. European corridors carry meaningful remittance volume from diaspora populations into South and Southeast Asia. European regulatory concepts around open banking and payment services have influenced several regional frameworks, particularly in Australia and Singapore, though the mandated zero fee approach has no European equivalent at all. Remittance flows from European diaspora communities into the region are substantial and among the most price-competitive corridors anywhere, largely because European transparency requirements forced total cost disclosure earlier than most jurisdictions did. That disclosure standard has since travelled, which matters here considerably more than the revenue figure itself does.
Share: 5% | CAGR: 11.6% (2026 to 2036)
Regional intelligence for 5 additional markets available in the complete report: East Asia, South Asia and Pacific, Latin America, Middle East and Africa, Eastern Europe. Contact sales@marketmindsadvisory.com.
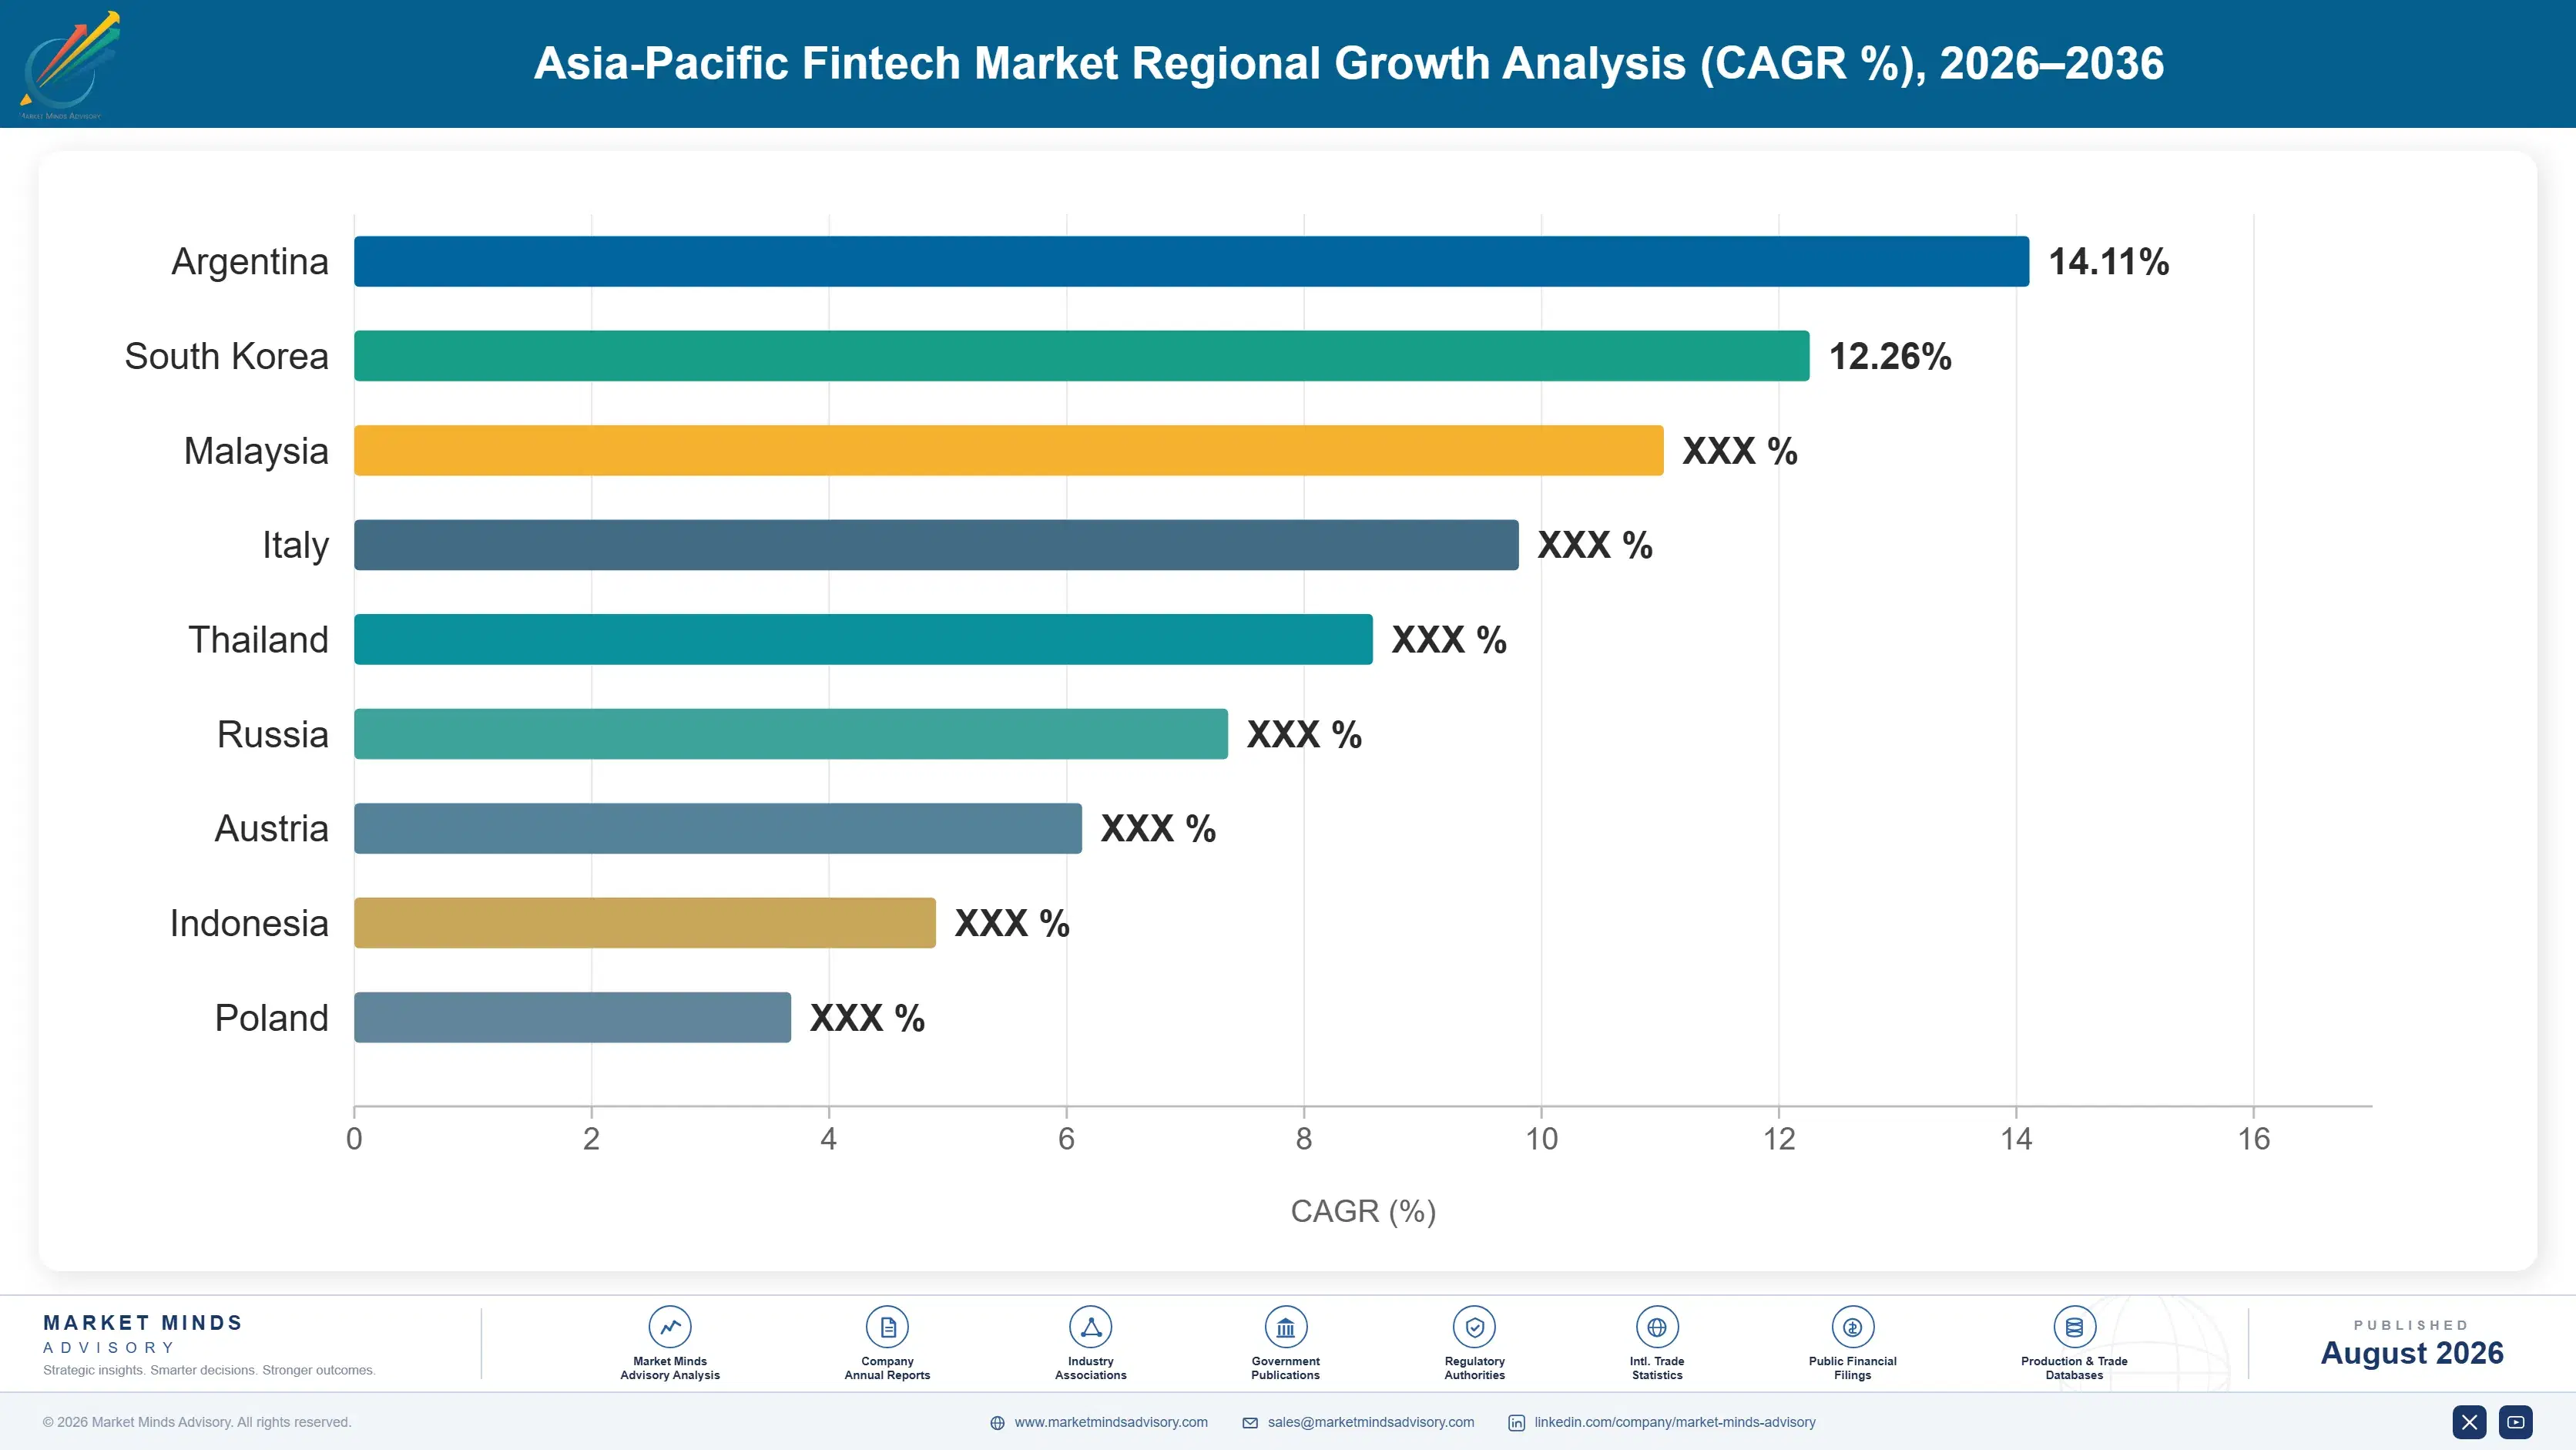
asia-pacific-fintech-market-country-cagr-analysis-1787915982178

Earn Where The State Does Not

Payment charges are mandated at zero and capped at 0.3% for micro merchants, lending supplies 46% of income, corridors cost 5.8% and one rail carries 16 billion monthly transactions. Four levers work on credit capability, corridor pricing, market selection and automation rather than on payment volume, which regulation across this region has already priced at zero.

Build Underwriting Before Expanding The Book

Lending now supplies around 46% of category income and superapp parents have pushed credit expansion faster than underwriting capability developed, which is a sequence that ends the same way in every market where anybody has tried it. Free rails supply transaction history and history is not the same as underwriting. Firms building genuine credit capability before scaling survive a cycle, and firms scaling first discover what they built during one. Loss rates show the difference well before any commentary does, and by then the cohort is already on the books.
Market Impact: Protects the entire 46% of category income base

Compete On Corridor Transparency Rather Than Headline

Average corridor costs of roughly 5.8% leave considerable room, and senders comparing total cost including exchange rate margin reach entirely different conclusions from those comparing advertised fees. India grows fastest at 15.2% on exactly these flows. Providers holding wide spreads behind attractive headline pricing lose the accounts that actually check, and the proportion of senders who check rises every year without exception. Corridor volume into this region is among the largest anywhere, which means a fractional improvement in total cost reaches more households than almost any other product decision available to anybody here.
Market Impact: Undercuts the 5.8% average corridor cost properly today

Select Markets Deliberately Instead Of Going Regional

Licensing, product rules and consumer protection differ so completely that regional operation means running four companies with a shared logo and no shared economics whatsoever. Scale benefits mostly do not arrive. Firms choosing three markets and operating properly in them outperform firms present in eight and competent in none, though the second approach raises capital considerably more easily from investors who like a map. Running 4 parallel organisations costs four compliance functions, four licensing programmes and four product roadmaps, and it shares almost nothing at all between any of them afterwards.
Market Impact: Avoids having to run 4 separate parallel organisations

Automate Everything Or Do Not Serve Small Balances

Wealth platforms grow at 16.2% by serving accounts holding a few hundred dollars, which works only where onboarding, custody, reporting and tax handling run end to end without any human step at all. One manual process anywhere destroys the economics immediately and invisibly. Several well-funded entrants discovered that after launch rather than before, and withdrew from markets they had spent considerable money entering. Small balances forgive nothing at all, and a single human touch anywhere in the chain converts a viable account into one that quietly loses money every month it stays open.
Market Impact: Serves a whole segment growing at 16.2% annually

Who Controls the Margin Pool

Measured on disclosed fintech revenue across Asia-Pacific, the five largest providers hold a CR5 of just 34%, which is low because the region contains a dozen national markets rather than one and few firms lead in more than two of them. Ant Group carries the largest single position by some distance, Grab Financial Group and GoTo Financial hold substantial Southeast Asian superapp reach, Paytm holds Indian scale, and SeaMoney spans several markets. Nobody outside that group leads in more than two national markets at any one time.
Three contests define activity. Lending competes on underwriting capability and funding cost. Wealth competes on automation depth. Corridors compete on total cost transparency rather than on advertised pricing. Each of those three rewards a completely different capability, and hardly anybody here competes convincingly in more than one of them.

Pressure builds from banks partnering directly rather than watching fintechs intermediate their own customers. Rankings shift toward whoever holds credit capability rather than whoever holds the most users. User counts have stopped explaining anything useful, since payment users generate no revenue at all and only a fraction of them ever borrow anything.
asia-pacific-fintech-market-company-positioning-matrix-1787915982701

Competitive Moat and Risk Dimensions

ANT GROUP

Moat: Domestic Scale And Licensed Position

Operating at a scale no other participant in the region approaches, with licences covering payments, lending, wealth and insurance distribution under a supervised holding structure, gives the group a position that regulatory change reshaped rather than removed. Rebuilding anything comparable is not available to anybody now, since the licensing conditions that permitted it no longer exist.
ANT GROUP

Risk: Single Market Regulatory Exposure

A position built overwhelmingly in one national market carries direct exposure to that market's rulemaking, which has already reshaped the business substantially once within a short period. International expansion has proved considerably harder than domestic scale suggested it would. Nothing about the group's size reduces the concentration of that particular risk.
GRAB FINANCIAL GROUP

Moat: Multi-Market Superapp Distribution

Reaching users across several Southeast Asian markets through a single application people open daily for transport and food gives the group acquisition economics that standalone financial providers cannot approach anywhere. Lending, wealth and insurance all attach to that traffic at almost no marginal cost. Assembling comparable multi-market consumer reach requires the underlying non-financial business first, which nobody can simply acquire.
GRAB FINANCIAL GROUP

Risk: Parent Profitability Pressure Above

The financial arm carries earnings expectations generated by mobility and delivery divisions that produce very little margin themselves, which pushes credit expansion at a pace underwriting capability has not always matched. Pressure from above is not a credit strategy. A first genuine credit cycle will test whether the book was built or merely grown.

Players Tracked

Prominent Players

Ant Group
Grab Financial Group
Paytm
SeaMoney
GoTo Financial

Other Key Players

PhonePe
Razorpay
Pine Labs
Kredivo
Akulaku
Xendit
2C2P
Airwallex
Nium
Wise
Zerodha
Groww
Coins.ph
Toss
WeBank

Recent Developments

FEBRUARY 2025

Regulator restricts lending arrangement across licensed partners

A regional regulator restricted a category of lending arrangement between technology platforms and licensed lenders, requiring changes to risk sharing structures. This was a supervisory directive rather than any consultation process, and affected firms had a matter of weeks to restructure or stop originating entirely.
Signal: Directives out here remove business lines rather than constraining them gradually over any period at all.
JUNE 2025

Instant payment rail passes further monthly transaction milestone

A national instant payment rail passed a further monthly transaction volume milestone while continuing to operate at a mandated merchant charge of zero. This was public infrastructure performance rather than any commercial development, and it reinforced that payment volume generates no revenue at all for anybody.
Signal: Volume on the free rail keeps rising and none of it earns anything at all anywhere.
OCTOBER 2025

Superapp fintech arm reports credit costs above internal guidance

A regional superapp reported credit costs on its lending book above previously indicated guidance following faster than planned expansion. This was a results disclosure rather than any regulatory matter, and the expansion had been driven by earnings expectations coming from elsewhere within the group entirely.
Signal: Growth pressure coming from a parent company is never any real substitute for genuine underwriting capability.

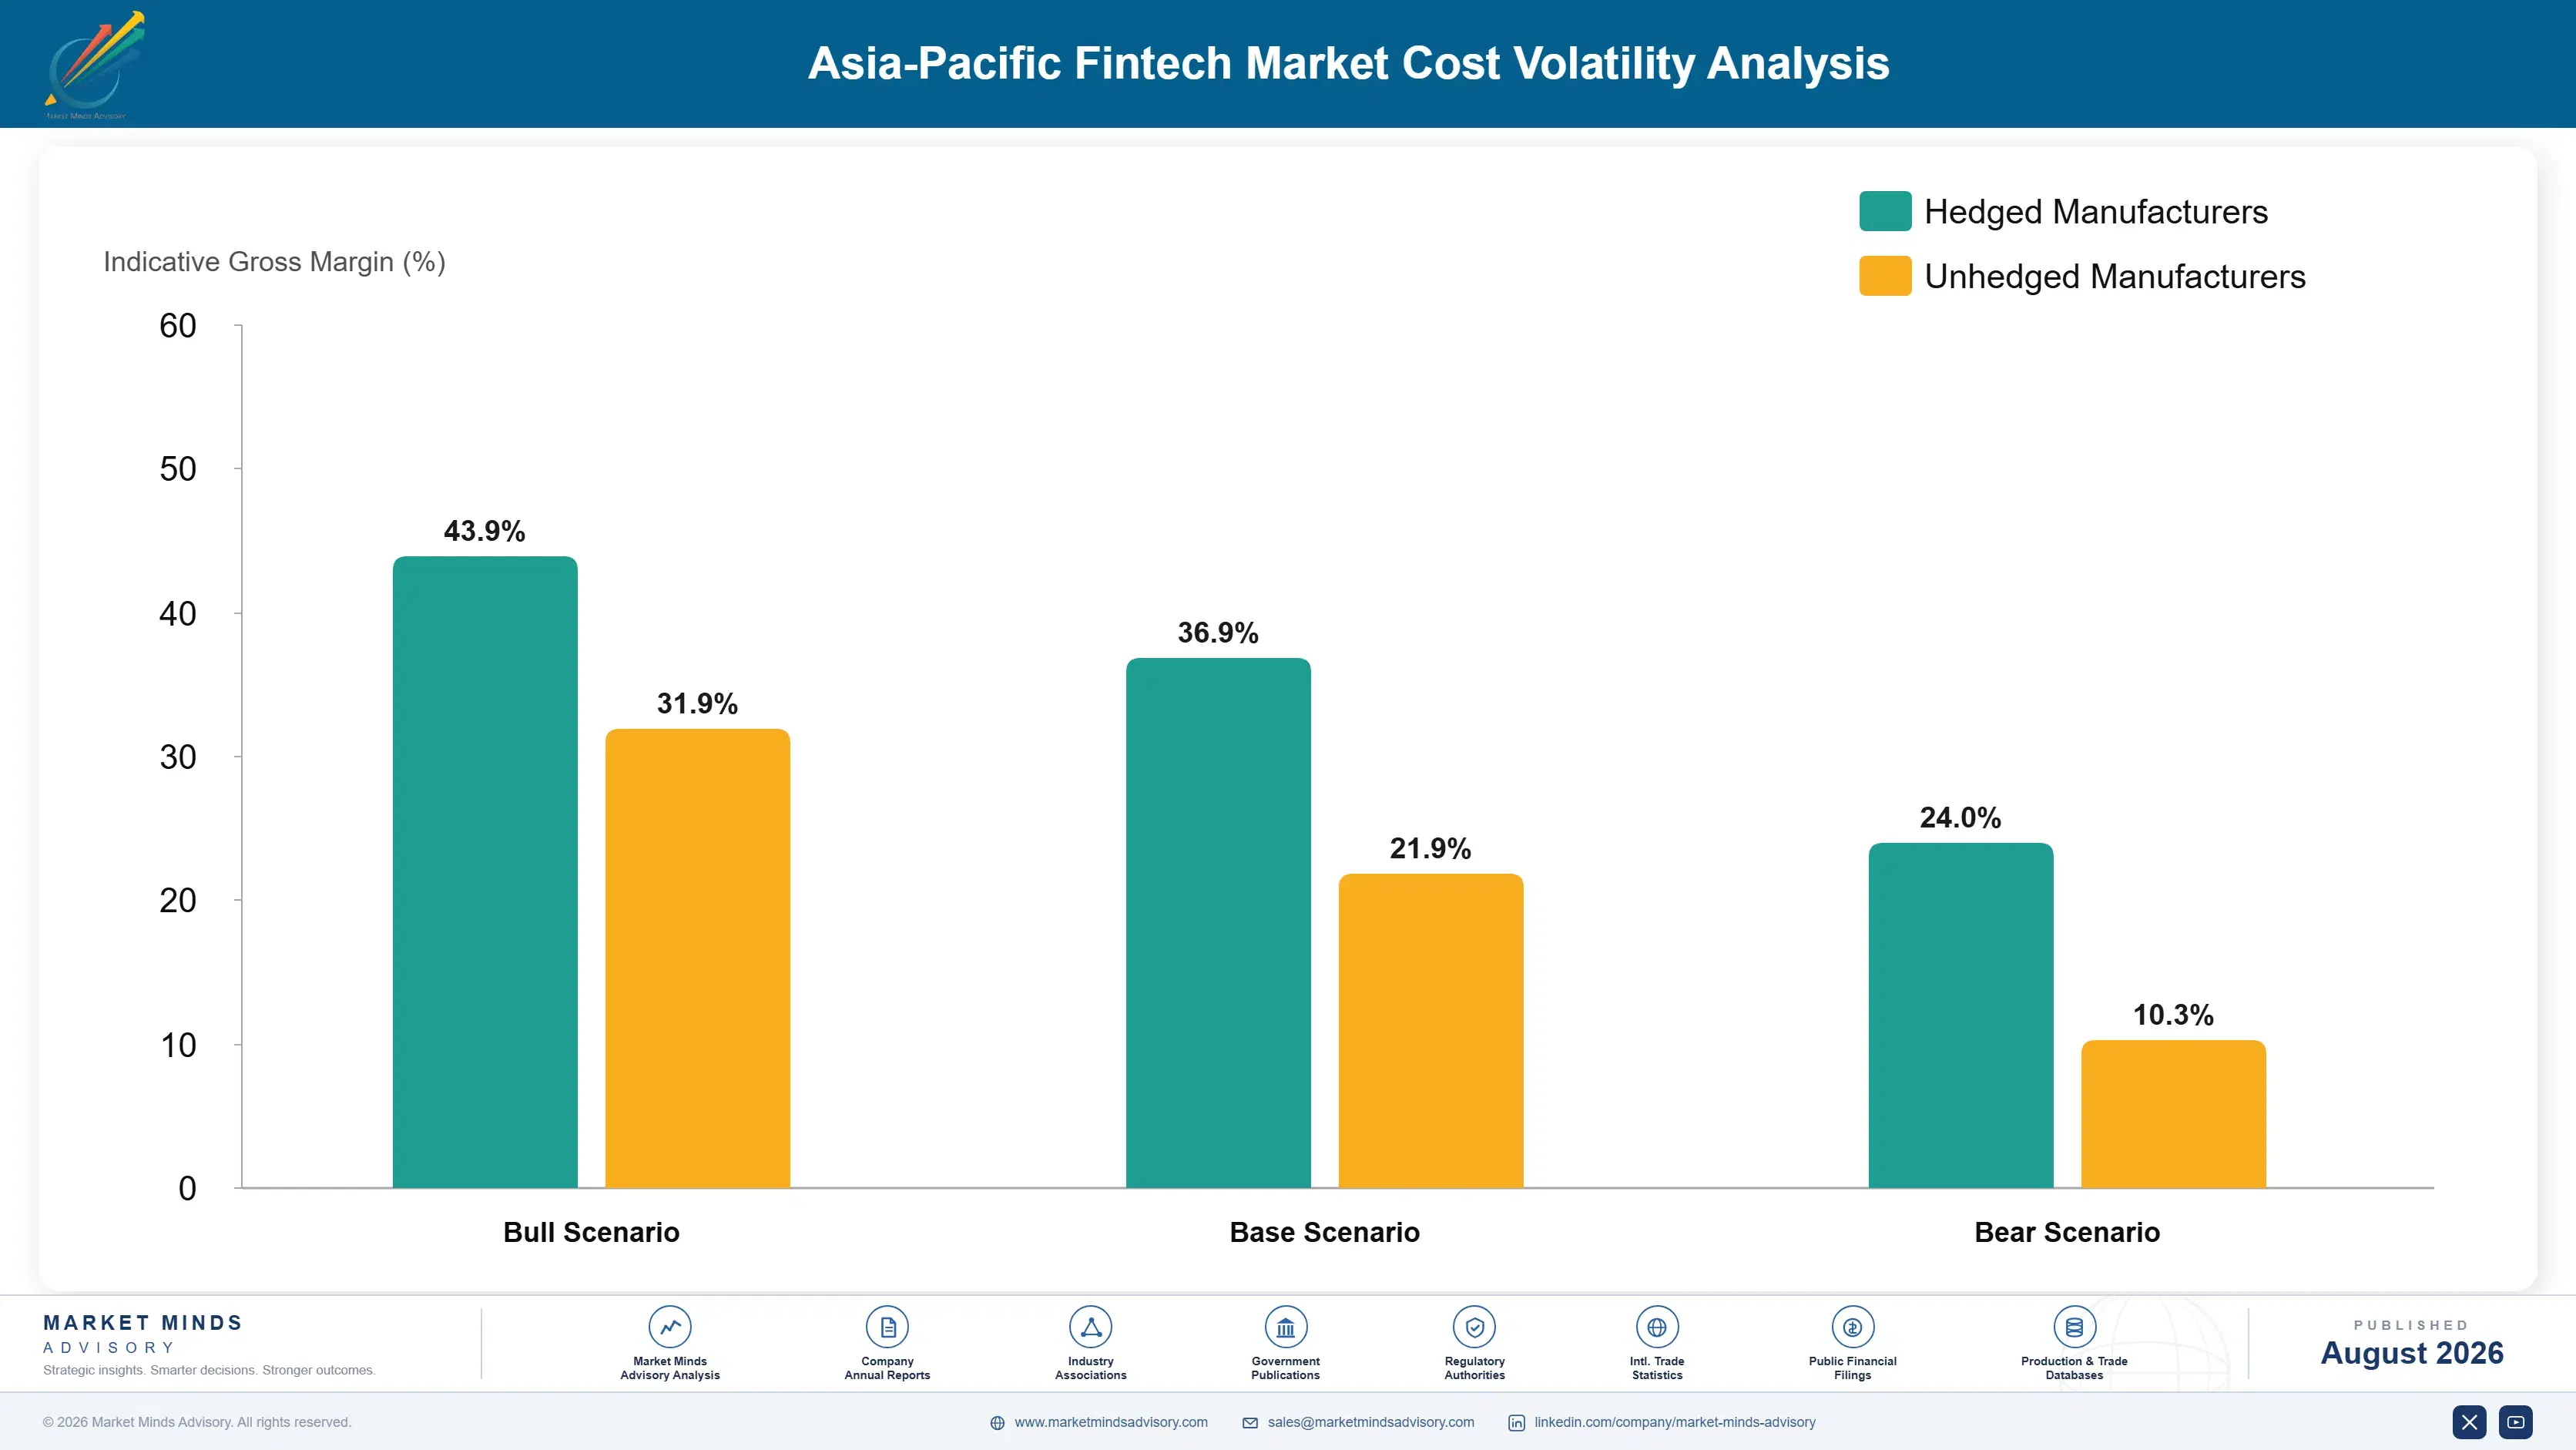
Credit Losses, Compliance, Acquisition

Three costs dominate provider economics. Credit losses and funding on lending books, technology with licensing and compliance operations, and customer acquisition together account for 67 to 81% of revenue at a typical provider. Credit cost has grown fastest, because lending now supplies around 46% of category income and several books expanded faster than the underwriting behind them, which shows up in loss rates before it shows up in commentary.
Two policy decisions reset everything. Mandated zero merchant charges on instant rails and caps near 0.3% for micro merchants removed payment revenue entirely, which Reserve Bank of India and Bank Indonesia payment system publications document across the period. Regulators then restricted default loss guarantee arrangements between platforms and lenders. Grab Holdings Annual Report 2024 and Paytm Annual Report 2024 disclosures describe both effects on reported revenue mix.

Exposure divides by whether a provider holds a licence and a balance sheet. Firms lending on their own book carry credit cost and keep the margin. Firms originating for partners earn fees and depend entirely on partner appetite, which regulators have restricted twice. Firms holding neither a licence nor a balance sheet compete on technology alone, the weakest of the three positions available.
asia-pacific-fintech-market-cost-volatility-analysis-1787915982895

Build underwriting capability ahead of book growth

Lending supplies around 46% of category income and several books grew faster than the capability assessing them, which is a sequence that resolves badly in every market anybody has tried it. Building genuine credit assessment costs time and slows expansion visibly. It is the difference between surviving a first credit cycle and explaining one afterwards.

Diversify licences across more than one supervisor

Directives arrive without consultation and have removed business lines within weeks rather than constraining them gradually over time. Holding permissions across more than one jurisdiction costs capital, headcount and considerable management attention. It means a single supervisory decision cannot remove the whole business at once, which has happened to firms operating in one market.

Automate small balance servicing end to end

Wealth accounts holding a few hundred dollars work only where onboarding, custody, reporting and tax handling run without any human step involved at all. One manual process anywhere destroys the unit economics immediately and usually invisibly. Automating properly costs engineering investment upfront and is the only construction under which small balances produce anything at all.

Portfolio Architecture for Margin Defence

Margin follows distance from the free rails rather than transaction volume. Domestic payments and wallets earn almost nothing by regulatory design. Insurance distribution technology earns modestly on commission. Business financial software earns reasonably on contracted subscription. Cross-border payments earn well on foreign exchange margin. Wealth platforms earn better once automation reaches genuine end to end coverage. Digital lending earns best, on credit risk somebody is actually being paid to carry.
The tension is that the highest earning line is the one regulators intervene in most frequently. Lending supplies around 46% of income and has attracted directives restricting risk sharing arrangements, capping charges and acting against individual entities with almost no notice. Providers concentrating there earn well and hold a business a supervisor can reshape in a fortnight, which is a risk that no amount of underwriting quality addresses at all.

High-value pools sit in three places. Genuine credit underwriting capability, which several large books were built without and are now discovering they need. Corridor transparency positioning, which wins the senders who compare total cost and lose nobody who does not. And end to end automation in wealth, which decides whether small balance accounts produce anything or quietly consume it.

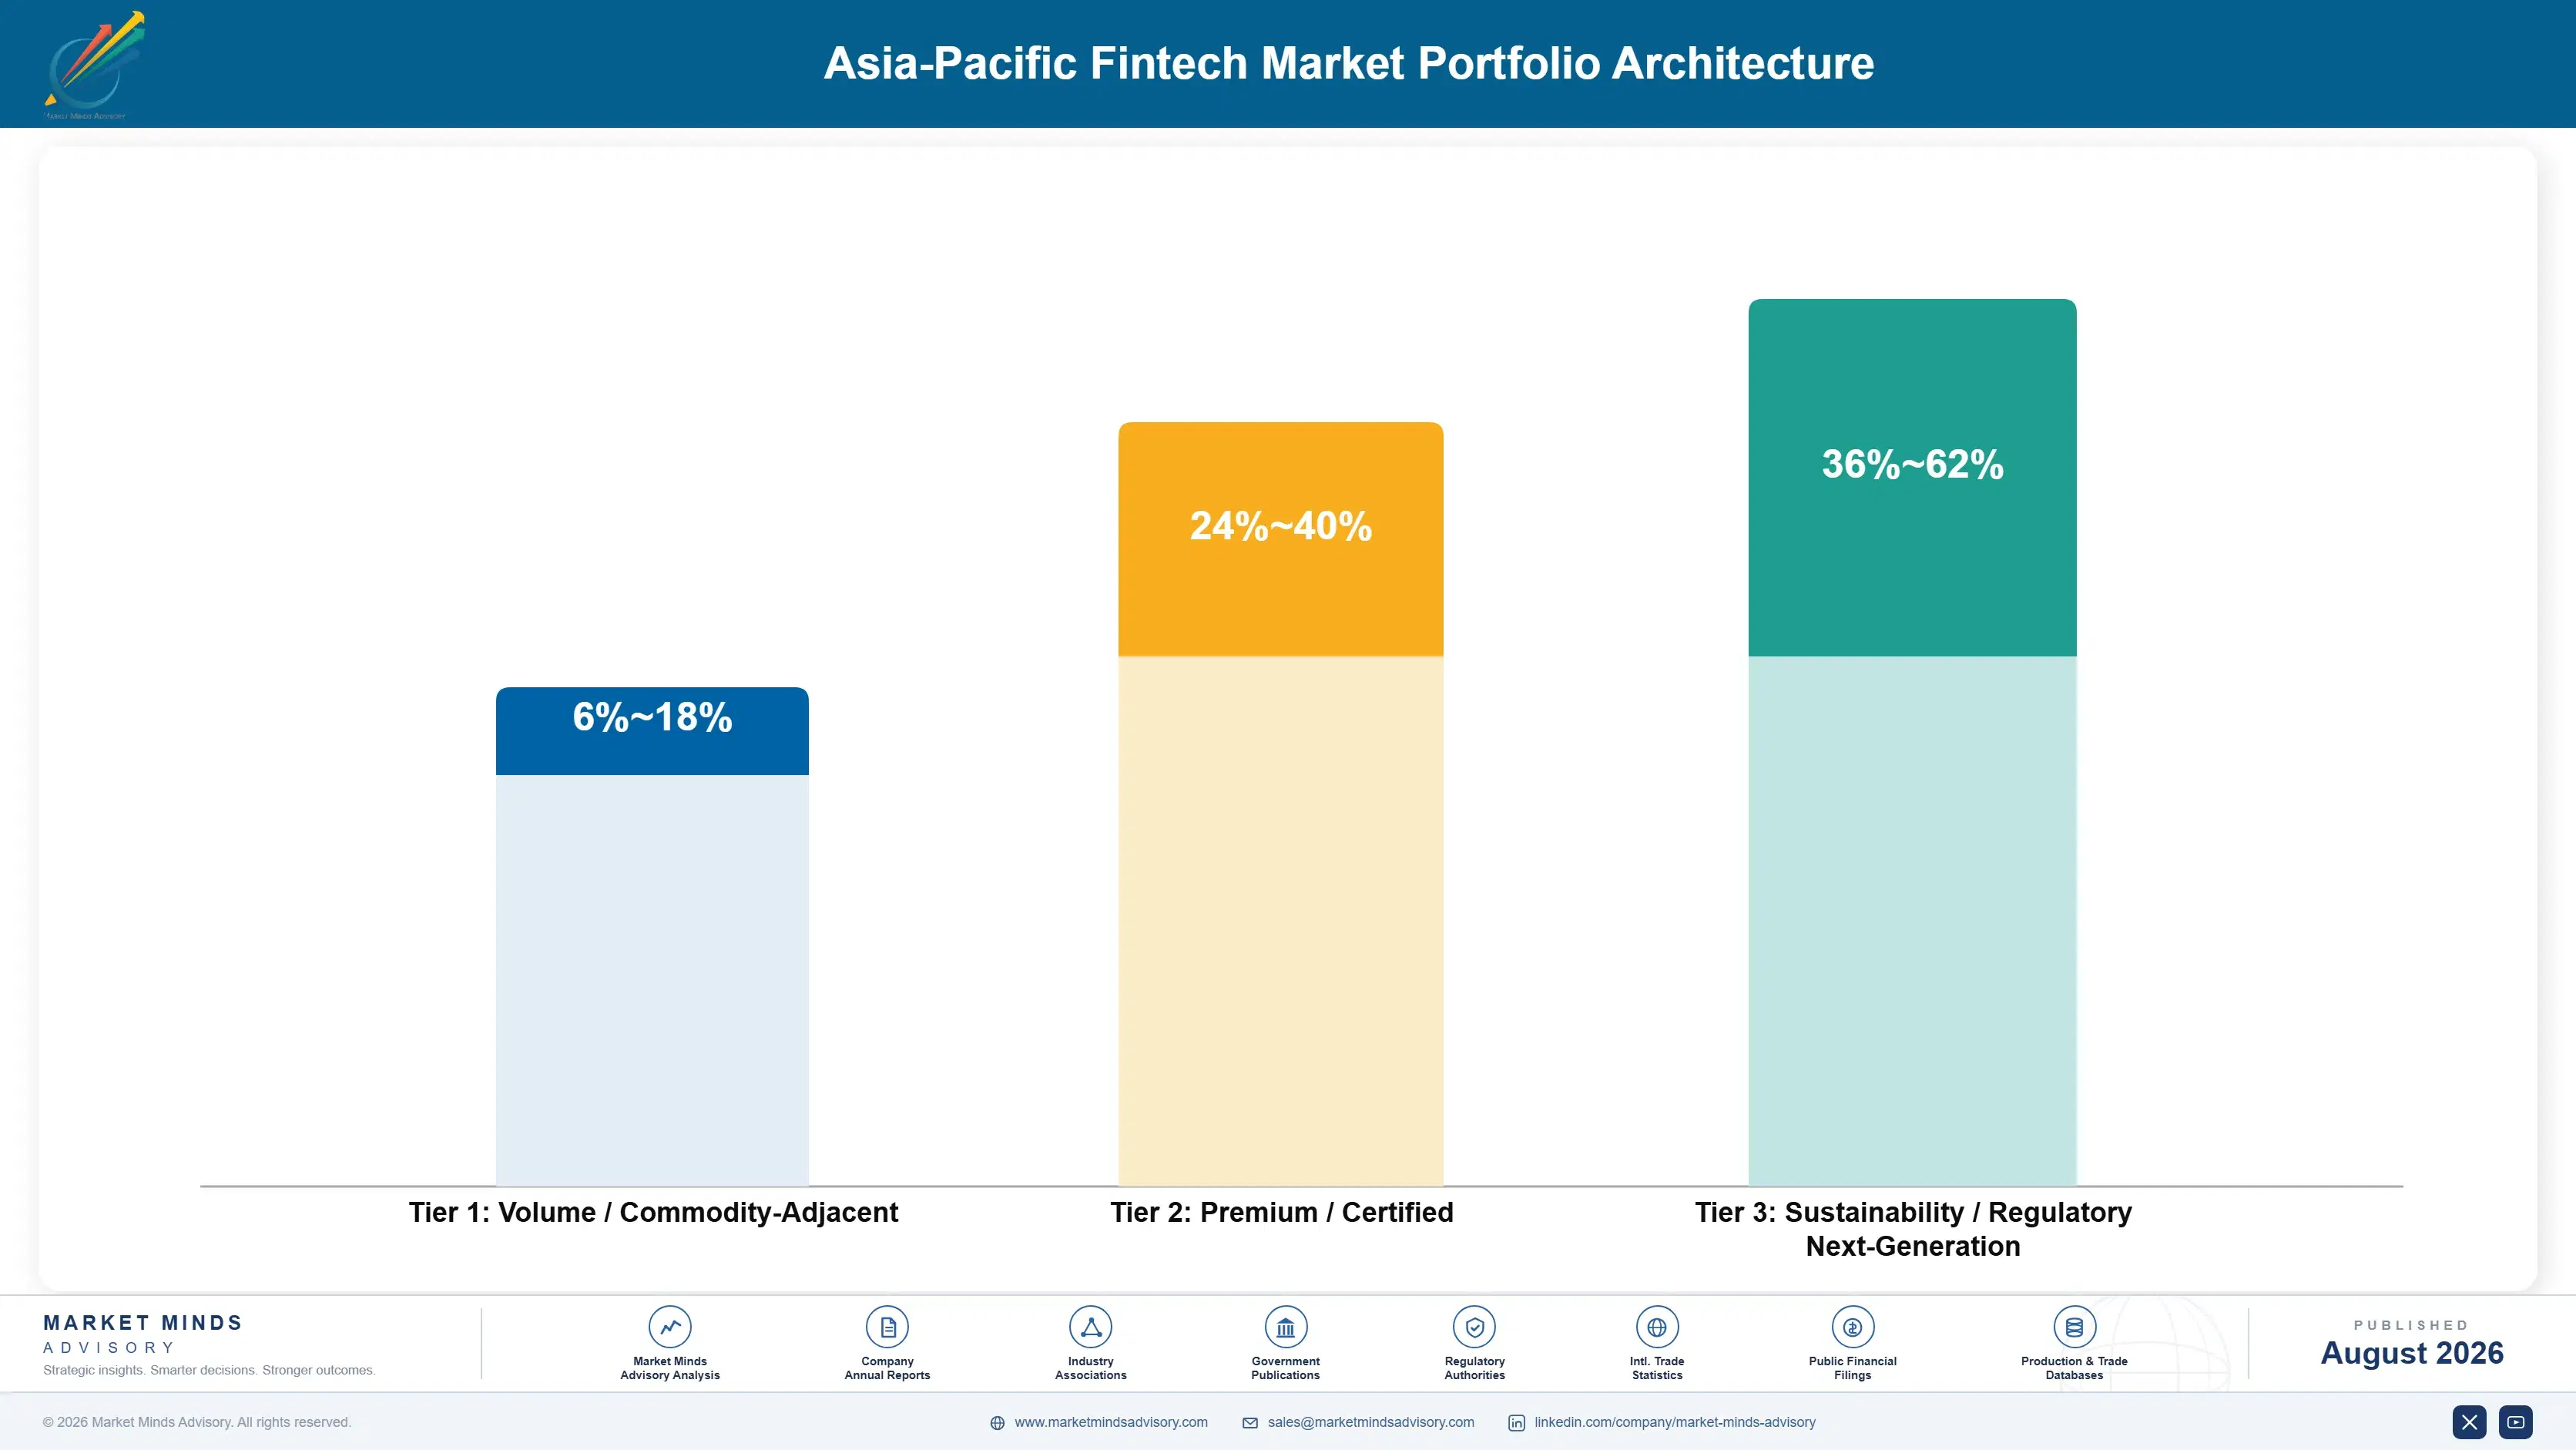
Volume / Commodity-Adjacent

Domestic payments and wallets operating on rails where merchant charges are mandated at zero or capped near 0.3%. The 12-point range separates providers monetising adjacent services from those still treating payment volume as a business in itself.
Gross Margin: 6-18%

Premium / Certified

Insurance distribution technology and business financial software earning commission or subscription rather than transaction margin. The 16-point spread reflects how differently commission-based distribution and contracted software subscription perform across markets.
Gross Margin: 24-40%

Sustainability / Regulatory / Next-Generation

Digital lending, wealth platforms and cross-border payments where credit risk, automation depth or foreign exchange margin generate genuine returns. The 26-point range is wide because lending returns depend on credit outcomes that vary enormously between books.
Gross Margin: 36-62%
asia-pacific-fintech-market-portfolio-architecture-1787915983401

High-value Sub-segments and Strategic Watch-out

Credit Underwriting Capability

Highest returns and fastest growth at 19.8%, and the capability several large books were assembled without and now urgently require. The risk is that a first genuine credit cycle tests whether each book was actually built or merely grown quickly. Nobody quite knows which one yet.
Gross Margin: 50-62%

Corridor Transparency Positioning

Strong economics against average corridor costs near 5.8%, winning senders who compare total cost including exchange margin rather than headline fees. The risk is that competitors match transparency and the differentiation collapses into ordinary price competition. And that differentiation has a genuinely limited life anyway.
Gross Margin: 40-54%

Payment Volume And Wallets

The volume core carrying enormous transaction counts at a mandated charge of zero on the largest rails available. Providers hold it as acquisition, not because moving money earns anything for anybody any more. Customer acquisition is genuinely all that it ever actually buys anybody here.
Gross Margin: 8-20%

Single Supervisor Dependence

The strategic watch-out. Directives arrive without consultation and have removed business lines within weeks in several markets. The risk is holding permissions from one supervisor who can end the business in a fortnight. And a fortnight of notice is what everybody eventually seems to receive.
Gross Margin: 20-32%

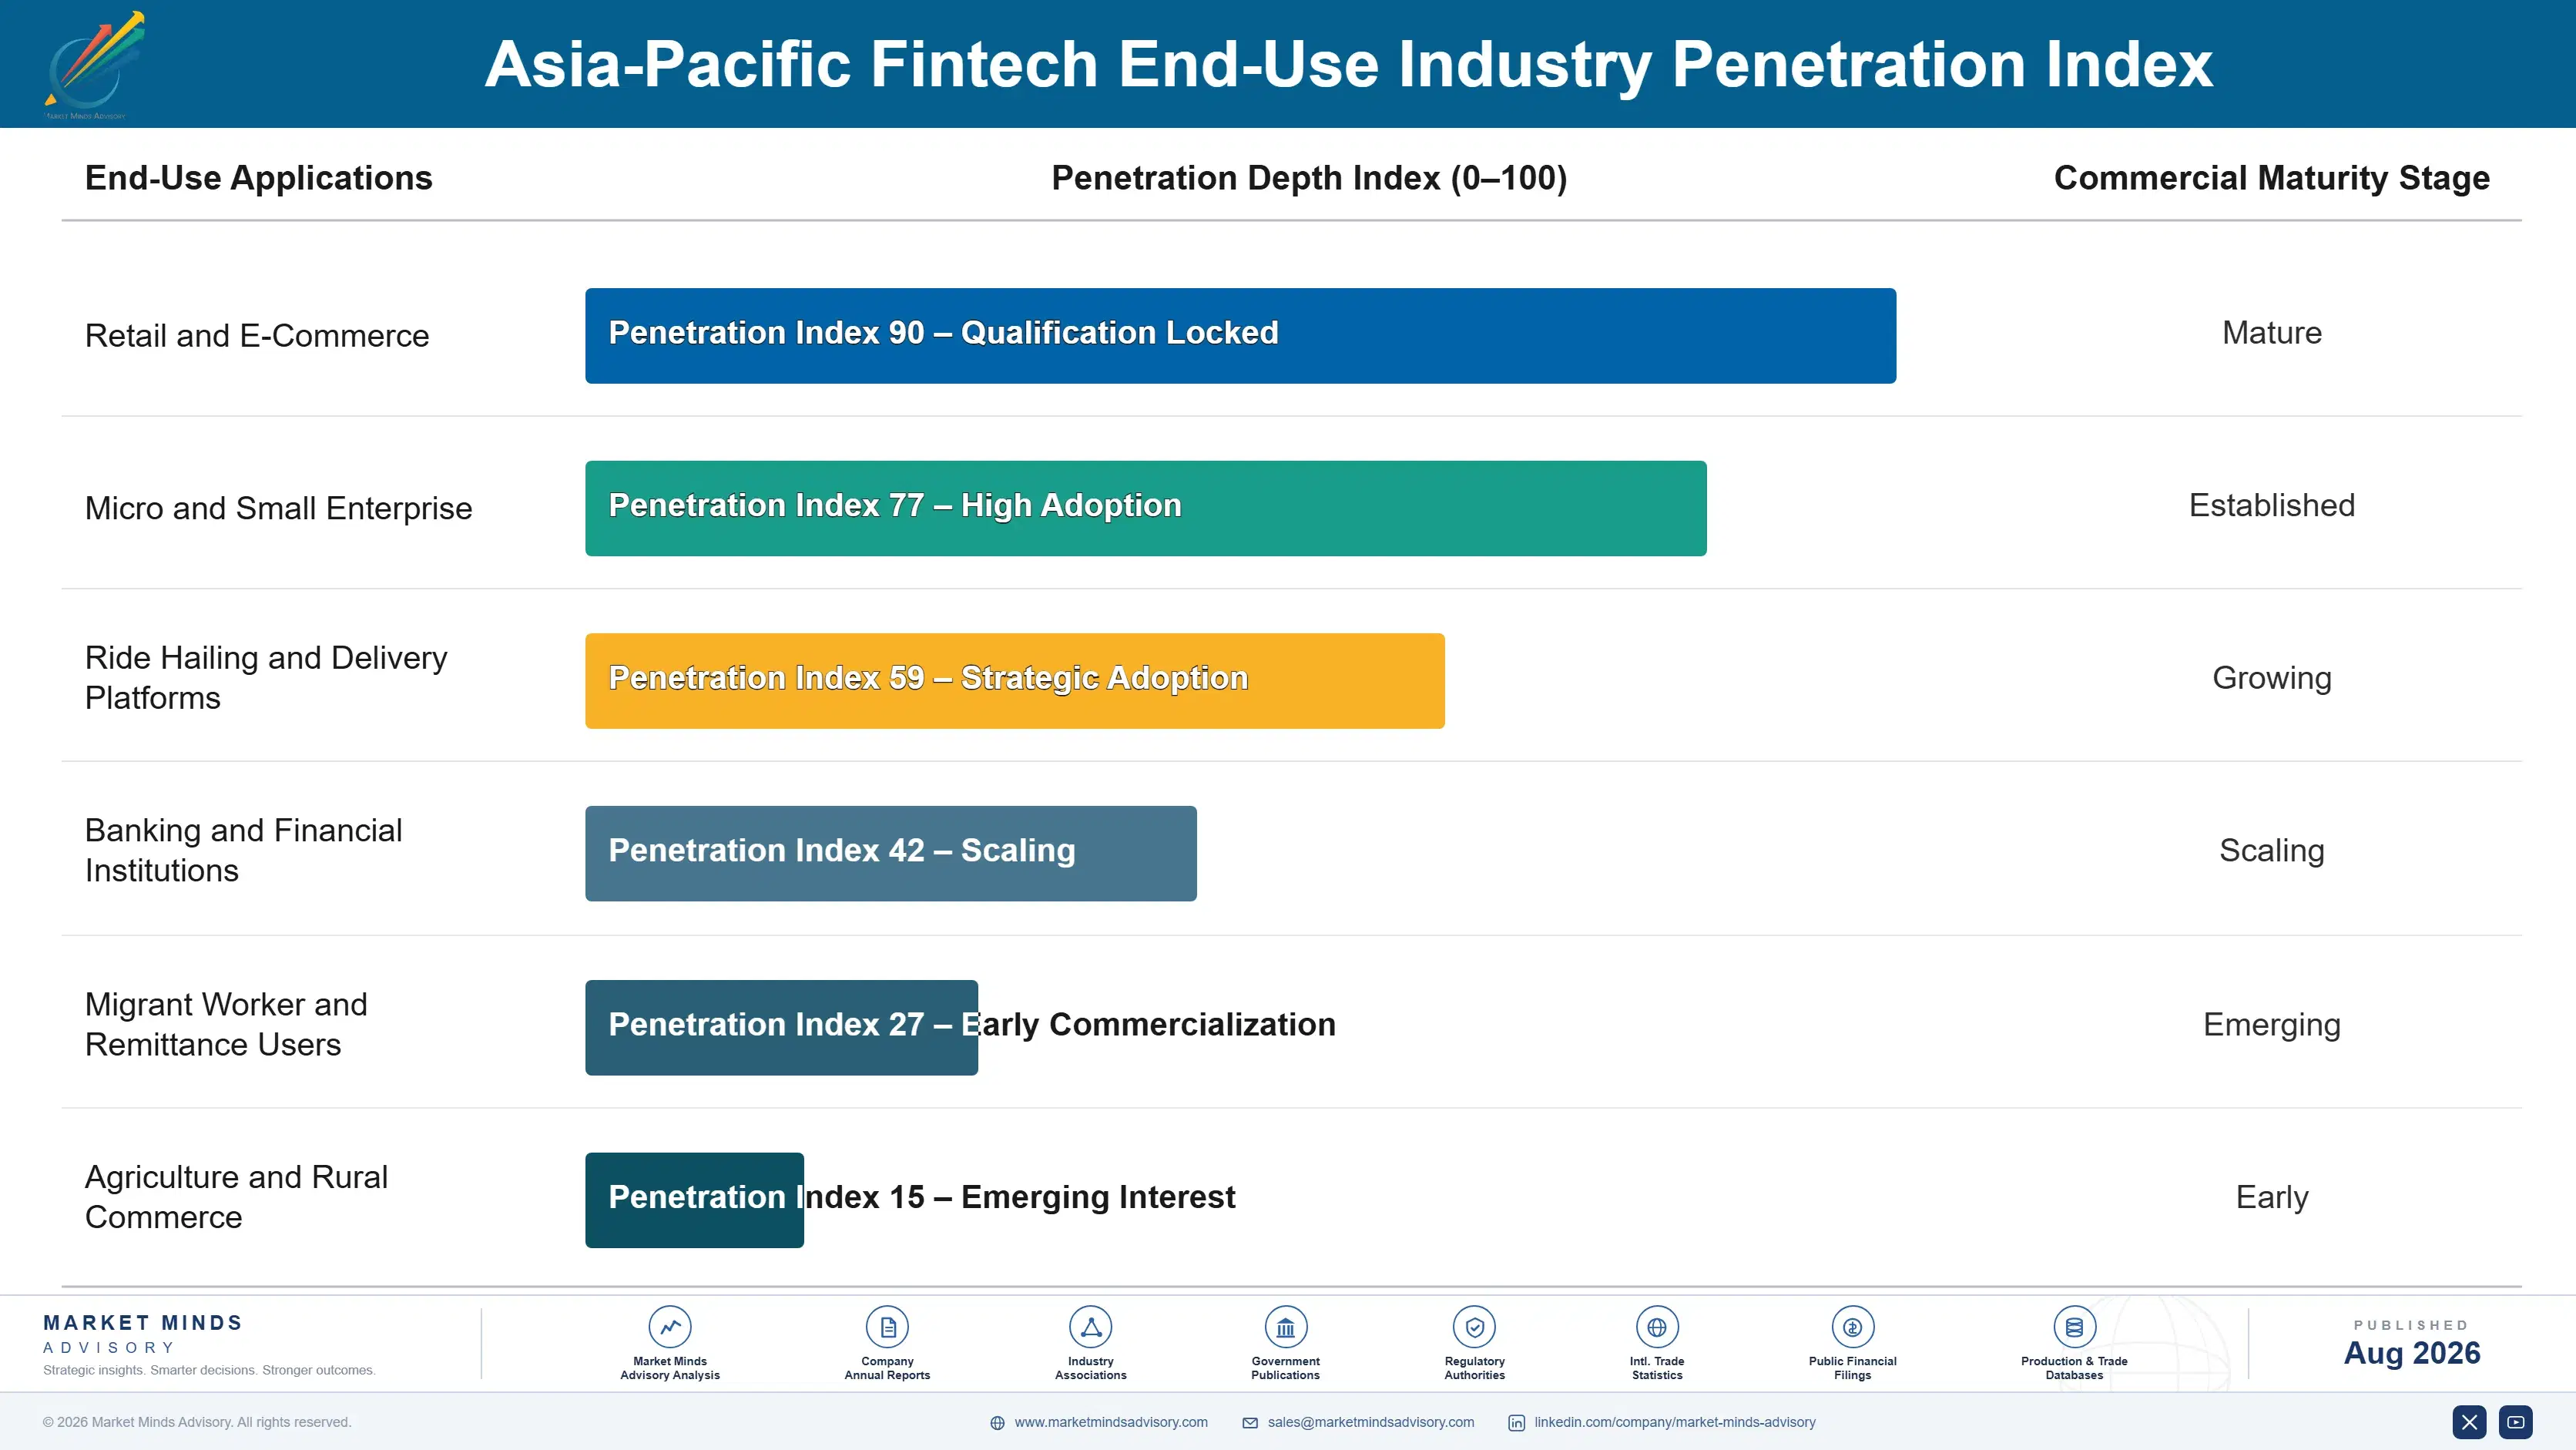
Daily Use, Annual Rules

Annuity characteristics divide sharply by product. Payment usage is genuinely habitual and recurs daily across enormous populations, and it earns nothing whatsoever by regulatory design. Lending produces revenue that ends when the loan does, requiring continuous origination to stand still. Wealth balances accumulate and compound, which is the only genuinely accumulating revenue anywhere here. Providers describing recurring revenue are usually describing recurring usage of a free service.
Stickiness follows habit rather than any contract. A payment application people open several times daily is extraordinarily sticky and monetises through what attaches to it rather than through itself. Lending relationships are weak, since borrowers refinance wherever terms are better and comparison has become straightforward. Wealth accounts stick hardest, because moving holdings involves transfer processes most small investors will not undertake.

The decision maker is the consumer and increasingly also the regulator standing behind them. Users choose within applications they already hold, largely on convenience and familiarity rather than on any comparison. Supervisors now decide what may be offered, to whom and on what risk sharing terms, which means a product can be excellent, popular and unavailable simultaneously. Firms planning around consumer demand alone are planning around half the decision.
asia-pacific-fintech-market-end-use-penetration-index-1787915983889

Lending Carries The Region

These are among the four positions where our research anticipates prominent divergence between winners and laggards over the coming forecast period. Each is grounded in the demand model, the regulatory perimeter, and the announced capacity pipeline.
01 / UNDERWRITING CAPABILITY BUILDING

Transaction history is not the same as underwriting

Lending now supplies around 46% of all category income and several large books have expanded considerably faster than the credit capability actually assessing them, which is a sequence that has resolved badly in every single market where anybody has ever attempted it. Free payment rails supply transaction history, and transaction history alone is simply not underwriting. Firms that build genuine capability before scaling survive a cycle, while those scaling first discover what they actually built halfway through one of them.
02 / CORRIDOR COST TRANSPARENCY

Senders who check reach different conclusions entirely

Average remittance corridor costs of roughly 5.8% across the region leave considerable room for anybody able to deliver the same service rather more cheaply, and senders who compare total cost including exchange rate margin reach entirely different conclusions from those comparing advertised fees alone. India grows fastest of anywhere at all at 15.2% on exactly these particular flows. Providers who still hold wide spreads behind attractive headline pricing lose precisely those accounts that actually bother to check anything at all.
03 / MARKET SELECTION DISCIPLINE

Four markets means four separate companies

Licensing, product rules, data requirements and consumer protection all differ so completely between these particular markets that any regional operation here means running parallel organisations sharing a logo and almost nothing else of any substance. The scale economies that are supposed to justify regional ambition mostly never arrive at all anywhere either. Firms that choose just three markets and operate properly in them outperform firms present in eight and genuinely competent in none of them at all in the end.
04 / SUPERVISORY CONCENTRATION RISK

One directive can end a business in a fortnight

Regulators across several markets here tend to act by directive rather than by any consultation, and their interventions have removed entire business lines within weeks rather than constraining them gradually over any period at all. Planning horizons therefore compress down to a single budget cycle as a direct result of that. Holding permissions across rather more than one jurisdiction costs real capital and management attention, and it means that no single supervisory decision can remove everything all at once anywhere.

Engagement Snapshot From the Field

A live engagement with an industry participant carrying material or product regulatory and market exposure ahead of a defining policy shift, showing how our research translates into a defensible multi-year portfolio strategy.
MARKET MINDS ADVISORY · CLIENT ENGAGEMENT SUMMARY
Asia-Pacific Fintech Producer Strategic Portfolio Review and Transition Roadmap 2026·Investment Scenario on Asia-Pacific Fintech Exposure Evaluation 2025-26
CLIENT PROFILE
A regional fintech operator running payments, lending and wealth products across four Asia-Pacific markets, with reported revenue of 260 million dollars (client-reported, unverified by MMA). Roughly 71% came from lending originated in two markets. Payment volume was substantial and earned essentially nothing, and licensing was concentrated with a single supervisor across the largest exposure of all.
STRATEGIC CHALLENGE
A supervisory directive in the largest market had restricted a lending arrangement with several weeks of notice, removing a material share of origination. Management proposed entering two additional markets to spread regulatory exposure. That added parallel operating models and licensing cost across a business already stretched, without addressing the underwriting gap or the concentration in the markets it already served.
MMA APPROACH
MMA analysed revenue and credit performance by market and product, separating originations the firm underwrote from those it arranged for partners. Twenty-six expert interviews with regulators' former staff, partner lenders, corridor operators and wealth platform executives established where capability and exposure actually sit. The analysis treated underwriting capability and licence diversification as the routes genuinely available forward.
KEY FINDINGS
  1. Credit losses on the fastest growing lending cohort were running well above the vintages preceding them, and no internal report separated cohorts by underwriting approach at all.
  2. Payment volume consumed a meaningful share of technology and support cost while generating essentially no revenue under the mandated zero charging arrangements.
  3. Wealth product servicing retained two manual steps at onboarding, which made small balance accounts unprofitable and had never once been quantified internally.
  4. Entering two further markets would have required separate licensing, separate product construction and separate compliance functions with almost no shared economics at all.
CLIENT PROFILE
A regional fintech operator running payments, lending and wealth products across four Asia-Pacific markets, with reported revenue of 260 million dollars (client-reported, unverified by MMA). Roughly 71% came from lending originated in two markets. Payment volume was substantial and earned essentially nothing, and licensing was concentrated with a single supervisor across the largest exposure of all.
STRATEGIC CHALLENGE
A supervisory directive in the largest market had restricted a lending arrangement with several weeks of notice, removing a material share of origination. Management proposed entering two additional markets to spread regulatory exposure. That added parallel operating models and licensing cost across a business already stretched, without addressing the underwriting gap or the concentration in the markets it already served.
MMA APPROACH
MMA analysed revenue and credit performance by market and product, separating originations the firm underwrote from those it arranged for partners. Twenty-six expert interviews with regulators' former staff, partner lenders, corridor operators and wealth platform executives established where capability and exposure actually sit. The analysis treated underwriting capability and licence diversification as the routes genuinely available forward.
KEY FINDINGS
  1. Credit losses on the fastest growing lending cohort were running well above the vintages preceding them, and no internal report separated cohorts by underwriting approach at all.
  2. Payment volume consumed a meaningful share of technology and support cost while generating essentially no revenue under the mandated zero charging arrangements.
  3. Wealth product servicing retained two manual steps at onboarding, which made small balance accounts unprofitable and had never once been quantified internally.
  4. Entering two further markets would have required separate licensing, separate product construction and separate compliance functions with almost no shared economics at all.
RECOMMENDED STRATEGY
Phase 1: Phase one: rebuild credit underwriting capability on the fastest growing cohort before originating any further volume in that particular segment. Phase 2: Phase two: automate the two remaining manual steps in wealth onboarding, since small balances cannot ever support any human handling. Phase 3: Phase three: pursue an additional licence in one existing market rather than entering two new ones with no shared economics.
OUTCOME
Underwriting rebuild slowed origination and improved loss rates on subsequent cohorts within two quarters (client-reported, unverified by MMA). Wealth onboarding was fully automated and small balance accounts turned profitable. A second licence application progressed in an existing market. The two-market expansion was shelved, having proposed spreading exposure by multiplying the number of organisations to run.

Frequently Asked Questions

Foundational context covering the market sizes, CAGR, scope, country, region and competition that inform every finding below. This section is provided to cover basics and most often pre-purchase conversations, answered from the MMA Primary Research Dataset.

What is the current size of the Asia-Pacific Fintech Market?

The market was worth 172.0 billion dollars in provider revenue in 2025, covering lending, wealth, cross-border, business software, insurance technology and payments. It reaches 194.70 billion dollars in 2026.

How large will the Asia-Pacific Fintech Market be by 2036?

MMA forecasts 672.71 billion dollars by 2036, an increase of 478.01 billion dollars over the 2026 base. That represents an expansion multiple of 3.46 times across the forecast period.

What is the CAGR for the Asia-Pacific Fintech Market 2026 to 2036?

The base case compounds at 13.2% annually. The bull case reaches 14.4% if regulatory frameworks stabilise, while the bear case sits at 12.0% on further directives arriving without warning.

Which segment is growing fastest?

Digital lending and credit, at 19.8%, half again the market rate of 13.2%. It supplies around 46% of income because payments were mandated free across the region.

Who are the major companies in the Asia-Pacific Fintech Market?

Ant Group, Grab Financial Group, Paytm, SeaMoney and GoTo Financial lead on disclosed fintech revenue. Concentration is only 34%, since the region contains a dozen national markets.

Which country is growing fastest?

India at 15.2%, hosting the instant rail carrying roughly 16 billion monthly transactions at a mandated merchant charge of exactly zero for absolutely everybody involved.

Report Segmentation Architecture

The full report scope spans multiple orthogonal segmentation dimensions, with cross-tabulated demand data provided for each dimension pair. Coverage extends further to regional breakdowns, trend trajectories, and the competitive detail needed to support segment-level decision-making.

By Service Line

  • Digital Lending and Credit
  • Wealth and Investment Platforms
  • Cross-Border Payments and Remittance
  • Business Financial Software and Infrastructure
  • Insurance Distribution Technology
  • Domestic Payments and Wallets

By End-Use Industry

  • Retail and E-Commerce
  • Micro and Small Enterprise
  • Ride Hailing and Delivery Platforms
  • Banking and Financial Institutions
  • Migrant Worker and Remittance Users
  • Agriculture and Rural Commerce

By Commercial Dimension

  • Superapp Embedded Distribution
  • Direct Consumer Application Acquisition
  • Bank Partnership and Co-Lending
  • Merchant Network Origination
  • Public Payment Rail Participation
  • Corridor Operator Arrangements

By Region

  • North America
  • Western Europe
  • East Asia
  • South Asia and Pacific
  • Latin America
  • Middle East and Africa
  • Eastern Europe

Scope, Methodology, and Coverage

Every figure in this report is reproducible from documented input assumptions. The scope below maps the historical period, the forecast horizon, the segmentation dimensions, and the countries covered, alongside the underlying primary and qualitative methodology.
Historical Period
2020 to 2025
Forecast Period
2026 to 2036
Base Year
2025 (USD billions; MMA Primary Research Dataset, August 2026)
Market Definition
Scope covers revenue earned by financial technology providers operating across Asia-Pacific, spanning digital lending and credit including own book and arranged origination, wealth and investment platforms, cross-border payments and remittance measured on fee and foreign exchange margin, business financial software and infrastructure supplied to enterprises and institutions, insurance distribution technology, and domestic payments and wallet services. Traditional bank net interest and fee income earned outside technology channels, securities exchange and clearing operations, insurance underwriting risk margin retained by insurers, cryptoasset trading custody or issuance, public payment infrastructure operated by central banks or state entities, and telecommunications revenue unconnected to financial services are excluded from the market size and all derived figures.
Quantitative Units
USD billions of provider revenue (current prices); transaction volumes in billions monthly; mandated merchant fee rates as percentage; lending share of revenue; remittance corridor cost as percentage of amount sent
Segmentation Dimensions
By Service Line; By End-Use Industry; By Commercial Dimension; By Region
Regions Covered
North America, Western Europe, East Asia, South Asia and Pacific, Latin America, Middle East and Africa, Eastern Europe
Countries Covered
China, India, Indonesia, Japan, South Korea, Singapore, Philippines, Vietnam, Thailand, Australia, Malaysia, Bangladesh, Pakistan, Hong Kong, New Zealand
Key Companies Profiled
Ant Group, Grab Financial Group, Paytm, SeaMoney, GoTo Financial, PhonePe, Razorpay, Pine Labs, Kredivo, Akulaku, Xendit, 2C2P, Airwallex, Nium, Wise, Zerodha, Groww, Coins.ph, Toss, WeBank
Quantitative Methodology
Primary survey, n=3,800 respondents, Q4 2025, six countries; demand-side model with trade association cross-validation
Qualitative Methodology
47 expert interviews, Q4 2025; applied to validate demand model assumptions, identify emerging dynamics, and assess competitive positioning
Report Format
PDF and XLSX data workbook (Word format preview document)
Publisher
Market Minds Advisory
Report Code
MMA-2026-TEC-301
Published
August 2026
Contact
sales@marketmindsadvisory.com | www.marketmindsadvisory.com

Purchase the full Asia-Pacific Fintech Market Report (2026 to 2036).

The full report runs to 210 pages and covers all six service lines, seven regions and 20 profiled providers in detail. It includes the complete segment CAGR set, analysis of mandated payment pricing and its effect on revenue migration, and market by market regulatory comparison across the twelve largest jurisdictions. Company profiles carry evaluation on disclosed fintech revenue across Asia-Pacific, with moat and risk assessment for the top five providers. The competitive section extends to 16 tracked regulatory, product and market developments across 2024 and 2025. Primary research inputs include a quantitative survey of 3,800 respondents and 47 expert interviews conducted in Q4 2025.
Six service lines with individual CAGR forecasts
Seven regions with domestic activity and outward exposure separated
Twenty provider profiles on consistent revenue evaluation basis
Sixteen tracked regulatory and product developments with commercial interpretation
Mandated payment pricing modelled against revenue migration into lending
Market by market regulatory comparison across twelve major jurisdictions

Built For The People Who Decide

From boardroom strategy to bench-side execution, this report is read cover-to-cover by leaders shaping the next decade of their industry, turning demand scenarios, market dynamics and valuation benchmarks into decisions.
CXOs/ Presidents/ VPs/ Managers
M&A and Corporate Development
Strategy Teams and R&D Heads
Procurement and Product Directors
Regulatory and Compliance Leaders
Investor Relations and Equity Analysts