Market Minds Advisory
Asia-Pacific Commercial Aircraft Market

Asia-Pacific Commercial Aircraft Market: Low-Cost Carrier Growth Redraws Delivery Backlogs

Regional low-cost carriers are placing record narrowbody orders faster than manufacturers can expand production, forcing airlines to lease aging aircraft or delay network expansion while backlogs stretch years beyond original delivery targets.

Lead Analyst

Published

September 2026

Make Smarter Decisions with Customized Research Insights

Request a free sample report and evaluate market opportunities, growth trends, and competitive dynamics relevant to your business needs.

2025 MARKET VALUE$42.0BMarket Size 2025
2036 FORECAST VALUE$114.0BBase Case , 2026 to 2036
CAGR 2026 TO 20369.5 %Bull 10.7% / Bear 8.3%
INCREMENTAL OPPORTUNITY$68.0BNet 10- year value creation
EXPANSION MULTIPLE2.48x2036 value over 2026 base
Strategic Levers
M&A Pipeline
Regional Outlook
Country Rankings
Competitive Intelligence
Segmental Deep-dive
Call-Us : 91 93563 13602

Executive Snapshot and Market Trajectory

The Asia-Pacific commercial aircraft industry is being reshaped by regional low-cost carriers placing record narrowbody orders faster than manufacturers can expand production, forcing airlines to lease aging aircraft or delay network expansion while delivery backlogs stretch years beyond original targets.
Sustainable aviation fuel-compatible aircraft programs are expanding fastest, growing at roughly 1.63 times the market's overall pace as regulators and airlines push for demonstrated emissions reduction credentials. Narrowbody commercial aircraft follow closely behind, driven by explosive regional low-cost carrier fleet growth. East Asia and South Asia and Pacific jointly concentrate the substantial majority of this market's revenue, reflecting the genuinely region-wide commercial aviation growth underway across the continent. Other regions contribute only modest exposure here.
Competitive intensity is rising as Boeing and Airbus, emerging Chinese domestic manufacturer COMAC, and expanding aircraft leasing companies all compete for the same constrained production capacity, while stretched supply chains and rising fuel efficiency expectations are simultaneously reshaping which manufacturers and lessors capture the most durable long-term fleet relationships. Manufacturers slow to adapt regional production and leasing strategy risk losing ground to faster-moving competitors across nearly every major delivery category.
Market Definition
This report covers the manufacture, sale, and leasing of narrowbody, widebody, and regional jet commercial aircraft operated by passenger and cargo airlines across Asia-Pacific markets, including associated cabin interior and retrofit services. It excludes military aircraft, business and general aviation aircraft, and airport ground infrastructure, which fall outside the defined platform scope.
Base Year Value
$42.0B in 2025 (MMA Primary Research Dataset, August 2026)
Forecast Period
2026 to 2036, eleven discrete annual values
CAGR
9.5% base case. Bull 10.7%. Bear 8.3%.
Fastest Growth Segment
Sustainable Aviation Fuel-Compatible Aircraft Programs: 15.5% CAGR
Fastest Growth Country
India: 12.5% CAGR
Fastest Growth Region
South Asia and Pacific: 11.5% CAGR
Largest Region
East Asia: 42% of 2025 global value
Market Leaders
Boeing, Airbus, COMAC, Embraer, ATR. Source: MMA Primary Research Dataset, July 2026.
Primary Survey
n=3,800 procurement and R&D decision-makers, Q4 2025, six countries
Methodology
Demand-side build-up, cross-validated against public data, 47 expert interviews

Asia-Pacific Commercial Aircraft Market Forecast Scenarios

asia-pacific-commercial-aircraft-market-size-forecast-scenario-1787982383318
Asia-Pacific commercial aircraft market revenue grew at an estimated 8.2 percent historical pace between 2020 and 2025, propelled by post-pandemic aviation traffic recovery and rapid regional low-cost carrier fleet expansion. Momentum was uneven, though, as pandemic-era fleet groundings briefly suppressed new aircraft demand before recovering fully by 2023. Several regional carriers also placed substantial new aircraft orders during this same period.
The base case assumes 9.5 percent annual growth through 2036, driven by three commercial mechanisms. First, expanding regional middle-class travel demand is mechanically increasing total aircraft order volume across low-cost and full-service carriers. Second, sustainable aviation fuel-compatible aircraft programs are attracting substantial new investment as airlines seek to demonstrate emissions reduction credentials. Third, COMAC's emerging domestic manufacturing program is adding new production capacity and expanding total addressable delivery volume across the region.
The bull case centers on faster-than-expected regional commercial aviation traffic growth expanding order backlogs well beyond current projections. The bear case centers on prolonged supply chain constraints limiting new aircraft delivery rates, which could meaningfully slow revenue growth across the newest aircraft platform generations specifically. Either scenario depends heavily on how quickly manufacturer production capacity expands over the coming years.

Order Backlogs Redraw Regional Fleet Planning

The Asia-Pacific commercial aircraft industry sits at an unusual point where explosive travel demand growth and constrained manufacturer production capacity are colliding directly. Regional low-cost carriers placing record orders faster than manufacturers can deliver is the single largest determinant of how airlines plan fleet expansion across the region today. Airlines that misjudge this backlog risk missing critical route launch windows to better-positioned competitors with earlier delivery slots.
MARKET CONCENTRATION (CR5)72%Top five manufacturers hold well over half combined
AVERAGE ORDER BACKLOG LENGTH6.5 yearsTypical wait time between order placement and delivery
LOW-COST CARRIER FLEET SHARE44%Regional commercial fleet now operated by budget carriers
LEASED AIRCRAFT SHARE48%Regional fleet now financed through operating lease arrangements
SUSTAINABLE FUEL COMPATIBILITY RATE38%New deliveries now certified for high-blend sustainable fuel
DOMESTIC MANUFACTURER DELIVERY SHARE9%Regional deliveries now sourced from non-legacy domestic manufacturers
Beneath the backlog story, the industry is absorbing genuine leasing market transformation. Aircraft leasing companies are capturing a growing share of regional fleet financing as airlines increasingly prefer operating leases over direct ownership, letting carriers scale fleets flexibly without committing substantial capital during a period of constrained delivery timelines. Lessors slower to build comparable flexible financing structures risk losing this expanding customer base to more accommodating competitors.
Distribution economics are shifting too. COMAC's emerging domestic manufacturing program is steadily capturing Chinese domestic orders that Boeing and Airbus once claimed by default. Manufacturers slower to expand regional production capacity risk losing meaningful order volume to this newer domestic competitor entirely. Manufacturers offering more competitive regional production timelines are converting this competitive pressure into genuine long-term order wins.
"Every airline talks about fleet modernization, but the ones actually growing profitably are the ones who locked in delivery slots years ago, not the ones still waiting in line behind carriers who ordered earlier."
Director, Asia-Pacific Commercial Aviation Practice · MMA Construction and Industrial Equipment Practice · August 2026

Market Trends

Order Backlogs Stretch Years Beyond Original Targets

Regional low-cost carriers across Vietnam, Indonesia, and India continue placing record narrowbody aircraft orders faster than Boeing and Airbus can expand production capacity, pushing delivery backlogs to multi-year lengths that force airlines to reconsider network expansion timelines. This backlog pressure has become a genuine strategic constraint for carriers competing for market share, since delivery slot availability increasingly determines which airlines can actually execute planned route expansion rather than simply announcing ambitious growth targets. Manufacturers unable to expand production capacity meaningfully risk losing order volume to COMAC's emerging domestic alternative, particularly among price-sensitive Chinese domestic carriers.
Market Impact: Adds 10% order volume growth annually
Leasing Companies Capture Growing Fleet Financing Share

Aircraft leasing companies are capturing a growing share of regional fleet financing as airlines increasingly prefer operating leases over direct ownership, letting carriers scale fleets flexibly without committing substantial capital during a period of constrained delivery timelines and volatile fuel costs. BOC Aviation and AerCap have both expanded dedicated Asia-Pacific leasing operations specifically to capture this growing financing category, recognizing that leasing relationships increasingly deliver more predictable, durable revenue than manufacturers' one-time aircraft sales alone. This concentration creates genuine pricing power for established lessors even as smaller regional financing companies expand narrowbody portfolio offerings elsewhere across the market.
Market Impact: Adds 7% widebody demand growth annually

Market Opportunities and Growth Drivers

Rising Middle-Class Travel Demand Expands Order Volume

Continued expansion of the region's middle-class population is steadily increasing demand for affordable air travel across low-cost and full-service carriers alike, mechanically increasing the installed commercial fleet base required to serve this growing passenger volume. This demand growth represents genuine incremental order volume that compounds over time as each new aircraft delivered generates recurring service revenue for manufacturers and lessors across decades of subsequent operational service life within the region. Manufacturers with strong existing relationships in these fast-growing markets are capturing this durable demand more efficiently than competitors entering later in the cycle.
Market Impact: Delays deliveries by 18 months average

Expanding Route Networks Drive Widebody Demand

Regional carriers expanding long-haul international route networks are directly increasing demand for widebody aircraft capable of serving these longer routes profitably, a category that carries meaningfully higher per-unit value than narrowbody aircraft serving shorter domestic routes. This widebody expansion represents genuine incremental demand beyond narrowbody fleet growth, since new long-haul route launches typically require dedicated widebody aircraft that did not previously exist within these expanding carrier fleets. Manufacturers with strong widebody production capacity are capturing this expanding demand more effectively than competitors focused purely on narrowbody platforms alone. This favors manufacturers investing early in widebody production over capacity-constrained rivals.
Market Impact: Cuts margin 6 points

Market Restraints and Challenges

Constrained Production Capacity Extends Delivery Timelines

Boeing and Airbus continue struggling to expand narrowbody production capacity fast enough to meet record regional order volume, creating genuine delivery bottlenecks that extend airline fleet planning timelines considerably beyond original targets. The root cause is genuine supply chain complexity in scaling production rates for increasingly sophisticated aircraft systems across a global supplier base. The commercial impact delays revenue recognition for manufacturers and complicates network planning for airlines. Manufacturers are mitigating this through expanded final assembly line investment and supplier capacity development programs. Airlines increasingly build contingency network plans specifically to account for these recurring delivery slippage patterns.
Market Impact: Extends backlogs to 6.5 years average

Rising Fuel Costs Pressure Airline Aircraft Selection Decisions

Volatile jet fuel costs continue pressuring airline operating margins, pushing carriers to prioritize fuel-efficient aircraft selection even when this means accepting longer delivery timelines for newer, more efficient platform generations rather than accepting faster delivery of older, less efficient alternatives. The root cause is genuine fuel price volatility tied to broader global energy market conditions beyond any single airline's control. The commercial impact compresses margins for carriers unable to secure fuel-efficient aircraft quickly. Airlines are mitigating this through fuel hedging programs and interim leasing of efficient used aircraft. Airlines with fuel hedging programs weather these pressures more effectively.
Market Impact: Grows leased fleet share to 48%
3 additional market trends, 2 additional growth drivers, and 3 additional restraints and challenges are covered in the full report. Contact sales@marketmindsadvisory.com to access the complete intelligence.

Segment CAGR and Growth Architecture

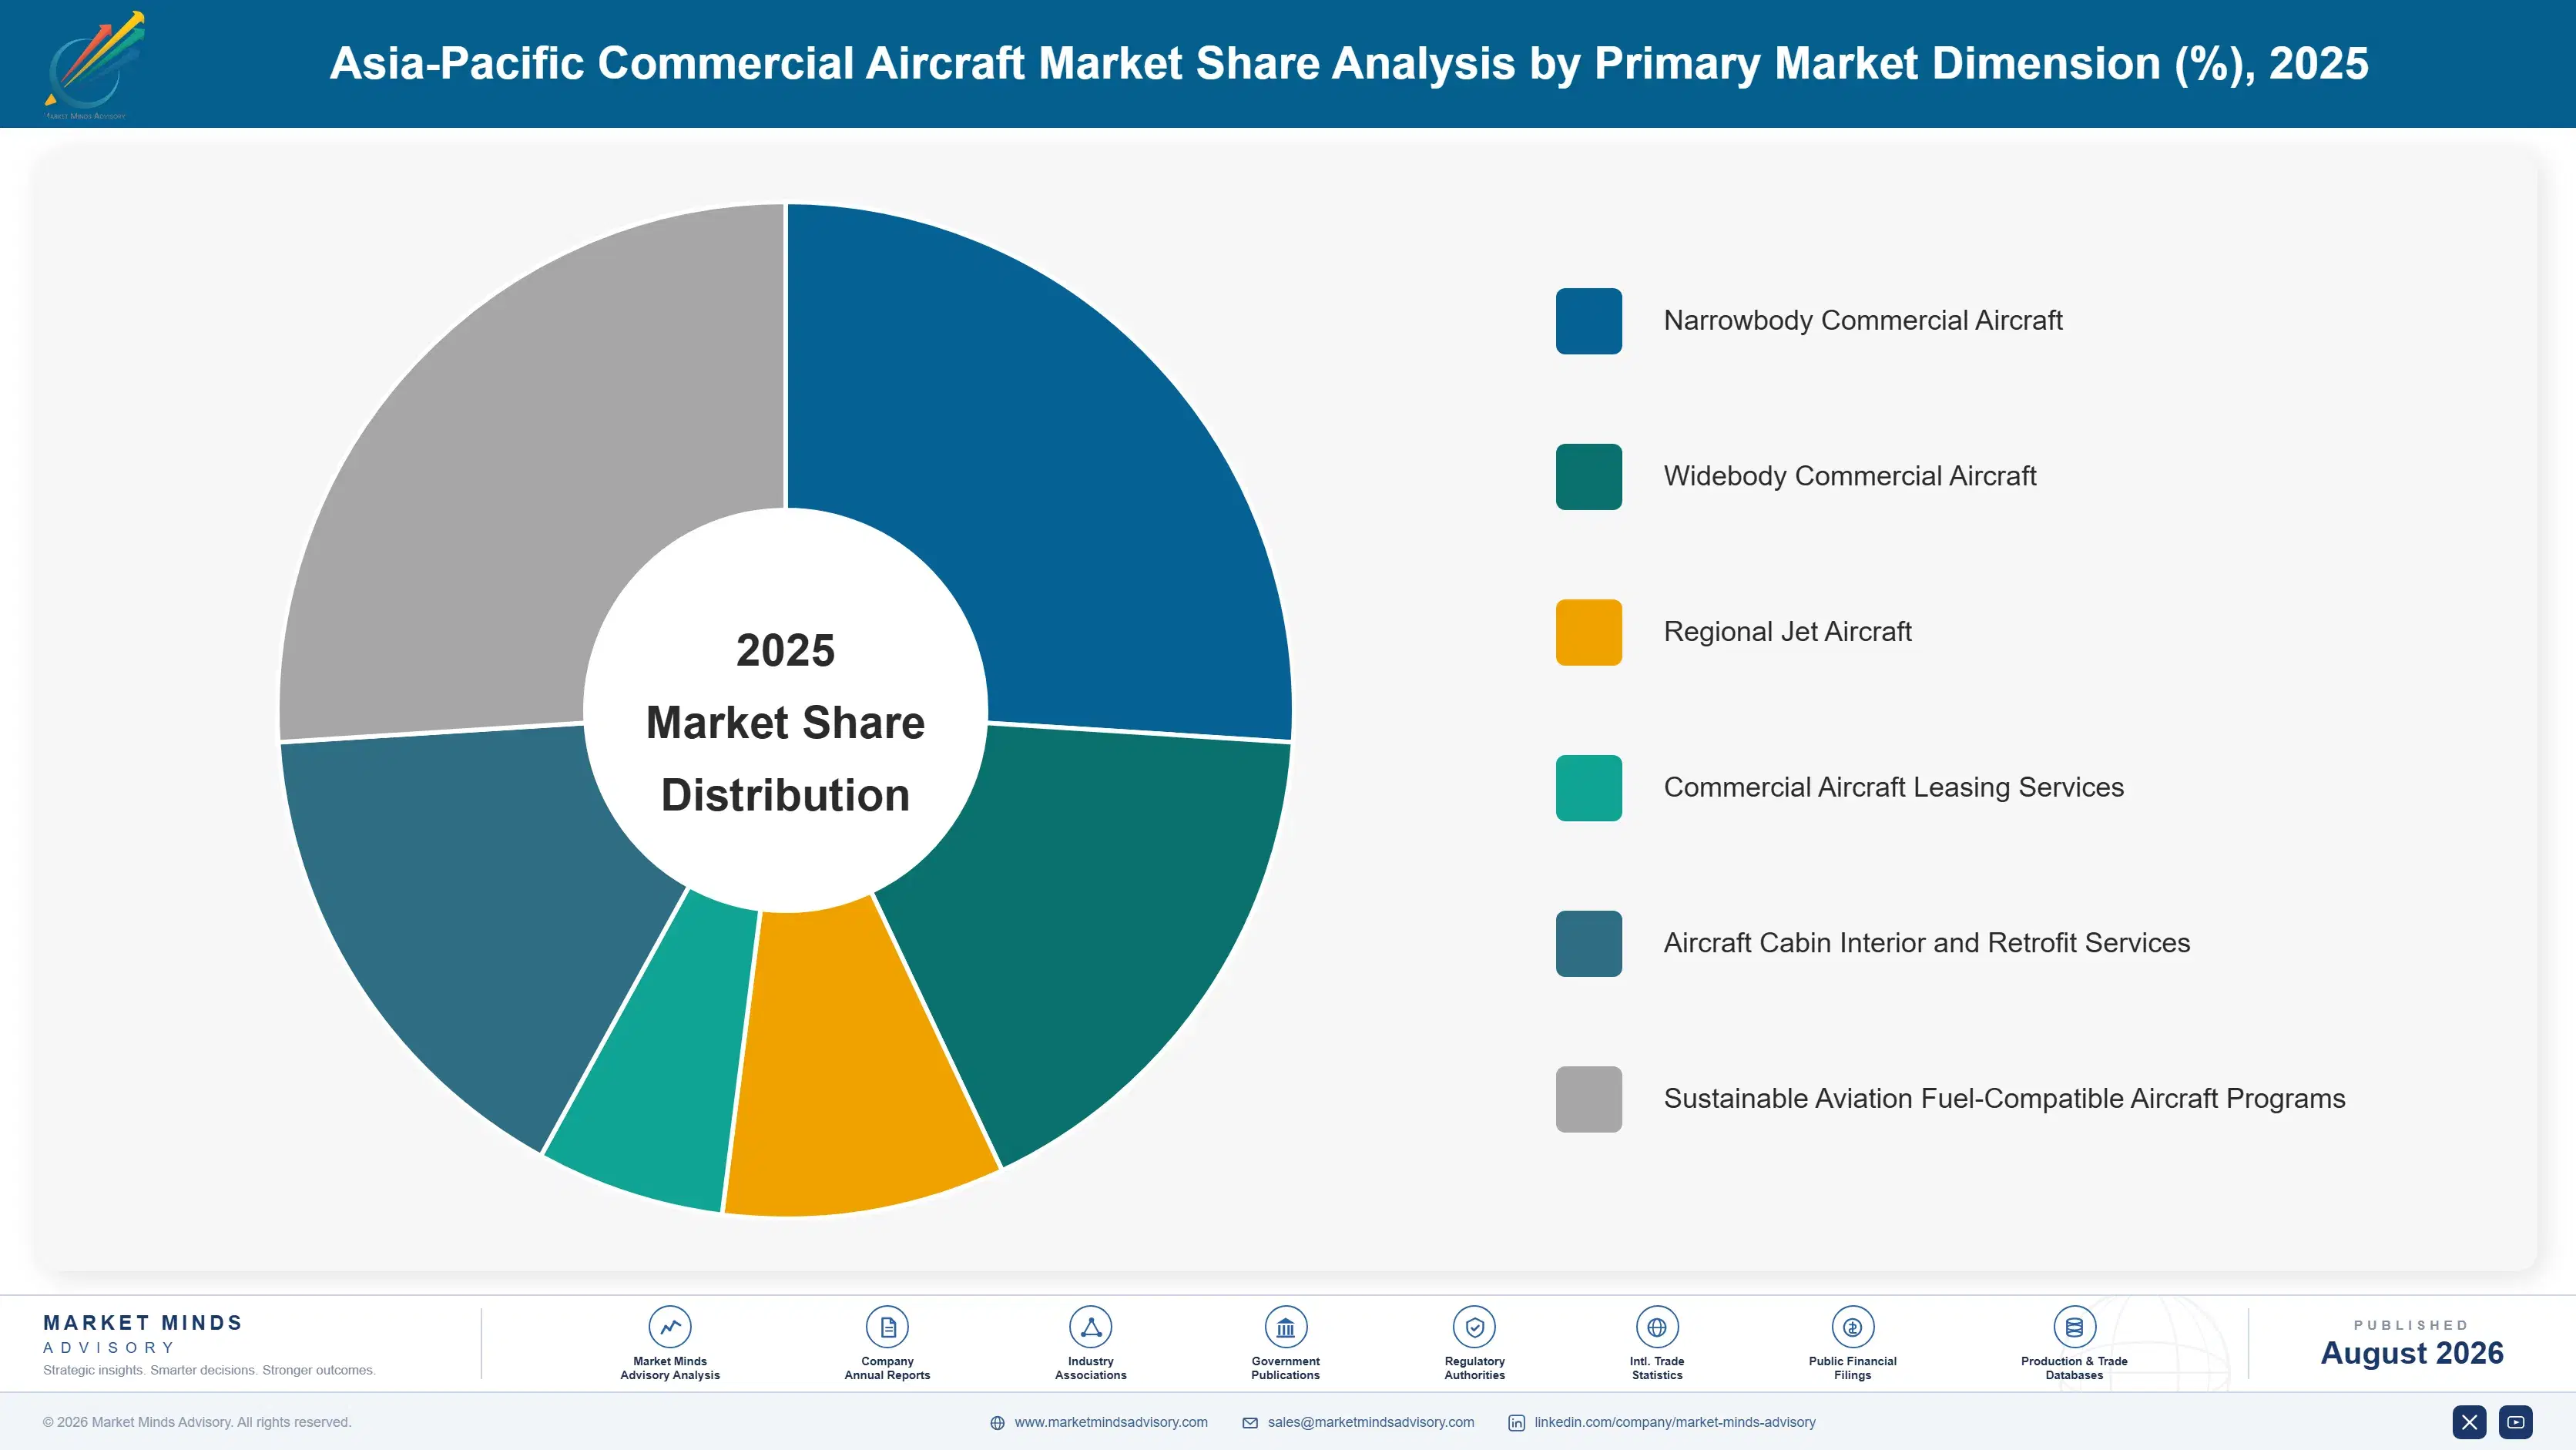
The Asia-Pacific commercial aircraft market segments most usefully by platform category and commercial structure, spanning narrowbody, widebody, regional jet, leasing, retrofit, and sustainable fuel-compatible categories, rather than by manufacturer nationality or customer country alone. This lens keeps upstream platform manufacturing distinct from downstream leasing, retrofit, and sustainable fuel program innovations entirely, consistently, and clearly.
asia-pacific-commercial-aircraft-market-market-share-analysis-1787982383850

Sustainable Aviation Fuel-Compatible Aircraft Programs

Sustainable aviation fuel-compatible aircraft programs are growing fastest, expanding at roughly 1.63 times the market's overall pace as regulators and airlines push for demonstrated emissions reduction credentials ahead of tightening environmental requirements across major aviation markets. Boeing and Airbus have both expanded dedicated sustainable fuel certification programs specifically to demonstrate technology leadership to airline customers increasingly under pressure from their own corporate emissions reduction commitments. This segment attracts substantial new investment even though commercial revenue remains comparatively modest today relative to legacy platforms, since manufacturers view early positioning as essential to capturing future fleet replacement cycles once environmental certification requirements become binding across major Asia-Pacific aviation markets specifically. Manufacturers without demonstrated compatibility risk losing this category to earlier movers.
CAGR 15.5%

Narrowbody Commercial Aircraft

Narrowbody commercial aircraft form the second-fastest growing segment, propelled by explosive regional low-cost carrier fleet growth across Vietnam, Indonesia, India, and the Philippines serving expanding domestic and short-haul international travel demand. Boeing's 737 MAX and Airbus's A320neo families dominate regional narrowbody orders given their fuel efficiency and established operator familiarity across the region's largest carriers. COMAC's emerging domestic narrowbody program is gradually capturing Chinese domestic orders that Boeing and Airbus once claimed by default, though Western manufacturers still supply the substantial majority of regional narrowbody deliveries given superior production track records and established maintenance support networks across the region. Manufacturers without regional production presence increasingly cede this expanding order category to better-positioned domestic and international competitors.
CAGR 11.0%
Full segment breakdown across 6 segments available in the complete report.

Regional Architecture and Country Demand Map

East Asia and South Asia and Pacific jointly concentrate the substantial majority of this market's activity, reflecting the genuinely region-wide Asia-Pacific scope of this report. No single country dominates the way a narrower national market would. Every other region reflects only manufacturer headquarters or leasing capital exposure.

East Asia

East Asia's 42% share sits well above the standard 22 to 30% band, and the deviation is intentional: this report is explicitly scoped to Asia-Pacific, and East Asia hosts China's enormous and rapidly expanding domestic commercial aviation market alongside Japan and South Korea's mature carrier fleets. China's domestic aviation market alone, anchored by expanding carriers like China Southern and China Eastern, represents enormous scale given the country's population and growing middle-class travel demand. COMAC's emerging domestic manufacturing program adds a genuinely distinct regional dynamic not present elsewhere. The region's growth rate sits modestly above the overall market average, reflecting continued fleet expansion even as delivery constraints affect order timing across the region.
Share: 42% | CAGR: 10.5% (2026 to 2036)

South Asia and Pacific

South Asia and Pacific's 38% share sits far above the standard 7 to 12% band, and the deviation is intentional for the same scope reason: this market is genuinely Asia-Pacific-wide, and this region hosts Southeast Asia's explosively growing low-cost carrier markets across Indonesia, Vietnam, and the Philippines alongside India's rapidly expanding domestic aviation sector. IndiGo and Air India's substantial order backlogs anchor much of this volume, alongside VietJet and Lion Air Group's aggressive regional expansion. India shows the fastest growth within the region as domestic aviation penetration continues rising from a genuinely low base relative to the country's enormous population, while Australia contributes a smaller, more mature segment to the broader regional total.
Share: 38% | CAGR: 11.5% (2026 to 2036)
Regional intelligence for 5 additional markets available in the complete report: North America, Western Europe, Middle East and Africa, Latin America, Eastern Europe. Contact sales@marketmindsadvisory.com.
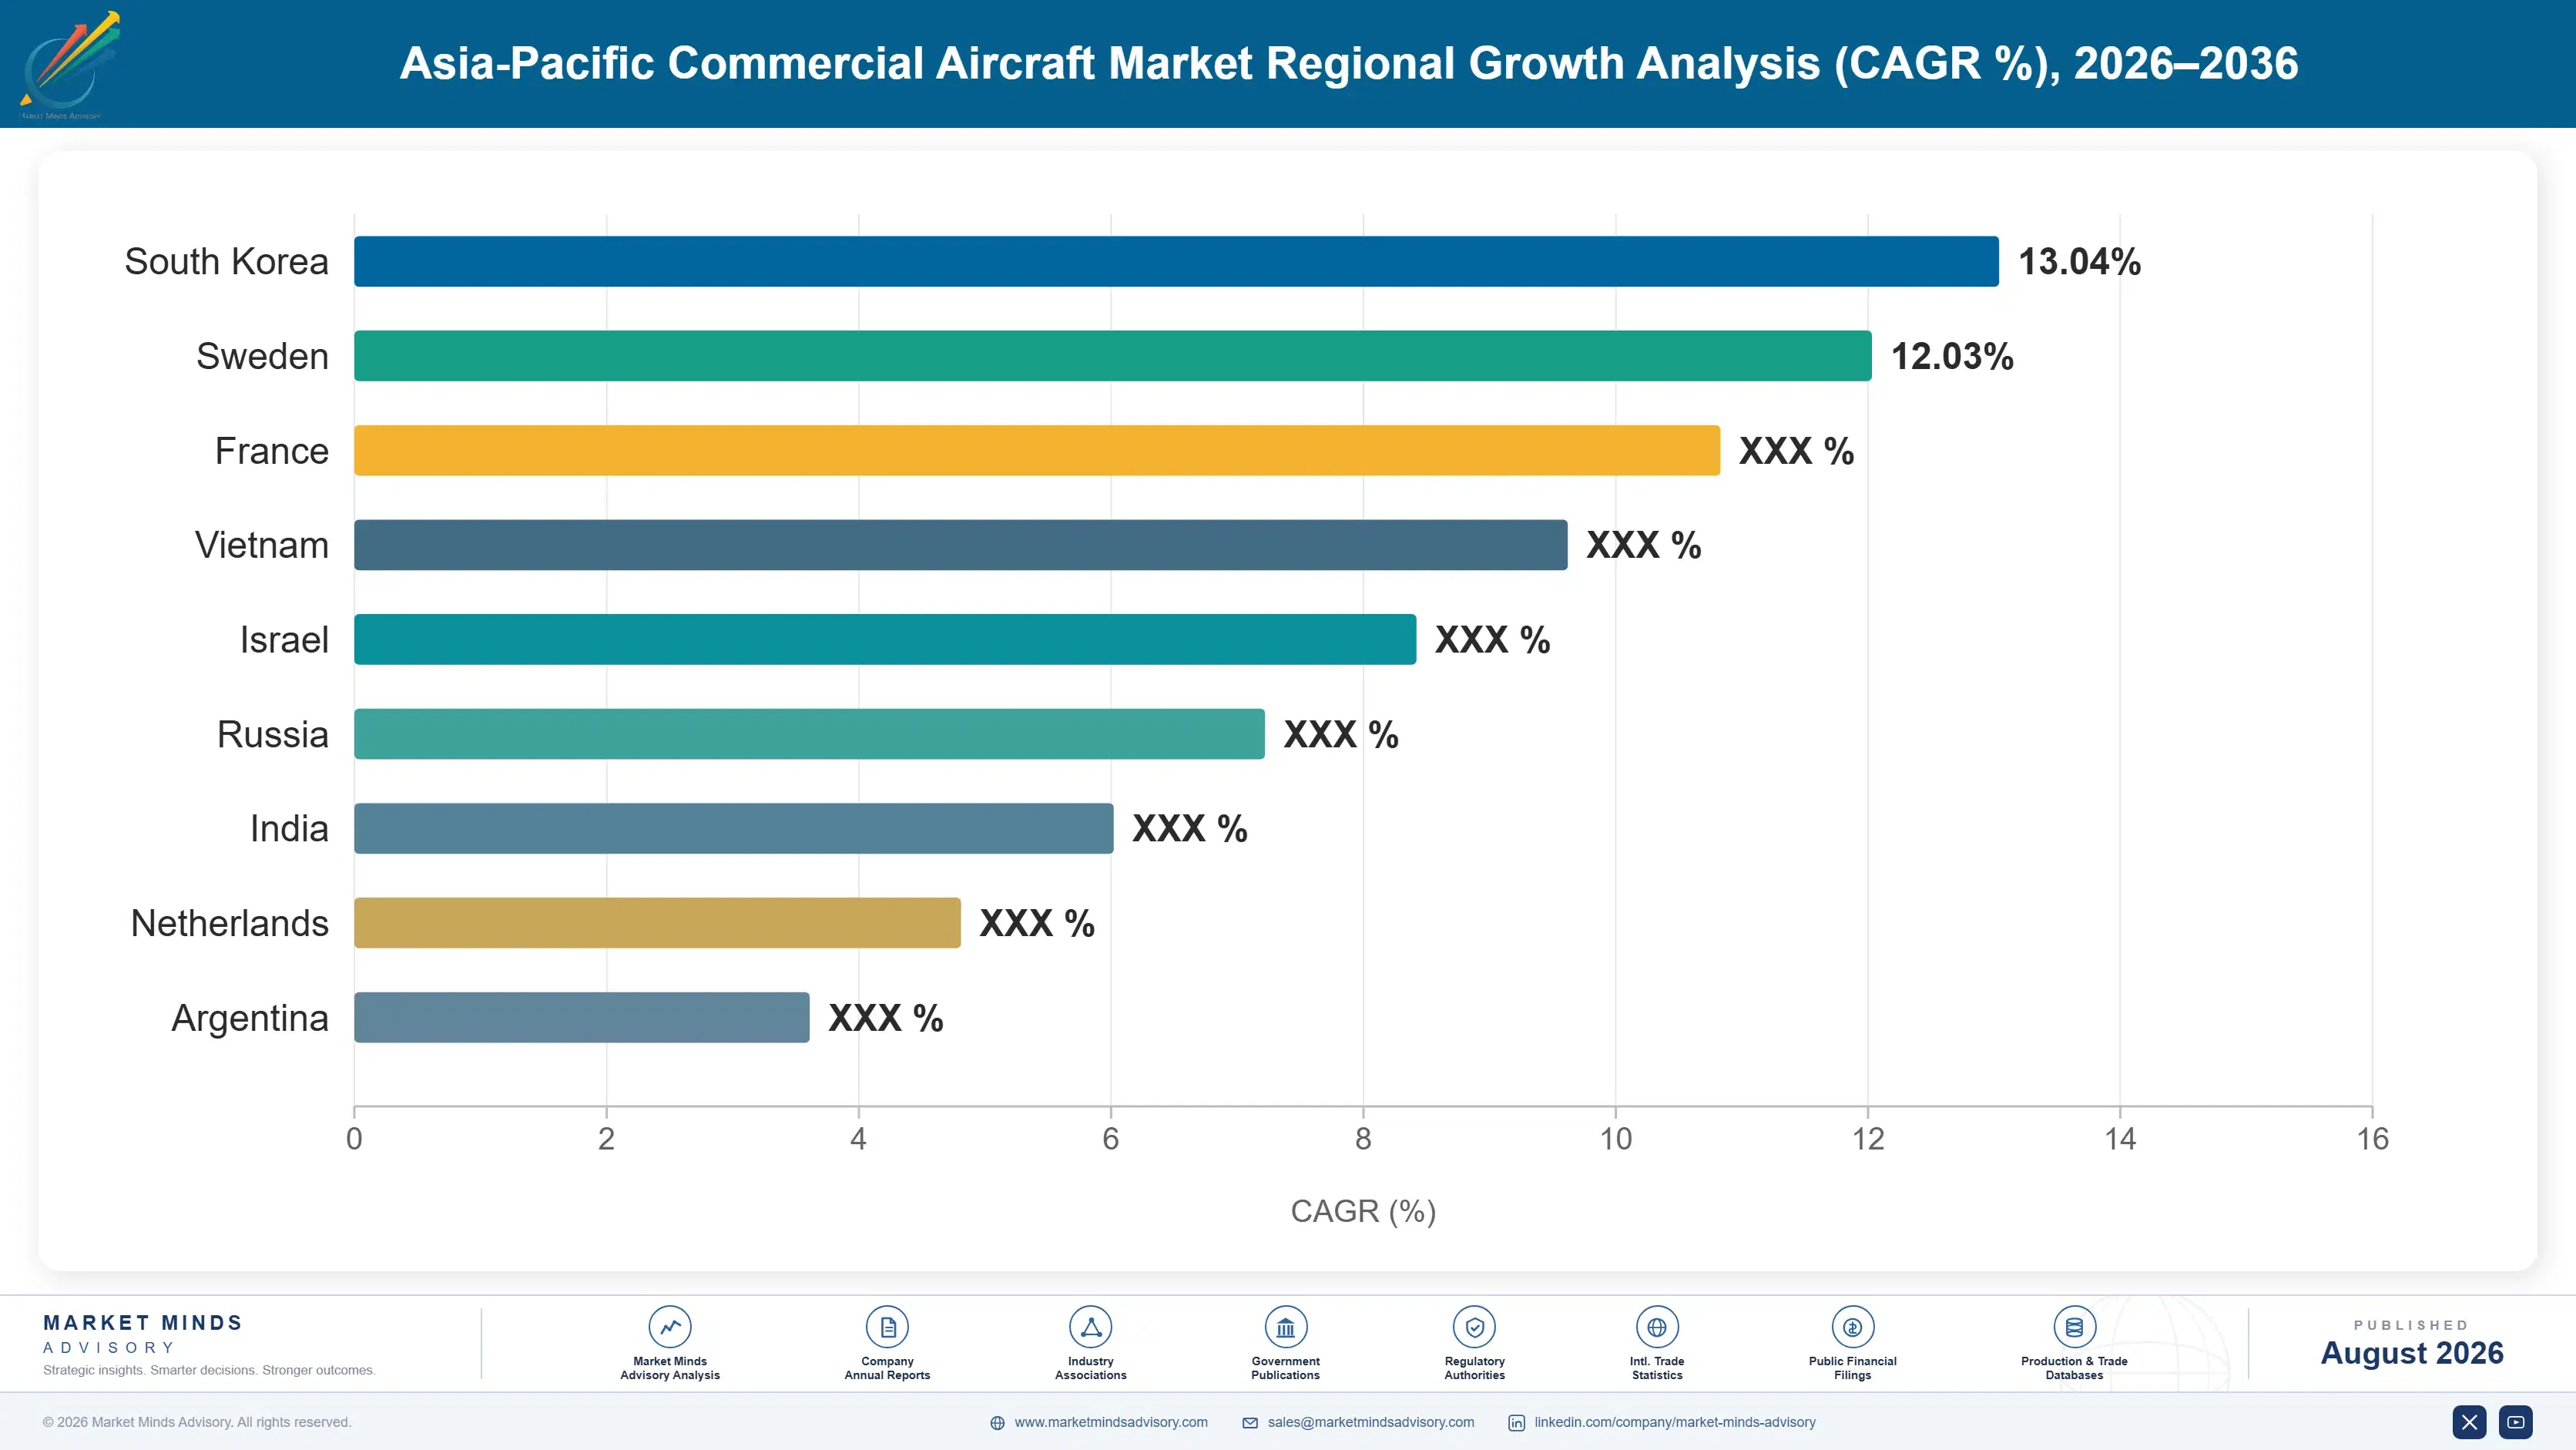
asia-pacific-commercial-aircraft-market-country-cagr-analysis-1787982384364

Capturing Value Beyond Standard Order Books

Revenue growth for Asia-Pacific commercial aircraft manufacturers and lessors increasingly depends on capturing value beyond standard order books, since constrained production capacity limits how much additional revenue new aircraft sales alone can generate in the near term. Manufacturers and lessors that recognize this dynamic early are repositioning strategies around regional capacity and flexible financing rather than pure order volume.

Expanding Regional Final Assembly Capacity Early

Manufacturers that expanded regional final assembly capacity ahead of competitors are capturing delivery slot priority that constrained global production capacity cannot otherwise provide. Airbus's expanded Asia-Pacific final assembly presence has reportedly cut delivery timelines by 20 to 25 percent compared with orders routed entirely through European production lines. This approach converts a former capacity constraint into a genuine competitive advantage for manufacturers willing to invest in regional production infrastructure early. This capability increasingly separates manufacturers gaining share from those losing ground on constrained centralized production alone. Manufacturers without comparable regional capacity increasingly cede delivery priority to earlier movers.
Market Impact: Cuts delivery timelines by 20 to 25 percent

Building Flexible Leasing Portfolio Structures Early

Leasing companies that built flexible portfolio structures spanning multiple aircraft types and lease terms are capturing airline customers seeking fleet flexibility during a period of constrained direct manufacturer delivery. BOC Aviation's flexible leasing structures reportedly capture 15 to 20 percent more fleet financing volume than lessors offering only rigid, standardized lease terms. This flexibility increasingly determines which lessors win the largest regional carrier fleet financing relationships. This flexibility increasingly determines which lessors win the region's most valuable carrier fleet financing relationships. Lessors without comparable flexibility increasingly cede this expanding customer base to more accommodating rivals.
Market Impact: Captures 15 to 20 percent more financing volume

Certifying Sustainable Fuel Compatibility Early On

Manufacturers that certified sustainable aviation fuel compatibility ahead of competitors are capturing airline customer preference among carriers with binding corporate emissions reduction commitments. Early movers reportedly win 18 to 22 percent more competitive selection processes among airlines prioritizing demonstrated sustainability credentials. This early investment increasingly determines which manufacturers win fleet-wide selection decisions as sustainability criteria weigh more heavily in airline procurement processes overall. This early investment increasingly determines which manufacturers win the region's most valuable fleet-wide selection decisions. Manufacturers without comparable certification increasingly cede this growing preference segment to better-positioned rivals.
Market Impact: Wins 18 to 22 percent more airline selections

Who Controls the Margin Pool

The Asia-Pacific commercial aircraft market is highly concentrated, with a CR5 of 72 percent on a revenue basis held across Boeing, Airbus, COMAC, Embraer, and ATR. Boeing and Airbus lead given their duopoly position in narrowbody and widebody categories, while COMAC is steadily expanding its domestic Chinese market presence and Embraer and ATR compete specifically within the regional jet category.
Current competitive activity centers on regional final assembly capacity expansion, flexible leasing portfolio development, and sustainable fuel certification investment. Manufacturers are also racing to secure production capacity commitments from suppliers as delivery rates continue running behind original program planning targets. Manufacturers are also pursuing selective supplier co-investment partnerships to expand production capacity without proportionally expanding standalone capital investment across every facility.

Emerging pressure comes from two directions. COMAC's domestic manufacturing program is expanding steadily to reduce China's reliance on Western aircraft for future domestic fleet growth, while aircraft leasing companies continue capturing a growing share of fleet financing that traditional direct manufacturer sales once dominated by default. Manufacturers unable to demonstrate reliable delivery performance risk losing airline confidence entirely, ceding future order opportunities to competitors with stronger production track records.
asia-pacific-commercial-aircraft-market-company-positioning-matrix-1787982384886

Competitive Moat and Risk Dimensions

BOEING

Moat: Deepest Regional Narrowbody Installed Base

Boeing benefits from the largest installed narrowbody fleet base across Asia-Pacific carriers, giving it deep aftermarket parts and maintenance relationships that competitors with smaller regional installed bases cannot easily replicate across comparable customer volume. Competitors with smaller regional installed bases struggle to match this comprehensive service depth and long-established carrier relationship reach.
BOEING

Risk: Production Delay Reputation Risk

Boeing's recent production quality and delivery delay issues have created reputational headwinds that could push price-sensitive Asia-Pacific carriers toward Airbus or COMAC alternatives more readily than in prior competitive cycles. This reputational exposure becomes more pronounced as Airbus and COMAC improve their own delivery reliability and production quality reputation over time.
AIRBUS

Moat: Strongest Regional Delivery Execution

Airbus benefits from generally stronger recent delivery execution and expanded regional final assembly presence, giving it a meaningful competitive advantage in winning order commitments from carriers prioritizing predictable delivery timelines. This execution advantage increasingly determines which manufacturer wins order commitments from carriers prioritizing predictable capacity growth.
AIRBUS

Risk: Exposure To COMAC Domestic Competition

Airbus faces growing long-term competitive risk from COMAC's domestic Chinese manufacturing program, which benefits from government industrial policy support that foreign manufacturers cannot access within the Chinese domestic market specifically. This long-term risk becomes more pronounced as COMAC continues expanding its own domestic production capacity and improving reliability.

Players Tracked

Prominent Players

Boeing
Airbus
COMAC
Embraer
ATR

Other Key Players

AVIC
Xi'an Aircraft
Irkut Corporation
BOC Aviation
AerCap
Avolon
SMBC Aviation Capital
Air Lease Corporation
CDB Aviation
ICBC Leasing
Nordic Aviation Capital
Mitsubishi Heavy Industries
Bombardier
Sukhoi
Hindustan Aeronautics Limited

Recent Developments

FEBRUARY 2026

Airbus Expands Asia-Pacific Final Assembly Line Capacity

Airbus expanded final assembly line capacity at its regional facility, adding production capability targeting the growing backlog of narrowbody orders from Southeast Asian and Indian low-cost carriers. The expansion reflects confidence that regional production capacity delivers meaningfully faster delivery timelines than centralized manufacturing. Early results show improved delivery timelines already.
Signal: Signals leading manufacturers are now formally prioritizing regional production capacity investment across every single major market
DECEMBER 2025

BOC Aviation Expands Flexible Leasing Portfolio

BOC Aviation expanded its flexible leasing portfolio structure to include additional aircraft types and shorter-term lease options, responding to growing airline demand for fleet flexibility during a period of constrained direct manufacturer delivery availability. The expansion reflects growing recognition that flexible financing structures increasingly determine carrier lessor selection decisions.
Signal: Signals leasing companies are now capturing a growing share of regional fleet financing decisions more broadly
SEPTEMBER 2025

COMAC Secures Additional Domestic Order Commitment

COMAC secured an additional domestic order commitment from a major Chinese carrier, expanding its presence in a market previously served almost exclusively by Boeing and Airbus, reflecting improving production reliability. The order win reinforces COMAC's strengthening position within its home market against established Western alternatives.
Signal: Signals domestic Chinese manufacturing programs are now expanding steadily into commercial aviation markets even more broadly

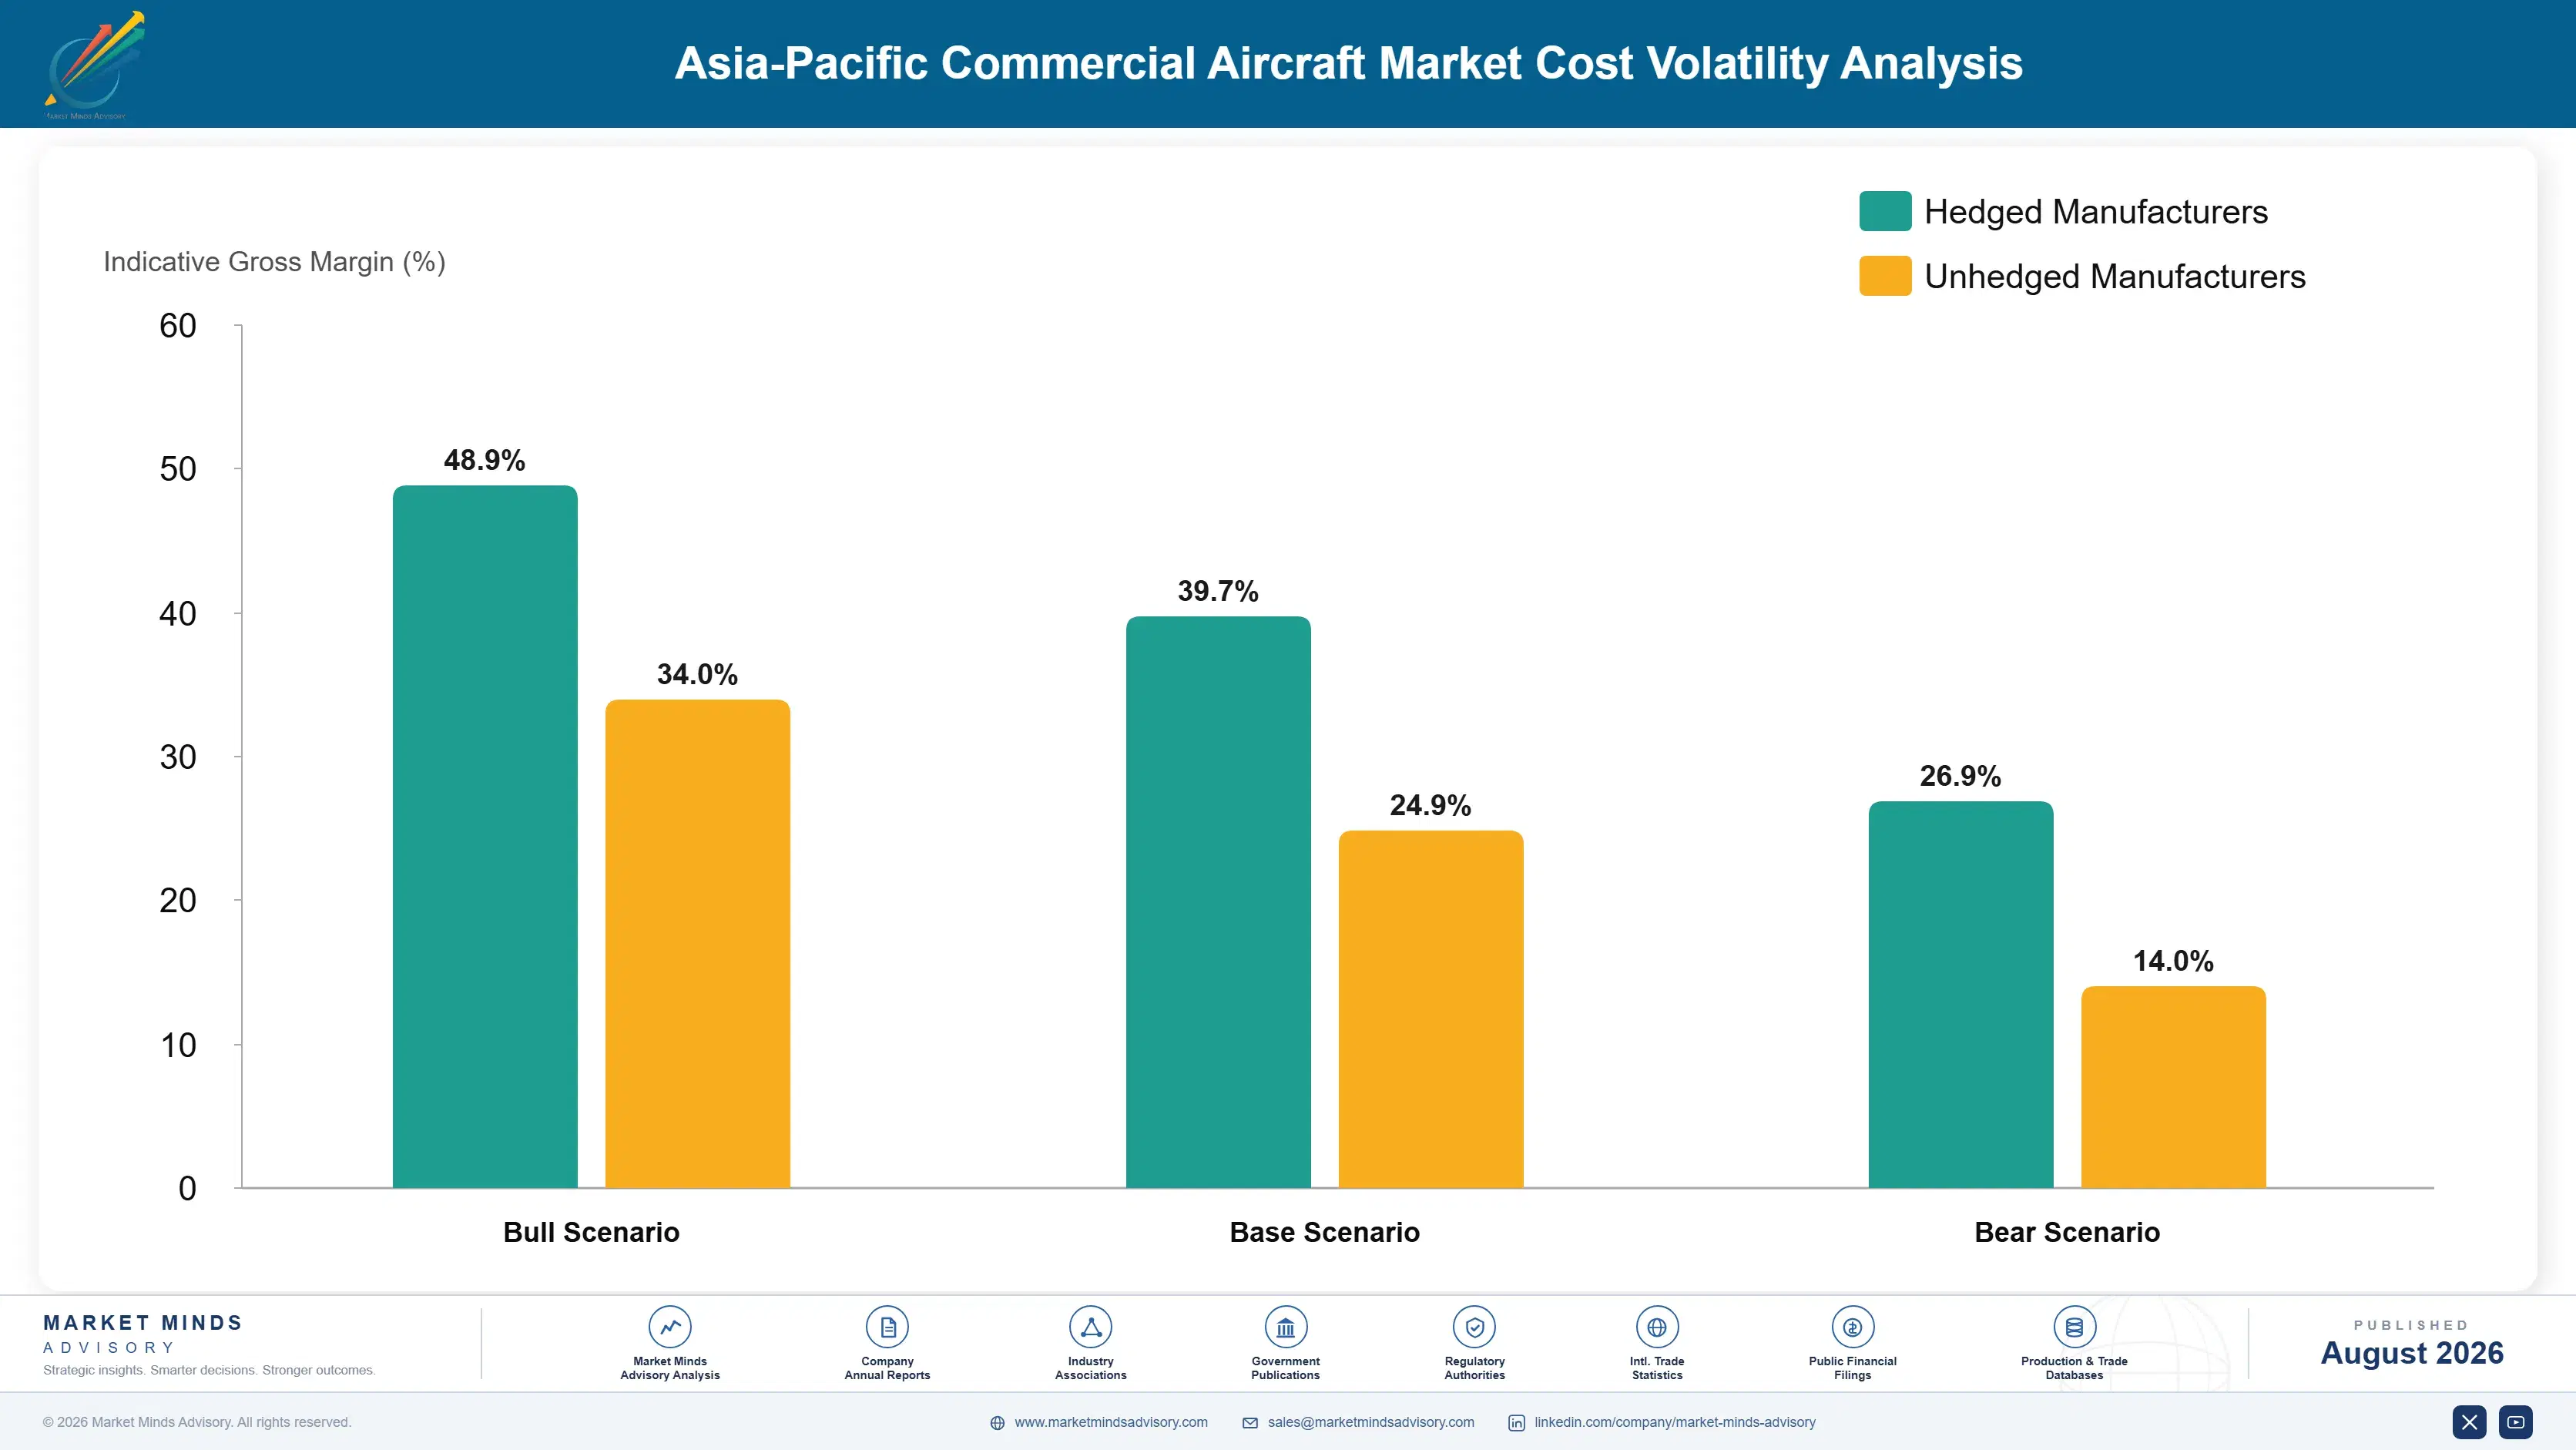
Titanium And Composite Material Cost Exposure

Titanium airframe components and advanced composite materials together represent the two largest cost inputs for commercial aircraft manufacturers, running roughly 35 to 45 percent of airframe production cost combined. Titanium is sourced predominantly from a small number of qualified aerospace-grade suppliers, while composite materials require certified manufacturing facilities capable of meeting demanding aviation specification tolerances.
The clearest recent volatility event was the 2022 titanium supply disruption following sanctions affecting major Russian titanium exports, which had historically supplied a meaningful share of global aerospace-grade titanium demand. Several manufacturers' 2025 annual reports disclosed materially higher titanium procurement costs during the period, attributing much of the increase directly to supply chain diversification efforts away from previously reliable Russian sources. Manufacturers with diversified sourcing relationships weathered this disruption meaningfully better than those dependent on single suppliers.

The competitive disadvantage mechanism falls disproportionately on smaller manufacturers without long-term supply agreements, since they must compete for constrained qualified aerospace-grade titanium capacity at spot market pricing rather than locked-in contract rates. This exposure varies by manufacturer scale too, since larger primes with multi-year supply agreements secured meaningfully more favorable terms than smaller competitors purchasing at smaller volumes.
asia-pacific-commercial-aircraft-market-cost-volatility-analysis-1787982385082

Securing Multi-Year Titanium Supply Agreements

Larger manufacturers are securing multi-year titanium supply agreements directly with qualified aerospace-grade producers, locking in predictable pricing that insulates production costs from short-term spot market volatility while guaranteeing suppliers stable long-term order commitments in return. This approach has already meaningfully stabilized production planning for several major manufacturers facing rising raw material cost pressure. nationwide.

Diversifying Titanium Sourcing Beyond Traditional Suppliers

Manufacturers are diversifying titanium sourcing across multiple qualified suppliers spanning different geographic regions, reducing dependence on any single source following the 2022 supply disruption and building redundancy into critical aerospace-grade material supply chains going forward. This diversification approach has already proven valuable for manufacturers navigating the 2022 disruption more smoothly than concentrated competitors. overall.

Investing In Composite Material Recycling Programs

Some manufacturers are investing in composite material recycling and reclamation programs that recover valuable fiber content from manufacturing waste and retired components, reducing dependence on newly produced material while building a more cost-resilient supply chain over time. Several manufacturers report meaningful progress toward scaling these recycling programs across their broader component supply chains. over time.

Portfolio Architecture for Margin Defence

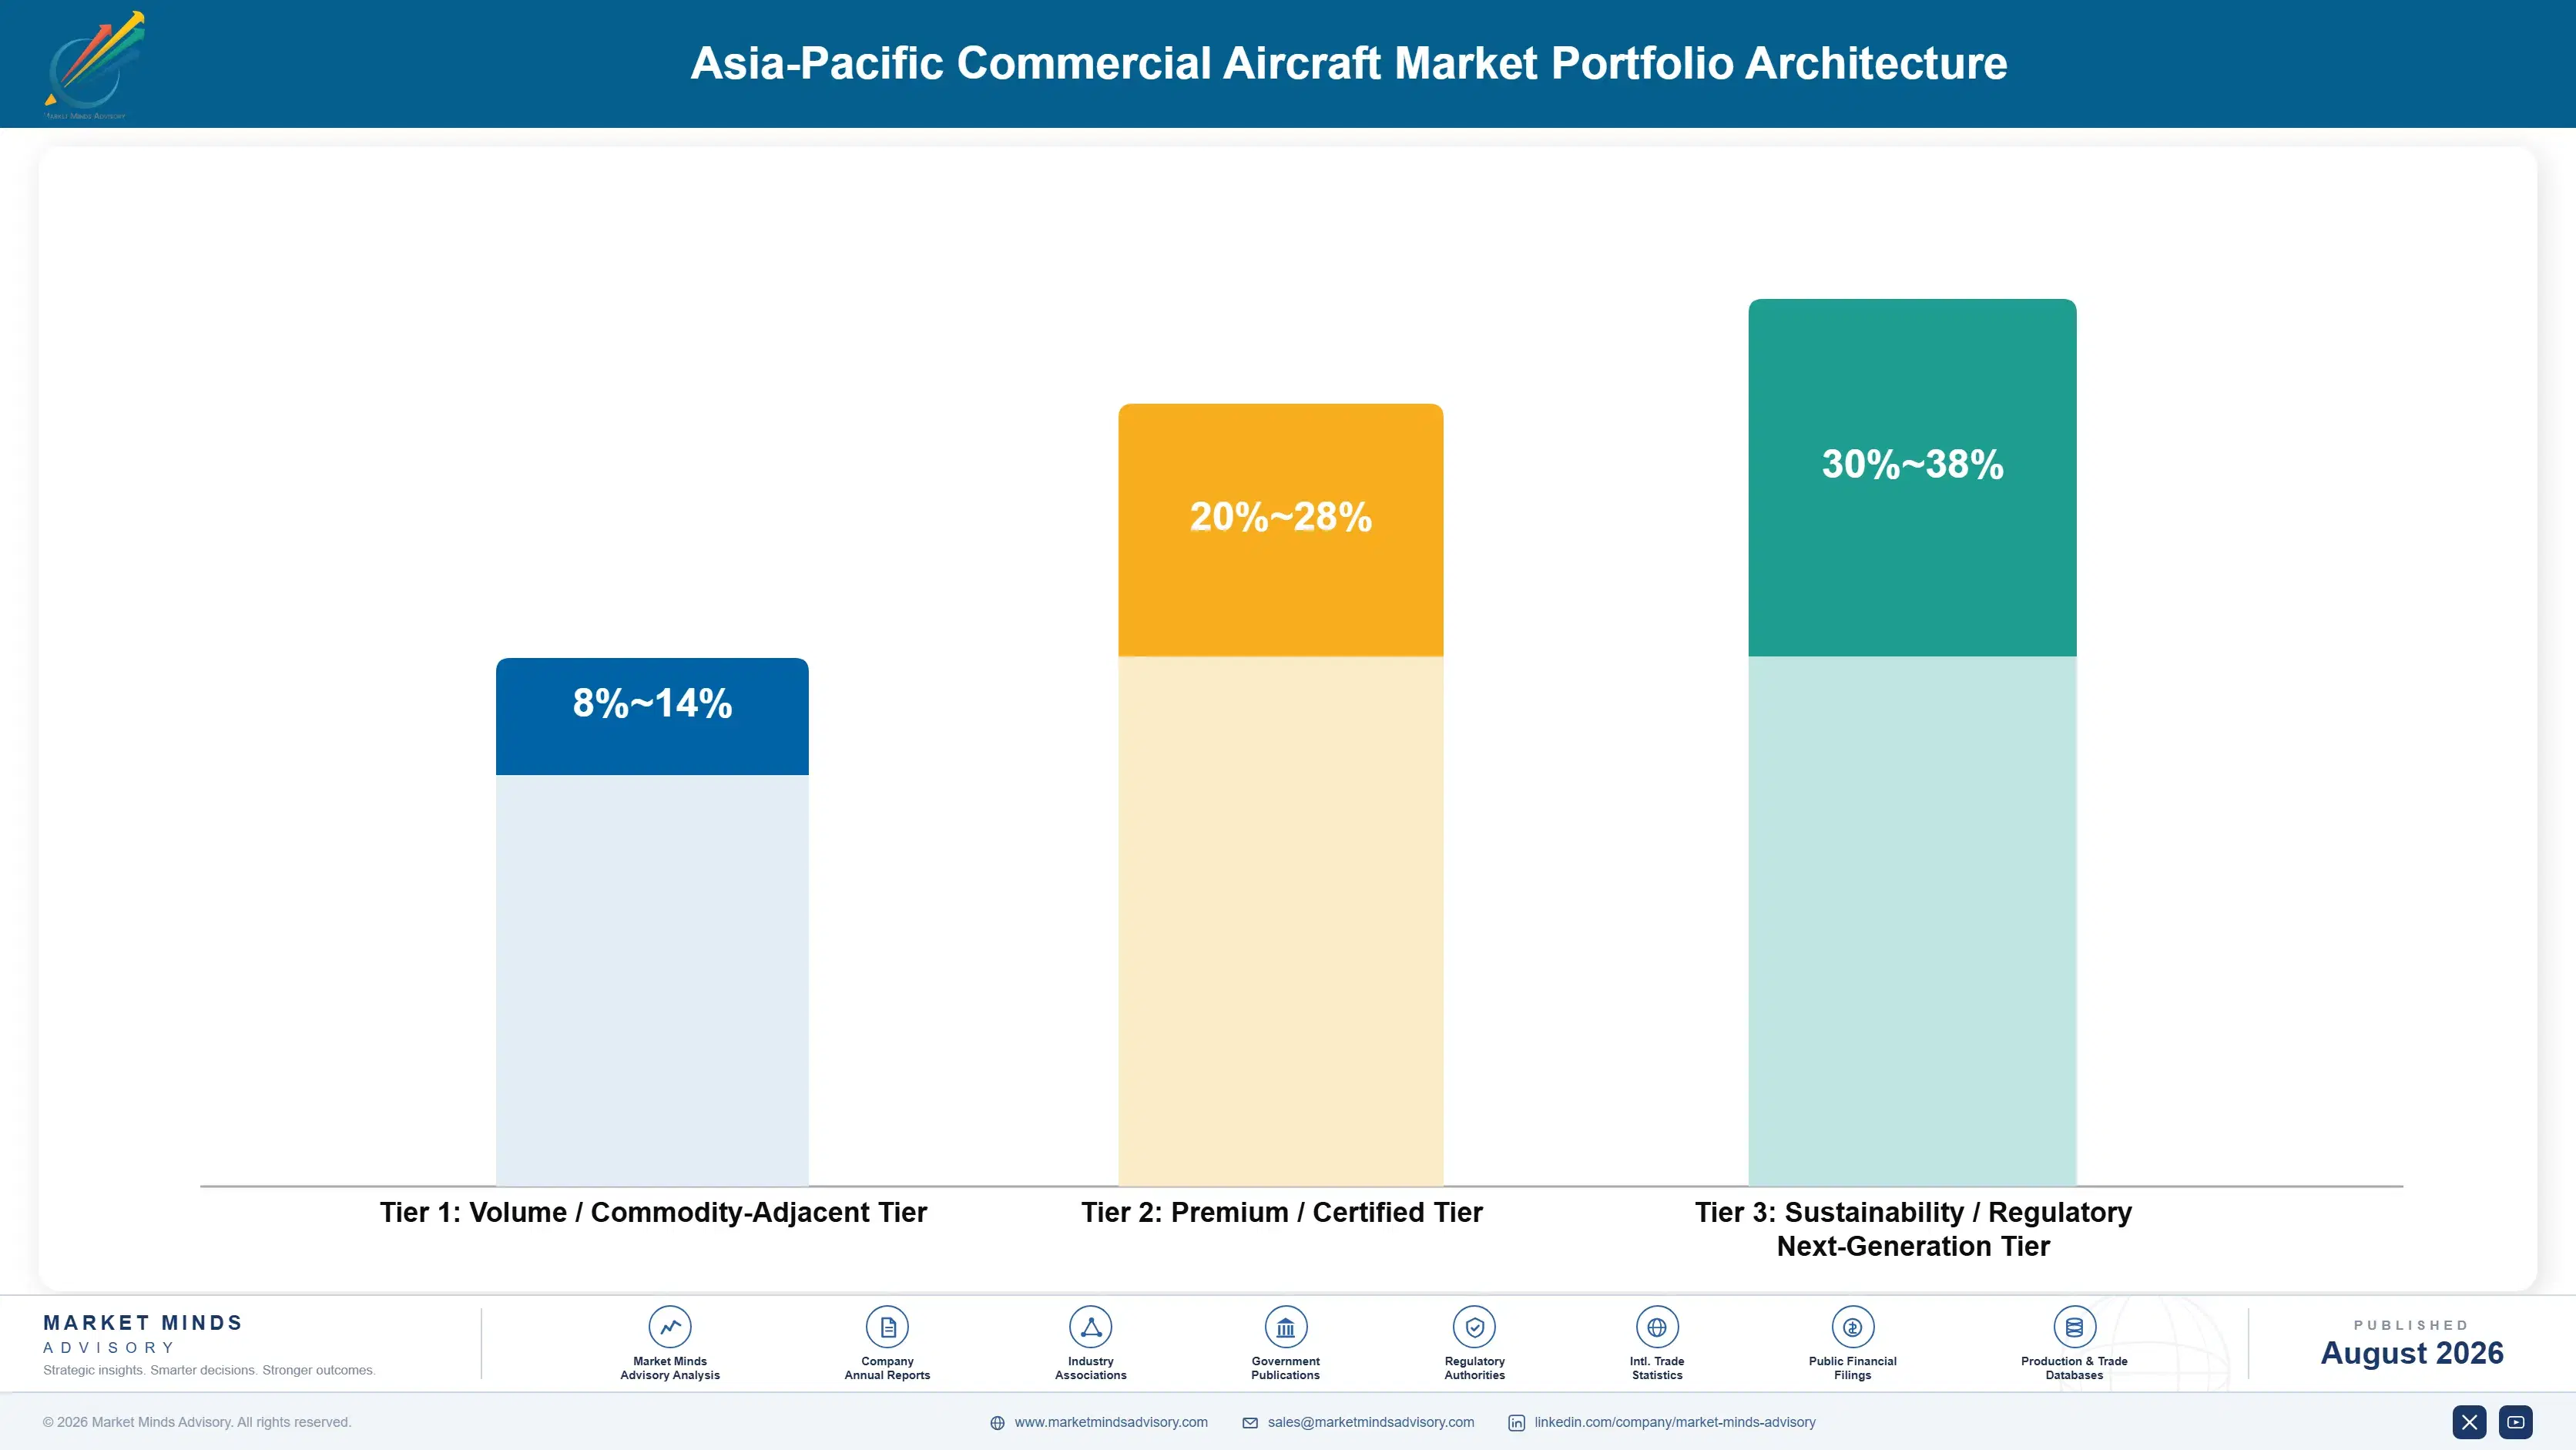
Asia-Pacific commercial aircraft portfolios span three distinct economic tiers separated primarily by delivery certainty and technology sophistication rather than platform category alone. Standard legacy aircraft sales sold on competitive rate alone carry thinner margins as production competition intensifies across the region. Manufacturers competing purely on unit price in this tier face shrinking margins as competitive bidding processes increasingly commoditize basic aircraft delivery.
Certified and premium tiers, including flexible leasing arrangements and priority delivery slots, command materially better economics because they require capital access and production capacity commitments competitors cannot replicate quickly. The highest value pool concentrates in sustainable fuel-compatible programs and regional final assembly capacity, where genuine advantage through technology and production investment drives the industry's widest margins. Providers building this expertise early are converting former capacity constraints into a durable, defensible competitive position.

Volume-tier legacy aircraft sales remain necessary for maintaining overall production scale and customer relationships, even though margin contribution lags behind premium and next-generation tiers substantially, creating an ongoing tension between defending broad market share and reallocating investment toward higher-margin leasing and sustainable fuel products. The manufacturers managing this balance most effectively will likely define industry leadership over the next several delivery cycles.

Volume / Commodity-Adjacent Tier

Standard legacy aircraft sales sold primarily on competitive rate and delivery timeline, with limited differentiation beyond unit pricing and standard specifications. Margins compress further as competitive bidding processes increasingly commoditize basic aircraft delivery across most order categories.
Gross Margin: 8-14%

Premium / Certified Tier

Flexible leasing arrangements and priority delivery slots requiring capital access and production capacity commitments that smaller competitors struggle to replicate quickly. These arrangements carry lower price sensitivity given their embedded capital relationships and specialized delivery slot access requirements.
Gross Margin: 20-28%

Sustainability / Regulatory / Next-Generation Tier

Sustainable fuel-compatible programs and regional final assembly capacity commanding the industry's highest margins through genuine technology and production differentiation. Manufacturers investing here early are building technology and production relationships competitors will struggle to replicate quickly.
Gross Margin: 30-38%
asia-pacific-commercial-aircraft-market-portfolio-architecture-1787982385579

High-value Sub-segments and Strategic Watch-out

Sustainable Fuel-Compatible Aircraft Programs

Sustainable fuel-compatible aircraft programs combine strong margin economics with the fastest growth in the market, converting environmental regulatory pressure into a genuine durable competitive advantage for well-positioned manufacturers. Manufacturers still relying on legacy platforms risk missing this increasingly lucrative regulatory opportunity entirely. This gap widens further each cycle.
Gross Margin: 28-36%

Flexible Regional Leasing Portfolio Structures

Flexible regional leasing portfolio structures pair solid margins with strong growth from airline demand for fleet flexibility, offering a dependable combination without the volatility risk carried by pure new aircraft development programs. Early movers building this flexibility are establishing customer trust later competitors will struggle to displace.
Gross Margin: 22-29%

Standard Narrowbody Order Fulfillment

Standard narrowbody order fulfillment remains the volume core of the industry, generating dependable production revenue even as margins stay compressed by intensifying competition for constrained delivery slots. Manufacturers should defend this base carefully even while shifting investment toward higher-margin leasing and sustainable fuel products. Volume alone no longer secures leadership.
Gross Margin: 8-13%

Legacy Aircraft Without Sustainable Fuel Path

Legacy aircraft without a clear sustainable fuel compatibility path represent the industry's clearest strategic watch-out, since regulatory pressure is steadily proving these older platforms are not commercially defensible without upgrade investment. Manufacturers should modernize offerings quickly rather than assume legacy platforms remain commercially viable without upgrade investment.
Gross Margin: 6-12%

Fleet-Cycle Anchored Recurring Order Demand

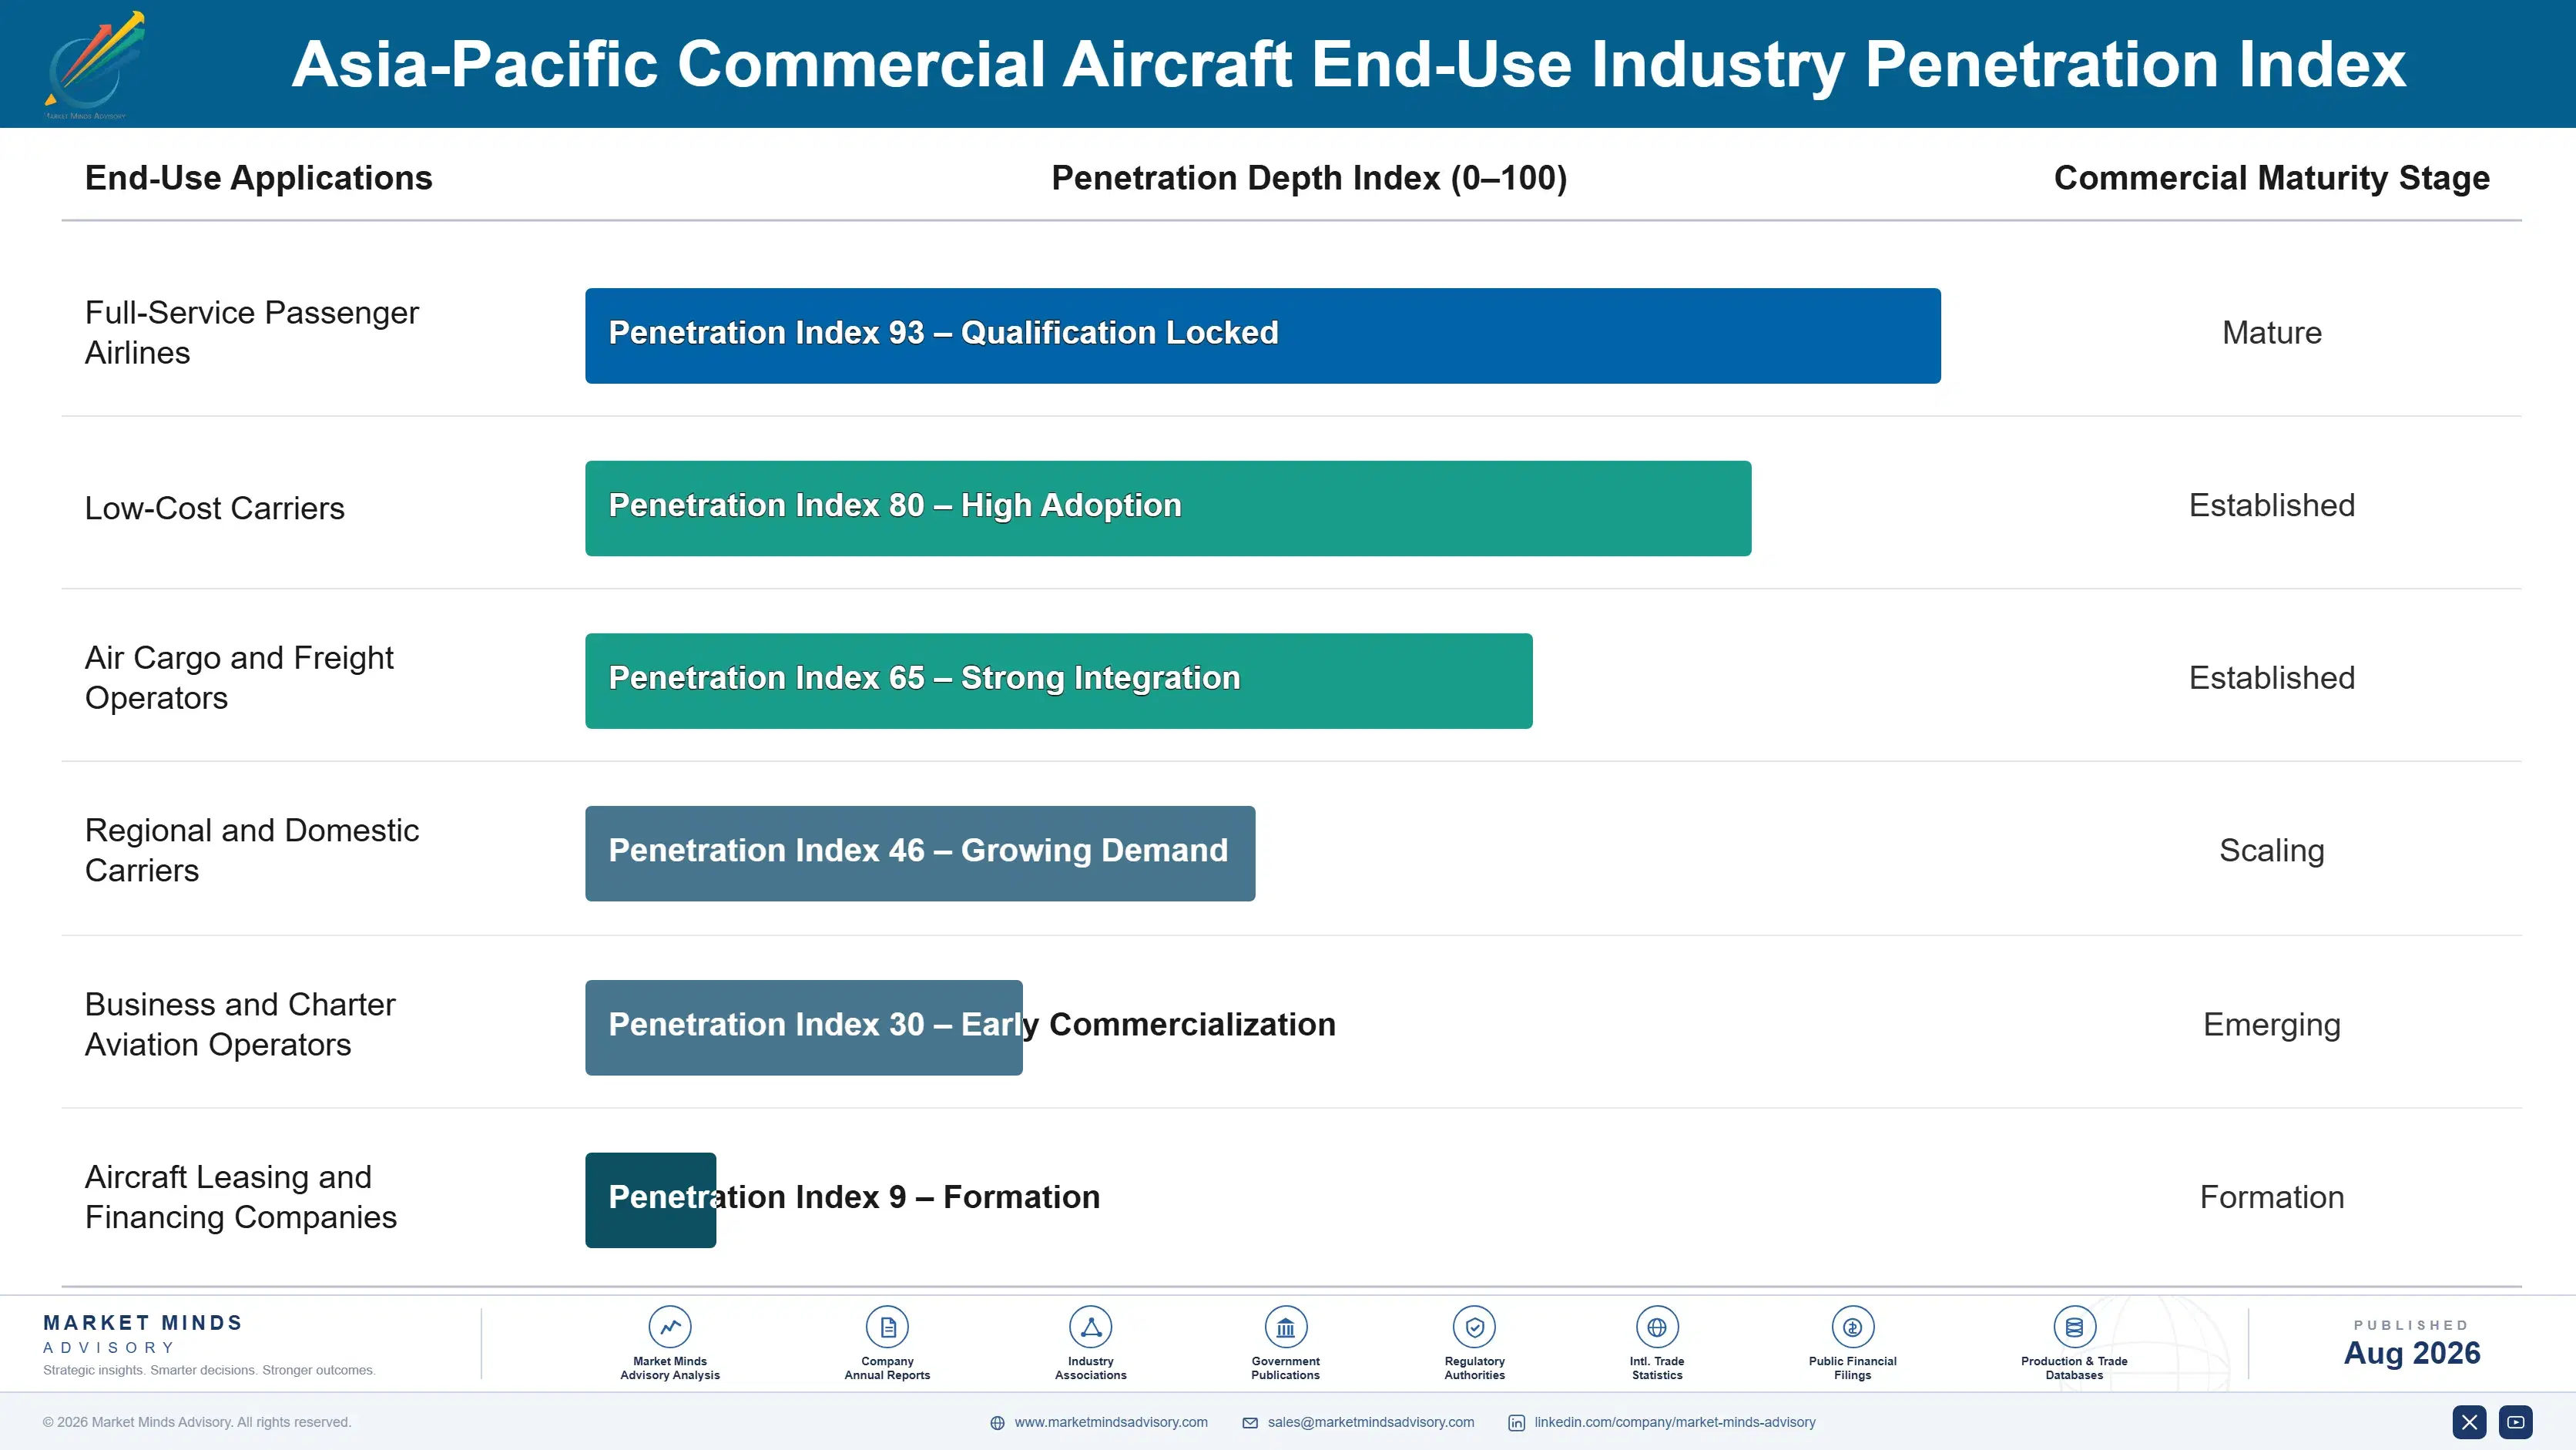
Asia-Pacific commercial aircraft demand carries strong annuity characteristics because decades-long aircraft service life generates predictable recurring aftermarket parts and leasing renewal revenue once a fleet relationship is established, giving manufacturers and lessors unusually stable recurring revenue streams tied to specialized parts access and fleet financing relationships that competitors cannot easily replicate. Manufacturers benefit from this loyalty especially once maintenance and parts infrastructure is established locally.
Stickiness varies meaningfully by end-use vertical, though. Major full-service carrier relationships show the deepest retention since switching manufacturers requires costly pilot and maintenance crew retraining across an entire fleet, while low-cost carrier relationships show comparatively shallower loyalty, actively comparing competing delivery timelines and leasing terms before committing to a specific manufacturer or lessor relationship. First-time low-cost carrier relationships also show meaningfully more price sensitivity before switching costs meaningfully increase over subsequent renewal cycles.

A generational buyer shift is also underway. Younger airline fleet planning executives increasingly prioritize sustainable fuel compatibility and flexible leasing structures over the purely mechanical reliability metrics that dominated procurement decisions for prior generations of Asia-Pacific aviation buyers. Manufacturers slow to build comparable sustainable fuel credentials risk losing favor with this newer generation of airline fleet planning decision-makers.
asia-pacific-commercial-aircraft-market-end-use-penetration-index-1787982386069

Where Aircraft Manufacturers Should Focus

These are among the four positions where our research anticipates prominent divergence between winners and laggards over the coming forecast period. Each is grounded in the demand model, the regulatory perimeter, and the announced capacity pipeline.
01 / REGIONAL PRODUCTION INVESTMENT

Expand regional assembly capacity before backlogs worsen further

Manufacturers still relying purely on outdated centralized production risk missing delivery slot priority entirely as regional demand keeps outpacing already-constrained global manufacturing capacity everywhere. Airbus's expanded regional assembly presence already demonstrates meaningfully faster delivery timelines than centralized production alone can realistically achieve today. Manufacturers that delay this investment risk ceding the region's fastest-growing order volume permanently to earlier-moving, better-resourced competitors already building comparable capacity, a gap that widens further with every additional delivery cycle these slower-moving competitors wait to invest.
02 / LEASING PORTFOLIO FLEXIBILITY

Build flexible leasing structures before fleet financing consolidates

Lessors offering only rigid, entirely standardized lease terms risk steadily losing valuable airline customers to competitors offering genuine, well-demonstrated fleet flexibility during these persistently constrained delivery periods overall. BOC Aviation's flexible leasing structures already capture considerably more financing volume than rigid, less accommodating alternatives available across the broader region. Lessors that keep delaying building comparable flexibility risk permanently ceding the region's largest carrier fleet financing relationships to faster-moving competitors already locking in long-term customer commitments across multiple emerging Asian markets.
03 / SUSTAINABLE FUEL CERTIFICATION

Certify sustainable fuel compatibility before airline preference solidifies

Manufacturers still finalizing sustainable fuel certification programs risk steadily losing valuable airline customer preference to competitors already demonstrating proven, well-documented compatibility credentials across their entire operating fleets right now. Early movers already win considerably more competitive selection processes among airlines carrying binding corporate emissions reduction commitments made publicly available right now. Manufacturers that keep delaying this investment risk permanently ceding sustainability-focused fleet selection decisions to competitors who invested much earlier in well-demonstrated technology leadership across their entire global operating fleet base.
04 / MATERIAL SUPPLY DIVERSIFICATION

Diversify titanium sourcing before the next supply disruption hits

Manufacturers concentrated heavily in narrow titanium supply relationships face significantly amplified exposure when disruptions like the 2022 sanctions-driven shortage hit already-constrained aerospace-grade capacity simultaneously across the whole industry. Diversified sourcing across multiple qualified suppliers insulates manufacturers from this risk far more effectively than continued single-source dependence on any one region. Manufacturers that wait until the next disruption to diversify will likely face materially worse terms than those who prepared proactively well ahead of any visible warning signs in the market.

Engagement Snapshot From the Field

A live engagement with an industry participant carrying material or product regulatory and market exposure ahead of a defining policy shift, showing how our research translates into a defensible multi-year portfolio strategy.
MARKET MINDS ADVISORY · CLIENT ENGAGEMENT SUMMARY
Asia-Pacific Commercial Aircraft Producer Strategic Portfolio Review and Transition Roadmap 2026·Investment Scenario on Asia-Pacific Commercial Aircraft Exposure Evaluation 2025-26
CLIENT PROFILE
The client was a rapidly expanding Southeast Asian low-cost carrier managing an aggressive fleet growth program constrained by manufacturer delivery backlogs, historically relying on a single incumbent leasing relationship without conducting a structured comparative financing evaluation. The carrier operated routes connecting several major regional cities and was adding new aircraft roughly every quarter. The fleet expansion program represented a significant capital commitment for the carrier.
STRATEGIC CHALLENGE
Fleet leadership needed to determine whether continuing with the incumbent lessor or diversifying across multiple financing relationships offered better long-term value given constrained manufacturer delivery slots and rising interest rates affecting overall leasing cost structures. Leadership also needed to weigh the operational complexity of managing multiple lessor relationships against the risk of continued single-lessor dependence.
MMA APPROACH
MMA benchmarked candidate leasing companies across delivery slot access, financing flexibility, and total cost of ownership, drawing on primary interviews with fleet planning executives at comparable regional low-cost carriers that had recently completed similar financing diversification evaluations. The assessment also incorporated publicly available delivery performance and financing cost data from the carrier's own historical records.
KEY FINDINGS
  1. One candidate lessor's flexible portfolio structure delivered meaningfully better delivery slot access than the incumbent relationship despite comparable overall pricing (client-reported, unverified by MMA).
  2. Financing terms varied substantially across candidate lessors, directly affecting the carrier's realistic fleet expansion timeline and capital planning. This variation directly shaped which candidates the carrier prioritized for near-term financing discussions.
  3. Diversifying across two lessors reduced delivery timing risk meaningfully compared with single-lessor dependence during constrained manufacturer backlog periods. This risk reduction proved especially valuable given the carrier's aggressive fleet expansion schedule.
  4. Carriers that delayed lessor diversification reported meaningfully slower fleet growth as their own expansion plans outpaced single-lessor delivery access. This finding reinforced the urgency of moving forward with diversification promptly.
CLIENT PROFILE
The client was a rapidly expanding Southeast Asian low-cost carrier managing an aggressive fleet growth program constrained by manufacturer delivery backlogs, historically relying on a single incumbent leasing relationship without conducting a structured comparative financing evaluation. The carrier operated routes connecting several major regional cities and was adding new aircraft roughly every quarter. The fleet expansion program represented a significant capital commitment for the carrier.
STRATEGIC CHALLENGE
Fleet leadership needed to determine whether continuing with the incumbent lessor or diversifying across multiple financing relationships offered better long-term value given constrained manufacturer delivery slots and rising interest rates affecting overall leasing cost structures. Leadership also needed to weigh the operational complexity of managing multiple lessor relationships against the risk of continued single-lessor dependence.
MMA APPROACH
MMA benchmarked candidate leasing companies across delivery slot access, financing flexibility, and total cost of ownership, drawing on primary interviews with fleet planning executives at comparable regional low-cost carriers that had recently completed similar financing diversification evaluations. The assessment also incorporated publicly available delivery performance and financing cost data from the carrier's own historical records.
KEY FINDINGS
  1. One candidate lessor's flexible portfolio structure delivered meaningfully better delivery slot access than the incumbent relationship despite comparable overall pricing (client-reported, unverified by MMA).
  2. Financing terms varied substantially across candidate lessors, directly affecting the carrier's realistic fleet expansion timeline and capital planning. This variation directly shaped which candidates the carrier prioritized for near-term financing discussions.
  3. Diversifying across two lessors reduced delivery timing risk meaningfully compared with single-lessor dependence during constrained manufacturer backlog periods. This risk reduction proved especially valuable given the carrier's aggressive fleet expansion schedule.
  4. Carriers that delayed lessor diversification reported meaningfully slower fleet growth as their own expansion plans outpaced single-lessor delivery access. This finding reinforced the urgency of moving forward with diversification promptly.
RECOMMENDED STRATEGY
Phase 1: Phase one added a second qualified leasing relationship for a subset of the carrier's expanding fleet. to validate performance before broader commitment. Phase 2: Phase two gradually rebalanced fleet financing between both lessors based on demonstrated delivery performance. to optimize cost and delivery access across both relationships. Phase 3: Phase three formalized long-term financing agreements with both lessors once performance benchmarks were confirmed reliable. to lock in favorable long-term pricing and capacity.
OUTCOME
The carrier successfully diversified its fleet financing relationships within the recommended timeline and reported meaningfully improved delivery access and fleet growth pace within the first year of the revised arrangement (client-reported, unverified by MMA). Leadership credited the phased approach with avoiding costly disruptions during the carrier's continued rapid fleet expansion.

Frequently Asked Questions

Foundational context covering the market sizes, CAGR, scope, country, region and competition that inform every finding below. This section is provided to cover basics and most often pre-purchase conversations, answered from the MMA Primary Research Dataset.

What is the current size of the Asia-Pacific Commercial Aircraft Market?

The Asia-Pacific commercial aircraft market reached an estimated 42.0 billion dollars in 2025. Growth has been propelled by explosive low-cost carrier fleet expansion and rising regional middle-class travel demand.

How large will the Asia-Pacific Commercial Aircraft Market be by 2036?

The market is projected to reach approximately 113.97 billion dollars by 2036. This reflects sustained fleet growth and sustainable aviation fuel program investment through the forecast period.

What is the CAGR for the Asia-Pacific Commercial Aircraft Market 2026 to 2036?

The base case CAGR is 9.5 percent annually. Bull and bear scenarios range between 8.3 and 10.7 percent depending on the pace of regional commercial aviation traffic growth.

Which segment is growing fastest?

Sustainable aviation fuel-compatible aircraft programs lead at 15.5 percent CAGR, roughly 1.63 times the overall market pace. Tightening environmental regulation is the primary driver behind this segment's acceleration.

Who are the major companies in the Asia-Pacific Commercial Aircraft Market?

Leading manufacturers include Boeing, Airbus, COMAC, Embraer, and ATR. These five manufacturers hold a combined 72 percent share on a revenue basis, given Boeing and Airbus's duopoly position across most platform categories.

Which country is growing fastest?

India leads at an estimated 12.5 percent CAGR. Rapidly expanding domestic aviation demand and substantial carrier order backlogs across the country's expanding low-cost carriers continue driving this above-average pace.

Report Segmentation Architecture

The full report scope spans multiple orthogonal segmentation dimensions, with cross-tabulated demand data provided for each dimension pair. Coverage extends further to regional breakdowns, trend trajectories, and the competitive detail needed to support segment-level decision-making.

By Primary Market Dimension

  • Narrowbody Commercial Aircraft
  • Widebody Commercial Aircraft
  • Regional Jet Aircraft
  • Commercial Aircraft Leasing Services
  • Aircraft Cabin Interior and Retrofit Services
  • Sustainable Aviation Fuel-Compatible Aircraft Programs

By End-Use Industry

  • Full-Service Passenger Airlines
  • Low-Cost Carriers
  • Air Cargo and Freight Operators
  • Regional and Domestic Carriers
  • Business and Charter Aviation Operators
  • Aircraft Leasing and Financing Companies

By Commercial Dimension

  • Direct Manufacturer Sales
  • Operating Lease Financing
  • Finance Lease Arrangements
  • Sale and Leaseback Transactions
  • Cabin Retrofit and Modification Services
  • Aftermarket Parts and Support Services

By Region

  • East Asia
  • South Asia and Pacific
  • North America
  • Western Europe
  • Middle East and Africa
  • Latin America
  • Eastern Europe

Scope, Methodology, and Coverage

Every figure in this report is reproducible from documented input assumptions. The scope below maps the historical period, the forecast horizon, the segmentation dimensions, and the countries covered, alongside the underlying primary and qualitative methodology.
Historical Period
2020 to 2025
Forecast Period
2026 to 2036
Base Year
2025 (USD billions; MMA Primary Research Dataset, August 2026)
Market Definition
This report covers the manufacture, sale, and leasing of narrowbody, widebody, and regional jet commercial aircraft operated by passenger and cargo airlines across Asia-Pacific markets, including associated cabin interior and retrofit services. It excludes military aircraft, business and general aviation aircraft, and airport ground infrastructure.
Quantitative Units
USD billions (program revenue, current prices); unit deliveries in hundreds where cited.
Segmentation Dimensions
Primary Market Dimension (platform and commercial structure); End-Use Industry; Commercial Dimension.
Regions Covered
East Asia, South Asia and Pacific, North America, Western Europe, Middle East and Africa, Latin America, Eastern Europe
Countries Covered
China, Japan, South Korea, India, Indonesia, Vietnam, Philippines, Australia, USA, France, Germany, Singapore, Thailand, Malaysia, Brazil.
Key Companies Profiled
Boeing, Airbus, COMAC, Embraer, ATR.
Quantitative Methodology
Primary survey, n=3,800 respondents, Q4 2025, six countries; demand-side model with trade association cross-validation
Qualitative Methodology
47 expert interviews, Q4 2025; applied to validate demand model assumptions, identify emerging dynamics, and assess competitive positioning
Report Format
PDF and XLSX data workbook (Word format preview document)
Publisher
Market Minds Advisory
Report Code
MMA-2026-CON-106
Published
August 2026
Contact
sales@marketmindsadvisory.com | www.marketmindsadvisory.com

Purchase the full Asia-Pacific Commercial Aircraft Market Report (2026 to 2036).

This report delivers a complete strategic assessment of the Asia-Pacific commercial aircraft market through 2036. It combines primary survey data from 3,800 respondents across six countries with 47 expert interviews conducted in the fourth quarter of 2025. Coverage spans market sizing, six-segment MECE platform and commercial structure segmentation, competitive benchmarking across twenty profiled companies, and regional analysis across all seven global regions. The analysis is designed to support production strategy, leasing investment, and sustainable fuel decisions. Buyers gain a structured basis for evaluating production capacity investment against continued leasing and sustainable fuel decisions.
Six-segment MECE aircraft platform and structure breakdown
Seven-region market sizing with country-level detail
Twenty-company competitive benchmarking and moat analysis
Order backlog impact quantification and scenarios
Regional production and leasing flexibility investment guidance
Anonymized client case study with recommended strategy phases

Built For The People Who Decide

From boardroom strategy to bench-side execution, this report is read cover-to-cover by leaders shaping the next decade of their industry, turning demand scenarios, market dynamics and valuation benchmarks into decisions.
CXOs/ Presidents/ VPs/ Managers
M&A and Corporate Development
Strategy Teams and R&D Heads
Procurement and Product Directors
Regulatory and Compliance Leaders
Investor Relations and Equity Analysts