Market Minds Advisory
Asia-Pacific Air Traffic Management Market

Asia-Pacific Air Traffic Management Market: Boundaries, Closed Markets and the Certification Barrier

Asian airspace capacity is limited by more than forty national boundaries rather than by equipment, and the highest-return fix is coordination that nobody has ever managed to sell as a product.

Lead Analyst

Published

September 2026

Make Smarter Decisions with Customized Research Insights

Request a free sample report and evaluate market opportunities, growth trends, and competitive dynamics relevant to your business needs.

2025 MARKET VALUE$4.8BMarket Size 2025
2036 FORECAST VALUE$11.9BBase Case , 2026 to 2036
CAGR 2026 TO 20368.6 %Bull 9.9% / Bear 7.3%
INCREMENTAL OPPORTUNITY$6.7BNet 10- year value creation
EXPANSION MULTIPLE2.29x2036 value over 2026 base
Strategic Levers
M&A Pipeline
Regional Outlook
Country Rankings
Competitive Intelligence
Segmental Deep-dive
Call-Us : 91 93563 13602

Executive Snapshot and Market Trajectory

Asian airspace is constrained by boundaries, not by boxes. More than forty national providers operate with almost no regional harmonisation, and every flight information region boundary adds coordination delay and buffer airspace that no equipment purchase can remove. The map is the constraint, not the equipment.
Two other things shape what is actually buyable. Military airspace reservation caps civil capacity across several of the largest countries in ways no supplier can address, and China's system is closed to external suppliers entirely, which makes the addressable market far smaller than traffic figures suggest. Cooperative and space-based surveillance grows fastest at 12.9%, half again the market rate of 8.6%, from a small base.
Five suppliers hold 63%, and four of them are European, which is unusual in a region that manufactures most of the world's electronics. The reason is certification: an air traffic system carries a safety case that takes years to build and that regulators accept on the basis of prior service history. That history is the barrier, and it is why capable regional electronics firms have not displaced suppliers whose products are sometimes a generation older.
Market Definition
This report covers air traffic management systems procured by air navigation service providers and airport operators across Asia Pacific. Scope includes surveillance radar systems, cooperative and space-based surveillance, air traffic management automation and flight data systems, communications and datalink systems, navigation aids and landing systems, and tower or remote tower systems. Excluded are airport surface movement guidance systems, airborne avionics carried on aircraft, military air defence command and control, airport terminal and runway construction, air navigation service provider operating costs, and controller training services sold separately.
Base Year Value
$4.8B in 2025 (MMA Primary Research Dataset, September 2026)
Forecast Period
2026 to 2036, eleven discrete annual values
CAGR
8.6% base case. Bull 9.9%. Bear 7.3%.
Fastest Growth Segment
Cooperative And Space-Based Surveillance: 12.9% CAGR
Fastest Growth Country
India: 12.4% CAGR
Fastest Growth Region
South Asia and Pacific: 10.6% CAGR
Largest Region
Western Europe: 34% of 2025 global value
Market Leaders
Thales, Indra Sistemas, Leonardo, Frequentis, NEC Corporation. Source: MMA Analysis based on installed system base and contracted programme value, July 2026.
Primary Survey
n=3,800 procurement and R&D decision-makers, Q4 2025, six countries
Methodology
Demand-side build-up, cross-validated against public data, 47 expert interviews

Asia-Pacific Air Traffic Management Market Forecast Scenarios

asia-pacific-air-traffic-management-market-size-forecast-scenario-1790026314500
Growth averaged 7.2% across 2020 to 2025, and providers used the traffic collapse of 2020 and 2021 to cut over systems they could never have taken offline at normal movement rates. Several automation replacements that had been deferred for years completed in that window. From 2022 traffic recovered faster than capacity could be added, which exposed the coordination and airspace constraints that equipment alone does not fix.
Base case growth of 8.6% rests on three mechanisms. Traffic growth across South and Southeast Asia continues to outpace airspace capacity, which forces surveillance and automation investment regardless of how little harmonisation accompanies it. Space-based cooperative surveillance makes oceanic and remote airspace observable at a fraction of radar cost, opening coverage nobody could previously fund. And airport construction across the region brings tower and navigation aid content with every new runway commissioned.
The bull case at 9.9% assumes cross-border data sharing arrangements advance enough to make regional flow management a fundable programme rather than a conference topic. The bear case at 7.3% follows from the reverse: providers keep buying equipment that cannot deliver capacity because the boundaries remain, budgets tighten when the promised improvements do not arrive, and replacement cycles stretch.

Boundaries, Closed Markets and Safety Cases

The capacity problem in this region has a cartographic cause. More than forty national authorities manage adjoining airspace with limited common procedures and no regional single-sky programme, and each boundary crossing adds coordination time and separation buffer. A flight from Southeast Asia to Northeast Asia may cross half a dozen such boundaries, and the accumulated inefficiency exceeds anything a new radar recovers.
FIVE-FIRM CONCENTRATION63%Certification history rather than technology defends these positions
REGIONAL PROVIDER COUNT41 providersSeparate national authorities managing adjoining airspace across the region
CLOSED MARKET SHARE38%Regional demand served entirely by domestic suppliers under policy
AUTOMATION SYSTEM REFRESH13 yearsTypical replacement interval on air traffic automation platforms
BOUNDARY COORDINATION BUFFER18 minutesAverage separation buffer added at each information region boundary
CERTIFIED SOFTWARE COST SHARE51%Safety-certified engineering within the delivered automation system cost
What is addressable is considerably smaller than the traffic statistics imply. Roughly 38% of regional demand sits inside markets served entirely by domestic suppliers under national policy, principally China, and military airspace reservation across several large countries caps civil capacity in ways no supplier can sell a product against. Analysts sizing this market from traffic growth alone overstate the opportunity substantially.
Certification explains why European suppliers dominate a region that builds most of the world's electronics. An air traffic system carries a safety case that takes years to construct and which regulators accept largely on prior service history, so a technically superior product without operational hours loses to an older one that has run somewhere for a decade. That barrier has held better than any patent, and regional electronics firms with obvious capability have not crossed it.
"Every provider in the region will show you a modernisation roadmap. Not one of them can show you an agreement with the provider next door, and that is where the delay minutes actually accumulate."
Director, Air Transport Infrastructure Practice · MMA Technology / Air Navigation Systems Practice · September 2026

Market Trends

Space-Based Surveillance Makes Oceanic Airspace Economically Observable

Satellite-hosted cooperative surveillance gives providers position reporting over ocean and remote terrain where radar was never affordable, at a subscription cost rather than a capital programme. For Pacific and Indian Ocean airspace this is transformative, since it allows reduced separation and more efficient routing across areas previously managed procedurally. Adoption has been uneven because it requires aircraft equipage and a service contract rather than an asset a provider owns. Around 14 regional providers now subscribe to space-based surveillance services. Providers buy a service they do not own, which several find culturally difficult.
Market Impact: Funds 27 major regional programmes

Remote Tower Deployment Reaches Low-Traffic Regional Airports

Remote and digital tower technology has matured enough for providers to consolidate control of low-traffic regional airports into centralised facilities, which addresses controller shortages and the cost of staffing towers that handle a handful of movements daily. Island and archipelagic states across the region have the strongest case of anywhere. Certification remains the slow part, since each national authority assesses the safety argument independently and few accept another regulator's approval. Deployment has moved from trials to operational service at roughly 20 regional airports. Island and archipelagic states hold the strongest case anywhere.
Market Impact: Commissions 180 new regional runways

Market Opportunities and Growth Drivers

Traffic Growth Outpaces Airspace Capacity Across South And Southeast Asia

Passenger traffic across India, Vietnam, Indonesia, the Philippines and Thailand has grown faster than airspace capacity could be added, producing delay that is politically visible and commercially expensive for carriers. Providers respond with surveillance and automation investment because that is what can be procured, even where the binding constraint sits elsewhere. The spending is real regardless of whether it delivers the capacity promised. Roughly 27 major automation and surveillance programmes across the region are funded within the forecast period. Spending continues regardless of whether any of the promised capacity ever appears.
Market Impact: Adds 18 minutes per boundary

Airport Construction Brings Navigation And Tower Content With Every Runway

New runway and airport construction across China, India and Southeast Asia carries navigation aids, tower systems and communications infrastructure as standard scope, procured alongside the civil works rather than separately. That makes the demand forecastable from published construction programmes rather than from provider modernisation plans, which are far less reliable. New-build content also attaches at higher rates than retrofit because installation is designed in. Around 180 new runways are scheduled for commissioning across the region during the period. Published construction programmes forecast this demand far better than provider modernisation plans ever do.
Market Impact: Reserves 31% of upper airspace

Market Restraints and Challenges

Airspace Fragmentation Prevents Equipment From Delivering Capacity

More than forty national providers manage adjoining airspace with limited common procedures, and each boundary crossing adds coordination time and separation buffer averaging around 18 minutes of accumulated inefficiency on regional routes. The root cause is sovereignty: airspace management is a national competence and no regional authority exists to harmonise it. Commercially this means providers buy equipment that cannot deliver the capacity improvement promised, which eventually erodes the case for further spending. Mitigation is running through bilateral data sharing agreements, harmonised procedure trials and regional coordination bodies with limited authority.
Market Impact: Covers 14 regional provider subscriptions

Military Airspace Reservation Caps Civil Capacity Regardless Of Investment

Substantial portions of airspace across several of the region's largest countries are reserved for military use with limited flexible use arrangements, which constrains civil routing far more than any equipment limitation. The root cause is that release of airspace is a defence decision taken outside civil aviation entirely. Commercially this caps what any modernisation programme can achieve and makes provider business cases hard to defend afterwards. Participants can only respond by supporting flexible use implementation, civil-military coordination tooling, and honest capacity modelling that shows what equipment alone cannot deliver. Nobody sells a product against a defence decision.
Market Impact: Reaches 20 operational regional airports
4 additional market trends, 3 additional growth drivers, and 2 additional restraints and challenges are covered in the full report. Contact sales@marketmindsadvisory.com to access the complete intelligence.

Segment CAGR and Growth Architecture

Systems are segmented here by element, because each element is procured separately, certified separately and often bought by a different part of a provider organisation. Mixing system element with airspace type or provider size creates categories that no procurement document recognises. Six elements cover the field from navigation aids through to space-based surveillance, and their growth rates diverge sharply.
asia-pacific-air-traffic-management-market-market-share-analysis-1790026315060

Cooperative And Space-Based Surveillance

Growing at 12.9%, half again the market rate of 8.6%, this element is expanding because it makes airspace observable that radar could never economically cover. Satellite-hosted cooperative surveillance gives providers position reporting over ocean and remote terrain for a subscription rather than a capital programme, which suits providers whose budgets cannot support radar installations on remote islands or mountain terrain. The commercial model differs fundamentally from the rest of this market: providers buy a service they do not own, which several have found culturally difficult even where the economics are obvious. Around 14 regional providers now subscribe. Radar could never have economically covered the airspace this now observes at all today.
CAGR 12.9%

ATM Automation And Flight Data Systems

Automation platforms grow at 9.8% on a replacement cycle averaging around 13 years combined with genuine capacity pressure across South and Southeast Asia. These are the largest individual contracts in the market and the most demanding to deliver, since the safety case covers software that separates aircraft and regulators accept it largely on prior operational history. That certification barrier is why the same handful of suppliers win repeatedly. Certified software engineering represents roughly 51% of delivered system cost, which makes this a software business wearing hardware clothing, and prices accordingly. Regulators accept the safety case on prior operational history rather than on technical assessment, which is why the same handful of suppliers keep winning.
CAGR 9.8%
Full segment breakdown across 6 segments available in the complete report.

Regional Architecture and Country Demand Map

This is a region-scoped report, so the regional table records where the systems serving Asia Pacific providers are manufactured rather than where demand sits. European suppliers dominate on certification history, East Asian manufacture reflects closed domestic markets, and regional supply beyond that remains modest. Both facts shape the addressable figure.

Western Europe

At 34%, above the 18 to 26% band applied elsewhere in this report, European supply leads because certification history rather than technology decides these procurements. French, Spanish, Italian and Austrian suppliers hold automation, surveillance and communications systems in operational service across dozens of providers worldwide, and regulators accept a safety case largely on that accumulated record. Swedish remote tower capability adds a further position where regional island states have the strongest use case anywhere. Growth of 7.1% trails the regional market rate, as Chinese domestic supply and regional manufacture take share in the markets where certification arguments carry less weight. Certification history counts for more in this market than technical currency does.
Share: 34% | CAGR: 7.1% (2026 to 2036)

East Asia

At 32%, above the 22 to 30% band used elsewhere, East Asian manufacture reflects closed markets more than export competitiveness. Chinese domestic suppliers serve a national system entirely closed to external participants, which alone accounts for most of the figure and is not addressable by anyone outside it. Japanese manufacture supplies radar, communications and automation content both domestically and, increasingly, on export into Southeast Asia where relationships and financing arrangements support it. South Korean capability is developing behind both. Growth of 9.6% sits above the regional market rate, driven by domestic programme expansion rather than by open competitive wins. Most of that figure is simply not addressable by anyone outside it.
Share: 32% | CAGR: 9.6% (2026 to 2036)
Regional intelligence for 5 additional markets available in the complete report: North America, South Asia and Pacific, Middle East and Africa, Eastern Europe, Latin America. Contact sales@marketmindsadvisory.com.
asia-pacific-air-traffic-management-market-country-cagr-analysis-1790026315586

Where Air Traffic Suppliers Earn Margin

System contract value is the visible revenue in this market and rarely where returns are decided. Certification history, support presence and service model choice determine economics instead. The four levers below reflect positions suppliers have used to improve results measurably rather than to win individual competitions. Almost none of it involves better technology. Technology rarely decides.

Accumulate Operational Service Hours Quite Deliberately

Regulators accept an air traffic safety case largely on prior operational history, so installed hours in service are a supplier asset that competitors cannot buy or engineer around. Suppliers with systems running at multiple providers report win rates roughly 2.7 times those of technically comparable competitors without that record. The implication is that early deployments are worth taking at poor margin, because they generate the history that wins the next decade of work. Firms treating first installations as loss leaders have consistently outperformed those pricing them for profit. History cannot be bought at any price.
Market Impact: Competitive win rates run roughly 2.7 times higher

Sell Surveillance As A Service Where Capital Is Scarce

Space-based cooperative surveillance replaces a capital programme with a subscription, which reaches providers whose budgets could never fund radar across ocean or remote terrain. Around 14 regional providers now subscribe, and the model converts a one-time equipment sale into recurring revenue at better margin. The obstacle is institutional rather than financial: providers are accustomed to owning infrastructure and several have found a service they do not control culturally difficult to accept, which is a sales problem rather than a commercial one. It is a selling problem rather than a commercial one.
Market Impact: Converts 14 regional providers onto recurring subscription contracts

Build Regional Support Presence Before Winning Work

Air traffic systems run continuously and a fault is an operational emergency, so providers weigh support response above almost everything in evaluation. Suppliers with engineers and spares resident in the region win competitions that remote support models lose regardless of product merit, and they hold support contract pricing considerably better. Participants with resident regional support report support margin roughly 17 points above those serving from headquarters. The investment precedes the revenue, which is why smaller competitors rarely make it. Smaller competitors rarely fund a presence before they have any revenue at all.
Market Impact: Support contract margin runs roughly 17 points higher

Price Automation As Certified Software, Not Hardware

Certified software engineering is roughly 51% of delivered automation system cost, yet many suppliers still price these platforms against hardware comparators and discount accordingly. Suppliers pricing on safety case value and lifecycle support rather than on equipment content achieve realised prices roughly 23% higher on comparable scope. The argument requires showing a provider what recertification and support actually cost across a thirteen-year life, which is straightforward evidence that surprisingly few suppliers assemble and present properly. Discounting against a hardware comparator simply gives away the value that certification created in the first place.
Market Impact: Realised platform prices run roughly 23% higher overall

Who Controls the Margin Pool

Concentration is 63% for the top five, measured on installed system base and contracted programme value, the basis used throughout this section. Four of the five are European, which is striking in a region manufacturing most of the world's electronics, and the explanation is certification rather than technology. A safety case accepted largely on prior operational history is a barrier that accumulated hours build and money cannot shortcut at any speed.
Competition currently turns on three dimensions. Operational service history decides whose safety case a regulator will accept without extended assessment. Regional support presence decides who wins where providers weigh fault response above product specification, which is most of them. And service model flexibility decides who can reach providers whose budgets cannot fund capital infrastructure. Technical capability is assumed rather than differentiating in most evaluations.

Positions will shift slowly and from below. Indian and Australian suppliers hold genuine capability and are accumulating the service history that has excluded them, while Chinese domestic supply grows within a market nobody else can enter. The clearest opening for challengers is space-based and service-model surveillance, where no incumbent has decades of history because the technology itself is recent.
asia-pacific-air-traffic-management-market-company-positioning-matrix-1790026316102

Competitive Moat and Risk Dimensions

THALES

Moat: Broadest Installed Automation Base

Thales holds air traffic automation systems in operational service with more providers worldwide than any competitor, which matters because regulators accept a safety case largely on accumulated operational history. Each additional deployment strengthens the record supporting the next, and no competitor can buy that history at any price or compress the years required to build it.
THALES

Risk: Regional Cost Base Disadvantage

European engineering cost sits well above Indian, Chinese and increasingly Southeast Asian alternatives, and certified software is roughly half of delivered system cost. As regional suppliers accumulate the service history that currently excludes them, the certification barrier narrows while the cost gap remains, which is an uncomfortable direction over a decade.
NEC CORPORATION

Moat: Regional Relationship And Financing Depth

NEC combines air traffic systems capability with long-standing relationships and financing arrangements across Southeast Asia that European competitors cannot easily replicate. Japanese development financing has supported regional infrastructure for decades, and supplier selection often follows those relationships rather than open competition, which is a position built over a very long period.
NEC CORPORATION

Risk: Narrow Export Automation Position

The company's automation platform positions outside Japan and a handful of relationship markets remain limited, and the certification history that opens other doors is accumulated through exactly those deployments. Growing beyond relationship-based markets means competing on service record against European suppliers who spent thirty years assembling one across dozens of providers.

Players Tracked

Prominent Players

Thales
Indra Sistemas
Leonardo
Frequentis
NEC Corporation

Other Key Players

RTX
Northrop Grumman
Honeywell Aerospace
Collins Aerospace
Searidge Technologies
Saab
HAVELSAN
Toshiba
Mitsubishi Electric
Aviation Industry Corporation of China
China Electronics Technology Group
Bharat Electronics
Adacel Technologies
Aireon
Intelcan Technosystems

Recent Developments

MARCH 2025

Regional providers agree bilateral data sharing across adjoining information regions

Several Asia Pacific air navigation providers agreed bilateral flight data sharing arrangements covering adjoining information regions, reducing coordination requirements at boundaries. These were inter-agency agreements rather than corporate transactions, and they address the constraint that equipment procurement has consistently and expensively failed to resolve anywhere in the region.
Signal: Bilateral agreements attack the boundary problem that no supplier has ever been able to sell against
OCTOBER 2024

Island state provider commissions remote tower service across regional airports

An archipelagic state's air navigation provider brought remote tower operation into service across several low-traffic regional airports, consolidating control into a central facility. This was an operational commissioning rather than a corporate event, and it addresses controller shortages alongside the cost of staffing very quiet towers.
Signal: Archipelagic geography gives this region the strongest remote tower case found anywhere in the world today
JANUARY 2025

Further regional providers subscribe to space-based cooperative surveillance

Additional Asia Pacific providers contracted space-based cooperative surveillance services covering oceanic and remote airspace previously managed procedurally. These were multi-year service contracts rather than equipment purchases of any kind, and they mark a real shift from owned infrastructure toward subscribed capability across the whole region.
Signal: Subscribed capability rather than owned infrastructure is a genuine model change for conservative provider organisations to accept

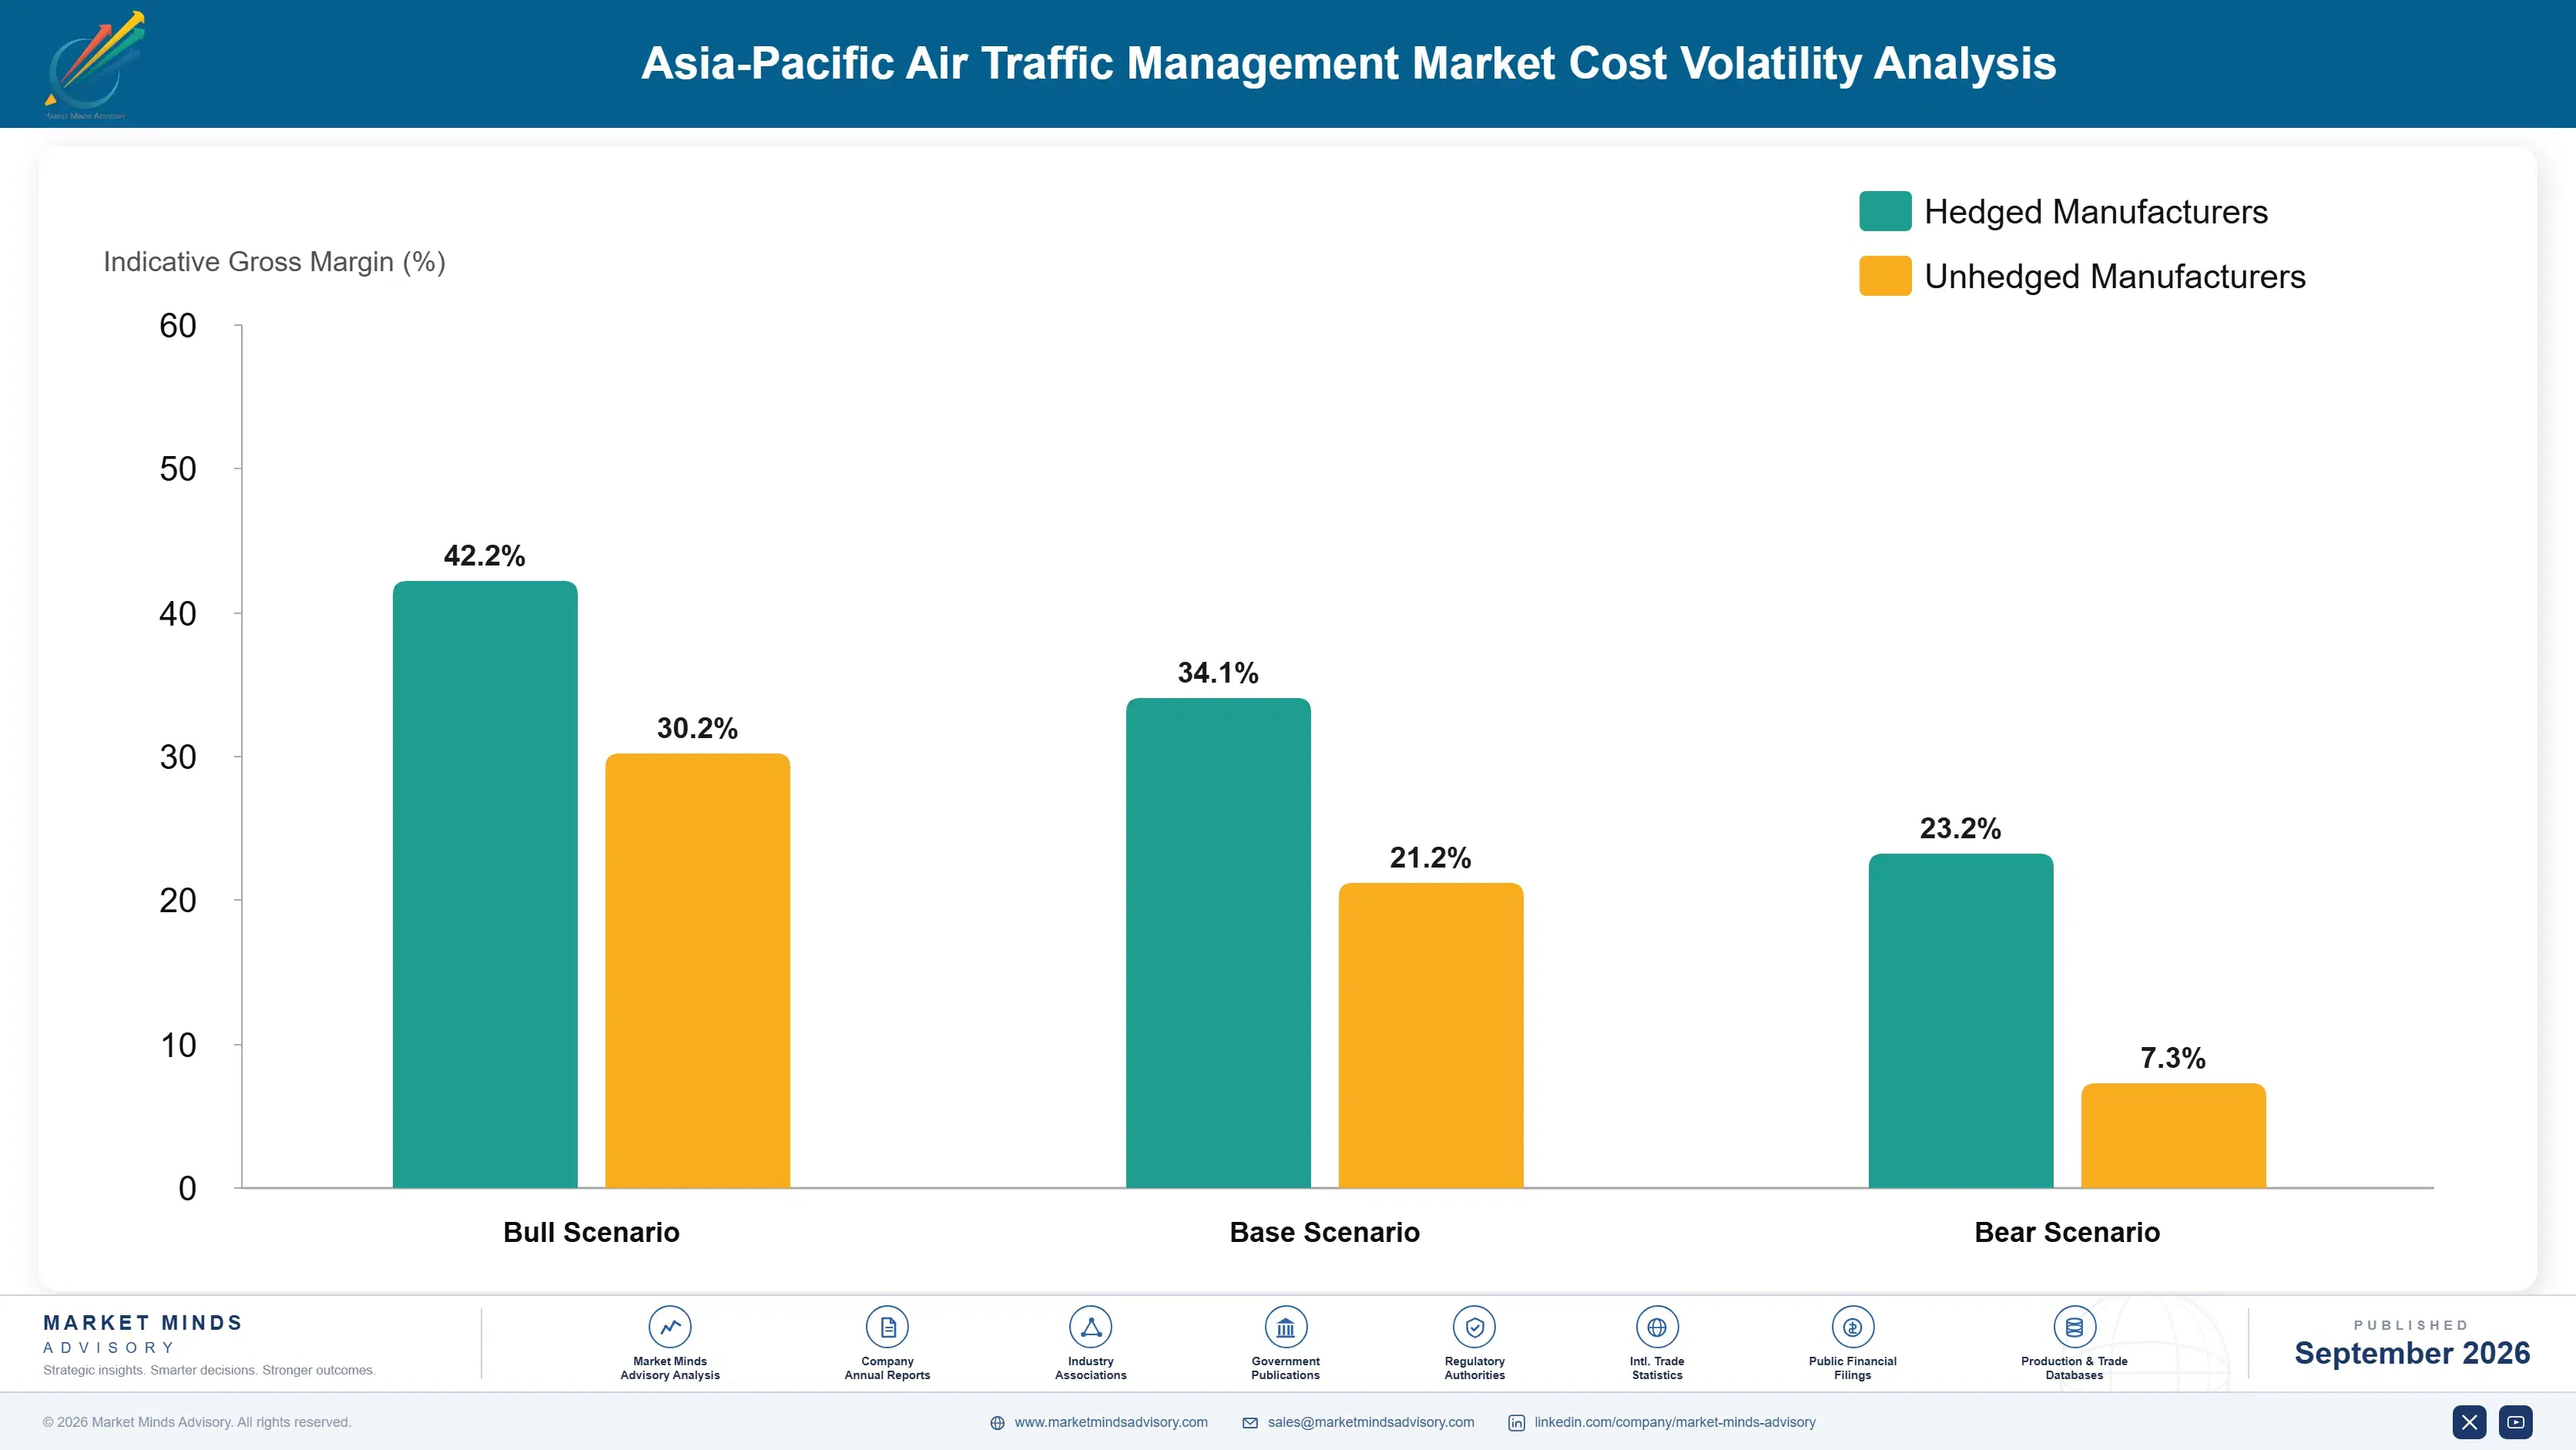
What Sets Delivered System Cost

Certified software dominates. Safety-certified engineering runs roughly 51% of delivered automation system cost, radio frequency and transmit hardware about 17%, computing and display hardware close to 14%, and installation with site works and commissioning the remaining 18%. Certified engineering labour sits in Europe, North America and increasingly India, while radio frequency and computing content depends on globally sourced semiconductors.
Radio frequency components were the recent constraint. China's Ministry of Commerce export licensing on gallium from 2023 tightened supply of the devices behind radar and communications transmit hardware, and semiconductor lead times extended sharply from 2022 as SEMI data records. Thales and Indra both discussed supply conditions in annual reporting. Programme delivery slipped on component availability rather than on cost, which matters more when a provider has scheduled an operational cutover.

Exposure divides by what a supplier actually sells. Radar and communications suppliers carry semiconductor and transmit hardware risk directly. Automation suppliers carry certified engineering labour instead, which is rising faster than component cost and is far harder to source, since safety-certified software engineers are scarce everywhere. Suppliers moving certified development to India have improved that position materially while competitors have absorbed European labour rates in full.
asia-pacific-air-traffic-management-market-cost-volatility-analysis-1790026316298

Move certified software development to lower-cost engineering centres

Certified engineering is over half of delivered automation cost and the scarcest input, and Indian centres now hold genuine safety-certified capability at rates well below European equivalents. Suppliers establishing those centres early hold a cost position competitors cannot match quickly. Building certified capability takes years of process maturity and audited evidence, which is why it is not available on demand.

Qualify second-source transmit devices ahead of any shortage

Gallium-based devices sit behind radar and communications transmit hardware, and export licensing made single-source dependency expensive after 2023. Qualifying alternatives costs test time and, on certified systems, repeats approval work. Suppliers who did it before the controls tightened held delivery schedules while competitors renegotiated cutover dates with providers who had already scheduled operational transitions around them.

Shift automation pricing from hardware comparison to lifecycle value

Pricing a certified automation platform against hardware comparators invites discounting on the wrong basis, since software and safety case work carry most of the cost and all of the risk. Presenting recertification and support cost across a thirteen-year life changes the conversation and defends price. The evidence required is straightforward and most suppliers have not assembled it usefully.

Portfolio Architecture for Margin Defence

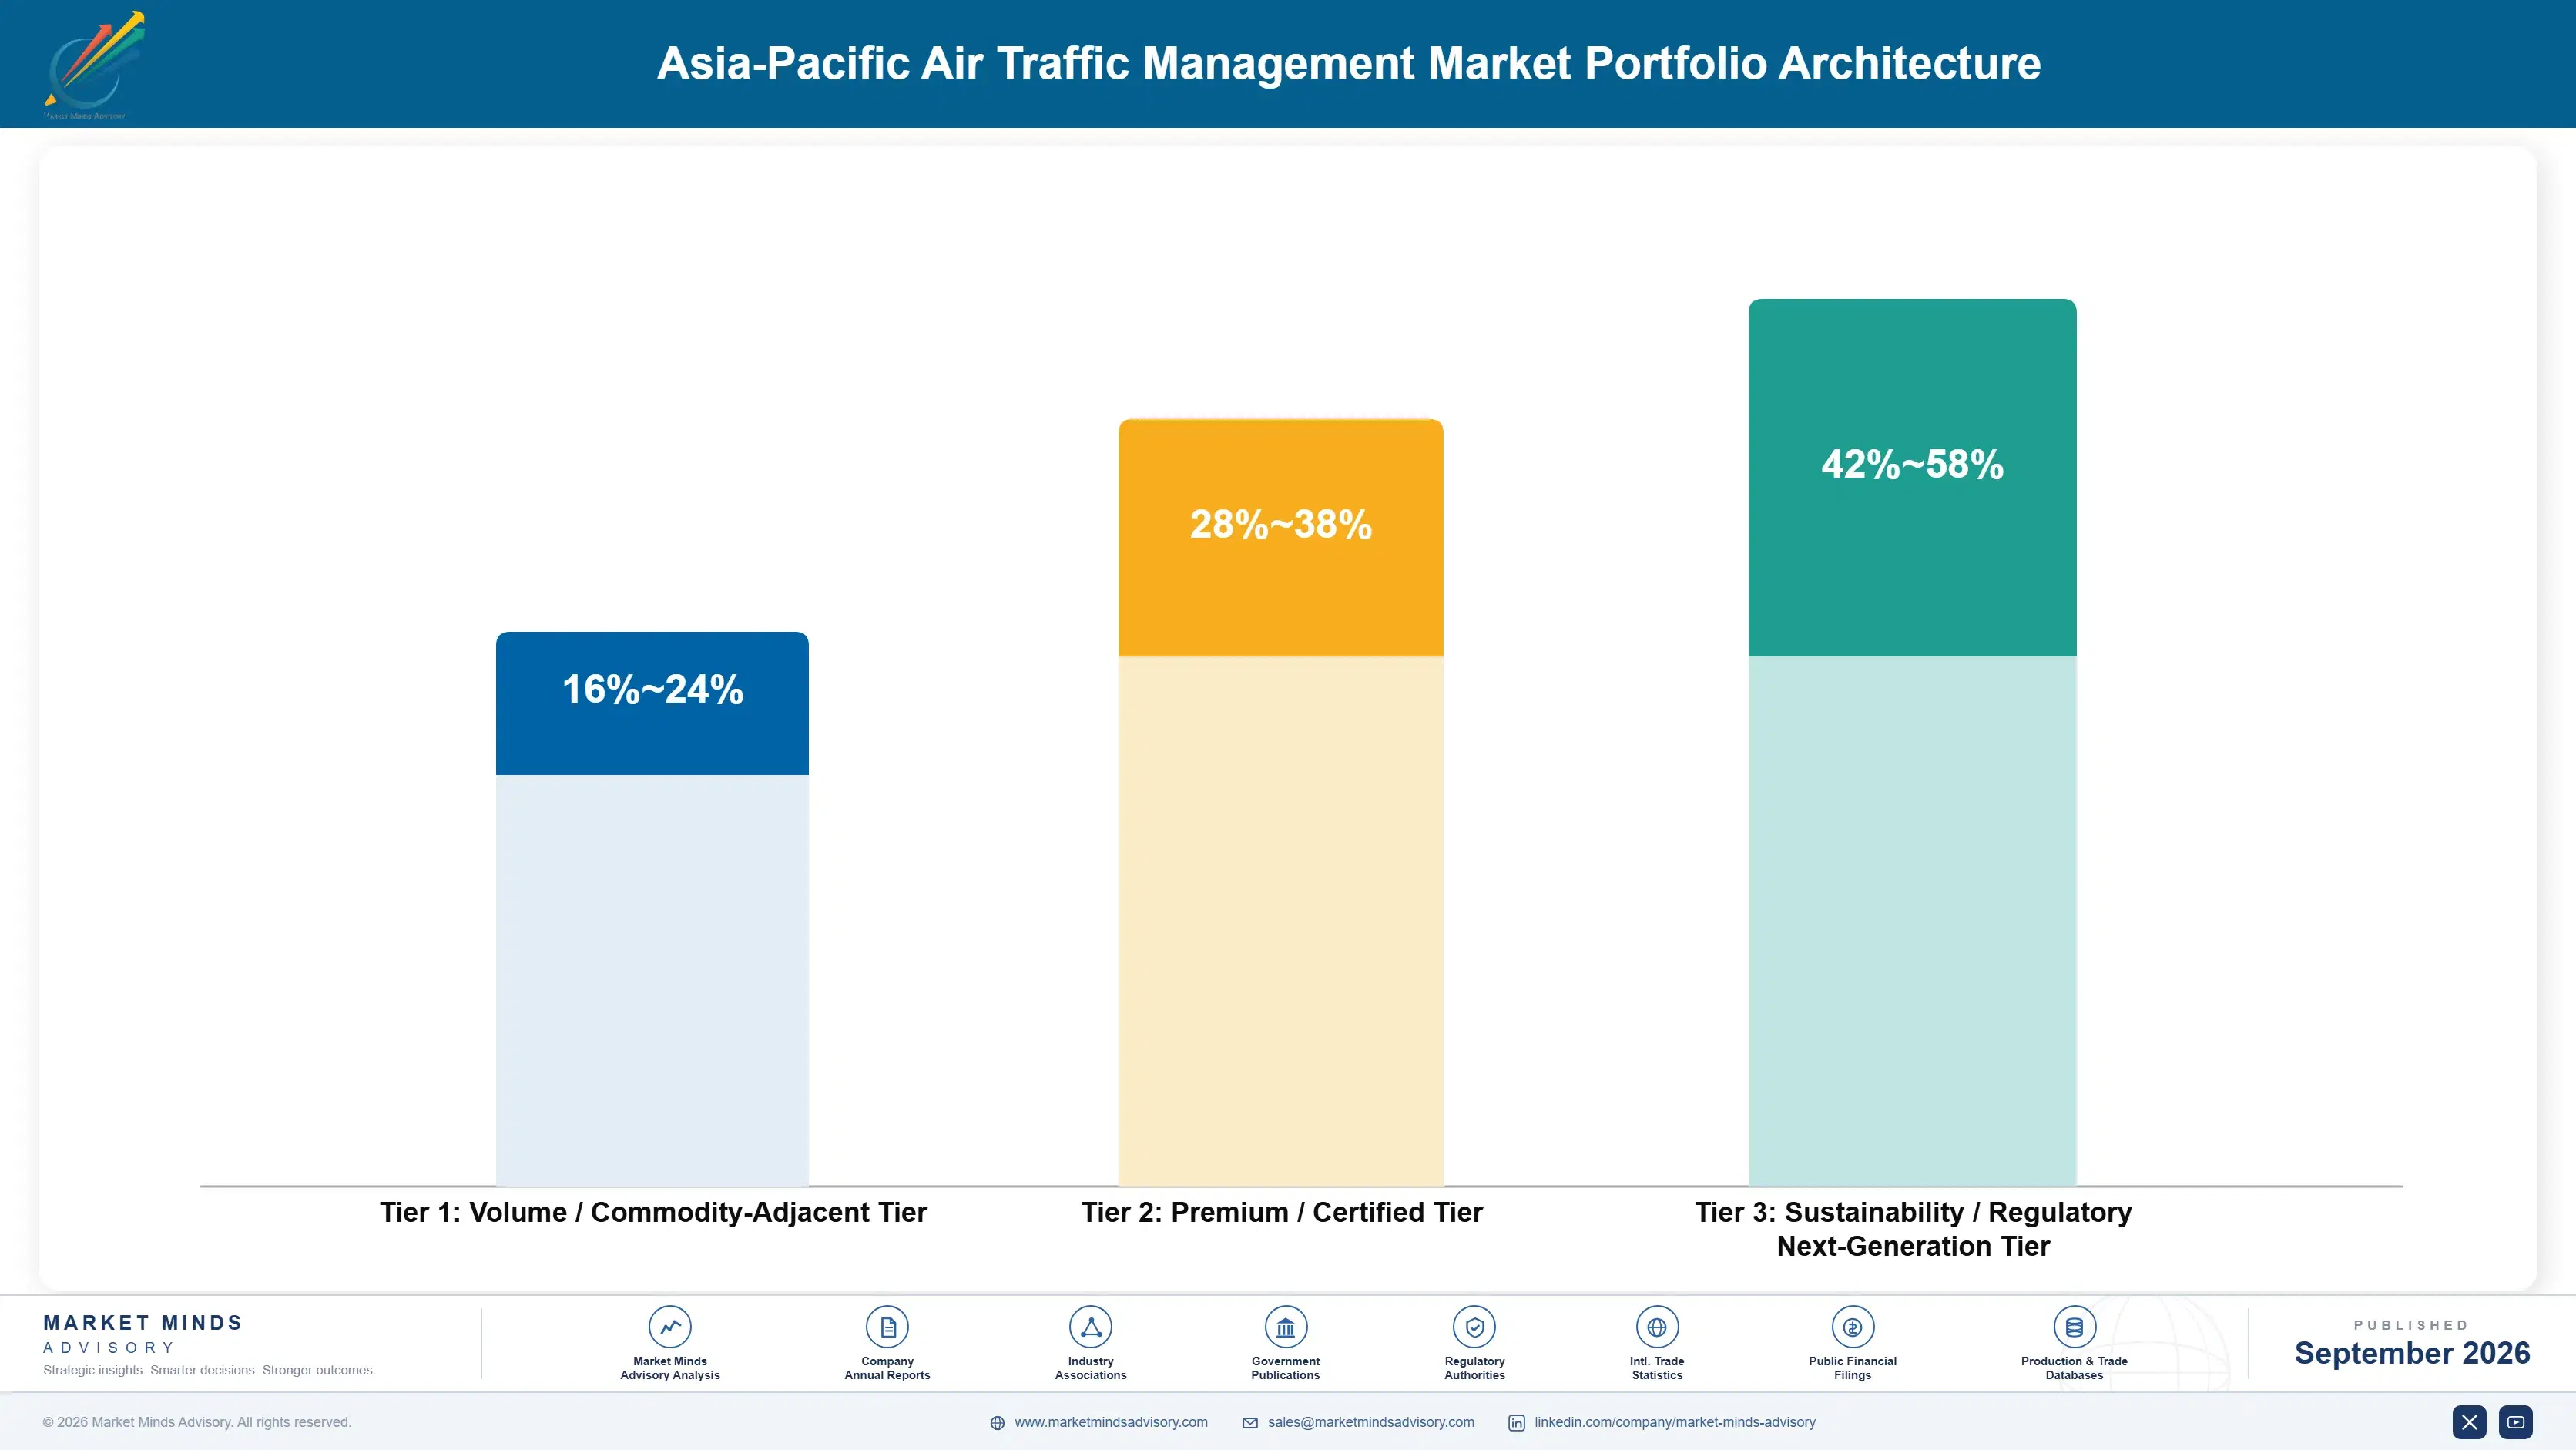
Margin architecture here sorts by how much certification a product carries. Navigation aids and communications hardware sit at the bottom, competed against published specifications by many qualified suppliers. Surveillance systems and tower automation sit in the middle, defended by installation complexity and support requirements. Certified automation platforms and subscribed surveillance services sit at the top, the first on safety case scarcity and the second on a model providers cannot replicate themselves.
The volume-versus-premium tension follows certification depth. Volume means navigation aids, communications and radar hardware, where competition is real and price matters. Premium means automation platforms where a handful of suppliers hold accepted safety cases, and subscribed services where the supplier owns infrastructure the provider never will. Moving from the first to the second takes years of accumulated operational hours, which is why the supplier field has changed so little in two decades.

High-value pools concentrate in three places: certified automation platforms where safety case history limits competition to very few, subscribed surveillance services carrying recurring revenue at better margin than equipment, and regional support contracts where resident presence commands pricing that remote support cannot approach.

Volume / Commodity-Adjacent Tier

Navigation aids, landing systems and communications hardware competed against published specifications by many qualified suppliers. Component cost carried under fixed-price terms. The eight point range reflects whether a supplier manufactures the hardware itself or integrates purchased equipment.
Gross Margin: 16-24%

Premium / Certified Tier

Surveillance radar systems, tower automation and integration work where installation complexity and support requirements narrow the field. The ten point range tracks regional support presence, which changes both win rates and the pricing a supplier can hold on the support contract.
Gross Margin: 28-38%

Sustainability / Regulatory / Next-Generation Tier

Certified automation platforms, subscribed surveillance services and remote tower capability. Safety case scarcity and service model advantage rather than cost set pricing. The sixteen point range spans a licensed software business and a subscription service with genuinely different economics.
Gross Margin: 42-58%
asia-pacific-air-traffic-management-market-portfolio-architecture-1790026316795

High-value Sub-segments and Strategic Watch-out

Subscribed Surveillance Services

Recurring revenue at better margin than equipment, reaching roughly 14 regional providers whose budgets could never fund radar over ocean or remote terrain. Institutional resistance to not owning infrastructure is the barrier. The twelve point range reflects how differently coverage tiers are priced across provider sizes.
Gross Margin: 46-58%

Certified Automation Platforms

Largest contracts and the highest barrier, with certified software at roughly 51% of delivered cost and safety case history limiting competition to very few suppliers. Refresh runs on a thirteen-year cycle. The twelve point range reflects whether development sits in European or lower-cost certified engineering centres.
Gross Margin: 38-50%

Regional Support Contracts

Recurring revenue running roughly 17 points better for suppliers with resident regional engineers and spares than for those serving from headquarters. Providers weigh fault response above almost everything else. The ten point range reflects how much presence a supplier actually maintains within the region itself rather than nominally.
Gross Margin: 34-44%

Navigation Aids And Landing Systems

The most competed part of the market, growing at 6.1% on airport construction rather than on modernisation, with many qualified suppliers bidding published specifications. Margin is thin and component cost is carried directly by the supplier. Several suppliers treat this purely as access to the wider provider relationship.
Gross Margin: 16-24%

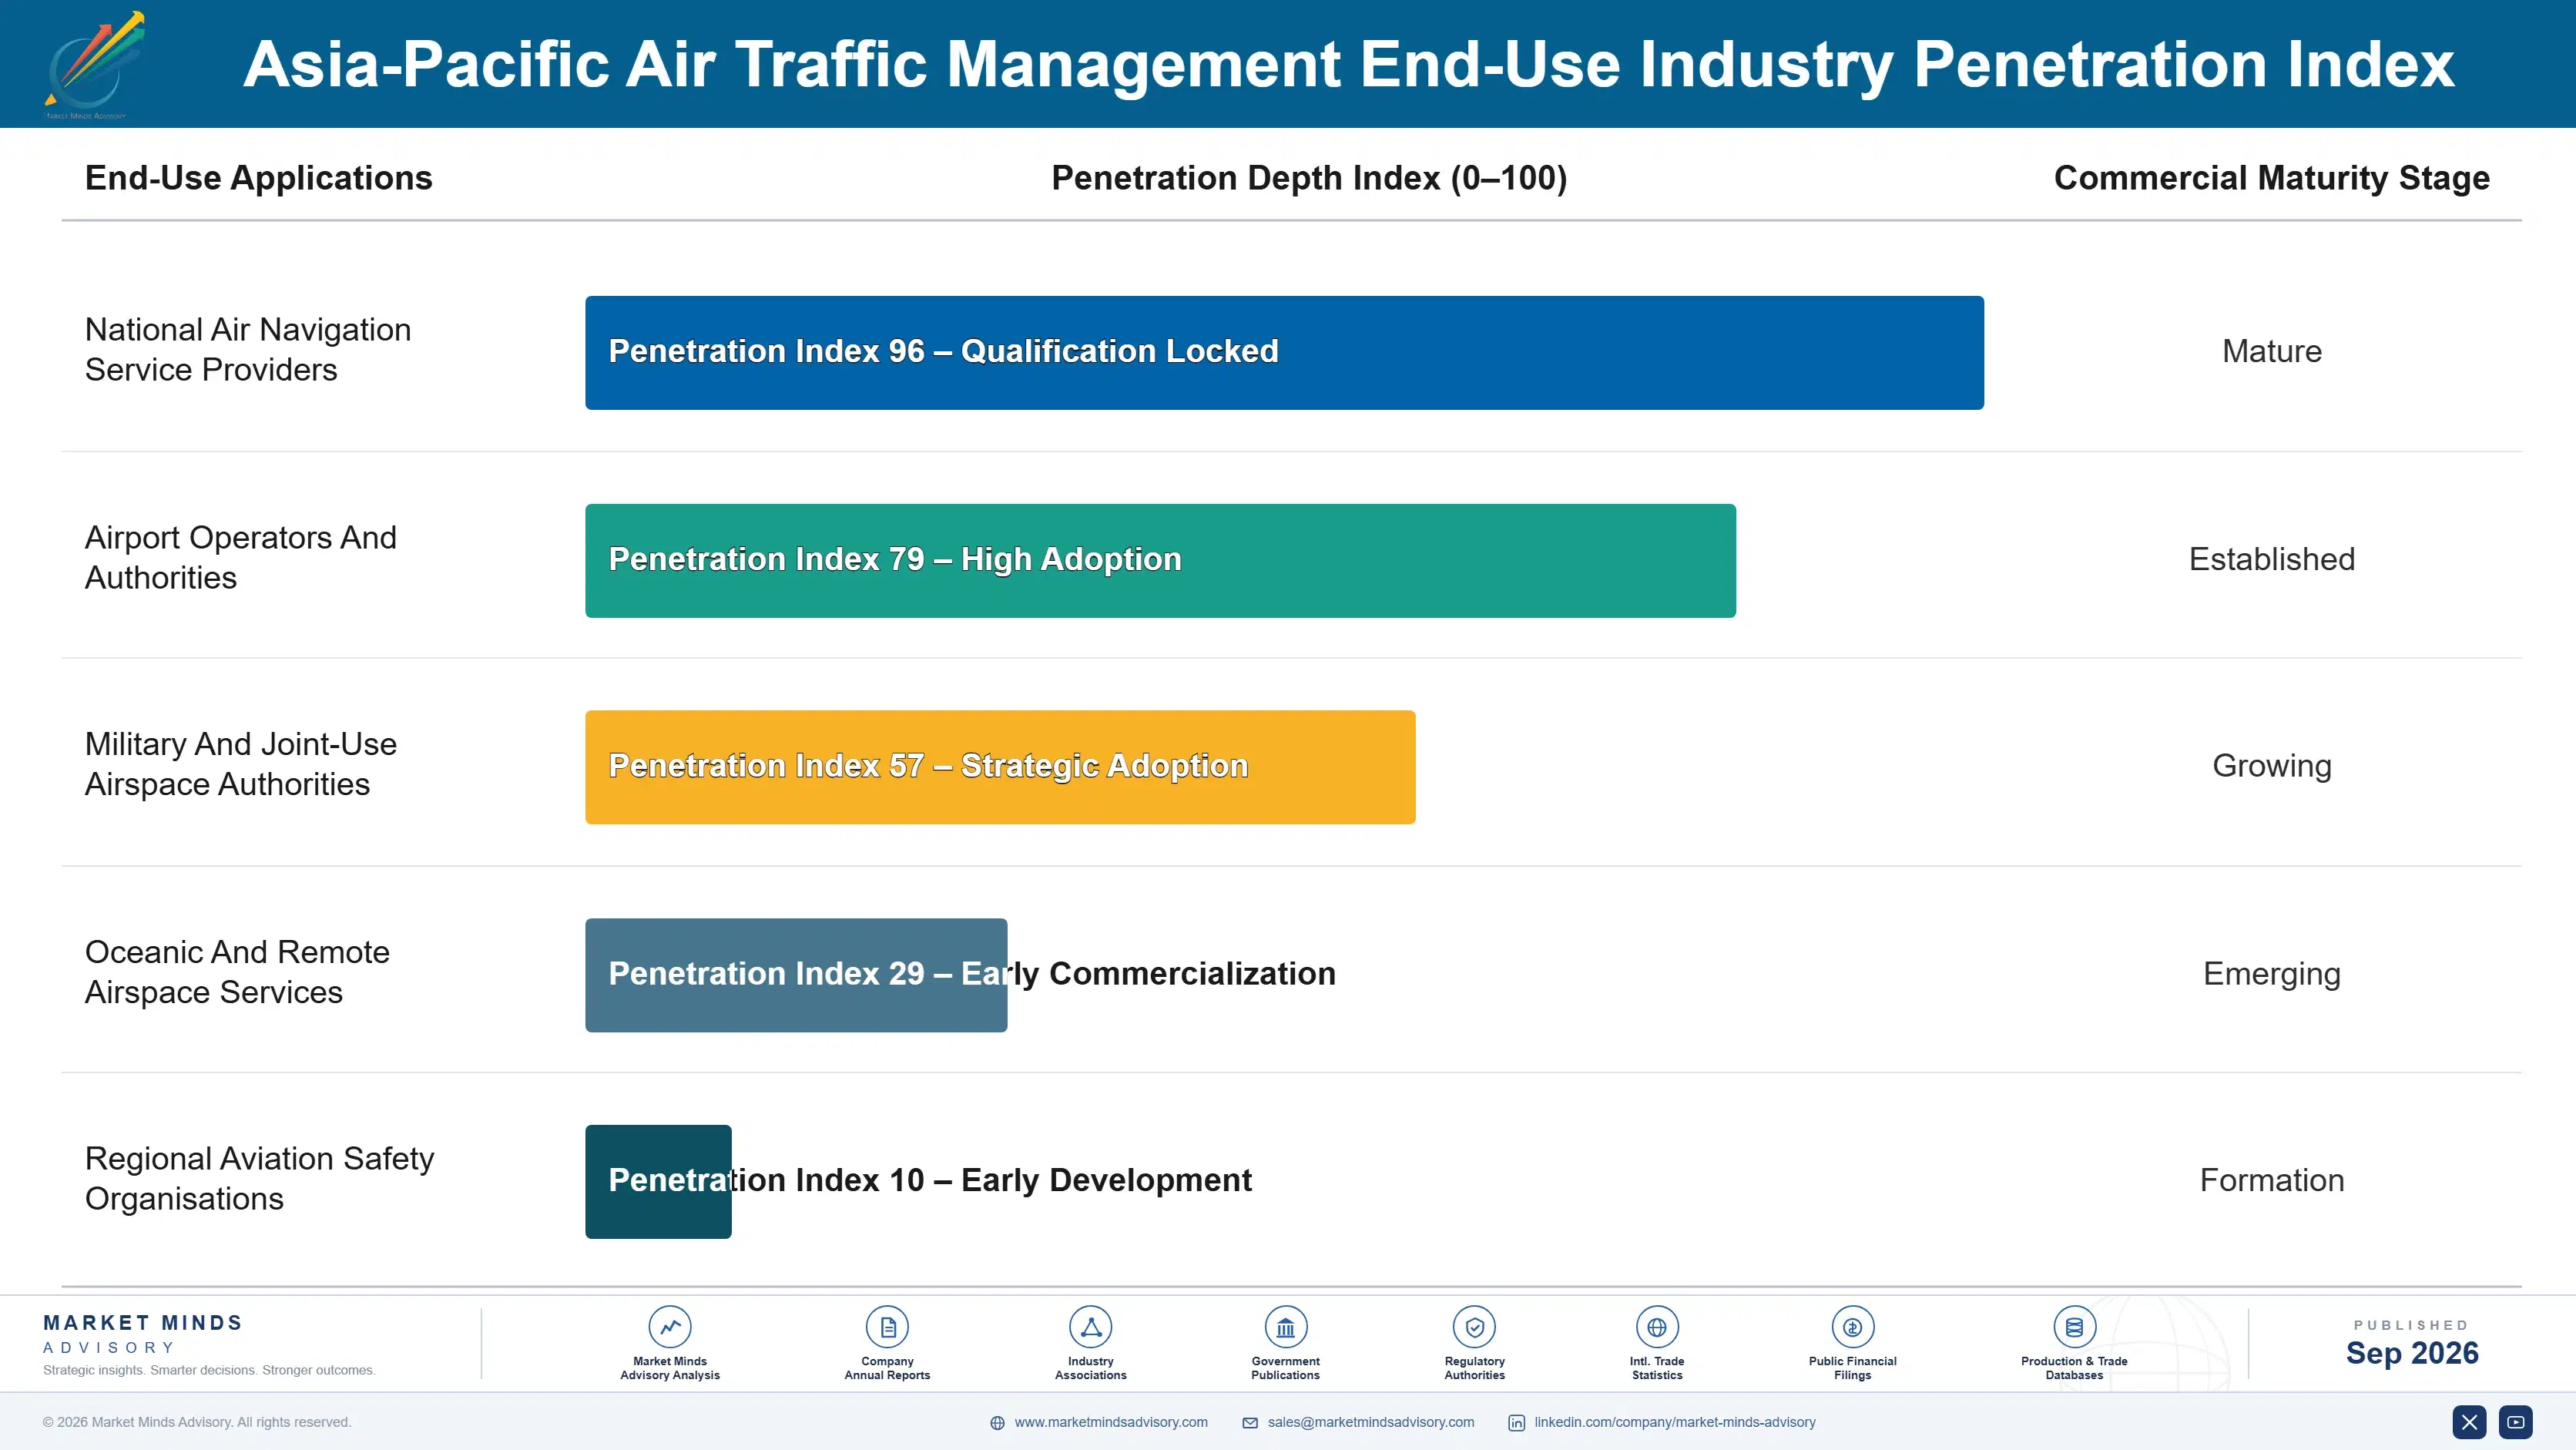
What Providers Fund Continuously

The annuity here is support and recertification rather than replacement. An automation platform runs for around thirteen years and requires continuous software maintenance, recertification against evolving requirements and twenty-four hour support throughout, because a system failure is an operational emergency rather than an inconvenience. Across a system life that recurring revenue typically exceeds the original contract value, and it accrues to the supplier who built the safety case rather than to whoever offers better support terms.
Adoption depth varies enormously by provider. Large national providers with dense airspace fund the complete programme, including automation, surveillance, tower systems, simulation and continuous upgrade, because capacity pressure makes the case obvious. Mid-sized providers buy surveillance and automation on long cycles and defer everything else. Small island and developing-state providers buy navigation aids and, increasingly, subscribed surveillance, because that is what fits a budget measured in single-digit millions.

The decision maker has changed less here than in most markets. Air traffic systems are still specified by technical and safety staff assessing certification evidence, and that conservatism is entirely rational given the consequences. What has changed is that finance functions now question whether equipment purchases deliver the capacity that justified them, which is overdue.
asia-pacific-air-traffic-management-market-end-use-penetration-index-1790026317288

Where Suppliers Should Concentrate

These are among the four positions where our research anticipates prominent divergence between winners and laggards over the coming forecast period. Each is grounded in the demand model, the regulatory perimeter, and the announced capacity pipeline.
01 / SERVICE HISTORY ACCUMULATION

Take early deployments cheaply to build the safety case record

Regulators accept an air traffic safety case largely on prior operational history, which makes installed service hours an asset no competitor can buy or engineer around at any price. Suppliers with systems running at multiple providers report win rates roughly 2.7 times those of technically comparable competitors lacking that record. The implication is uncomfortable but clear: early deployments are worth taking at poor margin, because they generate the history that wins the following decade of far more profitable work later.
02 / REGIONAL PRESENCE INVESTMENT

Put engineers and spares in the region before you win anything

Air traffic systems run continuously and any fault is an operational emergency, so providers weigh support response well above product specification in very nearly every evaluation they conduct. Suppliers holding resident regional engineers and spares win competitions that remote support models lose regardless of technical merit, and they report support contract margin roughly 17 points above those serving from headquarters. The investment necessarily precedes any of the revenue, which is exactly why so many smaller competitors never make it at all.
03 / SERVICE MODEL FLEXIBILITY

Sell subscribed capability to providers who cannot fund infrastructure

Space-based cooperative surveillance replaces a capital programme with a subscription and reaches providers whose budgets could never fund radar across ocean or remote terrain, with roughly 14 regional providers already subscribing to it. The model converts one-time equipment revenue into recurring revenue at better margin. The obstacle is institutional rather than financial, since providers accustomed to owning their infrastructure find a service they do not control difficult to accept, which makes this a selling problem rather than a product one entirely.
04 / AUTOMATION PRICING BASIS

Price the safety case, not the equipment in the rack

Certified software engineering is roughly 51% of delivered automation cost, yet many suppliers still price these platforms against hardware comparators and then discount heavily on that basis. Those pricing instead on safety case value and lifecycle support achieve realised prices roughly 23% higher on comparable scope. The argument requires showing a provider what recertification and support actually cost across a thirteen-year system life, which is straightforward evidence that surprisingly few suppliers in this market have ever assembled properly at all.

Engagement Snapshot From the Field

A live engagement with an industry participant carrying material or product regulatory and market exposure ahead of a defining policy shift, showing how our research translates into a defensible multi-year portfolio strategy.
MARKET MINDS ADVISORY · CLIENT ENGAGEMENT SUMMARY
Asia-Pacific Air Traffic Management Producer Strategic Portfolio Review and Transition Roadmap 2026·Investment Scenario on Asia-Pacific Air Traffic Management Exposure Evaluation 2025-26
CLIENT PROFILE
A Southeast Asian air navigation service provider managing a busy information region with roughly USD 380 million in annual revenue (client-reported, unverified by MMA). The organisation had completed a substantial surveillance and automation modernisation programme three years earlier and had seen almost no improvement in delay performance, with political and airline pressure mounting as a result.
STRATEGIC CHALLENGE
Management assumed the modernisation had underdelivered and was preparing a further procurement. Delay analysis pointed elsewhere entirely: the great majority of accumulated delay originated at boundaries with adjoining providers and within airspace reserved for military use, neither of which any equipment purchase could address. The board needed to know whether further investment would change anything at all.
MMA APPROACH
MMA decomposed delay by cause across two years of operational data, separating sector capacity limits from boundary coordination and airspace reservation effects, then modelled achievable capacity under three options: further equipment investment, bilateral coordination agreements, and flexible airspace use negotiation. Expert interviews with adjoining providers established what coordination arrangements were realistically achievable.
KEY FINDINGS
  1. Boundary coordination and reserved airspace together accounted for roughly 71% of accumulated delay, against sector capacity limits that further equipment could genuinely address.
  2. The completed modernisation had delivered the sector capacity improvement it promised, which meant the programme succeeded while the delay problem it was bought to solve continued unchanged.
  3. Bilateral data sharing with two adjoining providers modelled more delay reduction than the entire proposed further procurement, at a fraction of one percent of its cost.
  4. Flexible airspace use negotiation was assessed as achievable on two of four reserved blocks, having never been formally pursued by the organisation at any point.
CLIENT PROFILE
A Southeast Asian air navigation service provider managing a busy information region with roughly USD 380 million in annual revenue (client-reported, unverified by MMA). The organisation had completed a substantial surveillance and automation modernisation programme three years earlier and had seen almost no improvement in delay performance, with political and airline pressure mounting as a result.
STRATEGIC CHALLENGE
Management assumed the modernisation had underdelivered and was preparing a further procurement. Delay analysis pointed elsewhere entirely: the great majority of accumulated delay originated at boundaries with adjoining providers and within airspace reserved for military use, neither of which any equipment purchase could address. The board needed to know whether further investment would change anything at all.
MMA APPROACH
MMA decomposed delay by cause across two years of operational data, separating sector capacity limits from boundary coordination and airspace reservation effects, then modelled achievable capacity under three options: further equipment investment, bilateral coordination agreements, and flexible airspace use negotiation. Expert interviews with adjoining providers established what coordination arrangements were realistically achievable.
KEY FINDINGS
  1. Boundary coordination and reserved airspace together accounted for roughly 71% of accumulated delay, against sector capacity limits that further equipment could genuinely address.
  2. The completed modernisation had delivered the sector capacity improvement it promised, which meant the programme succeeded while the delay problem it was bought to solve continued unchanged.
  3. Bilateral data sharing with two adjoining providers modelled more delay reduction than the entire proposed further procurement, at a fraction of one percent of its cost.
  4. Flexible airspace use negotiation was assessed as achievable on two of four reserved blocks, having never been formally pursued by the organisation at any point.
RECOMMENDED STRATEGY
Phase 1: Phase 1 (six months): Pause the further procurement and open formal bilateral coordination discussions with the two highest-delay adjoining providers. Phase 2: Phase 2 (15 months): Pursue flexible airspace use arrangements on the two reserved blocks assessed as realistically achievable in negotiation. Phase 3: Phase 3 (24 months): Rebuild the capacity investment case around measured delay causes rather than around equipment generation and age.
OUTCOME
The provider deferred the procurement and concluded one bilateral data sharing agreement within fourteen months, delivering measurable delay reduction at negligible capital cost (client-reported, unverified by MMA). Flexible use negotiations opened on one reserved block, and the capacity investment case now distinguishes what equipment can deliver from what it cannot.

Frequently Asked Questions

Foundational context covering the market sizes, CAGR, scope, country, region and competition that inform every finding below. This section is provided to cover basics and most often pre-purchase conversations, answered from the MMA Primary Research Dataset.

What is the current size of the Asia-Pacific Air Traffic Management Market?

The market was worth USD 4.8 billion in 2025 and reaches USD 5.2 billion in 2026. That covers surveillance, automation, communications, navigation aids and tower systems procured by regional air navigation providers.

How large will the Asia-Pacific Air Traffic Management Market be by 2036?

MMA forecasts USD 11.9 billion by 2036, an increase of USD 6.7 billion over the 2026 base. That represents an expansion multiple of 2.29 times across the forecast period.

What is the CAGR for the Asia-Pacific Air Traffic Management Market 2026 to 2036?

The base case CAGR is 8.6%, with a bull case of 9.9% if cross-border data sharing makes regional flow management fundable. The bear case of 7.3% assumes boundaries remain and budgets tighten.

Which segment is growing fastest?

Cooperative and space-based surveillance grows at 12.9%, half again the market rate of 8.6%. It makes ocean and remote terrain observable for a subscription rather than a capital programme providers cannot fund.

Who are the major companies in the Asia-Pacific Air Traffic Management Market?

Thales, Indra Sistemas, Leonardo, Frequentis and NEC Corporation lead on installed system base and contracted programme value. RTX, Northrop Grumman, Saab and Bharat Electronics follow.

Which country is growing fastest?

Within this region-scoped report, India leads at 12.4%, driven by traffic growth outpacing airspace capacity alongside a substantial airport construction programme. Countries outside Asia Pacific are assessed only as supply sources.

Report Segmentation Architecture

The full report scope spans multiple orthogonal segmentation dimensions, with cross-tabulated demand data provided for each dimension pair. Coverage extends further to regional breakdowns, trend trajectories, and the competitive detail needed to support segment-level decision-making.

By System Element

  • Surveillance Radar Systems
  • Cooperative And Space-Based Surveillance
  • ATM Automation And Flight Data Systems
  • Communications And Datalink Systems
  • Navigation Aids And Landing Systems
  • Tower And Remote Tower Systems

By End-Use Industry

  • National Air Navigation Service Providers
  • Airport Operators And Authorities
  • Military And Joint-Use Airspace Authorities
  • Oceanic And Remote Airspace Services
  • Regional Aviation Safety Organisations

By Commercial Dimension

  • Capital System Procurement
  • Subscribed Service Contract
  • Support And Recertification Agreement
  • Airport Construction Bundled Content

By Region

  • Western Europe
  • East Asia
  • North America
  • South Asia and Pacific
  • Middle East and Africa
  • Eastern Europe
  • Latin America

Scope, Methodology, and Coverage

Every figure in this report is reproducible from documented input assumptions. The scope below maps the historical period, the forecast horizon, the segmentation dimensions, and the countries covered, alongside the underlying primary and qualitative methodology.
Historical Period
2020 to 2025
Forecast Period
2026 to 2036
Base Year
2025 (USD billions; MMA Primary Research Dataset, September 2026)
Market Definition
This report covers air traffic management systems procured by air navigation service providers and airport operators across Asia Pacific. Scope includes surveillance radar systems, cooperative and space-based surveillance, air traffic management automation and flight data systems, communications and datalink systems, navigation aids and landing systems, and tower or remote tower systems, together with associated support and recertification. Excluded are airport surface movement guidance systems, airborne avionics, military air defence command and control, airport terminal and runway construction, provider operating costs, and separately sold controller training services.
Quantitative Units
USD billions (current prices); installed system counts; contracted programme value; provider counts by country
Segmentation Dimensions
By System Element; By End-Use Industry; By Commercial Dimension; By Region
Regions Covered
Western Europe, East Asia, North America, South Asia and Pacific, Middle East and Africa, Eastern Europe, Latin America
Countries Covered
China, India, Japan, South Korea, Australia, Singapore, Indonesia, Malaysia, Thailand, Vietnam, Philippines, New Zealand, Taiwan, Hong Kong, Bangladesh, Sri Lanka, Cambodia, Myanmar, Papua New Guinea, Fiji, with system and component supply origin also assessed across France, Spain, Italy, Austria, Sweden, Germany, the USA, Canada, Israel, Turkey, Czech Republic, Poland and Brazil
Key Companies Profiled
Thales, Indra Sistemas, Leonardo, Frequentis, NEC Corporation, RTX, Northrop Grumman, Honeywell Aerospace, Collins Aerospace, Searidge Technologies, Saab, HAVELSAN, Toshiba, Mitsubishi Electric, Aviation Industry Corporation of China, China Electronics Technology Group, Bharat Electronics, Adacel Technologies, Aireon, Intelcan Technosystems
Quantitative Methodology
Primary survey, n=3,800 respondents, Q4 2025, six countries; demand-side model with trade association cross-validation
Qualitative Methodology
47 expert interviews, Q4 2025; applied to validate demand model assumptions, identify emerging dynamics, and assess competitive positioning
Report Format
PDF and XLSX data workbook (Word format preview document)
Publisher
Market Minds Advisory
Report Code
MMA-2026-TEC-920
Published
September 2026
Contact
sales@marketmindsadvisory.com | www.marketmindsadvisory.com

Purchase the full Asia-Pacific Air Traffic Management Market Report (2026 to 2036).

The full report sizes Asia Pacific air traffic management across six system elements with installed counts and programme values behind every figure, and assesses where the systems serving regional providers are manufactured. It separates addressable demand from closed domestic markets throughout, because roughly two fifths of regional demand cannot be bid for and sizing on traffic growth badly overstates the opportunity. Competitive analysis covers 20 participants on installed base and contracted value, including operational service history by system type. Airspace fragmentation and reserved airspace are quantified as capacity constraints, since they determine what any equipment purchase can actually deliver. Support and recertification economics are modelled across a full system life.
Six-element sizing with installed counts and values
Addressable demand separated from closed domestic markets
Operational service history mapped by supplier
Boundary and reserved airspace constraints quantified
Support and recertification economics across system life
Subscribed service model economics assessed separately

Built For The People Who Decide

From boardroom strategy to bench-side execution, this report is read cover-to-cover by leaders shaping the next decade of their industry, turning demand scenarios, market dynamics and valuation benchmarks into decisions.
CXOs/ Presidents/ VPs/ Managers
M&A and Corporate Development
Strategy Teams and R&D Heads
Procurement and Product Directors
Regulatory and Compliance Leaders
Investor Relations and Equity Analysts