Market Minds Advisory
Artificial Preservative Market

Artificial Preservative Market: Clean-Label Pressure and Regulatory Reformulation Economics

Clean-label reformulation and tightening food additive regulation are compressing synthetic preservative demand in wealthier markets even as packaged food manufacturing expansion across emerging economies keeps global volume growing steadily overall.

Lead Analyst

Lisa Gevelber

Published

September 2026

Make Smarter Decisions with Customized Research Insights

Request a free sample report and evaluate market opportunities, growth trends, and competitive dynamics relevant to your business needs.

2025 MARKET VALUE$2.8BMarket Size 2025
2036 FORECAST VALUE$4.0BBase Case , 2026 to 2036
CAGR 2026 TO 20363.4 %Bull 4.6% / Bear 2.2%
INCREMENTAL OPPORTUNITY$1.1BNet 10- year value creation
EXPANSION MULTIPLE1.40x2036 value over 2026 base
Strategic Levers
M&A Pipeline
Regional Outlook
Country Rankings
Competitive Intelligence
Segmental Deep-dive
Call-Us : 91 93563 13602

Executive Snapshot and Market Trajectory

Clean-label reformulation is pulling synthetic preservative volume out of premium packaged food in wealthy markets even as rising packaged food manufacturing across emerging economies keeps global demand growing, splitting the category into two distinct trajectories that rarely show up in a single blended growth number.
Sorbates are gaining the fastest share as formulators favor them over parabens and nitrites, both facing heavier regulatory and consumer scrutiny alike. Meat processing remains the largest single application by volume, since nitrites have no fully proven synthetic substitute at commercial scale. East Asia now anchors both preservative manufacturing capacity and packaged food consumption growth, while North America still commands the single largest developed-market volume base despite years of reformulation pressure from major retailers.
Eastman Chemical and Corbion lead through integrated chemical production scale that smaller regional formulators cannot easily match on cost, leaving mid-tier suppliers squeezed between clean-label natural alternatives gaining share and the two leaders on price. Tightening food additive regulation in the European Union and rising consumer scrutiny of synthetic ingredients in North America are the two forces most likely to reshape demand allocation across the next decade.
Market Definition
The artificial preservative market covers commercial production and sale of synthetic chemical preservatives, including benzoates, sorbates, sulfites, nitrites and nitrates, parabens, and synthetic antioxidants, used to extend shelf life across food and beverage, cosmetic, and pharmaceutical applications. It excludes natural preservative alternatives and finished consumer products that merely incorporate preservatives as one ingredient among many.
Base Year Value
$2.8B in 2025 (MMA Primary Research Dataset, August 2026)
Forecast Period
2026 to 2036, eleven discrete annual values
CAGR
3.4% base case. Bull 4.6%. Bear 2.2%.
Fastest Growth Segment
Sorbates: 5.2% CAGR
Fastest Growth Country
India: 6.1% CAGR
Fastest Growth Region
South Asia and Pacific: 5.4% CAGR
Largest Region
East Asia: 28% of 2025 global value
Market Leaders
Eastman Chemical, Corbion N.V., Niacet Corporation, Emerald Kalama Chemical, Jungbunzlauer Suisse AG. Source: MMA Analysis based on company annual reports.
Primary Survey
n=3,800 procurement and R&D decision-makers, Q4 2025, six countries
Methodology
Demand-side build-up, cross-validated against public data, 47 expert interviews

Artificial Preservative Market Forecast Scenarios

artificial-preservative-market-trends-size-forecast-scenario-1787461469677
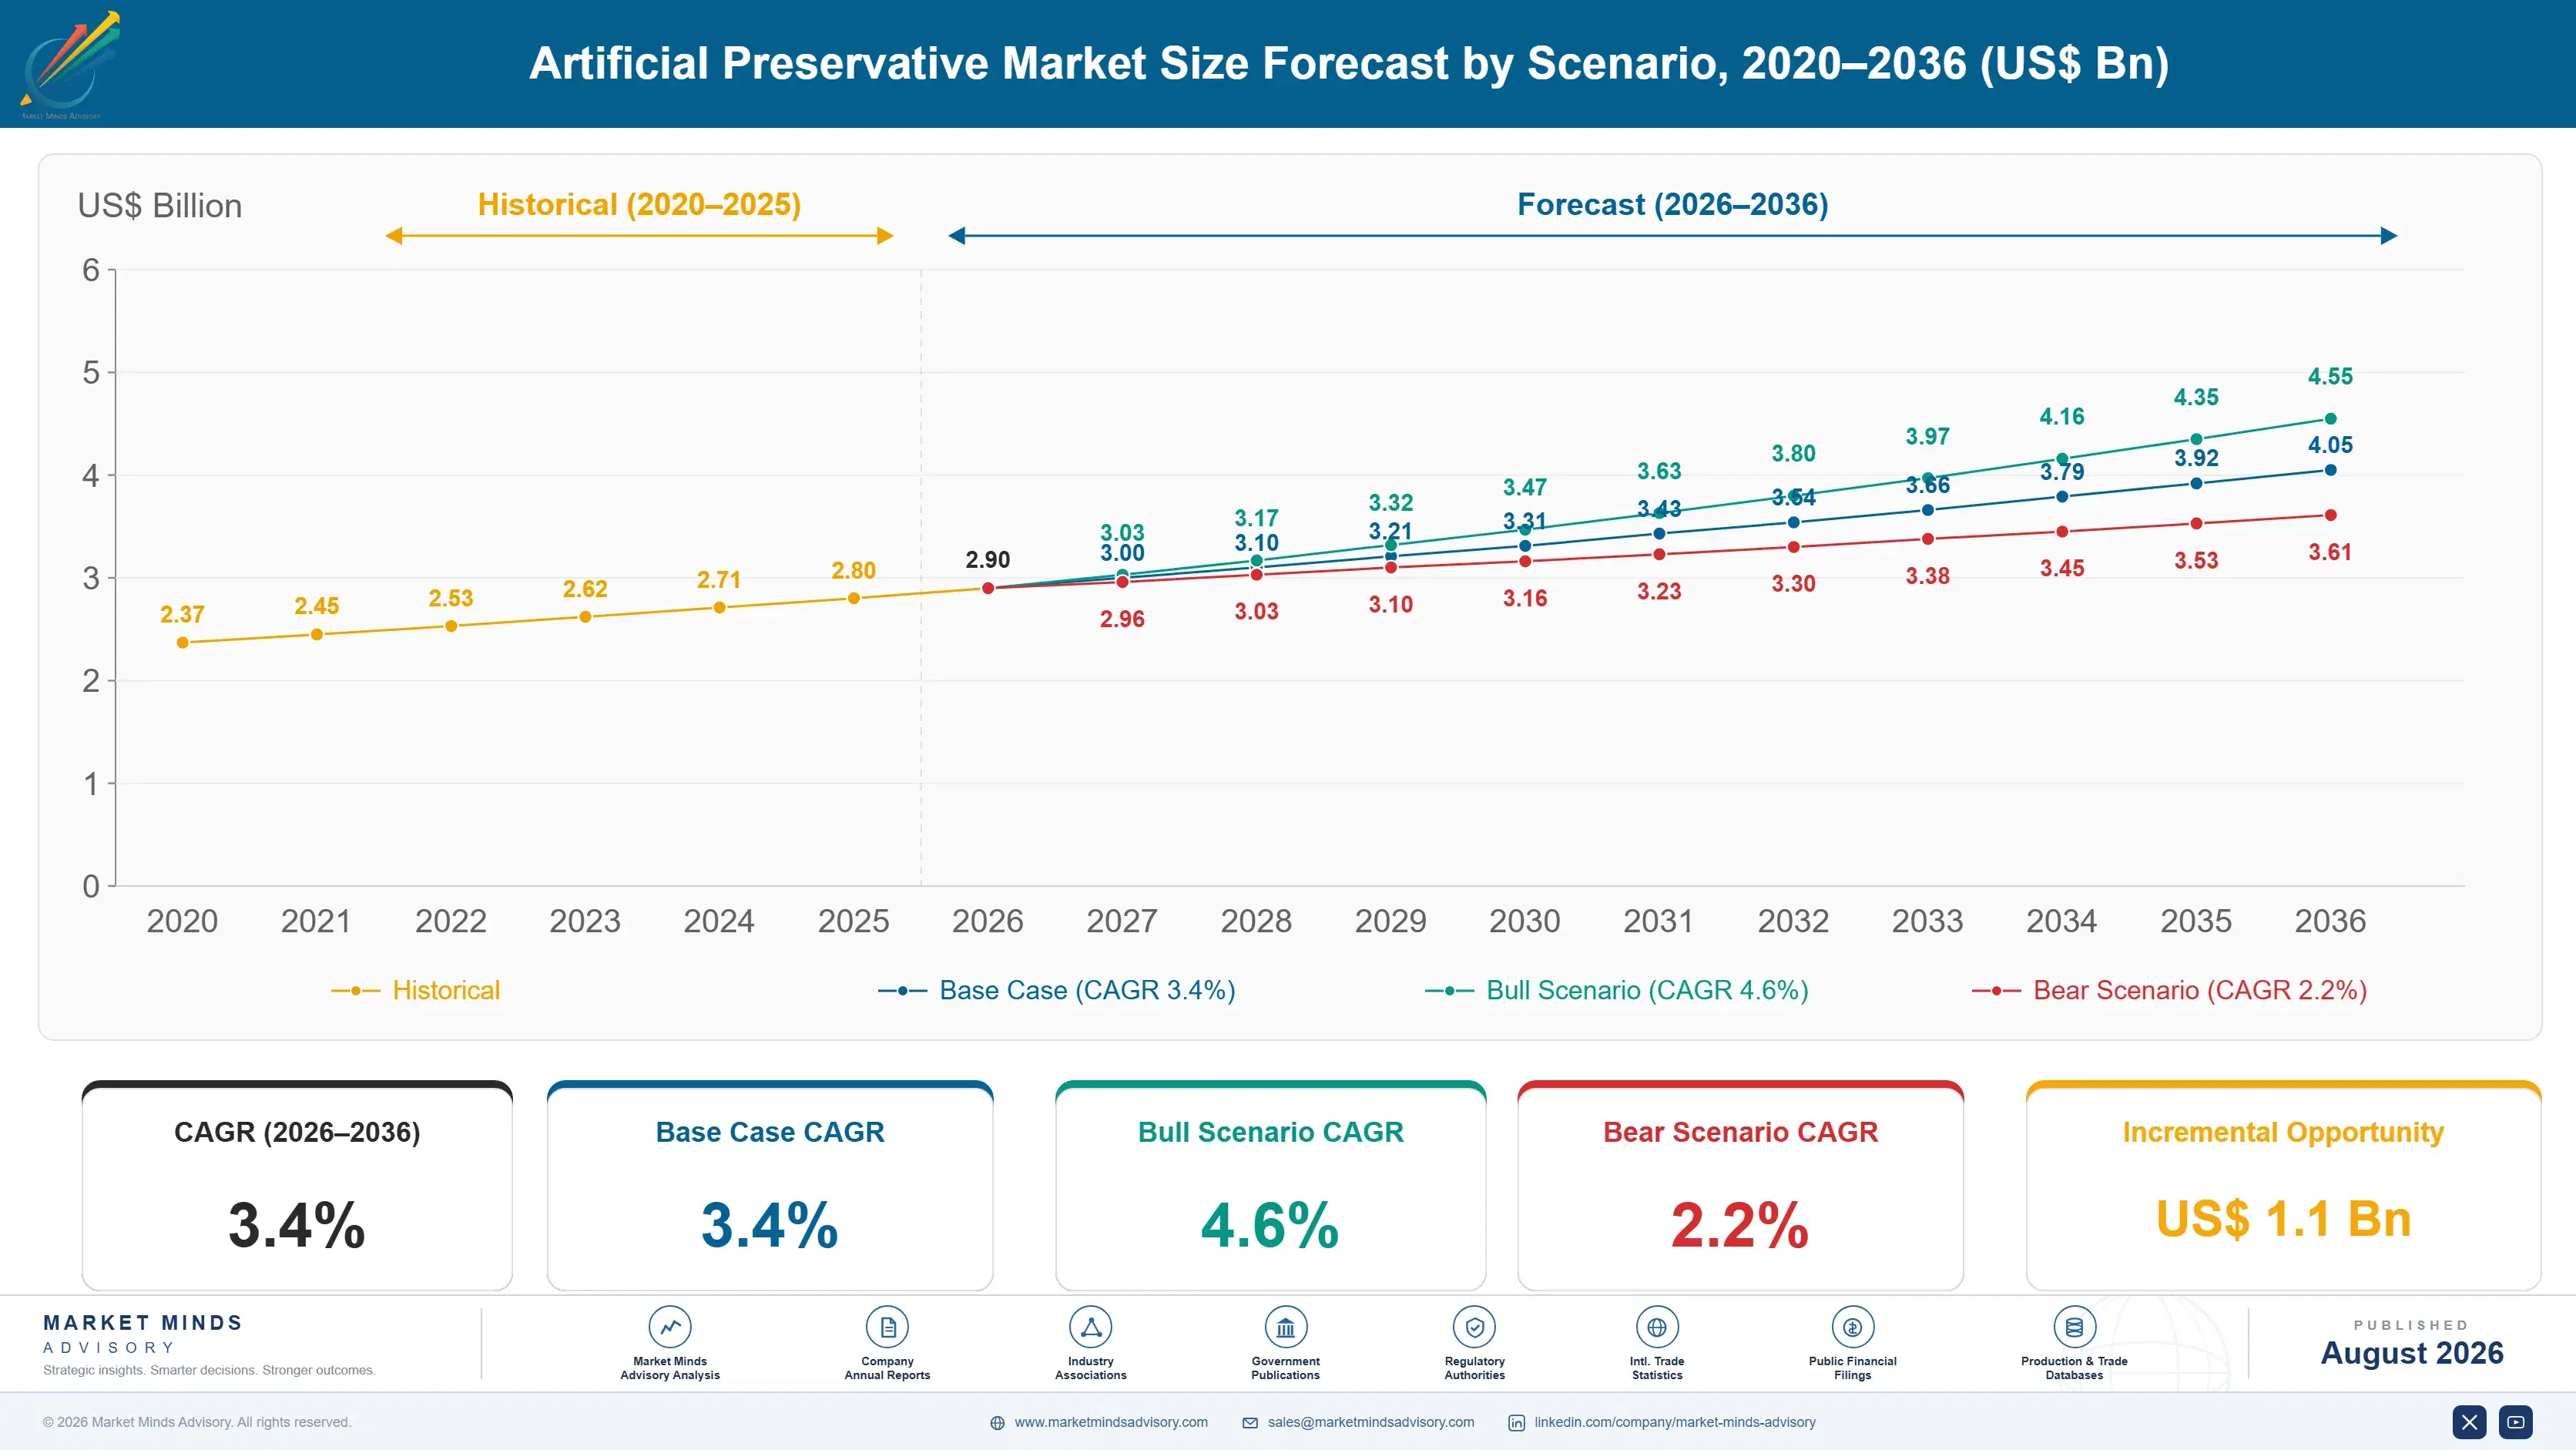
Between 2020 and 2025 the market grew at a somewhat faster pace than the current forecast implies, as packaged food manufacturing expanded steadily across emerging economies while clean-label reformulation pressure in North America and Western Europe remained comparatively modest earlier in the period before intensifying recently. Producers serving both segments saw fairly stable contract structures.
The base case through 2036 rests on three mechanisms: continued packaged food manufacturing growth across East Asia and South Asia sustaining volume even as reformulation accelerates elsewhere, sorbates gaining share from parabens and nitrites as formulators seek lower-scrutiny alternatives within the synthetic category itself, and meat processors retaining nitrites given the absence of a fully proven commercial substitute at comparable cost and safety performance. None of these mechanisms depends on a single ruling, supporting the base case broadly.
The bull case turns on packaged food manufacturing growth across South Asia and Latin America running well ahead of current projections, lifting volume broadly. The bear risk is clean-label reformulation spreading faster than expected into emerging markets as multinational manufacturers standardize recipes globally, compressing the volume base that currently offsets developed-market decline. How quickly recipes standardize globally will determine which scenario dominates.

Regulatory Reformulation and Emerging Market Volume Dynamics

Two forces are pulling artificial preservatives in opposite directions at once: clean-label reformulation compressing demand in wealthier markets, and packaged food manufacturing expansion sustaining volume growth across emerging economies. This split is turning what was once a fairly uniform commodity chemical category into a market with genuinely divergent regional trajectories and buyer relationships. Producers slow to recognize this split risk losing relevance in both directions at once.
MARKET CONCENTRATIONCR5 38%reflects a fairly fragmented global production base overall
AVERAGE SELLING PRICE$4.80/kgpricing varies considerably across preservative chemistry and grade
TOP PRODUCING COUNTRY SHAREChina 24%reflects concentrated chemical manufacturing capacity and cost advantage
CAPACITY UTILIZATION74%production lines running comfortably below their practical processing ceiling
FEEDSTOCK COGS SHARE41%petrochemical and specialty acid inputs dominate total production cost
TRADE INTENSITY36%share of global production moving across national export borders
Commercially, preservative supply still behaves largely like a commodity chemical trade rather than a specialty ingredient relationship. Buyers switch suppliers readily on price within a given chemistry class, though qualification against food-grade purity and regulatory documentation remains a meaningful barrier for new entrants lacking established certification. Contract terms have shortened somewhat as reformulation uncertainty makes long-term volume commitments harder for buyers to justify. Buyers treat documentation speed as a reliability signal.
The next decade will be shaped by how far clean-label pressure spreads beyond North America and Western Europe, whether a proven nitrite substitute for meat curing finally reaches commercial scale, and how fast packaged food manufacturing continues expanding across South Asia and Latin America relative to developed-market decline. How retailers respond to consumer pressure will also shape category economics considerably.
"Nobody is launching a new artificial preservative brand. The whole category now survives on inertia in categories where nothing else quite works yet."
Director, Food Ingredients Practice · MMA Specialty Chemicals & Food Ingredients Practice · August 2026

Market Trends

Sorbates Gain Share as Lower-Scrutiny Synthetic Alternative

Formulators reformulating away from parabens and nitrites, both facing heavier regulatory and consumer scrutiny, increasingly land on sorbates as a synthetic preservative that draws comparatively less negative attention while still meeting shelf-life requirements across bakery, dairy, and beverage applications. Several major packaged food manufacturers have publicly disclosed reformulation roadmaps over the past few years that specifically substitute sorbates for parabens in cosmetic and personal care lines facing the sharpest consumer pushback. This has pulled sorbate volume growth meaningfully ahead of the broader preservative category, even as total category volume growth remains modest by specialty chemical standards.
Market Impact: Adds 165 million dollars regional demand
Meat Processors Retain Nitrites Despite Reformulation Pressure

Meat processors across North America and Western Europe have largely resisted removing nitrites from cured meat products despite years of clean-label pressure, since no synthetic or natural substitute has demonstrated equivalent botulism prevention performance at commercial scale and comparable cost. The USDA's Food Safety and Inspection Service continues to require nitrite use or an equivalent validated antimicrobial system in most cured meat categories, giving nitrite producers a regulatory floor that other preservative chemistries lack entirely. This has made nitrites the most resilient synthetic preservative segment against clean-label substitution pressure across the entire category.
Market Impact: Cuts reformulated volume by 9

Market Opportunities and Growth Drivers

Packaged Food Manufacturing Expands Across South Asia

Rising urbanization and cold-chain infrastructure investment across India and Southeast Asia are expanding packaged food manufacturing capacity considerably, and most new production lines specify synthetic preservatives given their lower cost relative to natural alternatives that remain comparatively scarce and expensive in these markets. India's Ministry of Food Processing Industries has documented steady growth in registered packaged food manufacturing units over the past several years, directly expanding the addressable preservative demand base. This growth is occurring largely outside the reformulation pressure affecting North America and Western Europe, giving preservative producers a genuine offsetting demand pool.
Market Impact: Cuts premium volume by 11

Retailer Private-Label Reformulation Accelerates in Wealthy Markets

Major grocery retailers across the United States and United Kingdom have expanded clean-label reformulation commitments for private-label products considerably over the past several years, removing artificial preservatives from hundreds of stock-keeping units annually in response to consumer demand for shorter ingredient lists. Several large retailers have published public commitments specifically targeting synthetic preservative removal from private-label lines by defined future dates. This reformulation wave is compressing volume in exactly the premium packaged food categories that historically commanded the strongest pricing for preservative suppliers. Analysts expect this reformulation wave to continue expanding into additional product categories over the next several years.
Market Impact: Adds compliance cost of 7

Market Restraints and Challenges

Consumer Clean-Label Preference Compresses Premium Demand

Consumer preference for shorter ingredient lists and recognizable additive names has pushed manufacturers to reformulate premium packaged food products away from synthetic preservatives even where cost and shelf-life performance would otherwise favor them strongly. The root cause is that consumers increasingly associate any unfamiliar chemical name with safety risk regardless of the underlying toxicological evidence, a perception food brands have found commercially costly to argue against directly. Preservative producers are mitigating this through technical support helping formulators identify which applications can tolerate natural alternatives without compromising shelf life, while defending nitrites and other hard-to-replace chemistries on safety grounds.
Market Impact: Adds 140 million dollars sorbate demand

Tightening EU Additive Re-Evaluation Creates Regulatory Uncertainty

The European Food Safety Authority's ongoing systematic re-evaluation of legacy food additives, including several synthetic preservatives approved decades ago under older safety standards, has created lasting uncertainty for producers unsure which chemistries might face restricted approval status in coming review cycles. Several preservatives have already had permitted usage levels reduced following recent reviews, without full bans being issued. Producers are mitigating this through diversified chemistry portfolios that reduce dependence on any single preservative facing near-term regulatory risk, and through early engagement with regulators during open comment periods. Industry groups continue lobbying regulators for greater predictability in future review timelines.
Market Impact: Holds nitrite volume flat through 2030
3 additional market trends, 3 additional growth drivers, and 4 additional restraints and challenges are covered in the full report. Contact sales@marketmindsadvisory.com to access the complete intelligence.

Segment CAGR and Growth Architecture

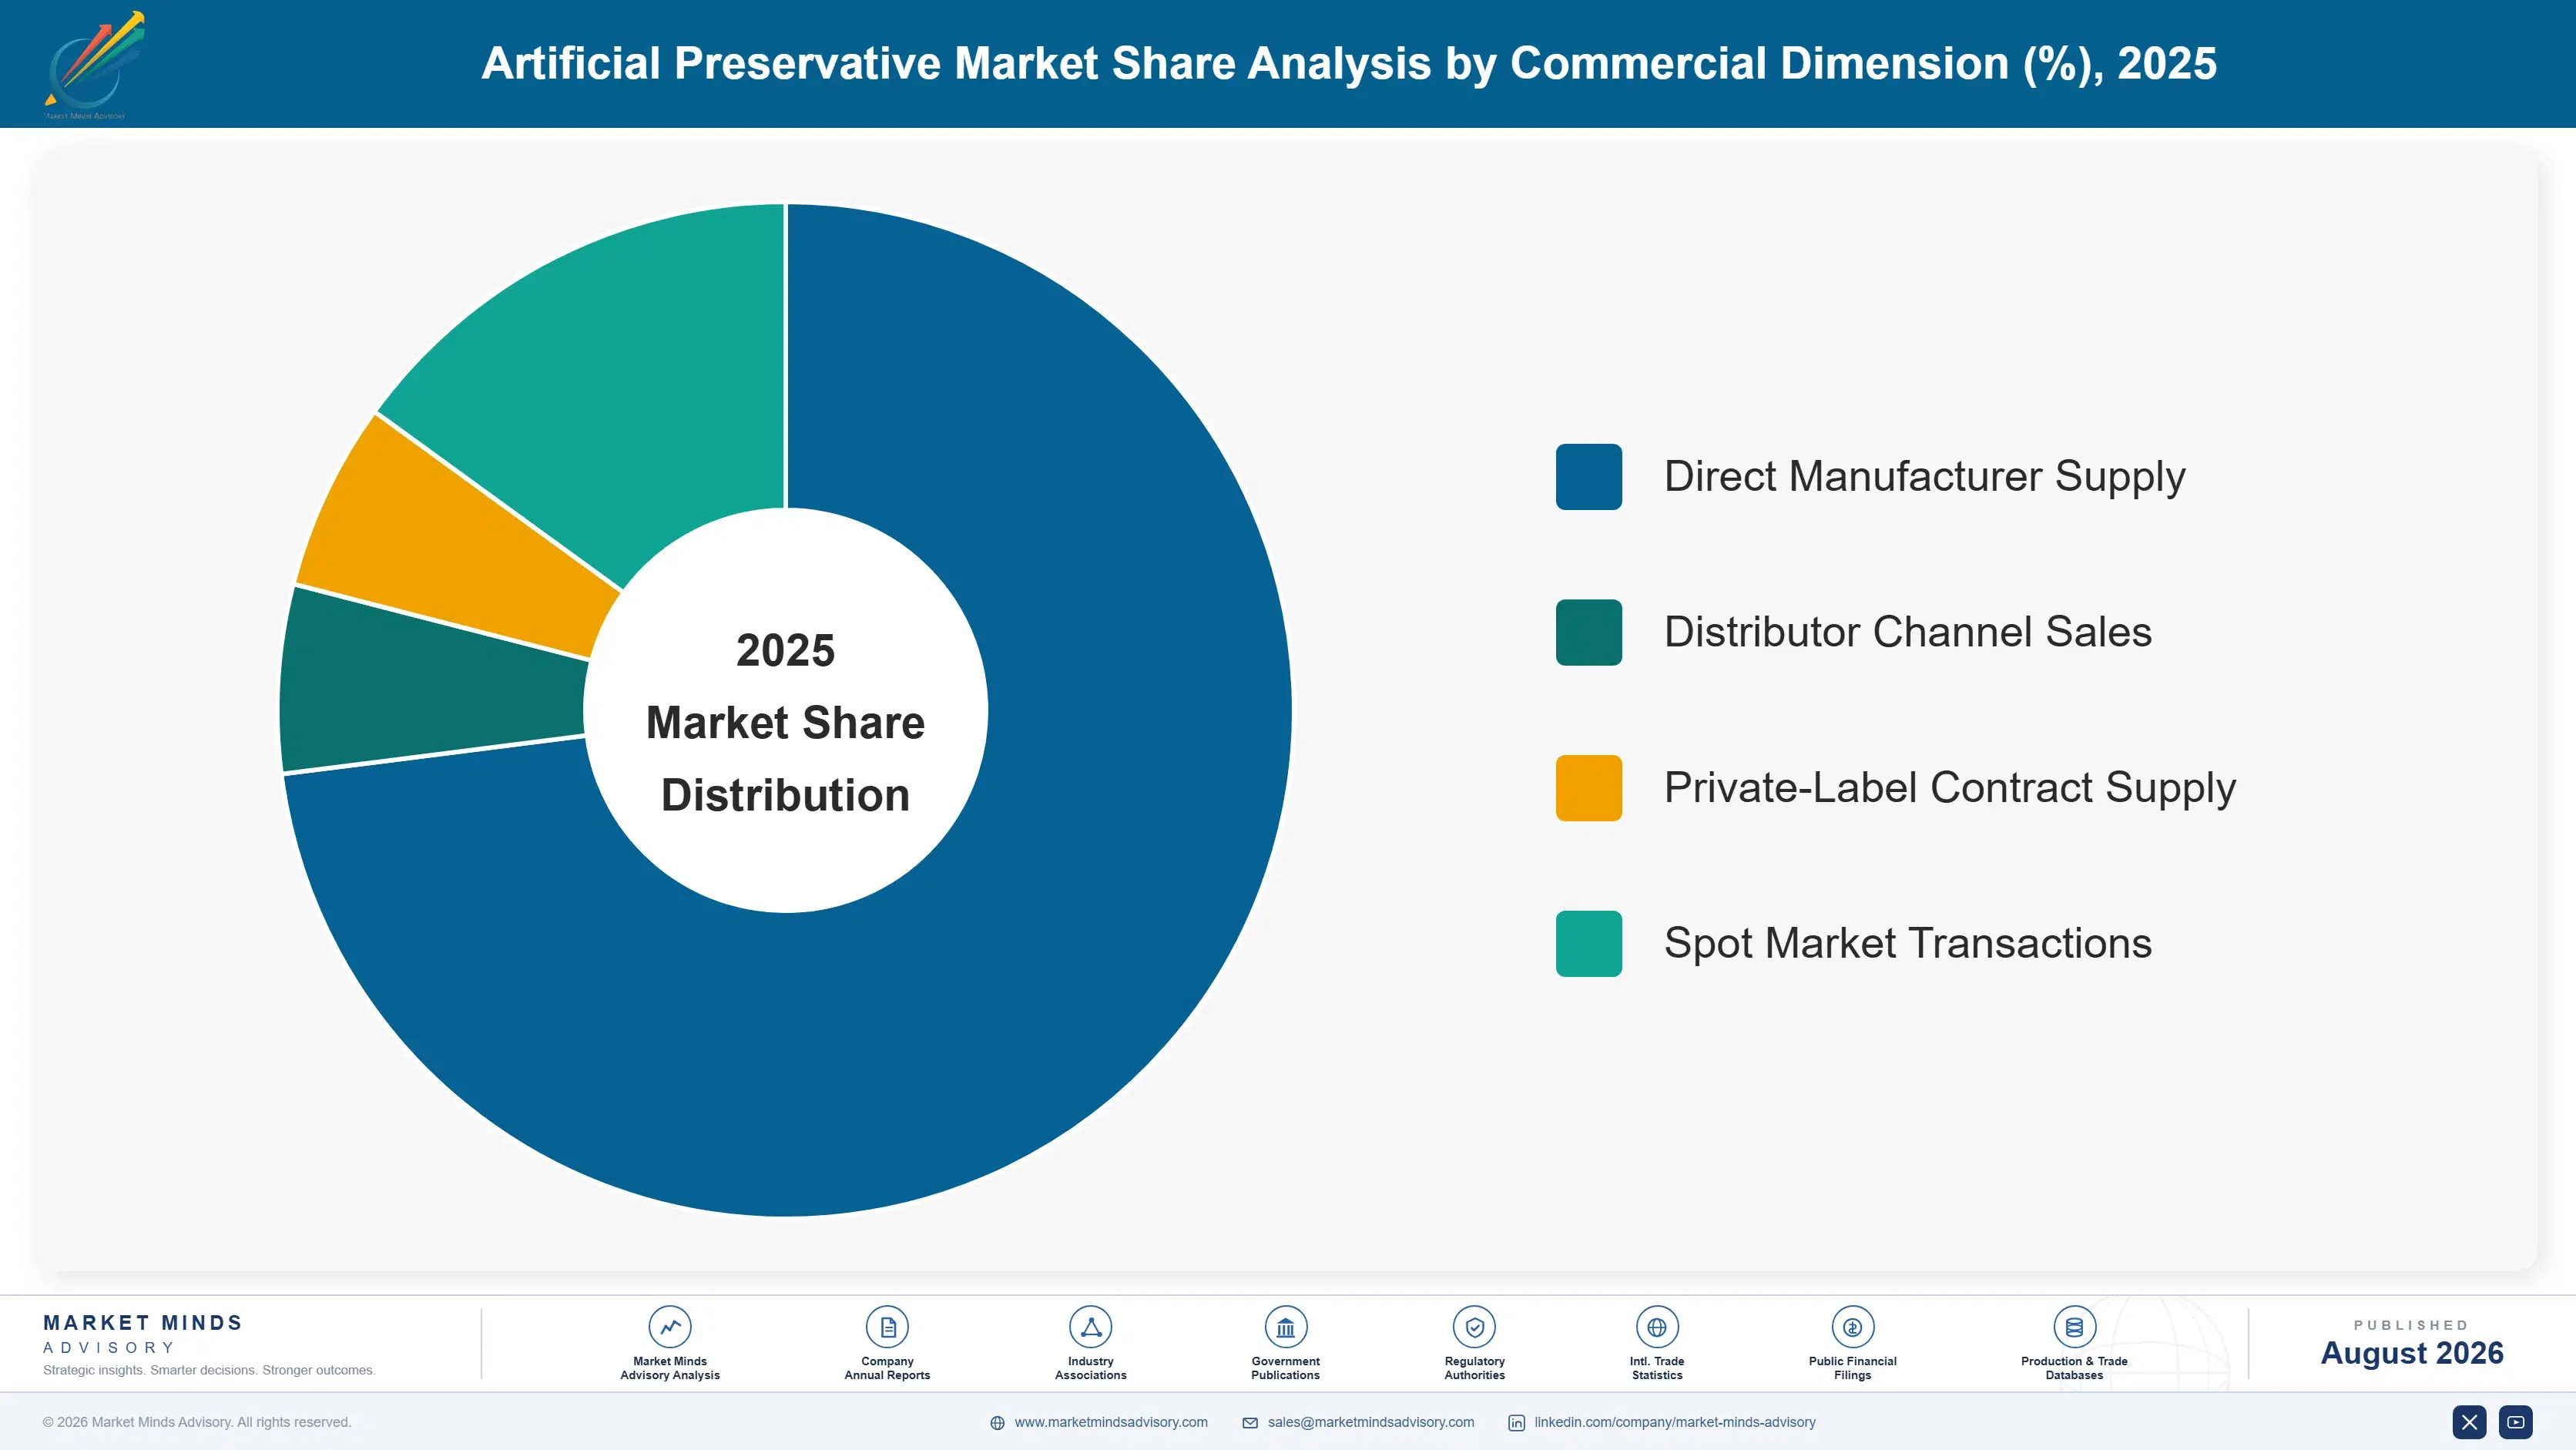
Artificial preservatives are segmented here by chemistry class rather than by application, end-use industry, or distribution channel, since benzoates, sorbates, sulfites, nitrites, parabens, and synthetic antioxidants each face quite distinct regulatory treatment and consumer perception that shape pricing and demand largely independent of the specific food or product category they happen to preserve today.
artificial-preservative-market-trends-market-share-analysis-1787461470209

Sorbates

This segment is growing fastest as formulators reformulating away from parabens and nitrites increasingly land on sorbates, which draw comparatively less regulatory and consumer scrutiny while still meeting shelf-life requirements across bakery, dairy, cheese, and beverage applications. Cosmetic and personal care manufacturers have driven particularly strong sorbate adoption as they substitute away from parabens facing sharper consumer pushback in that category specifically. Corbion and several Chinese chemical producers have expanded sorbate production capacity over the past several years to meet this rising demand. Pricing has held up better than the category average, since buyers switching from parabens are often willing to pay a modest premium for a chemistry perceived as lower-risk.
CAGR 5.2%

Synthetic Antioxidants

BHA, BHT, and TBHQ demand is growing steadily as animal feed and vegetable oil manufacturers across emerging markets, particularly in South Asia and Latin America, continue specifying these antioxidants to prevent rancidity in products with long supply chains and extended storage periods before consumption. This segment faces less consumer-facing clean-label pressure than direct food additives, since synthetic antioxidants often function further upstream in feed and industrial oil processing where end consumers rarely see ingredient labels directly. Eastman Chemical and several Chinese producers dominate supply, benefiting from integrated petrochemical feedstock access that smaller regional formulators lack. Margins here remain comfortably above the sulfite and benzoate segments given more limited direct competition from natural alternatives currently.
CAGR 4.6%
Full segment breakdown across 6 segments available in the complete report.

Regional Architecture and Country Demand Map

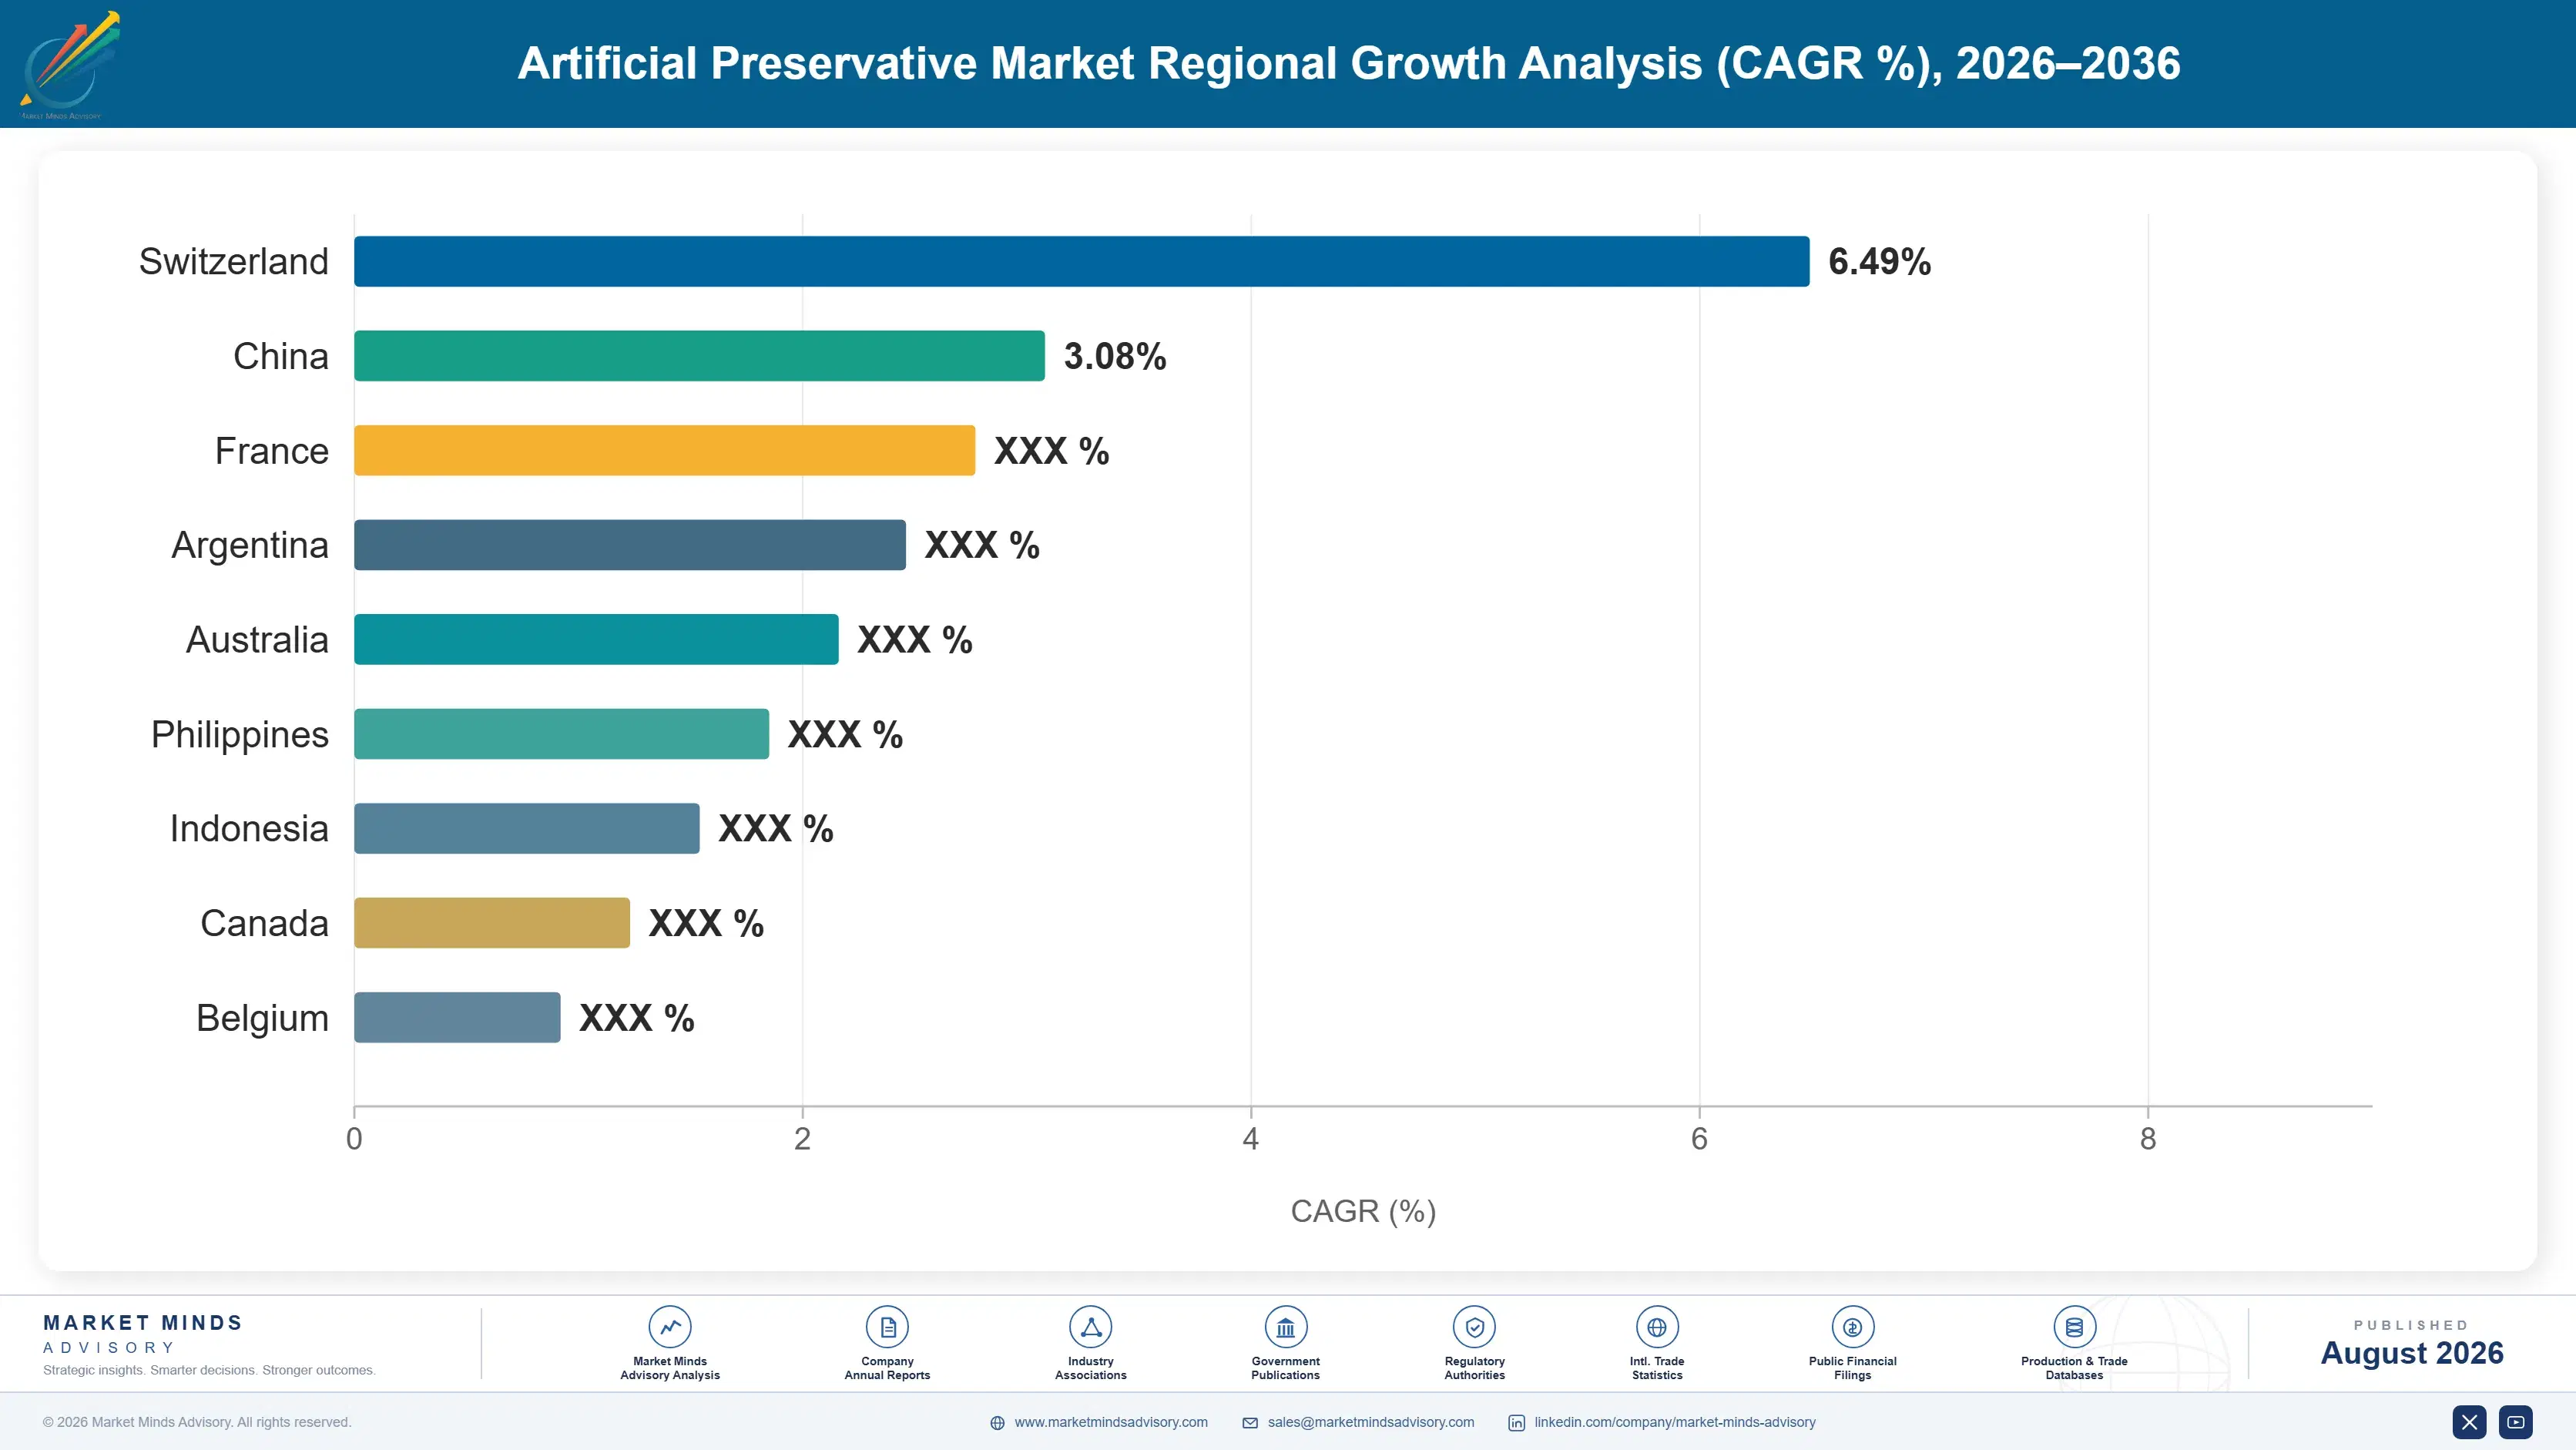
East Asia and North America together account for over half of global artificial preservative demand, reflecting large packaged food manufacturing bases across both regions, while South Asia and Pacific posts the fastest regional growth rate on expanding cold-chain infrastructure and packaged food capacity investment nationally.

North America

Meat processing anchors the largest single demand pool across the United States and Canada, since nitrites remain effectively irreplaceable in cured meat production despite years of clean-label reformulation pressure from retailers and consumer groups. Retailer-driven private-label reformulation has meaningfully compressed synthetic preservative volume in premium bakery, snack, and beverage categories over the past several years. Canada's packaged food sector shows a somewhat slower reformulation pace than the United States. The region hosts substantial preservative manufacturing capacity through Eastman Chemical and Niacet, giving North American buyers relatively short and reliable supply chains compared with import-dependent regions elsewhere. Mexico's proximity supports meaningful cross-border trade in preservative-treated packaged goods as well. Growing e-commerce grocery channels add further reformulation pressure on shelf-life claims.
Share: 27% | CAGR: 3.9% (2026 to 2036)

Western Europe

The European Food Safety Authority's systematic re-evaluation of legacy food additives has made Western Europe the most regulation-driven regional market, with several synthetic preservatives already facing reduced permitted usage levels following recent review cycles. Germany, France, and the United Kingdom account for the bulk of regional demand, concentrated increasingly in meat processing and industrial applications where reformulation options remain limited. Consumer clean-label preference across the region's retail sector has pushed extensive reformulation in packaged bakery and dairy categories specifically. Import dependence on East Asian preservative supply has grown somewhat as regional production capacity has not expanded to match remaining demand. Cosmetic and personal care manufacturers across the region show a particularly strong reformulation pace currently.
Share: 19% | CAGR: 1.6% (2026 to 2036)
Regional intelligence for 5 additional markets available in the complete report: East Asia, South Asia and Pacific, Latin America, Middle East and Africa, Eastern Europe. Contact sales@marketmindsadvisory.com.
artificial-preservative-market-trends-country-cagr-analysis-1787461470720

Where Preservative Producers Can Capture More Margin

Producers can lift margin capture by shifting mix toward sorbates and synthetic antioxidants gaining share from more scrutinized chemistries, expanding emerging market manufacturing presence, and offering regulatory and reformulation technical support that helps buyers navigate an increasingly complex compliance landscape. Building regulatory technical support capability further strengthens customer retention during periods of reformulation uncertainty across major markets.

Sorbate and Antioxidant Mix Shift Strategy

Producers who shift production mix toward sorbates and synthetic antioxidants capture meaningfully better margins than those still concentrated in parabens and nitrites, since buyers reformulating away from more scrutinized chemistries are often willing to pay a premium of 8 to 12 percent for a lower-risk synthetic alternative during the transition period. Corbion and several Chinese producers have already made this shift, and their blended margins now run consistently above producers still weighted toward legacy chemistries. The main constraint is that this mix shift takes multiple years of capacity reallocation to complete at scale.
Market Impact: Lifts blended margin by 8 to 12 percentage points

Emerging Market Manufacturing Capacity Expansion Program

Producers who establish or expand manufacturing capacity closer to India and Southeast Asian packaged food manufacturing hubs capture volume growth that competitors relying purely on export shipments from North America or Europe are slower to reach, while also reducing landed cost meaningfully for regional customers. Several Chinese producers have gained an estimated 5 to 7 percentage points of export share in South Asian markets over the past several years through this approach. Building local regulatory registration and customer relationships takes 2 to 3 years before this lever converts fully into volume.
Market Impact: Adds 5 to 7 percentage points of export share

Regulatory and Reformulation Technical Support Services

Producers offering dedicated technical support that helps formulators navigate EFSA re-evaluation outcomes and identify viable reformulation pathways position themselves as a trusted advisor rather than a pure commodity supplier, a distinction that supports meaningfully better customer retention during periods of reformulation uncertainty. Suppliers providing this support report retaining 15 to 20 percent more volume during customer reformulation cycles than those competing purely on price. This lever requires dedicated regulatory affairs staff, a cost structure smaller producers sometimes struggle to justify against near-term revenue. Suppliers building this capability early are locking in trusted-advisor relationships before competitors catch up meaningfully.
Market Impact: Retains 15 to 20 percent more volume during reformulation

Long-Term Supply Contracts With Meat Processors

Locking multi-year supply agreements with large meat processors trades some spot-market upside for guaranteed volume in the single most regulation-resilient segment of the category, an arrangement processors increasingly prefer too given nitrite supply security concerns following recent EFSA review uncertainty. Producers with such agreements report considerably lower customer churn than those selling primarily on annual renewal terms, and the visibility these agreements provide supports more confident capacity planning 3 to 5 years ahead of anticipated demand. Producers pursuing this lever report the strongest long-term account visibility across their entire customer portfolio.
Market Impact: Cuts customer churn by roughly 14 percentage points

Who Controls the Margin Pool

The market sits at moderate concentration, with the top five producers controlling thirty-eight percent of global capacity on a production basis. Eastman Chemical and Corbion lead by a meaningful margin over the next tier of challengers, both benefiting from integrated chemical production scale that smaller regional formulators cannot easily replicate on cost alone. Regional challengers mostly compete on price rather than chemistry breadth.
Current competitive activity centers on three fronts: shifting production mix toward sorbates and synthetic antioxidants gaining share from more scrutinized chemistries, expanding manufacturing presence closer to South Asian packaged food demand, and building regulatory technical support capability to help customers navigate reformulation pressure. Chinese producers are also expanding domestic capacity rapidly to compete on price. These fronts increasingly determine which producers retain their most valuable customer accounts.

Emerging pressure comes from Chinese chemical producers who have scaled sorbate and benzoate production considerably faster than Western incumbents anticipated, and from natural preservative substitute developers targeting the same premium packaged food categories synthetic producers are losing share within. Rankings could shift meaningfully if a proven commercial nitrite substitute finally reaches scale, since that would remove the one segment currently most insulated from clean-label substitution pressure.
artificial-preservative-market-trends-company-positioning-matrix-1787461471245

Competitive Moat and Risk Dimensions

EASTMAN CHEMICAL

Moat: Integrated petrochemical feedstock access

Eastman's integrated petrochemical production gives it direct feedstock cost advantages that smaller regional preservative formulators lacking equivalent upstream chemical integration cannot easily match, particularly in synthetic antioxidant chemistries where feedstock represents a larger share of total production cost. This upstream integration advantage becomes especially valuable during periods of feedstock price volatility across the sector.
EASTMAN CHEMICAL

Risk: Exposure to petrochemical price volatility

Eastman's cost advantage depends on stable petrochemical feedstock pricing, making the company more exposed than diversified competitors to the kind of sharp energy and feedstock price spikes that periodically compress margins across its broader specialty chemical portfolio. This exposure is already visible in the company's antioxidant product margins during recent volatility.
CORBION N.V.

Moat: Broad natural and synthetic portfolio

Corbion's combined natural and synthetic preservative portfolio lets it serve customers regardless of which direction their reformulation strategy takes, a flexibility pure-play synthetic competitors lacking natural alternatives cannot offer during a period when many buyers are actively hedging between both approaches. This dual capability increasingly matters as more customers hedge their reformulation bets across categories.
CORBION N.V.

Risk: Margin dilution from natural mix

Corbion's growing natural preservative revenue, while strategically important, generally carries lower margins than its legacy synthetic sorbate business, meaning continued mix shift toward natural products could dilute blended company margins even as it strengthens the company's long-term positioning. Investors have begun watching this mix shift closely as a leading indicator of margin trajectory.

Players Tracked

Prominent Players

Eastman Chemical
Corbion N.V.
Niacet Corporation
Emerald Kalama Chemical
Jungbunzlauer Suisse AG

Other Key Players

Kemin Industries
Balchem Corporation
Foodchem International Corporation
Hawkins Inc
Impextraco
Vizag Chemical International
DFI Corporation
Archer-Daniels-Midland
Univar Solutions
Cargill
Tate and Lyle
Purac
Prinova Group
Hydrite Chemical
Jost Chemical

Recent Developments

MARCH 2025

Corbion expands sorbate production capacity in Europe

Corbion commissioned an expansion of sorbate production capacity at one of its European facilities, aimed at meeting growing reformulation-driven demand from cosmetic and food manufacturers substituting away from parabens. The expansion followed years of order growth from reformulating customers. Formulators expect further expansions across the region in coming years.
Signal: Signals that incumbents are investing capacity ahead of confirmed sorbate demand growth even before independent data fully confirms the trend
OCTOBER 2024

Eastman Chemical expands antioxidant capacity in Asia

Eastman Chemical announced additional synthetic antioxidant production capacity in Asia to serve growing animal feed and vegetable oil manufacturers across the region. The investment followed rising demand as regional feed millers sought rancidity protection. Several regional feed millers have already signed initial supply agreements as a result.
Signal: Confirms that synthetic antioxidants are gaining share in emerging feed markets across nearly every major producing country in the region
JANUARY 2026

Chinese producer commissions new benzoate facility

A leading Chinese chemical producer brought online a new benzoate production facility, materially increasing domestic capacity to serve local packaged food manufacturers and export customers across South Asia and Latin America seeking lower-cost alternatives. Regional buyers welcomed the added domestic sourcing option amid tightening import costs.
Signal: Signals that Chinese producers are closing the capacity gap with incumbents well ahead of what most industry analysts had expected

Petrochemical Feedstock and Specialty Acid Cost Exposure

Petrochemical-derived feedstock and specialty acid inputs, including acetic acid and sorbic acid precursors, account for roughly forty-one percent of production cost of goods sold for most synthetic preservative manufacturers. Energy costs for chemical synthesis processes add a further meaningful input, particularly for producers operating energy-intensive continuous production processes at scale. Packaging costs add a smaller further input.
Petrochemical feedstock prices spiked sharply in 2022 following the broader energy market volatility documented in the IEA's World Energy Outlook, pushing production costs for several synthetic preservative chemistries up by an estimated nineteen percent within a single year before gradually easing through 2023 and 2024. Several mid-tier producers reported margin compression during this period severe enough to delay planned reformulation-response capacity investments. Producers with unhedged spot-market purchasing bore the brunt of this spike more severely than integrated rivals.

Cost exposure varies considerably by producer scale and chemistry. Fully integrated producers like Eastman, which source petrochemical feedstock through broader chemical operations, absorb volatility more easily than standalone preservative specialists reliant on spot market purchasing. Geographically, Chinese producers benefit from generally lower energy costs supporting continuous production, while European producers face higher utility costs that compress margins further during feedstock price spikes.
artificial-preservative-market-trends-cost-volatility-analysis-1787461471446

Long-Term Feedstock Supply Agreements

Several producers have moved to multi-year feedstock purchase agreements with petrochemical suppliers, trading some pricing flexibility for protection against the kind of sharp spikes documented during the 2022 energy volatility, reducing quarter-to-quarter cost unpredictability meaningfully for finance and planning teams across the organization. Several buyers now cite this pricing stability as a factor when evaluating supplier relationships directly.

Backward Integration Into Precursor Chemistry

The largest producers have integrated backward into acetic acid and sorbic acid precursor production, capturing margin previously paid to third-party chemical suppliers while also gaining direct visibility into feedstock cost trends ahead of broader market-wide price movements affecting smaller competitors. Producers pursuing this path expect meaningful cost advantages within the next several production cycles.

Energy Efficiency Investment in Production Facilities

Producers are investing in more efficient continuous production process technology that reduces total energy consumption per batch, a hedge against both energy price volatility and rising industrial electricity costs in key manufacturing regions facing tightening emissions rules. Facilities completing this upgrade report measurably lower per-batch energy costs within the first year. Adoption remains concentrated among larger producers currently.

Portfolio Architecture for Margin Defence

The portfolio splits into three tiers with distinct margin economics. Volume commodity-adjacent benzoates and sulfites compete largely on price against natural alternatives and each other, premium sorbates and synthetic antioxidants command a modest but durable pricing advantage tied to lower regulatory scrutiny, and a smaller next-generation tier built on nitrite alternatives and hybrid natural-synthetic blends sits above both on margin. This means margin depends more on mix shift than on growing total volume.
The volume versus premium tension is real: benzoates and sulfites still represent meaningful global tonnage in cost-sensitive applications, but nearly all incremental margin growth is concentrated in sorbates and synthetic antioxidants, creating pressure on producers to shift capacity mix even where legacy chemistry demand remains a stable base business in absolute terms. Producers who delay risk ceding relationships to competitors already positioned in the premium tier.

High-value margin pools concentrate in nitrite alternative development and hybrid formulations that pair natural and synthetic preservatives, both of which reward producers able to demonstrate validated performance consistently across regulatory and customer qualification cycles rather than simply offering the lowest per-kilogram price available. Producers demonstrating this consistency across multiple qualification cycles increasingly command a durable pricing advantage over less consistent rivals.

Volume / Commodity-Adjacent Tier

Benzoates and sulfites sold into cost-sensitive food and beverage applications where price competition against natural alternatives and other synthetic producers dominates purchasing decisions. Little differentiation exists among suppliers competing for this cost-sensitive business today.
Gross Margin: 14-20%

Premium / Certified Tier

Sorbates and synthetic antioxidants sold to formulators reformulating away from parabens and legacy chemistries, commanding a modest premium tied to lower regulatory and consumer scrutiny. Buyers here often pay a modest premium for perceived lower regulatory risk.
Gross Margin: 22-30%

Sustainability / Regulatory / Next-Generation Tier

Nitrite alternative development and hybrid natural-synthetic preservative blends serving manufacturers seeking a defensible middle path between full reformulation and legacy chemistry retention. Growth here outpaces both other tiers as manufacturers seek defensible middle paths.
Gross Margin: 30-38%
artificial-preservative-market-trends-portfolio-architecture-1787461471951

High-value Sub-segments and Strategic Watch-out

Sorbate and Antioxidant Reformulation Substitutes

This segment combines the fastest volume growth with the strongest margins in the category, driven by formulators reformulating away from parabens and nitrites toward lower-scrutiny synthetic alternatives across multiple applications. Few competitors currently match this combination of growth and pricing power. This advantage should persist for several more years.
Gross Margin: 22-30%

Emerging Market Packaged Food Volume

Packaged food manufacturing expansion across India and Southeast Asia supports steady volume growth here, though pricing remains under continuous pressure from domestic Chinese producers competing aggressively on cost. Retailers and manufacturers here increasingly favor whichever supplier offers the lowest landed cost. Volume here should keep expanding steadily.
Gross Margin: 16-22%

Standard Meat Processing Nitrites

This remains a large and resilient volume base in the category, insulated from clean-label substitution given the absence of a proven commercial alternative, though regulatory scrutiny is gradually intensifying. Meat processors here show little appetite for near-term reformulation given safety requirements. This durability should persist for years.
Gross Margin: 20-28%

Nitrite Substitute Development Programs

A strategic watch-out segment where a proven commercial nitrite alternative reaching scale could disrupt the one preservative chemistry currently most insulated from clean-label reformulation pressure across the category. Established producers are watching this development closely for early signs of disruption. Timing here remains genuinely uncertain.
Gross Margin: 26-34%

Divergent Reformulation and Volume Cycles

Artificial preservative demand behaves less like a single unified cycle and more like two separate architectures running in parallel, since reformulation-driven decline in wealthy markets and manufacturing-driven growth in emerging markets respond to entirely different commercial forces and rarely offset each other predictably from one year to the next. Buyers rarely reverse a reformulation decision once retailer commitments are publicly announced.
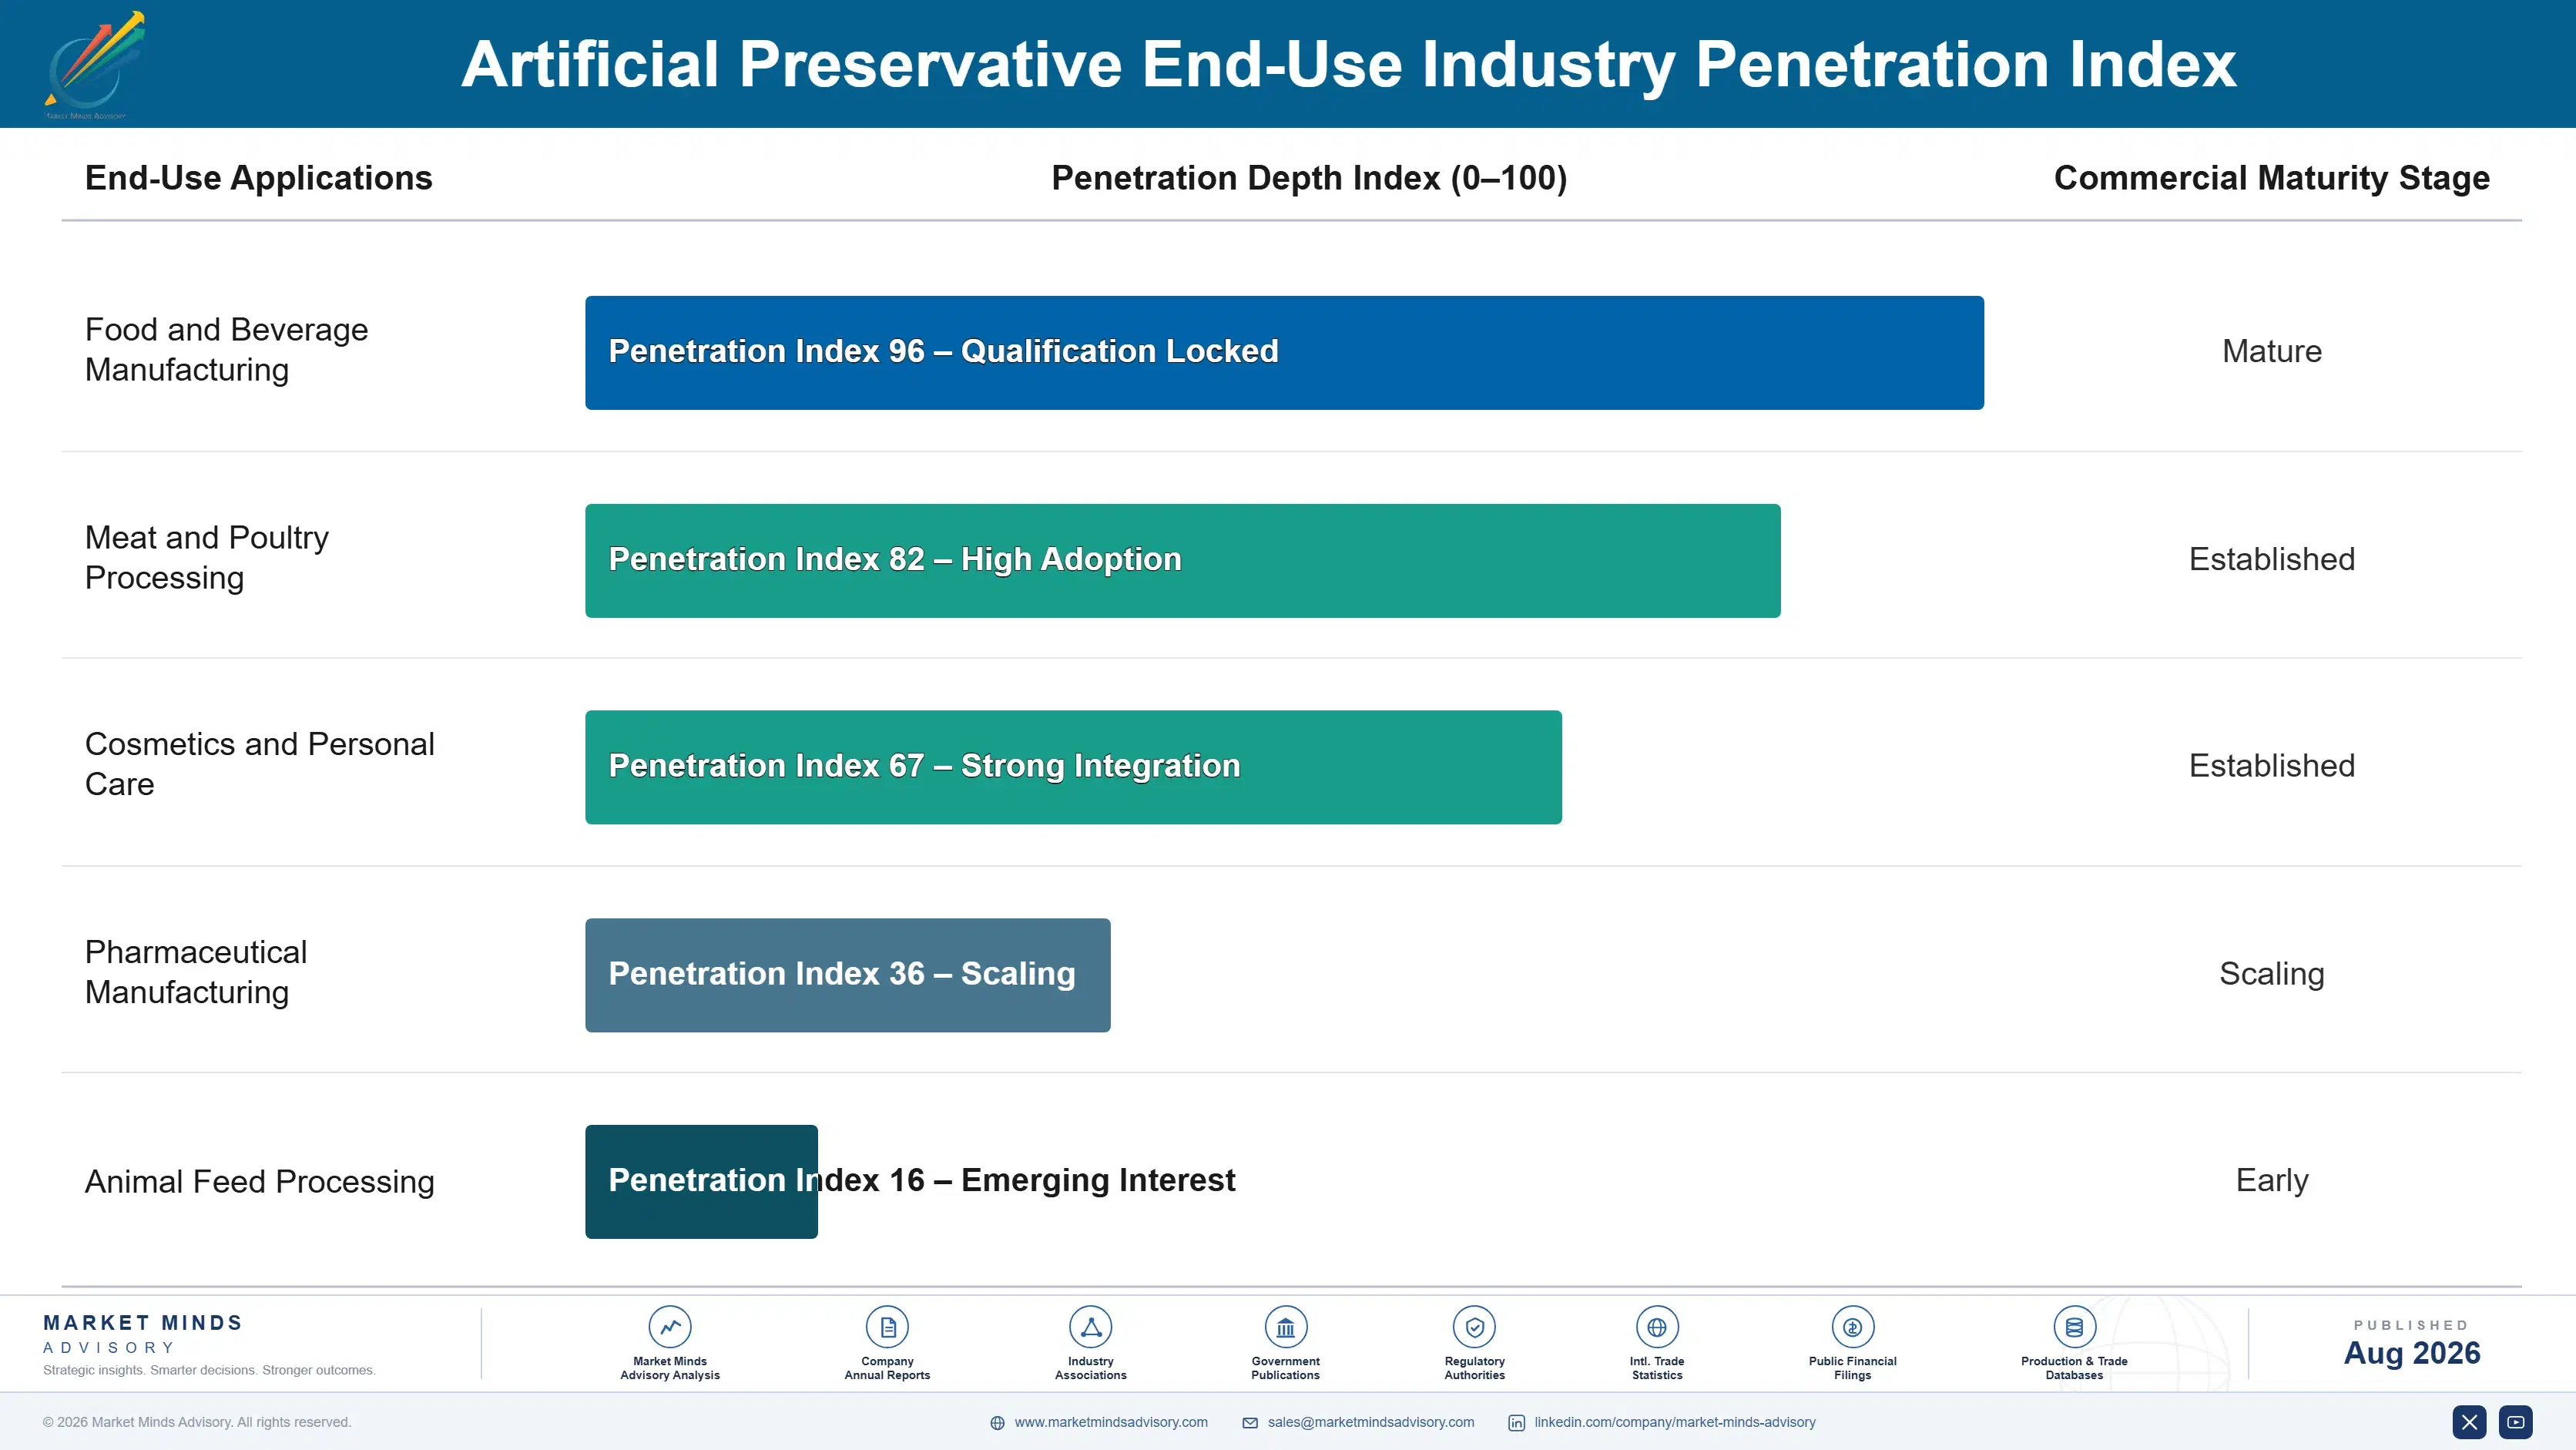
Adoption depth varies considerably by end-use vertical. Meat processors commit deepest to nitrites, since no proven substitute exists at comparable safety and cost performance, giving this application the most durable revenue base in the category. Bakery and dairy manufacturers, by contrast, show shallower commitment and will reformulate readily once a viable natural alternative meets shelf-life requirements at acceptable cost. Cosmetic manufacturers sit between these extremes, reformulating steadily but more gradually than food categories facing direct retailer pressure.

A generational shift in buyer profile is underway too. Younger brand and procurement teams at packaged food companies increasingly treat clean-label reformulation as a default assumption rather than a negotiable cost line, a mindset shift that is accelerating volume decline in wealthy markets even independent of near-term regulatory action. This shift is occurring even in categories where near-term regulatory action remains unlikely.
artificial-preservative-market-trends-end-use-penetration-index-1787461472449

Where Artificial Preservative Value Concentrates Next

These are among the four positions where our research anticipates prominent divergence between winners and laggards over the coming forecast period. Each is grounded in the demand model, the regulatory perimeter, and the announced capacity pipeline.
01 / CHEMISTRY MIX STRATEGY

Prioritize sorbate and antioxidant capacity over legacy chemistry expansion

Sorbate and synthetic antioxidant demand is compounding well above the broader category average, and producers who have already shifted mix report meaningfully better blended margins than those still weighted toward parabens and legacy chemistries. Producers still expanding benzoate or sulfite capacity are chasing a shrinking margin pool relative to lower-scrutiny alternatives. The economics of this mix shift now clear payback thresholds that looked marginal only a few years ago, making it the clearest capital allocation priority for producers with flexibility to reallocate production capacity.
02 / EMERGING MARKET POSITIONING

Build South Asian manufacturing presence before Chinese producers consolidate share

Chinese producers have gained meaningful export share in South Asian markets over the past several years through aggressive capacity expansion and price competition that Western incumbents have been considerably slower to match directly. Producers without local manufacturing presence risk losing this fast-growing volume pool entirely as Chinese suppliers finalize preferred customer relationships across the region. The window for establishing a genuinely competitive local presence will not stay open indefinitely once Chinese producers fully consolidate their current cost and logistics advantage across every major market.
03 / NITRITE SUBSTITUTE DEVELOPMENT

Invest in nitrite alternatives before a competitor reaches scale first

Nitrites remain the most regulation-resilient segment in the category precisely because no proven substitute exists at comparable safety and cost performance, but that insulation could disappear quickly if any competitor successfully commercializes a validated alternative first. Producers without active development programs risk losing this durable revenue base to whichever competitor reaches commercial scale first with a credible substitute. Early movers in this specific area stand to capture outsized value given how few credible alternatives currently exist across the entire industry.
04 / REGULATORY RISK MANAGEMENT

Diversify chemistry portfolio ahead of the next EFSA review cycle

The EFSA re-evaluation process has already reduced permitted usage levels for several preservative chemistries without issuing full bans, and producers concentrated in any single chemistry facing near-term review remain vulnerable to sudden demand disruption. Diversifying across multiple chemistry classes reduces this concentration risk meaningfully, as does early regulatory engagement during open comment periods well before final rulings are issued. Producers who wait until a ruling is finalized will have far less influence over the outcome than those engaging proactively with regulators today.

Engagement Snapshot From the Field

A live engagement with an industry participant carrying material or product regulatory and market exposure ahead of a defining policy shift, showing how our research translates into a defensible multi-year portfolio strategy.
MARKET MINDS ADVISORY · CLIENT ENGAGEMENT SUMMARY
Artificial Preservative Producer Strategic Portfolio Review and Transition Roadmap 2026·Investment Scenario on Artificial Preservative Exposure Evaluation 2025-26
CLIENT PROFILE
The client, a mid-tier synthetic preservative producer headquartered in Western Europe with reported annual revenue of approximately 190 million dollars (client-reported, unverified by MMA), operates production facilities supplying benzoates and sulfites primarily into regional food and beverage markets, with limited presence in higher-margin sorbate and antioxidant segments relative to established leaders. with a customer base built up over more than a decade of regional operation.
STRATEGIC CHALLENGE
The client faced sustained margin compression from both clean-label reformulation pressure and Chinese import competition on its core benzoate business, while lacking the sorbate production capability and emerging market presence needed to offset declining Western European volume through alternative growth channels entirely. a decision that would shape its competitive positioning for years to come.
MMA APPROACH
MMA conducted a comparative margin analysis across preservative chemistries using primary survey data and expert interviews with food manufacturer buyers, benchmarked the client's cost structure against integrated competitors, and modeled portfolio shift scenarios weighted by projected demand growth across each chemistry segment through 2036, drawing on this report's underlying dataset.
KEY FINDINGS
  1. Sorbate conversion offered a projected eight to twelve point margin improvement over the client's existing benzoate product line within three years of sustained capacity investment.
  2. Regional cosmetic manufacturers reformulating away from parabens were actively seeking additional qualified sorbate suppliers, an opportunity the client had not yet pursued.
  3. The client's existing production infrastructure was reasonably well suited to sorbate manufacturing with moderate process modifications rather than entirely new facility investment.
  4. Competing regional producers had not yet made equivalent chemistry mix shifts, giving the client a meaningful first-mover window in its home market.
CLIENT PROFILE
The client, a mid-tier synthetic preservative producer headquartered in Western Europe with reported annual revenue of approximately 190 million dollars (client-reported, unverified by MMA), operates production facilities supplying benzoates and sulfites primarily into regional food and beverage markets, with limited presence in higher-margin sorbate and antioxidant segments relative to established leaders. with a customer base built up over more than a decade of regional operation.
STRATEGIC CHALLENGE
The client faced sustained margin compression from both clean-label reformulation pressure and Chinese import competition on its core benzoate business, while lacking the sorbate production capability and emerging market presence needed to offset declining Western European volume through alternative growth channels entirely. a decision that would shape its competitive positioning for years to come.
MMA APPROACH
MMA conducted a comparative margin analysis across preservative chemistries using primary survey data and expert interviews with food manufacturer buyers, benchmarked the client's cost structure against integrated competitors, and modeled portfolio shift scenarios weighted by projected demand growth across each chemistry segment through 2036, drawing on this report's underlying dataset.
KEY FINDINGS
  1. Sorbate conversion offered a projected eight to twelve point margin improvement over the client's existing benzoate product line within three years of sustained capacity investment.
  2. Regional cosmetic manufacturers reformulating away from parabens were actively seeking additional qualified sorbate suppliers, an opportunity the client had not yet pursued.
  3. The client's existing production infrastructure was reasonably well suited to sorbate manufacturing with moderate process modifications rather than entirely new facility investment.
  4. Competing regional producers had not yet made equivalent chemistry mix shifts, giving the client a meaningful first-mover window in its home market.
RECOMMENDED STRATEGY
Phase 1: Phase 1 (0-6 months): Commission process modifications to enable sorbate production alongside existing benzoate capacity. with priority given to its largest existing customer accounts. Phase 2: Phase 2 (6-18 months): Pursue qualification trials with regional cosmetic and food manufacturers reformulating away from parabens. while validating performance data across multiple production batches. Phase 3: Phase 3 (18-36 months): Scale sorbate production based on qualification success and evaluate additional emerging market export opportunities. while monitoring customer conversion rates closely throughout the rollout.
OUTCOME
Within eighteen months of implementing the phased strategy, the client reported securing several new sorbate supply contracts and a reported blended gross margin improvement of roughly six percentage points across its product portfolio (client-reported, unverified by MMA), partially offsetting continued benzoate volume decline. Customer retention across its remaining benzoate lines also improved noticeably during the transition.

Frequently Asked Questions

Foundational context covering the market sizes, CAGR, scope, country, region and competition that inform every finding below. This section is provided to cover basics and most often pre-purchase conversations, answered from the MMA Primary Research Dataset.

What is the current size of the Artificial Preservative Market?

The global artificial preservative market was valued at approximately 2.8 billion dollars in 2025. Growth is concentrated in emerging market packaged food manufacturing rather than developed-market volume expansion.

How large will the Artificial Preservative Market be by 2036?

The market is projected to reach approximately 4.05 billion dollars by 2036. This represents roughly a 1.40 times expansion from 2026 levels over the forecast period.

What is the CAGR for the Artificial Preservative Market 2026 to 2036?

The market is forecast to grow at a compound annual growth rate of 3.4 percent between 2026 and 2036. Bull and bear scenarios range from 2.2 to 4.6 percent depending on reformulation pace.

Which segment is growing fastest?

Sorbates are the fastest-growing segment, expanding at approximately 5.2 percent annually. This is roughly 1.53 times the overall market growth rate, driven by reformulation away from parabens and nitrites.

Who are the major companies in the Artificial Preservative Market?

Leading producers include Eastman Chemical, Corbion N.V., Niacet Corporation, Emerald Kalama Chemical, and Jungbunzlauer Suisse AG. These five companies control roughly thirty-eight percent of global production capacity.

Which country is growing fastest?

India is the fastest-growing national market, expanding at approximately 6.1 percent annually. Growth is driven by expanding packaged food manufacturing capacity and rising urbanization across the country.

Report Segmentation Architecture

The full report scope spans multiple orthogonal segmentation dimensions, with cross-tabulated demand data provided for each dimension pair. Coverage extends further to regional breakdowns, trend trajectories, and the competitive detail needed to support segment-level decision-making.

By Preservative Chemistry

  • Benzoates
  • Sorbates
  • Sulfites
  • Nitrites and Nitrates
  • Parabens
  • Synthetic Antioxidants

By End-Use Industry

  • Food and Beverage Manufacturing
  • Meat and Poultry Processing
  • Cosmetics and Personal Care
  • Pharmaceutical Manufacturing
  • Animal Feed Processing

By Commercial Dimension

  • Direct Manufacturer Supply
  • Distributor Channel Sales
  • Private-Label Contract Supply
  • Spot Market Transactions

By Region

  • North America
  • Western Europe
  • East Asia
  • South Asia and Pacific
  • Latin America
  • Middle East and Africa
  • Eastern Europe

Scope, Methodology, and Coverage

Every figure in this report is reproducible from documented input assumptions. The scope below maps the historical period, the forecast horizon, the segmentation dimensions, and the countries covered, alongside the underlying primary and qualitative methodology.
Historical Period
2020 to 2025
Forecast Period
2026 to 2036
Base Year
2025 (USD billions; MMA Primary Research Dataset, August 2026)
Market Definition
The artificial preservative market covers commercial production and sale of synthetic chemical preservatives, including benzoates, sorbates, sulfites, nitrites and nitrates, parabens, and synthetic antioxidants, used to extend shelf life across food and beverage, cosmetic, and pharmaceutical applications. It excludes natural preservative alternatives and finished consumer products that merely incorporate preservatives as one ingredient among many.
Quantitative Units
USD billions (current prices); metric tons of production volume where applicable
Segmentation Dimensions
By Preservative Chemistry; By End-Use Industry; By Commercial Dimension; By Region
Regions Covered
North America, Western Europe, East Asia, South Asia and Pacific, Latin America, Middle East and Africa, Eastern Europe
Countries Covered
USA, China, Germany, France, UK, Japan, South Korea, India, Australia, Canada, Brazil, Mexico, Indonesia, Vietnam, Thailand, Malaysia, UAE, Saudi Arabia, South Africa, Nigeria, Turkey, Poland, Netherlands, Italy, Spain, Sweden, Switzerland, Argentina, Colombia, Singapore, and additional markets relevant to this sector
Key Companies Profiled
Eastman Chemical, Corbion N.V., Niacet Corporation, Emerald Kalama Chemical, Jungbunzlauer Suisse AG, Kemin Industries, Balchem Corporation, Foodchem International Corporation, Hawkins Inc, Impextraco, Vizag Chemical International, DFI Corporation, Archer-Daniels-Midland, Univar Solutions, Cargill, Tate and Lyle, Purac, Prinova Group, Hydrite Chemical, Jost Chemical
Quantitative Methodology
Primary survey, n=3,800 respondents, Q4 2025, six countries; demand-side model with trade association cross-validation
Qualitative Methodology
47 expert interviews, Q4 2025; applied to validate demand model assumptions, identify emerging dynamics, and assess competitive positioning
Report Format
PDF and XLSX data workbook (Word format preview document)
Publisher
Market Minds Advisory
Report Code
MMA-2026-CHM-103
Published
August 2026
Contact
sales@marketmindsadvisory.com | www.marketmindsadvisory.com

Purchase the full Artificial Preservative Market Report (2026 to 2036).

This report delivers a complete commercial assessment of the global artificial preservative market across chemistry segments, competitive dynamics, and seven world regions. It includes detailed segmentation analysis, competitive benchmarking of twenty profiled companies, and quantified regulatory and feedstock cost risk assessments across every major producing geography. Analysts combine primary survey data from 3,800 respondents with 47 expert interviews conducted in the fourth quarter of 2025 to validate demand forecasts running through 2036. The report is designed to support portfolio strategy, capacity planning, and regulatory risk management decisions for preservative producers and buyers alike.
Ten-year quantitative market forecast across all segments
Detailed chemistry-level segmentation analysis and pricing
Seven-region demand breakdown with share and CAGR data
Twenty-company competitive profiles with moat and risk analysis
Regulatory risk assessment with producer mitigation strategies
Clean-label reformulation and nitrite substitute opportunity analysis

Built For The People Who Decide

From boardroom strategy to bench-side execution, this report is read cover-to-cover by leaders shaping the next decade of their industry, turning demand scenarios, market dynamics and valuation benchmarks into decisions.
CXOs/ Presidents/ VPs/ Managers
M&A and Corporate Development
Strategy Teams and R&D Heads
Procurement and Product Directors
Regulatory and Compliance Leaders
Investor Relations and Equity Analysts