Market Minds Advisory
Arthroscopy Visualization Systems Market

Arthroscopy Visualization Systems Market: Digital Imaging and the Orthopedic Surgical Suite

Hospitals and ambulatory surgery centers are replacing analog scope towers with 4K and fluorescence-capable digital platforms, compressing upgrade cycles as orthopedic surgeons demand sharper visualization for increasingly complex arthroscopic repair procedures.

Lead Analyst

Alice Ballenger

Published

September 2026

Make Smarter Decisions with Customized Research Insights

Request a free sample report and evaluate market opportunities, growth trends, and competitive dynamics relevant to your business needs.

2025 MARKET VALUE$1.6BMarket Size 2025
2036 FORECAST VALUE$3.5BBase Case , 2026 to 2036
CAGR 2026 TO 20367.5 %Bull 8.8% / Bear 6.3%
INCREMENTAL OPPORTUNITY$1.8BNet 10- year value creation
EXPANSION MULTIPLE2.06x2036 value over 2026 base
Strategic Levers
M&A Pipeline
Regional Outlook
Country Rankings
Competitive Intelligence
Segmental Deep-dive
Call-Us : 91 93563 13602

Executive Snapshot and Market Trajectory

Surgeons are pushing hospitals to retire analog and early digital towers, favoring 4K and fluorescence-ready platforms that sharpen visualization inside tight joint spaces during increasingly complex repair work, a shift written into purchasing standards at leading academic medical centers. Image clarity now shapes buying decisions as much as price.
Ambulatory surgery centers are absorbing a growing share of arthroscopic procedure volume as payers steer elective orthopedic cases away from inpatient settings, and equipment purchasing has followed that shift, concentrating replacement demand in East Asia and North America where ASC buildout is expanding fastest and hospital capital committees increasingly treat visualization towers as a single bundled line item rather than components sourced separately.
Five manufacturers hold more than half of global revenue, yet integrated platform vendors are gaining ground against component-only sellers as hospitals prefer single-vendor towers over separately sourced scopes, cameras, and light sources bought under separate service contracts. Regulatory pressure around fluorescence imaging feature parity is compressing the gap between premium and standard configurations, and Asian challengers are using that compression to enter mid-tier tenders once considered defensible territory for the leading five vendors.
Market Definition
The Arthroscopy Visualization Systems Market covers rigid arthroscopes, camera control units, light sources, image capture and documentation systems, surgical displays, and integrated visualization platforms used in minimally invasive joint surgery. It excludes general laparoscopic and general endoscopic visualization equipment sold outside orthopedic surgical applications.
Base Year Value
$1.6B in 2025 (MMA Primary Research Dataset, August 2026)
Forecast Period
2026 to 2036, eleven discrete annual values
CAGR
7.5% base case. Bull 8.8%. Bear 6.3%.
Fastest Growth Segment
Integrated All-in-One Visualization Platforms: 10.5% CAGR
Fastest Growth Country
China: 9.5% CAGR
Fastest Growth Region
South Asia and Pacific: 9.5% CAGR
Largest Region
North America: 30% of 2025 global value
Market Leaders
Stryker Corporation, Smith+Nephew plc, Arthrex Inc, Olympus Corporation, Karl Storz SE & Co. KG. Source: MMA Analysis based on company annual reports.
Primary Survey
n=3,800 procurement and R&D decision-makers, Q4 2025, six countries
Methodology
Demand-side build-up, cross-validated against public data, 47 expert interviews

Arthroscopy Visualization Systems Market Forecast Scenarios

arthroscopy-visualization-systems-market-size-forecast-scenario-1787305986069
Between 2020 and 2025 the market moved from analog holdovers toward standard digital platforms, interrupted briefly by elective surgery deferrals during the pandemic before rebounding as backlogged orthopedic caseloads cleared through 2022 and 2023, restoring replacement purchasing across most regional markets and pulling hospital capital budgets back toward pre-pandemic equipment planning levels. Vendors report equipment order backlogs largely normalized by early 2024.
The base case assumes steady 7.5% annual growth through 2036, anchored to three mechanisms: rising arthroscopic procedure volume tied to an aging population, faster equipment replacement cycles as 4K and fluorescence imaging become the purchasing standard rather than a premium option, and continued migration of elective orthopedic cases into ambulatory surgery centers that each require their own dedicated visualization tower. Group purchasing organizations have reinforced this trajectory through updated contract language.
The bull case centers on accelerated ambulatory surgery center buildout across East Asia pulling forward tower purchases well ahead of scheduled replacement cycles as new facilities open faster than currently planned. The bear case centers on hospital capital budget tightening delaying upgrade decisions, stretching average replacement cycles by a year or more across price-sensitive markets worldwide. Neither scenario shifts the leading five manufacturers' relative rankings materially.

Digital Upgrade Cycles and the Ambulatory Shift

Hospital procurement committees increasingly treat visualization towers as a single capital line item rather than a bundle of separately sourced components, favoring vendors who can service the entire platform under one contract rather than coordinating scope, camera, and light source repairs across three suppliers, a shift that has meaningfully simplified purchasing for smaller hospital systems. Vendors that cannot offer full-platform service contracts increasingly lose consideration entirely.
MARKET CONCENTRATIONCR5 58%Top five vendors hold more than half of revenue
AVERAGE SELLING PRICE$38,000-52,000Full tower configuration including camera and light source
TOP PRODUCING COUNTRYUnited States, 34% shareLargest base of installed manufacturing and assembly capacity
CAPACITY UTILISATION76%Reflects steady but not maximal production line usage
REPLACEMENT CYCLE LENGTH7-9 yearsReflects the typical hospital equipment lifespan before full replacement
FEEDSTOCK COST SHARE31% of COGSOptical components and imaging sensors as input cost
Surgeon preference now drives purchasing decisions more than administrator cost comparisons in most developed markets, since image clarity directly affects operating time and complication rates in tight joint spaces where visibility margins are already thin, and surgeons increasingly sit on the purchasing committees that finalize equipment contracts rather than simply reviewing recommendations after the fact. That shift has raised the bar for vendor sales teams calling on clinical staff directly.
Over the next decade, fluorescence-capable imaging and cloud-connected documentation systems will likely become the baseline expectation rather than a premium add-on, compressing the gap between standard and premium tower configurations across most price-sensitive regional markets and narrowing the price umbrella that has historically protected the leading five manufacturers' margins. Vendors slow to add these features risk losing tender consideration outright within a few cycles.
"The tower isn't the product anymore. Hospitals are buying a service relationship with an imaging vendor, and the box just happens to come attached to it."
Director, Medical Technology Practice · MMA Medical Devices Practice &midd

Market Trends

4K and Fluorescence Imaging Becomes the Purchasing Baseline

Hospital tenders increasingly specify 4K resolution and near-infrared fluorescence capability as minimum requirements rather than optional upgrades, a shift accelerated by peer-reviewed data showing reduced revision rates when surgeons operate with sharper intraoperative visualization. Major academic medical centers in the United States and Germany have published internal purchasing standards requiring 4K-minimum towers for new orthopedic surgical suites opening after 2025, and group purchasing organizations covering more than 900 US hospitals have followed with similar language in their latest multi-year equipment contracts, pulling replacement demand forward across facilities that had planned to defer upgrades until standard analog towers failed outright.
Market Impact: Adds 4% annual volume growth
Ambulatory Surgery Centers Draw Procedure Volume From Hospitals

US Centers for Medicare and Medicaid Services reimbursement changes have expanded the list of arthroscopic procedures approved for ambulatory surgery center settings, and commercial payers have followed with matching site-of-service steerage policies that favor lower-cost outpatient venues over inpatient hospital operating rooms. Each newly opened orthopedic-focused ASC represents a discrete capital purchase decision for a dedicated visualization tower, separate from any hospital's existing equipment base, and ASC operators report shorter capital approval cycles than hospital systems, letting vendors close sales faster once a facility decides to open or expand its surgical footprint.
Market Impact: Expands patient pool 6% yearly

Market Opportunities and Growth Drivers

Aging Population Raises Arthroscopic Procedure Volume

Rising rates of osteoarthritis and sports-related joint injury among an aging population are pushing arthroscopic knee, shoulder, and hip procedure counts higher across every major market MMA tracks, with United States Census Bureau projections showing the 65-plus cohort expanding by roughly 12 million people over the coming decade. Orthopedic surgeon associations in the United States and Japan report steady annual increases in case volume tied directly to this demographic shift, and each additional procedure adds utilization pressure on existing visualization towers, shortening their effective operating life and pulling forward replacement purchasing cycles across hospital systems already running near full capacity.
Market Impact: Extends replacement cycles 2 years

Sports Medicine Expansion Widens the Addressable Patient Base

Youth and amateur sports participation has climbed steadily across North America and East Asia over the past decade, widening the pool of patients presenting with meniscus, rotator cuff, and labral injuries suited to arthroscopic repair rather than open surgery. National sporting federations in South Korea and the United States report participation growth exceeding 6% annually in organized youth leagues, and orthopedic practices serving these populations increasingly market arthroscopic repair as the standard of care over conservative management, sustaining procedure volume growth even where population aging alone would not fully explain it across younger patient demographics.
Market Impact: Limits advanced feature use 40%

Market Restraints and Challenges

High Capital Cost Slows Replacement in Price-Sensitive Markets

A full visualization tower configuration with 4K camera, fluorescence-capable light source, and documentation system commonly runs $38,000 to $52,000, a capital outlay that smaller hospitals and ambulatory centers in South Asia, Latin America, and parts of Eastern Europe often cannot justify against competing capital priorities in the same budget cycle. The root cause is that reimbursement rates for arthroscopic procedures in these markets have not risen proportionally with equipment pricing, compressing the return-on-investment case for upgrading. Vendors are exploring leasing and pay-per-procedure financing models to lower the upfront barrier for facilities that cannot commit to a single large capital purchase.
Market Impact: Pulls forward 18% of replacement de

Surgeon Training Gaps Limit Advanced Feature Adoption

Fluorescence-guided and AI-assisted visualization features often go unused even at facilities that have purchased them, because many practicing orthopedic surgeons trained before these tools became standard and lack structured retraining pathways to build proficiency with them. The root cause is that residency curricula have been slower to update than the equipment itself, leaving a skills gap between what towers can do and what surgeons are comfortable using during live procedures. Device makers have begun funding cadaver lab training sessions and proctored case observation programs to close this gap, though uptake still varies by hospital system and requires ongoing monitoring.
Market Impact: Adds 1,200 new ASC buyers yearly
3 additional market trends, 4 additional growth drivers, and 3 additional restraints and challenges are covered in the full report. Contact sales@marketmindsadvisory.com to access the complete intelligence.

Segment CAGR and Growth Architecture

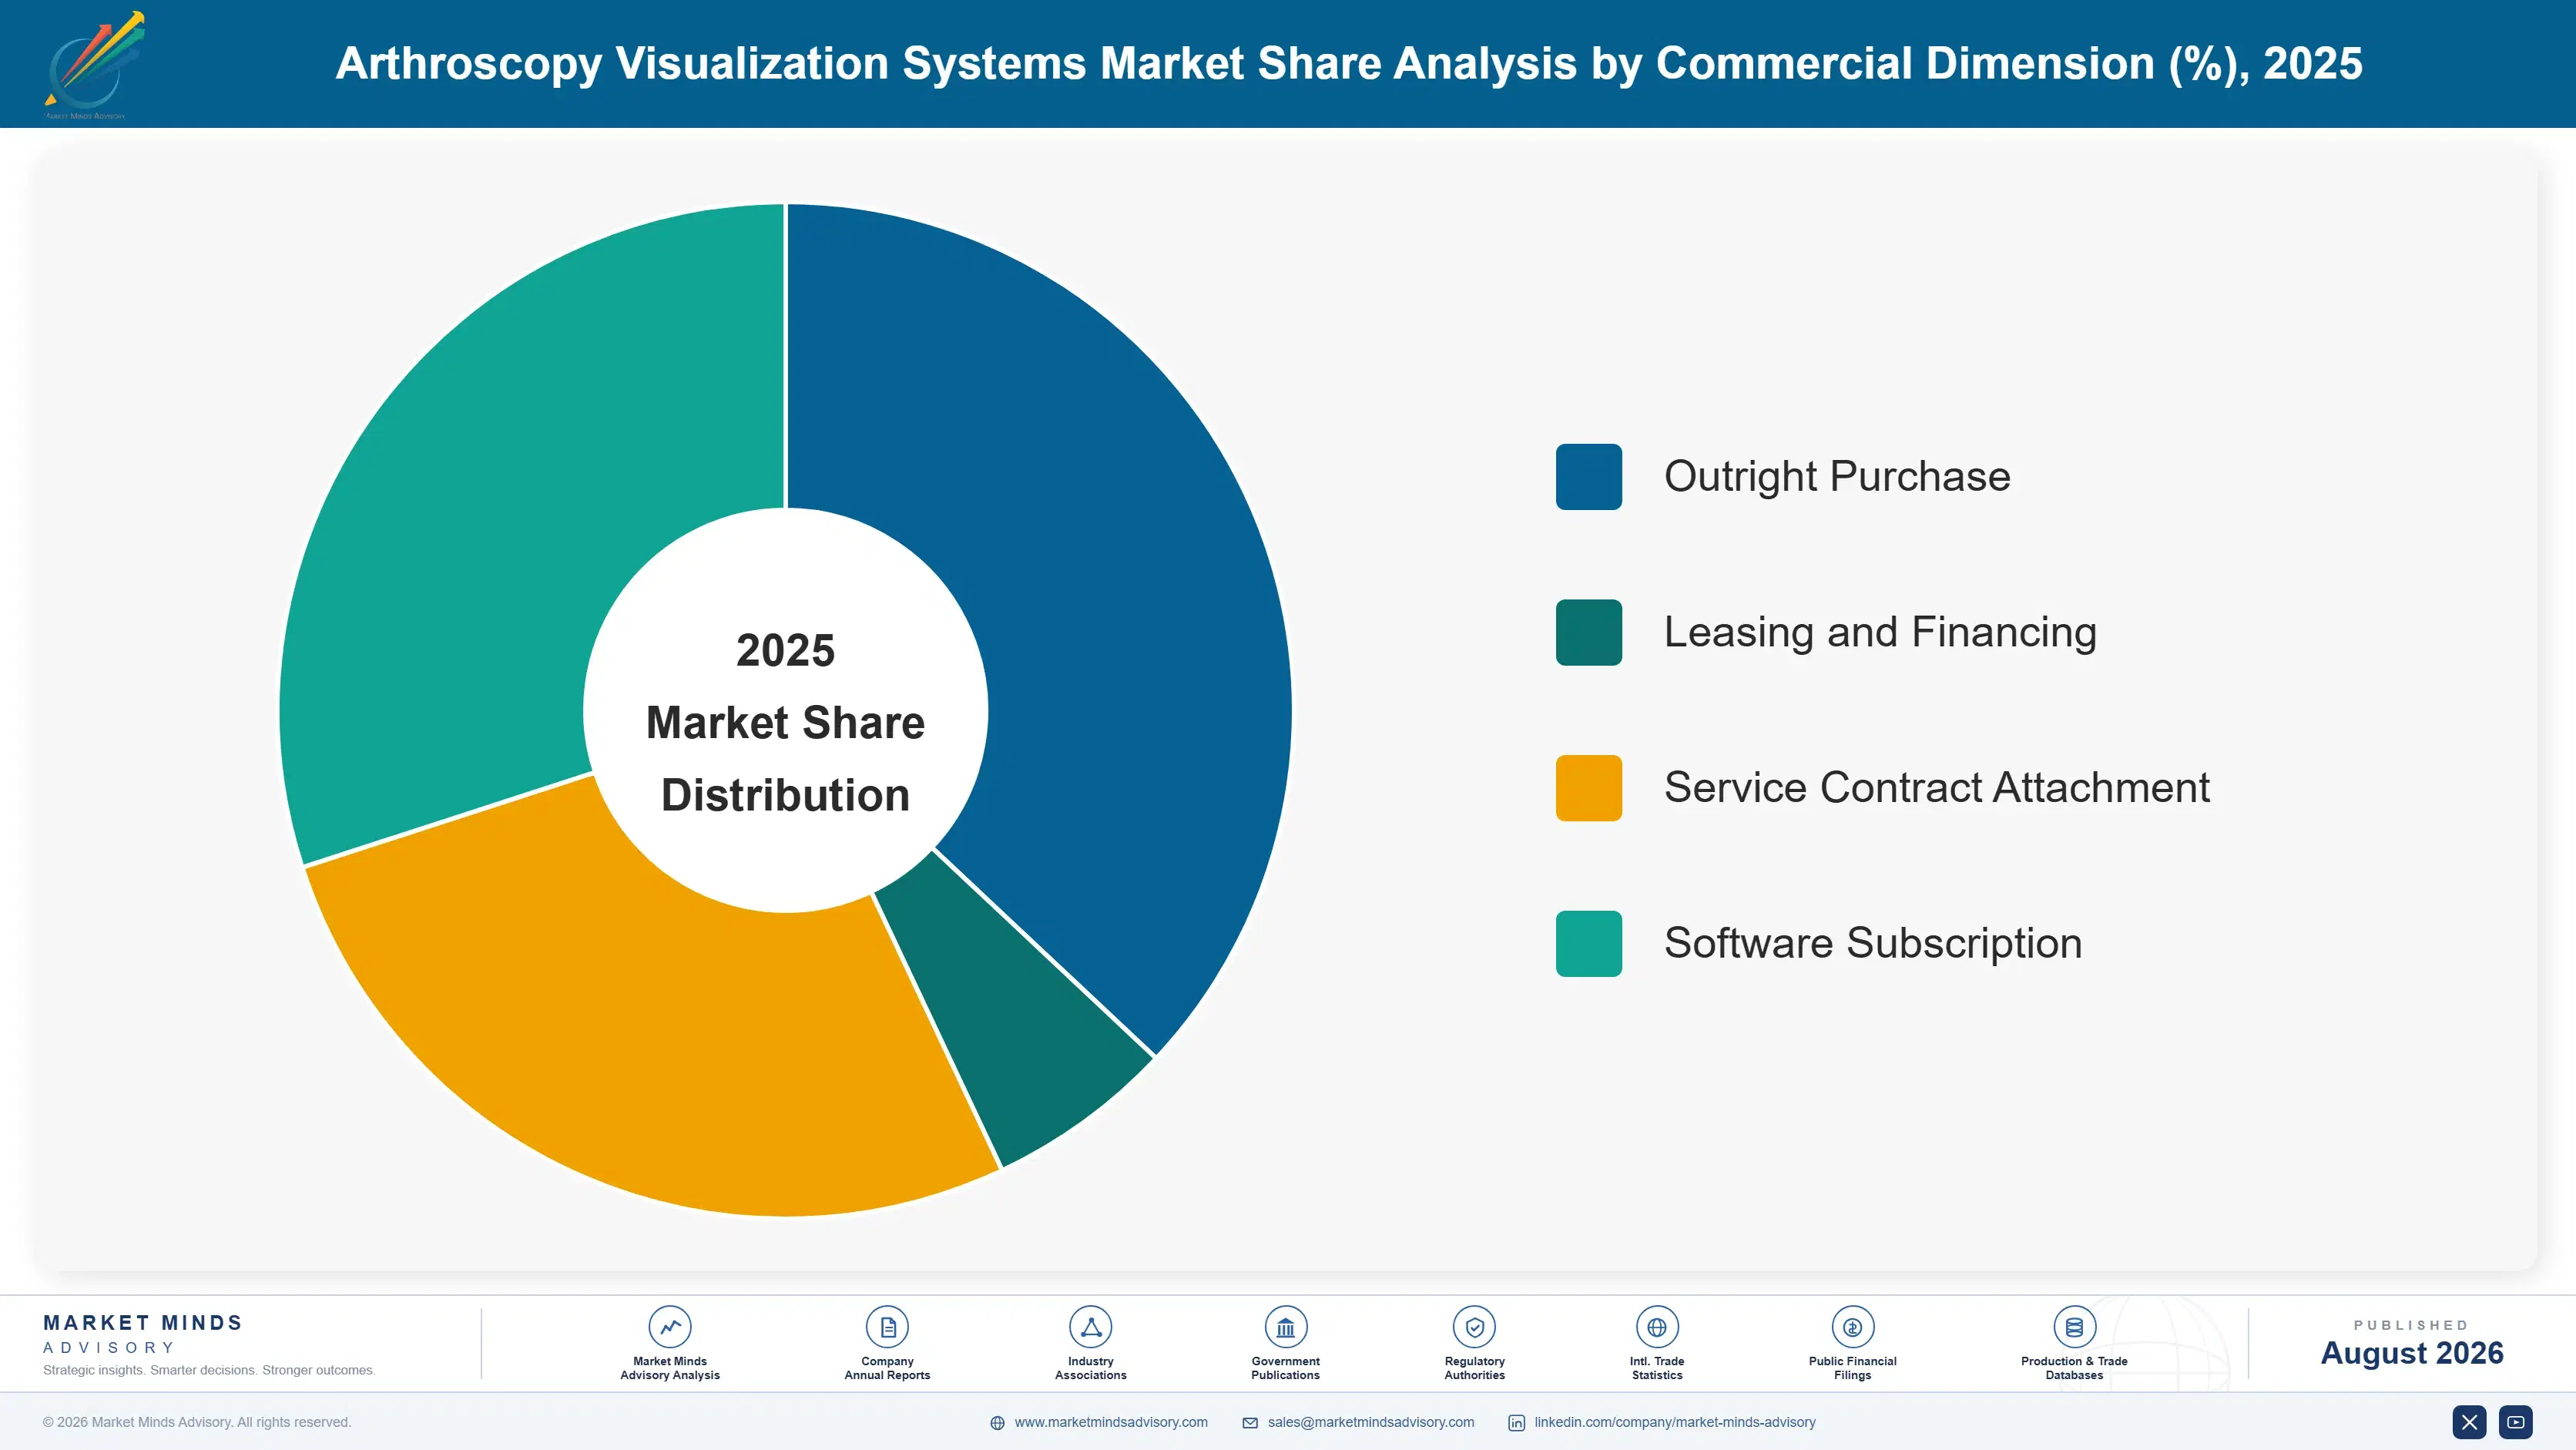
The market segments by visualization system component and platform type, spanning arthroscopes, camera systems, light sources, documentation systems, displays, and bundled platforms, since hospitals purchase and replace each category on its own distinct capital cycle, vendor relationship, and service contract structure. No single component category alone dominates purchasing decisions across every hospital facility type.
arthroscopy-visualization-systems-market-market-share-analysis-1787305986604

Integrated All-in-One Visualization Platforms

Bundled towers combining arthroscope, camera control unit, light source, and documentation system under a single vendor service contract are the fastest-growing category as hospitals move away from assembling component systems from multiple suppliers. Group purchasing organizations favor bundled platforms because they simplify service agreements and reduce the coordination burden when equipment needs repair, and vendors have responded by pricing bundles competitively against component-by-component purchasing to capture the full account relationship. Ambulatory surgery centers opening new facilities almost universally purchase bundled platforms rather than assembling systems piecemeal, since a new facility has no legacy component base to work around and simply buys whatever configuration a vendor recommends as the current standard offering for a newly built orthopedic surgical suite.
CAGR 10.5%

High-Definition and 4K Displays and Monitors

Surgical displays are being replaced faster than any other visualization component as 4K becomes the baseline expectation in new hospital tenders and academic medical center purchasing standards. Because displays have a shorter useful life than camera heads or light sources and are less expensive to replace individually, hospitals often upgrade monitors on a faster cycle than the rest of the tower, creating a distinct replacement rhythm within the broader visualization category. Surgeons report that display quality affects perceived image sharpness as much as camera sensor quality itself, making monitor upgrades a relatively low-cost way for facilities to improve visualization performance without replacing the full tower configuration. Vendors increasingly price display upgrades as a standalone upsell separate from full tower replacement.
CAGR 9.0%
Full segment breakdown across 6 segments available in the complete report.

Regional Architecture and Country Demand Map

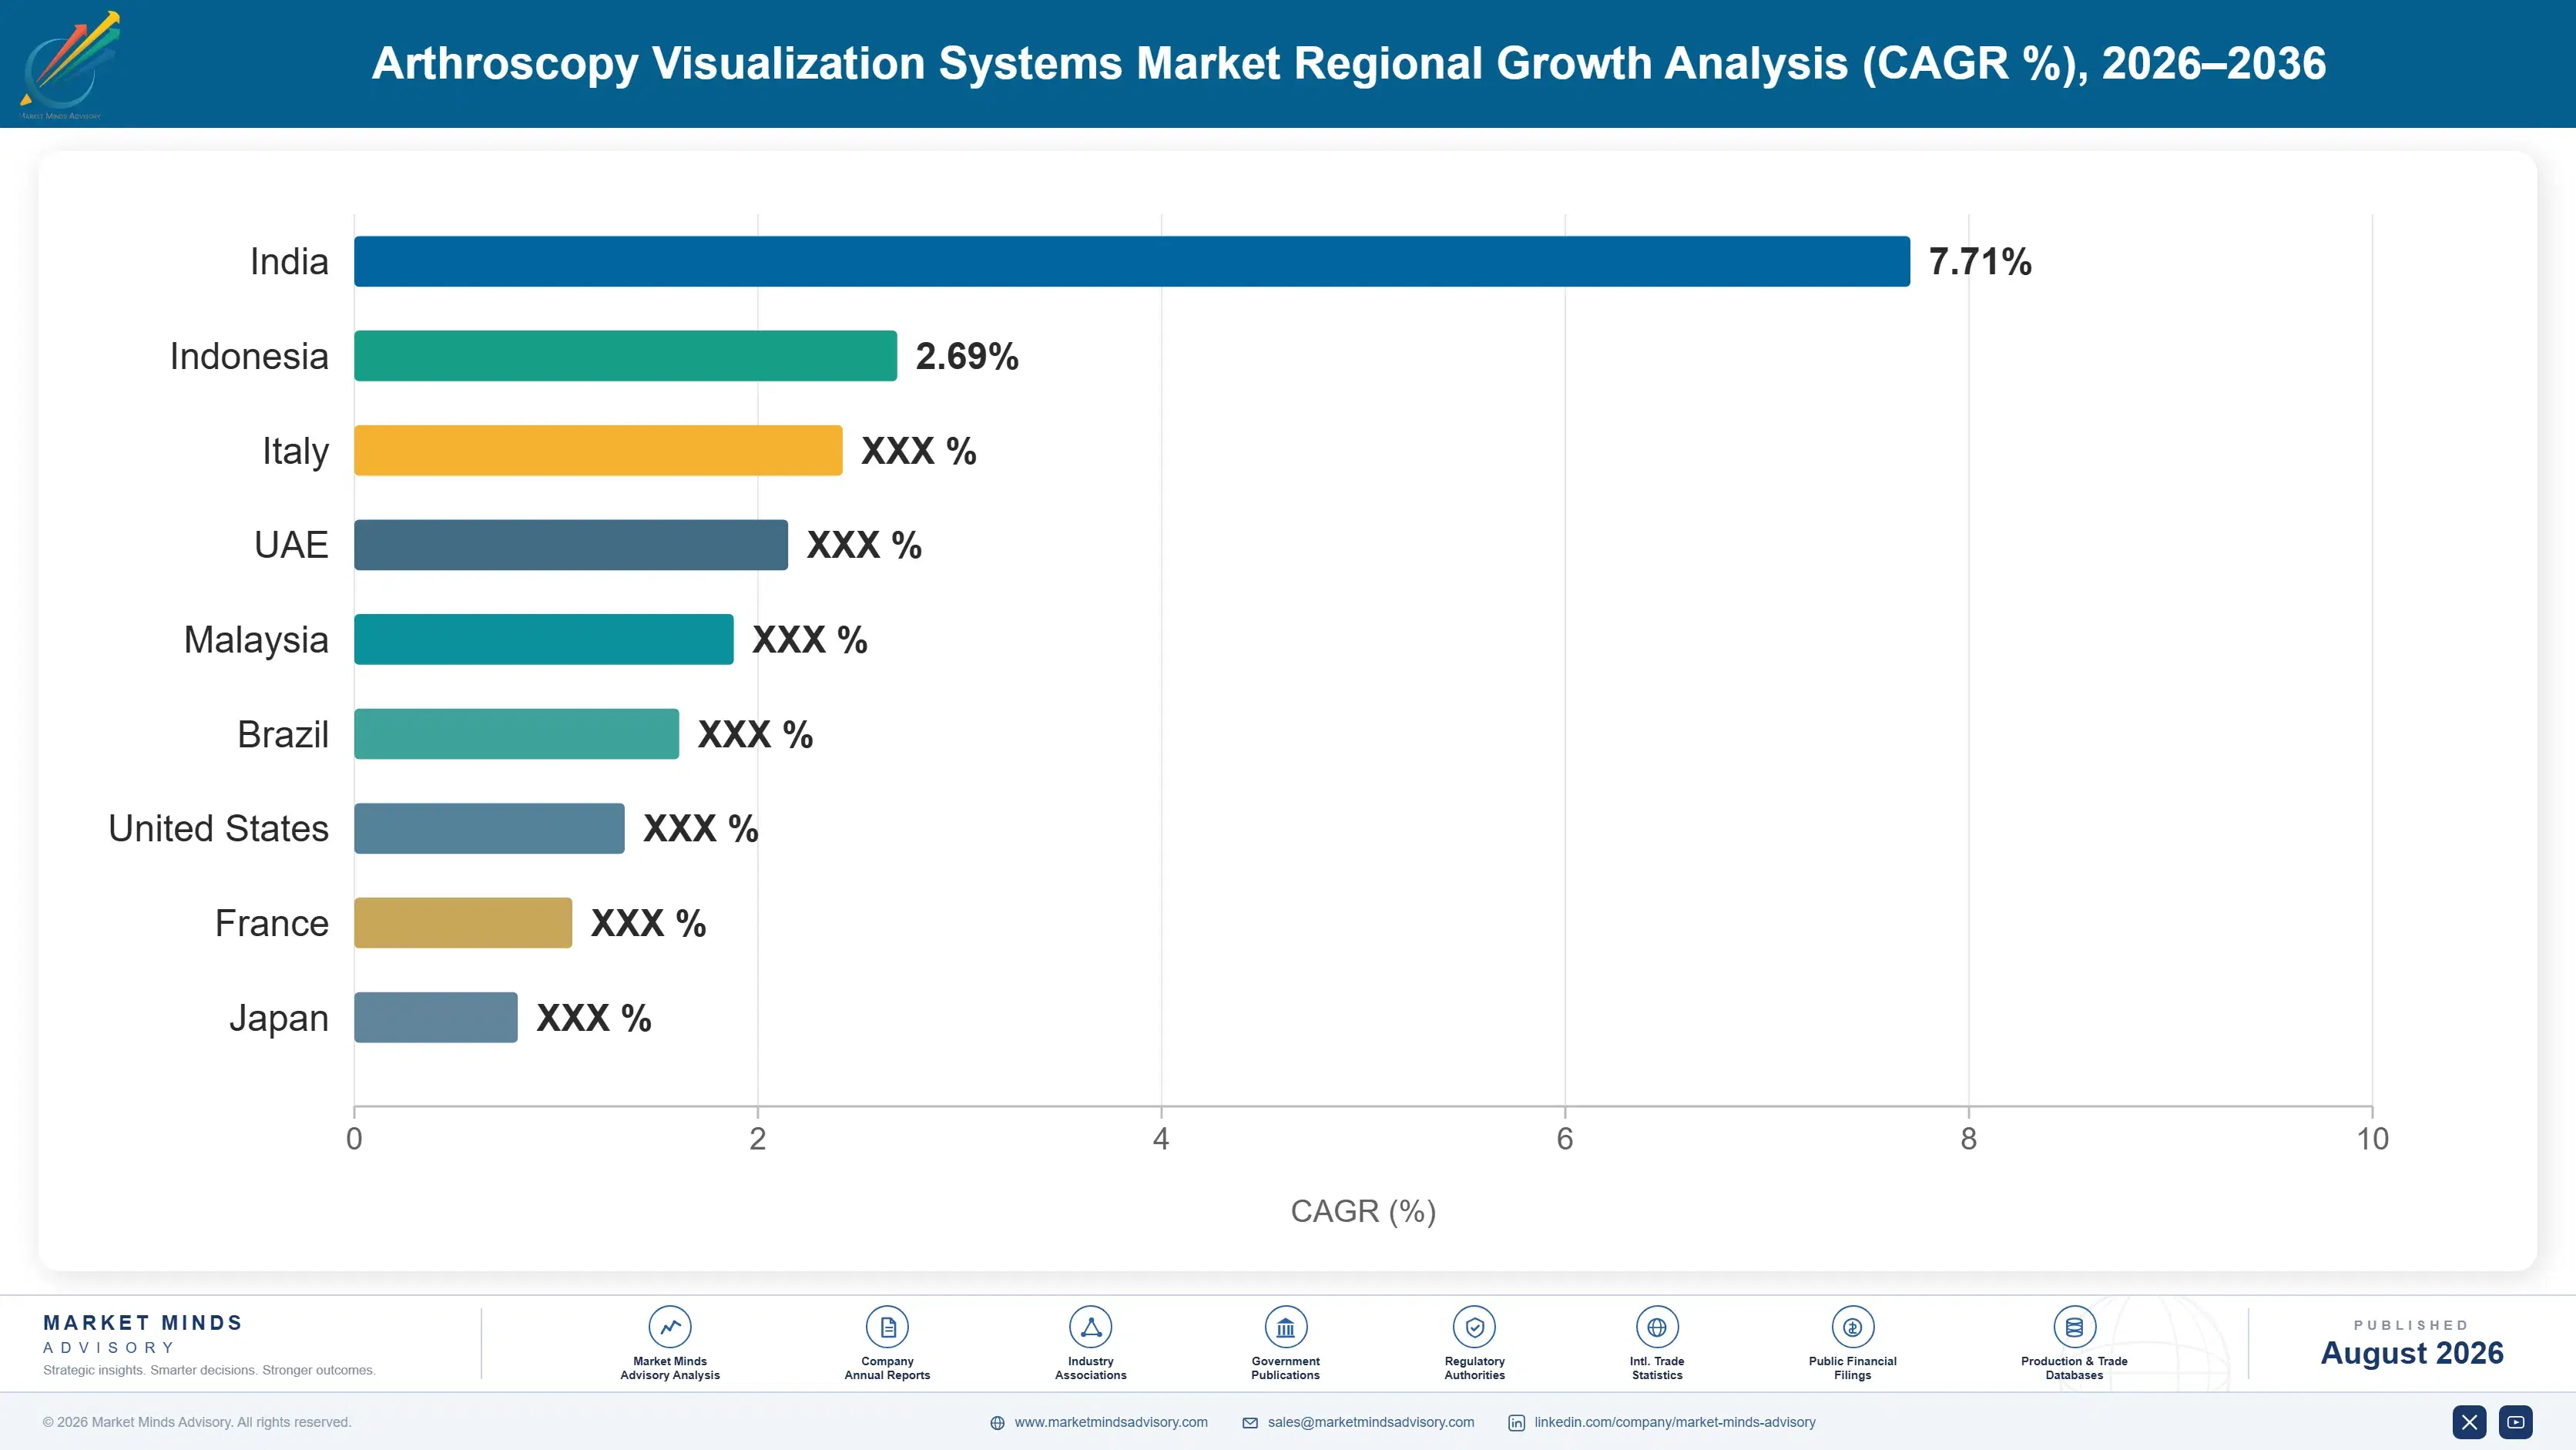
North America and East Asia together account for well over half of global revenue, reflecting concentrated ambulatory surgery center buildout and hospital capital spending, while South Asia and Pacific shows the fastest regional growth off a smaller existing installed equipment base across its hospital network.

North America

United States hospital systems and ambulatory surgery centers hold the largest concentration of installed visualization towers of any region, and CMS reimbursement policy continues to expand the list of arthroscopic procedures approved for outpatient settings. Group purchasing organizations covering hundreds of hospitals have begun specifying 4K-minimum requirements in new equipment contracts, pulling replacement demand forward across facilities that might otherwise have deferred upgrades for several more years. Canada's provincial health systems add modest incremental volume, though capital budget cycles there run longer than in the United States. Sports medicine practices serving a growing youth athletic population sustain steady procedure volume across both countries, keeping utilization rates on existing towers high enough to justify continued replacement investment.
Share: 30% | CAGR: 7.0% (2026 to 2036)

Western Europe

Germany and the United Kingdom carry the largest share of regional demand, supported by well-funded public hospital systems that maintain scheduled equipment replacement cycles rather than running towers until failure. France and the Nordic countries follow with steady but smaller purchasing volumes tied to national health service capital budgets that are typically set several years in advance. Regulatory harmonization under the EU Medical Device Regulation has raised compliance costs for smaller vendors, consolidating purchasing toward established manufacturers with the resources to maintain full regulatory documentation. Sports medicine demand is more modest here than in North America or East Asia, so replacement cycles lean more heavily on population aging and standard orthopedic caseload growth than on youth athletic injury volume.
Share: 24% | CAGR: 6.0% (2026 to 2036)
Regional intelligence for 5 additional markets available in the complete report: East Asia, South Asia and Pacific, Latin America, Middle East and Africa, Eastern Europe. Contact sales@marketmindsadvisory.com.
arthroscopy-visualization-systems-market-country-cagr-analysis-1787305987119

Where Visualization Vendors Can Grow Margin

Beyond unit volume growth, vendors have several concrete paths to lift revenue per account, spanning service contract attachment, financing structures, software subscription features, and bundled platform sales that displace component-by-component purchasing across existing hospital and ambulatory center relationships already under contract for at least one visualization category. Each lever applies broadly across hospital, ambulatory, and academic accounts alike.

Attaching Multi-Year Service and Maintenance Contracts

Vendors increasingly attach multi-year service and preventive maintenance contracts to tower sales, converting a one-time capital transaction into a recurring revenue relationship worth roughly 8 to 12% of the original equipment price annually. Hospitals favor bundled service agreements because unplanned equipment downtime directly cancels scheduled surgical cases, creating strong incentive to prioritize uptime guarantees over marginal price savings from third-party repair providers. Vendors with the largest installed base capture disproportionate service revenue simply by virtue of having more towers under contract, reinforcing scale advantages that smaller component-only manufacturers struggle to replicate at comparable margin.
Market Impact: Adds roughly 8-12% recurring annual

Offering Equipment Leasing and Procedure-Based Financing

Leasing and per-procedure financing structures lower the upfront capital barrier for smaller hospitals and ambulatory centers that cannot justify a $40,000-plus outright purchase, expanding the addressable buyer base into facilities that would otherwise defer upgrades indefinitely. These structures typically carry a financing premium of roughly 15 to 20% over the equivalent cash purchase price spread across the contract term, compensating vendors for extended payment risk while still closing sales that a straight capital purchase requirement would have lost entirely to deferred replacement decisions across price-sensitive facility segments. Vendors report a growing share of new unit placements now use these arrangements.
Market Impact: Expands the buyer base by roughly 1

Selling Cloud Documentation and Analytics Subscriptions

Image and video documentation systems increasingly connect to cloud storage and analytics platforms sold as ongoing software subscriptions layered on top of the hardware sale, typically priced between $2,000 and $5,000 per operating room annually. Hospitals value searchable procedure archives for both clinical review and medical-legal documentation purposes, and once a facility builds its case library on one vendor's platform, switching costs rise considerably, making the subscription a durable revenue stream that persists well beyond the original hardware purchase and often outlasts the equipment's own replacement cycle. Vendors report subscription attach rates climbing as more facilities digitize documentation.
Market Impact: Adds $2,000 to $5,000 per operating

Winning Bundled Platform Sales Over Components

Vendors selling complete integrated towers rather than individual scopes, cameras, and light sources capture a larger share of each facility's total visualization budget, since hospitals increasingly prefer single-vendor accountability over coordinating service across three separate component suppliers. Bundle pricing typically runs 10 to 15% below the sum of equivalent component prices purchased separately, yet total account revenue rises because bundled deals capture the full purchase rather than competing for just one component category against specialist suppliers in each line item. Vendors report bundle attach rates climbing steadily as new facility openings favor complete platforms over piecemeal purchasing.
Market Impact: Captures roughly 100% of a facility

Who Controls the Margin Pool

Five manufacturers hold 58% of global revenue, with Stryker and Smith+Nephew forming a clear leading pair whose combined installed base and service infrastructure give them a durable gap over the next tier of challengers, including Arthrex, Olympus, and Karl Storz, none of which yet matches their scale or breadth of hospital account relationships built up over decades of continuous market presence.
Current competitive activity centers on three dimensions: fluorescence imaging feature parity, expansion of direct ambulatory surgery center sales teams separate from traditional hospital account management, and multi-year service contract attachment rates that vendors now report internally as a core performance metric alongside unit sales, reflecting how central recurring revenue has become to overall account profitability across the leading manufacturers' portfolios.

Emerging pressure comes from Asian manufacturers, particularly Chinese and South Korean challengers, offering mid-tier configurations at meaningfully lower price points that are gaining share in cost-sensitive tier-two and tier-three hospitals across East Asia and South Asia. Rankings among the established leaders are unlikely to shift materially before 2030, but the mid-tier segment below them is becoming considerably more contested territory, and several established vendors have begun launching lower-cost sub-brands to defend that ground directly.
arthroscopy-visualization-systems-market-company-positioning-matrix-1787305987640

Competitive Moat and Risk Dimensions

STRYKER CORPORATION

Moat: Installed Base Service Lock-In

Stryker's decades of hospital relationships and the largest installed base of any vendor in this category give it a durable service revenue stream that is difficult for challengers to displace, since switching towers means retraining surgical staff and renegotiating facility-wide service contracts, a friction that keeps hospitals renewing even when a rival offers slightly better specifications.
STRYKER CORPORATION

Risk: Premium Pricing Exposure

Stryker's premium pricing position leaves it exposed as budget-constrained hospitals in South Asia and parts of Latin America increasingly consider mid-tier Asian challengers for new facility builds, particularly where a facility has no legacy Stryker equipment and therefore no switching cost penalty attached to choosing a lower-priced alternative vendor instead.
SMITH+NEPHEW PLC

Moat: Orthopedic Portfolio Breadth

Smith+Nephew bundles visualization systems with its broader orthopedic implant and sports medicine instrument portfolio, giving surgical account teams a wider relationship to defend than visualization alone, and hospitals often prefer negotiating one combined equipment and implant contract rather than managing separate vendor relationships across each product category purchased for the same surgical department.
SMITH+NEPHEW PLC

Risk: Slower Digital Feature Rollout

Smith+Nephew has been slower than Stryker and Arthrex to bring fluorescence-capable platforms to market at scale, creating a feature gap that surgeon-influencers have begun to note in purchasing committee discussions, particularly at academic medical centers where staying current on imaging technology carries reputational weight beyond the immediate clinical benefit itself.

Players Tracked

Prominent Players

Stryker Corporation
Smith+Nephew plc
Arthrex Inc
Olympus Corporation
Karl Storz SE & Co. KG

Other Key Players

CONMED Corporation
DePuy Synthes
Zimmer Biomet Holdings Inc
Richard Wolf GmbH
B. Braun Melsungen AG
Medtronic plc
Sony Corporation
Fujifilm Holdings Corporation
Mindray Medical International
Sonoscape Medical Corp
Steris plc
Getinge AB
Hologic Inc
Schölly Fiberoptic GmbH
HOYA Corporation

Recent Developments

MARCH 2026

Stryker Launches Next-Generation Fluorescence Imaging Platform

Stryker introduced an upgraded fluorescence-capable visualization tower with expanded near-infrared imaging range aimed at complex soft tissue arthroscopic repair procedures. The launch targeted academic medical centers first, with a broader rollout to community hospitals and ambulatory surgery centers planned across the following two fiscal years.
Signal: Fluorescence feature parity is quickly bec
SEPTEMBER 2025

Smith+Nephew Acquires Sports Medicine Imaging Software Developer

Smith+Nephew completed the acquisition of a specialty imaging analytics software developer focused on AI-assisted surgical documentation and outcome tracking for arthroscopic procedures. The deal brought advanced software capability in-house, expanding Smith+Nephew's digital offering meaningfully beyond its prior hardware-only visualization product line entirely. Deal terms were not disclosed publicly.
Signal: Imaging analytics software is quickly beco
JANUARY 2026

Arthrex Signs Multi-Year Group Purchasing Agreement

Arthrex entered a multi-year supply agreement with a large United States hospital group purchasing organization covering visualization tower replacement across its full network of member hospitals. The agreement was a supply contract, not a joint venture or acquisition, covering equipment purchasing across the organization's full member roster.
Signal: Multi-year, network-wide purchasing agreem

Optical Component and Sensor Cost Exposure

Optical components and imaging sensors together represent roughly 31% of cost of goods sold for a complete visualization tower, sourced predominantly from specialized precision optics manufacturers concentrated in Japan and Germany, with semiconductor imaging sensors sourced from a smaller number of global suppliers based mainly in Japan and South Korea. Few viable alternate sourcing regions currently exist for either category at comparable precision tolerances.
The 2021 to 2022 global semiconductor shortage disrupted imaging sensor supply across the medical device sector broadly, with several manufacturers reporting extended lead times in company annual reports covering that period. The International Energy Agency's supply chain analysis of that period noted the shortage's disproportionate impact on precision electronics manufacturers reliant on a concentrated supplier base for specialized components not easily substituted on short notice.

Smaller manufacturers without long-term supply agreements or in-house optics capability bear considerably more exposure to price swings than the largest vendors, who can negotiate volume discounts and secure priority allocation during shortages. This dynamic reinforces the scale advantage already held by the leading five manufacturers, since a component shortage can delay a smaller competitor's shipments while the largest players continue fulfilling orders on schedule.
arthroscopy-visualization-systems-market-cost-volatility-analysis-1787305987835

Dual-Sourcing Imaging Sensors Across Suppliers

Larger manufacturers are qualifying second sensor suppliers to reduce dependence on any single source, a step that adds qualification cost upfront but meaningfully reduces disruption risk during future component shortages. Qualification cycles for a new imaging sensor supplier typically run twelve to eighteen months before volume production begins. Larger vendors tend to move through qualification faster than smaller challengers.

Long-Term Fixed-Price Optics Supply Agreements

Several vendors have moved from spot purchasing to multi-year fixed-price agreements with precision optics manufacturers, trading some pricing flexibility for supply certainty and predictable input costs across budget planning cycles. These agreements typically run three to five years and are renegotiated well ahead of expiration. Vendors report these agreements have meaningfully smoothed quarterly input cost variance across recent budget cycles.

In-House Optical Assembly Capability Investment

The largest manufacturers are investing in in-house optical assembly capability to reduce reliance on external precision optics suppliers entirely for at least a portion of production volume, insulating margin from supplier-side price increases over a multi-year investment horizon that smaller rivals generally cannot fund. This investment horizon typically spans five to seven years before meaningful in-house capacity comes fully online.

Portfolio Architecture for Margin Defence

The market organizes into three tiers by feature set and price point. Volume-tier towers cover standard HD imaging without fluorescence capability, sold mainly to budget-constrained facilities. Premium-tier platforms add 4K resolution and fluorescence imaging as standard features for facilities prioritizing surgical outcomes over upfront cost, and a growing next-generation tier layers AI-assisted analytics and cloud documentation on top of the underlying hardware sale entirely.
Gross margins widen considerably moving up the tiers, since premium features carry disproportionate pricing power relative to their incremental manufacturing cost, while volume-tier towers compete primarily on price against Asian challengers entering the category with comparable base specifications. Hospitals purchasing at the premium tier rarely trade back down once surgeons have grown accustomed to sharper intraoperative visualization during live procedures.

High-value margin pools concentrate in premium platform sales bundled with multi-year service contracts and cloud documentation subscriptions, where recurring software and service revenue carries substantially wider margin than the underlying hardware sale that first brought the account on board. Vendors with the deepest recurring revenue attachment consistently outperform peers on overall account profitability. That gap is likely to widen further as subscription features mature and attach rates continue climbing across the installed base.

Volume / Commodity-Adjacent Tier

Standard HD visualization towers without fluorescence capability, sold mainly to budget-constrained hospitals and ambulatory centers competing primarily on upfront purchase price against a growing field of Asian manufacturers entering this segment.
Gross Margin: 28-36%

Premium / Certified Tier

4K resolution platforms with fluorescence imaging capability sold to academic medical centers and well-funded hospital systems prioritizing surgical outcomes, commanding meaningfully wider margins than volume-tier equivalents through demonstrated clinical differentiation.
Gross Margin: 42-52%

Sustainability / Regulatory / Next-Generation Tier

AI-assisted imaging analytics and cloud-connected documentation platforms representing the newest product category, commanding the highest margins as software subscription revenue layers on top of the underlying hardware sale. Vendors are racing to expand this offering as hospital budgets shift toward outcome-linked purchasing.
Gross Margin: 55-65%
arthroscopy-visualization-systems-market-portfolio-architecture-1787305988331

High-value Sub-segments and Strategic Watch-out

AI-Assisted Imaging Analytics Platforms

AI-assisted analytics software layered onto existing visualization hardware combines the category's fastest growth with its widest margins, drawing concentrated vendor investment as hospitals seek outcome data to justify premium equipment purchases to their own finance committees each budget cycle. MMA expects vendor investment here to keep climbing through 2036.
Gross Margin: 58-68%

Cloud Documentation Subscription Services

Cloud-connected case documentation and archival services deliver strong recurring revenue growth as hospitals build searchable procedure libraries, supported by rising medical-legal documentation requirements and steady switching-cost accumulation once a facility commits to one vendor's platform. Growth should persist as more facilities digitize their surgical documentation workflows.
Gross Margin: 50-60%

Standard HD Visualization Towers

Standard HD towers without fluorescence capability remain the category's volume backbone across price-sensitive facilities worldwide, competing on cost against a growing field of Asian manufacturers that leaves thin margins and limited room for feature differentiation. Consolidation among smaller regional producers looks likely as scale becomes the primary lever for survival.
Gross Margin: 26-34%

Component-Only Sales to Legacy-Equipped Facilities

Component-only sales to facilities with existing legacy towers warrant monitoring as bundled platform purchasing continues gaining share, a shift that could compress this once-standard sales motion considerably faster than manufacturers currently plan for in their own account strategies. Vendors that move early on bundled ASC-focused sales could capture disproportionate share.
Gross Margin: 32-40%

Replacement Cycles and Account Depth

Visualization towers generate recurring revenue well beyond the initial hardware sale through service contracts, consumable accessories, and increasingly through cloud documentation subscriptions, giving vendors an annuity-like revenue stream that persists across the tower's full seven-to-nine-year operating life rather than ending at the point of sale, and that revenue stream typically compounds as facilities add subscription features over time.
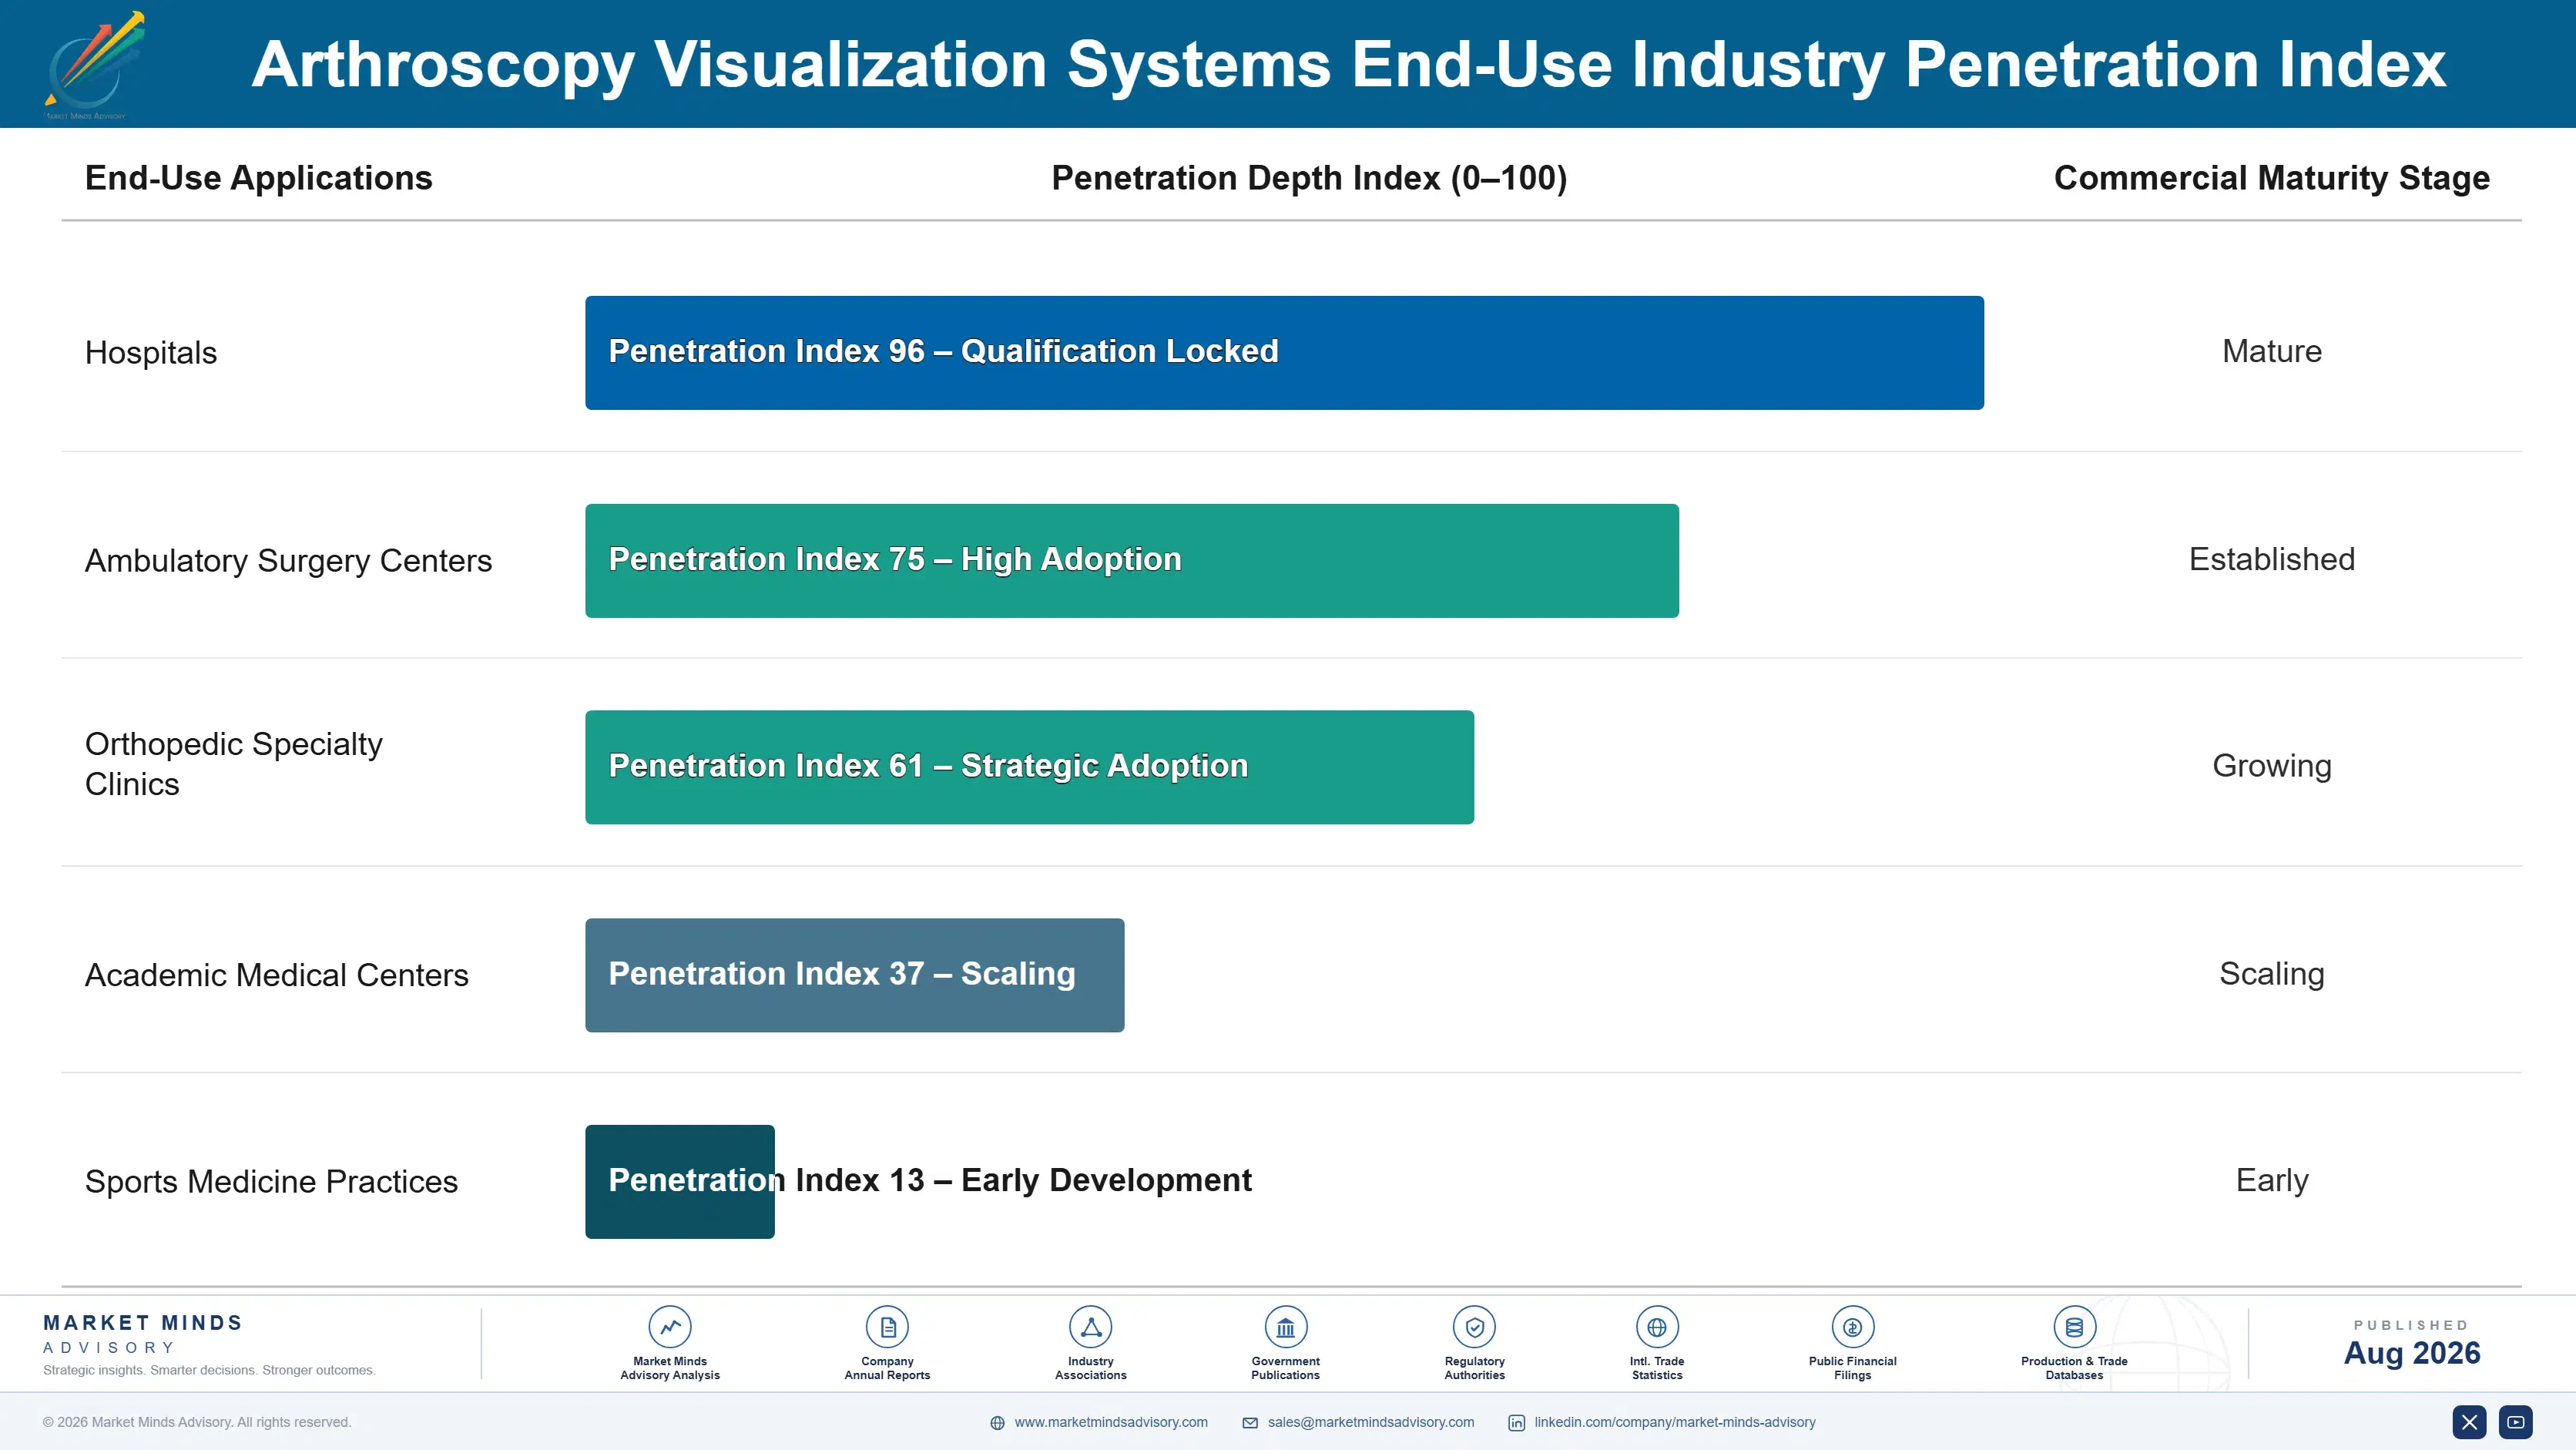
Adoption depth varies considerably by end-use vertical. Academic medical centers adopt the newest features fastest and often serve as reference sites vendors use to influence broader hospital purchasing committees, while community hospitals and ambulatory surgery centers typically wait one to two replacement cycles before adopting fluorescence and AI-assisted features that have already proven themselves at leading institutions. Sports medicine practices sit somewhere between these two extremes, adopting new imaging capability faster than most community hospitals but slower than leading academic centers.

Buyer profiles are shifting generationally as younger orthopedic surgeons who trained on digital platforms from residency onward move into purchasing-influence roles, replacing an older cohort that trained on analog equipment and historically prioritized cost over imaging capability when equipment committees debated new tower purchases. This generational shift is accelerating replacement decisions at facilities where younger surgeons now hold meaningful purchasing sway.
arthroscopy-visualization-systems-market-end-use-penetration-index-1787305988822

Positioning for the Digital Tower Transition

These are among the four positions where our research anticipates prominent divergence between winners and laggards over the coming forecast period. Each is grounded in the demand model, the regulatory perimeter, and the announced capacity pipeline.
01 / PLATFORM BUNDLING STRATEGY

Vendors without integrated bundled platforms will lose share to full-tower competitors

Hospitals increasingly prefer single-vendor accountability over coordinating service across separately sourced scopes, cameras, and light sources, and vendors selling only individual components are losing ground to competitors offering complete bundled towers under one service contract. Component-only sellers face a shrinking addressable market as new facility openings almost universally choose bundled platforms rather than assembling systems piecemeal from multiple suppliers across separate purchasing decisions. This shift is likely to accelerate further as more ambulatory surgery centers open with no legacy equipment base to work around.
02 / FLUORESCENCE FEATURE PARITY

Fluorescence imaging feature parity is now a competitive necessity, not a differentiator

Fluorescence-capable imaging has moved from a premium differentiator to a baseline expectation in academic medical center purchasing standards, and vendors without a credible fluorescence offering risk losing consideration entirely in tenders that now specify it as a minimum requirement. Group purchasing organizations covering hundreds of hospitals have already written this expectation into multi-year equipment contracts, meaning vendors have a narrowing window to close any remaining feature gap. Asian challengers entering the mid-tier segment are watching this transition closely for an opening.
03 / AMBULATORY CHANNEL INVESTMENT

Dedicated ASC sales teams outperform traditional hospital account structures

Ambulatory surgery centers represent a distinct buyer profile with shorter capital approval cycles than hospital systems, and vendors treating ASC accounts as an extension of traditional hospital sales are losing deals to competitors with dedicated ASC-focused sales teams built around faster decision cycles. Each newly opened orthopedic ASC is a discrete purchase decision independent of any hospital relationship, rewarding vendors organized to move quickly once a facility signals readiness to buy. Vendors that build this capability early stand to capture disproportionate share of the fastest-growing purchasing channel.
04 / RECURRING REVENUE DEPTH

Service and subscription attachment rates will separate margin leaders from laggards

Multi-year service contracts and cloud documentation subscriptions now carry meaningfully wider margins than the underlying hardware sale, and vendors with the largest installed base capture disproportionate recurring revenue simply by virtue of having more towers already under contract. Manufacturers that treat the hardware sale as the primary transaction rather than the entry point into a longer recurring relationship will find their margin profile lagging competitors who prioritize attachment rates from the first sale onward. Attachment rate is quickly becoming the metric that separates margin leaders from laggards industry-wide.

Engagement Snapshot From the Field

A live engagement with an industry participant carrying material or product regulatory and market exposure ahead of a defining policy shift, showing how our research translates into a defensible multi-year portfolio strategy.
MARKET MINDS ADVISORY · CLIENT ENGAGEMENT SUMMARY
Arthroscopy Visualization Systems Producer Strategic Portfolio Review and Transition Roadmap 2026·Investment Scenario on Arthroscopy Visualization Systems Exposure Evaluation 2025-26
CLIENT PROFILE
The client is a regional hospital network operating twelve facilities across the southeastern United States, including three academic-affiliated teaching hospitals and nine community hospitals. The network reported approximately $2.1 billion in annual revenue (client-reported, unverified by MMA) and performs roughly 8,400 arthroscopic procedures annually across its orthopedic service lines. Its orthopedic service lines have grown steadily over the past five years as the region's population has aged.
STRATEGIC CHALLENGE
The network's visualization towers were approaching the end of their scheduled replacement cycle across nine facilities simultaneously, creating a large capital outlay decision with no clear internal consensus on whether to standardize on one vendor's bundled platform or continue mixed procurement across facilities, each with different existing brand relationships and surgeon preferences.
MMA APPROACH
MMA benchmarked total cost of ownership across three leading vendors' bundled platforms against the network's current mixed-vendor configuration, incorporating service contract pricing, expected replacement cycle length, and surgeon satisfaction survey data collected across all twelve facilities. The analysis modeled outcomes under both single-vendor standardization and continued mixed procurement scenarios over a ten-year capital planning horizon.
KEY FINDINGS
  1. Standardizing on a single vendor's bundled platform across all twelve facilities was projected to reduce total service contract spending by roughly 14% annually.
  2. Surgeon satisfaction scores showed no statistically meaningful difference between the three leading vendors' current-generation platforms. This finding held consistently across all three vendors evaluated in the benchmarking exercise.
  3. Three of the network's nine community hospitals had significantly lower procedure volume than the others, making leasing a better fit than outright purchase.
  4. Academic-affiliated facilities required fluorescence-capable platforms to maintain competitiveness in resident recruitment and reference-site vendor relationships. This requirement added meaningful weight to the final vendor selection criteria used in negotiations.
CLIENT PROFILE
The client is a regional hospital network operating twelve facilities across the southeastern United States, including three academic-affiliated teaching hospitals and nine community hospitals. The network reported approximately $2.1 billion in annual revenue (client-reported, unverified by MMA) and performs roughly 8,400 arthroscopic procedures annually across its orthopedic service lines. Its orthopedic service lines have grown steadily over the past five years as the region's population has aged.
STRATEGIC CHALLENGE
The network's visualization towers were approaching the end of their scheduled replacement cycle across nine facilities simultaneously, creating a large capital outlay decision with no clear internal consensus on whether to standardize on one vendor's bundled platform or continue mixed procurement across facilities, each with different existing brand relationships and surgeon preferences.
MMA APPROACH
MMA benchmarked total cost of ownership across three leading vendors' bundled platforms against the network's current mixed-vendor configuration, incorporating service contract pricing, expected replacement cycle length, and surgeon satisfaction survey data collected across all twelve facilities. The analysis modeled outcomes under both single-vendor standardization and continued mixed procurement scenarios over a ten-year capital planning horizon.
KEY FINDINGS
  1. Standardizing on a single vendor's bundled platform across all twelve facilities was projected to reduce total service contract spending by roughly 14% annually.
  2. Surgeon satisfaction scores showed no statistically meaningful difference between the three leading vendors' current-generation platforms. This finding held consistently across all three vendors evaluated in the benchmarking exercise.
  3. Three of the network's nine community hospitals had significantly lower procedure volume than the others, making leasing a better fit than outright purchase.
  4. Academic-affiliated facilities required fluorescence-capable platforms to maintain competitiveness in resident recruitment and reference-site vendor relationships. This requirement added meaningful weight to the final vendor selection criteria used in negotiations.
RECOMMENDED STRATEGY
Phase 1: Phase 1 (Months 1-3): Complete surgeon preference surveys and total cost of ownership modeling across all twelve facilities before any vendor commitment. Phase 2: Phase 2 (Months 4-9): Negotiate a single-vendor network agreement combining purchase and lease terms suited to each facility's procedure volume. Phase 3: Phase 3 (Months 10-18): Execute phased tower replacement prioritizing academic facilities first, then community hospitals by existing equipment age. as capital budgets allow.
OUTCOME
The network selected a single-vendor bundled platform agreement combining outright purchase for its three academic facilities and leasing terms for six of its nine community hospitals. Projected annual service contract savings reached approximately $3.4 million (client-reported, unverified by MMA) against the prior mixed-vendor cost baseline across the full facility network.

Frequently Asked Questions

Foundational context covering the market sizes, CAGR, scope, country, region and competition that inform every finding below. This section is provided to cover basics and most often pre-purchase conversations, answered from the MMA Primary Research Dataset.

What is the current size of the Arthroscopy Visualization Systems Market?

The Arthroscopy Visualization Systems Market was valued at approximately $1.6 billion globally in 2025. This includes arthroscopes, camera systems, light sources, and integrated visualization platforms.

How large will the Arthroscopy Visualization Systems Market be by 2036?

The market is projected to reach approximately $3.54 billion by 2036, roughly 2.06 times its 2026 value. Growth is driven by digital replacement cycles and ambulatory surgery center expansion.

What is the CAGR for the Arthroscopy Visualization Systems Market 2026 to 2036?

The base case CAGR is 7.5% annually, with a bull case of 8.8% and a bear case of 6.3%. This reflects steady procedure volume growth alongside faster equipment replacement cycles.

Which segment is growing fastest?

Integrated all-in-one visualization platforms are the fastest-growing segment, expanding at roughly 10.5% annually. Hospitals increasingly prefer bundled towers over separately sourced components from three vendors.

Who are the major companies in the Arthroscopy Visualization Systems Market?

Leading companies include Stryker Corporation, Smith+Nephew plc, Arthrex Inc, Olympus Corporation, and Karl Storz SE and Co KG. Together these five hold 58% of global revenue.

Which country is growing fastest?

China is the fastest-growing country, expanding at roughly 9.5% annually through 2036. This reflects rapidly expanding hospital and ambulatory surgery center infrastructure investment across the country.

Report Segmentation Architecture

The full report scope spans multiple orthogonal segmentation dimensions, with cross-tabulated demand data provided for each dimension pair. Coverage extends further to regional breakdowns, trend trajectories, and the competitive detail needed to support segment-level decision-making.

By Product and Technology Type

  • Arthroscopes
  • Camera Control Units and Couplers
  • Light Sources and Cables
  • Image Capture and Documentation Systems
  • Displays and Monitors
  • Integrated Visualization Platforms

By End-Use Industry

  • Hospitals
  • Ambulatory Surgery Centers
  • Orthopedic Specialty Clinics
  • Academic Medical Centers
  • Sports Medicine Practices

By Commercial Dimension

  • Outright Purchase
  • Leasing and Financing
  • Service Contract Attachment
  • Software Subscription

By Region

  • North America
  • Western Europe
  • East Asia
  • South Asia and Pacific
  • Latin America
  • Middle East and Africa
  • Eastern Europe

Scope, Methodology, and Coverage

Every figure in this report is reproducible from documented input assumptions. The scope below maps the historical period, the forecast horizon, the segmentation dimensions, and the countries covered, alongside the underlying primary and qualitative methodology.
Historical Period
2020 to 2025
Forecast Period
2026 to 2036
Base Year
2025 (USD billions; MMA Primary Research Dataset, August 2026)
Market Definition
The Arthroscopy Visualization Systems Market covers rigid arthroscopes, camera control units, light sources, image capture and documentation systems, surgical displays, and integrated visualization platforms used specifically in minimally invasive orthopedic joint surgery. It excludes general laparoscopic and gastrointestinal endoscopic visualization equipment sold outside orthopedic applications.
Quantitative Units
USD billions (current prices); unit shipment volume where applicable
Segmentation Dimensions
By Product and Technology Type; By End-Use Industry; By Commercial Dimension; By Region
Regions Covered
North America, Western Europe, East Asia, South Asia and Pacific, Latin America, Middle East and Africa, Eastern Europe
Countries Covered
USA, China, Germany, France, UK, Japan, South Korea, India, Australia, Canada, Brazil, Mexico, Indonesia, Vietnam, Thailand, Malaysia, UAE, Saudi Arabia, South Africa, Nigeria, Turkey, Poland, Netherlands, Italy, Spain, Sweden, Switzerland, Argentina, Colombia, Singapore, and additional markets relevant to this sector
Key Companies Profiled
Stryker Corporation, Smith+Nephew plc, Arthrex Inc, Olympus Corporation, Karl Storz SE & Co. KG, CONMED Corporation, DePuy Synthes, Zimmer Biomet Holdings Inc, Richard Wolf GmbH, B. Braun Melsungen AG, Medtronic plc, Sony Corporation, Fujifilm Holdings Corporation, Mindray Medical International, Sonoscape Medical Corp, Steris plc, Getinge AB, Hologic Inc, Schölly Fiberoptic GmbH, HOYA Corporation
Quantitative Methodology
Primary survey, n=3,800 respondents, Q4 2025, six countries; demand-side model with trade association cross-validation
Qualitative Methodology
47 expert interviews, Q4 2025; applied to validate demand model assumptions, identify emerging dynamics, and assess competitive positioning
Report Format
PDF and XLSX data workbook (Word format preview document)
Publisher
Market Minds Advisory
Report Code
MMA-2026-MED-133
Published
August 2026
Contact
sales@marketmindsadvisory.com | www.marketmindsadvisory.com

Purchase the full Arthroscopy Visualization Systems Market Report (2026 to 2036).

The full report delivers detailed segmentation across all six visualization system product categories, with country-level sizing for all thirty-one covered markets. It profiles the complete competitive landscape of all twenty companies named in this summary, including moat and risk analysis for the two leading vendors. Multi-year forecast models are provided under base, bull, and bear scenarios. Primary survey data drawn from hospital procurement executives and practicing orthopedic surgeons across six countries supports every major finding, and purchasers receive editable data files alongside the formatted report.
Vendor-by-vendor installed base and service revenue tracker
Ambulatory surgery center opening pipeline by country
Fluorescence imaging feature adoption benchmark tracker
Hospital group purchasing organization contract term database
Component versus bundled platform pricing comparison
Competitive benchmarking across key branded and generic players

Built For The People Who Decide

From boardroom strategy to bench-side execution, this report is read cover-to-cover by leaders shaping the next decade of their industry, turning demand scenarios, market dynamics and valuation benchmarks into decisions.
CXOs/ Presidents/ VPs/ Managers
M&A and Corporate Development
Strategy Teams and R&D Heads
Procurement and Product Directors
Regulatory and Compliance Leaders
Investor Relations and Equity Analysts