Market Minds Advisory
Argon Gas Market

Argon Gas Market: A By-Product Market Priced Like A Product

Nobody builds an air separation unit to make argon, and yet semiconductor fabs now depend on a molecule whose supply is decided entirely by how much oxygen the steel industry happens to want.

Lead Analyst

Bilal Shaikh

Published

September 2026

Make Smarter Decisions with Customized Research Insights

Request a free sample report and evaluate market opportunities, growth trends, and competitive dynamics relevant to your business needs.

2025 MARKET VALUE$5.6BMarket Size 2025
2036 FORECAST VALUE$11.1BBase Case , 2026 to 2036
CAGR 2026 TO 20366.4 %Bull 7.6% / Bear 5.2%
INCREMENTAL OPPORTUNITY$5.1BNet 10- year value creation
EXPANSION MULTIPLE1.86x2036 value over 2026 base
Strategic Levers
M&A Pipeline
Regional Outlook
Country Rankings
Competitive Intelligence
Segmental Deep-dive
Call-Us : 91 93563 13602

Executive Snapshot and Market Trajectory

Argon makes up under one percent of air and nobody builds a separation unit to produce it. Around 58% of capacity sits alongside steelmaking oxygen demand, so argon availability is decided by how much oxygen somebody else wants that quarter. Semiconductor fabs now depend on that arrangement.
Growth runs at 6.4% and electronic grade leads it. Ultra high purity argon grows at 9.6%, exactly 1.50 times the market rate, because wafer fabrication needs 99.9999% purity and consumes more of it with every process node. East Asia holds 42%, far outside band, since Chinese steelmaking and Korean, Taiwanese, and Japanese fabs sit on the same continent and draw on the same separation capacity. That linkage defines the whole market and nothing else does.
Concentration is high at 76% across the top five measured on argon volume supplied, and it follows air separation unit ownership rather than any distribution advantage. Liquid argon travels roughly 500 km before boil-off losses defeat the economics, which makes this a set of regional supply positions held by companies that happen to be global. Regional Chinese and Indian producers hold their own radii completely. Global scale confers nothing there.
Market Definition
This market covers argon supplied in gaseous and liquid form for industrial, electronic, metallurgical, and medical applications, spanning industrial grade argon, high purity argon, ultra high purity electronic grade argon, argon-based shielding gas mixtures, and medical and laboratory grade argon. Air separation units and cryogenic equipment, other industrial gases including oxygen, nitrogen, helium, and hydrogen, gas handling and dispensing equipment, welding consumables other than shielding gas, and on-site gas generation plant supplied as capital equipment fall outside scope.
Base Year Value
$5.6B in 2025 (MMA Primary Research Dataset, August 2026)
Forecast Period
2026 to 2036, eleven discrete annual values
CAGR
6.4% base case. Bull 7.6%. Bear 5.2%.
Fastest Growth Segment
Ultra High Purity Electronic Grade Argon: 9.6% CAGR
Fastest Growth Country
India: 8.9% CAGR
Fastest Growth Region
South Asia and Pacific: 8.5% CAGR
Largest Region
East Asia: 42% of 2025 global value
Market Leaders
Linde, Air Liquide, Air Products and Chemicals, Nippon Sanso Holdings, Messer Group. Source: MMA Analysis based on company annual reports.
Primary Survey
n=3,800 procurement and R&D decision-makers, Q4 2025, six countries
Methodology
Demand-side build-up, cross-validated against public data, 47 expert interviews

Argon Gas Market Forecast Scenarios

argon-gas-market-size-forecast-scenario-1787302618330
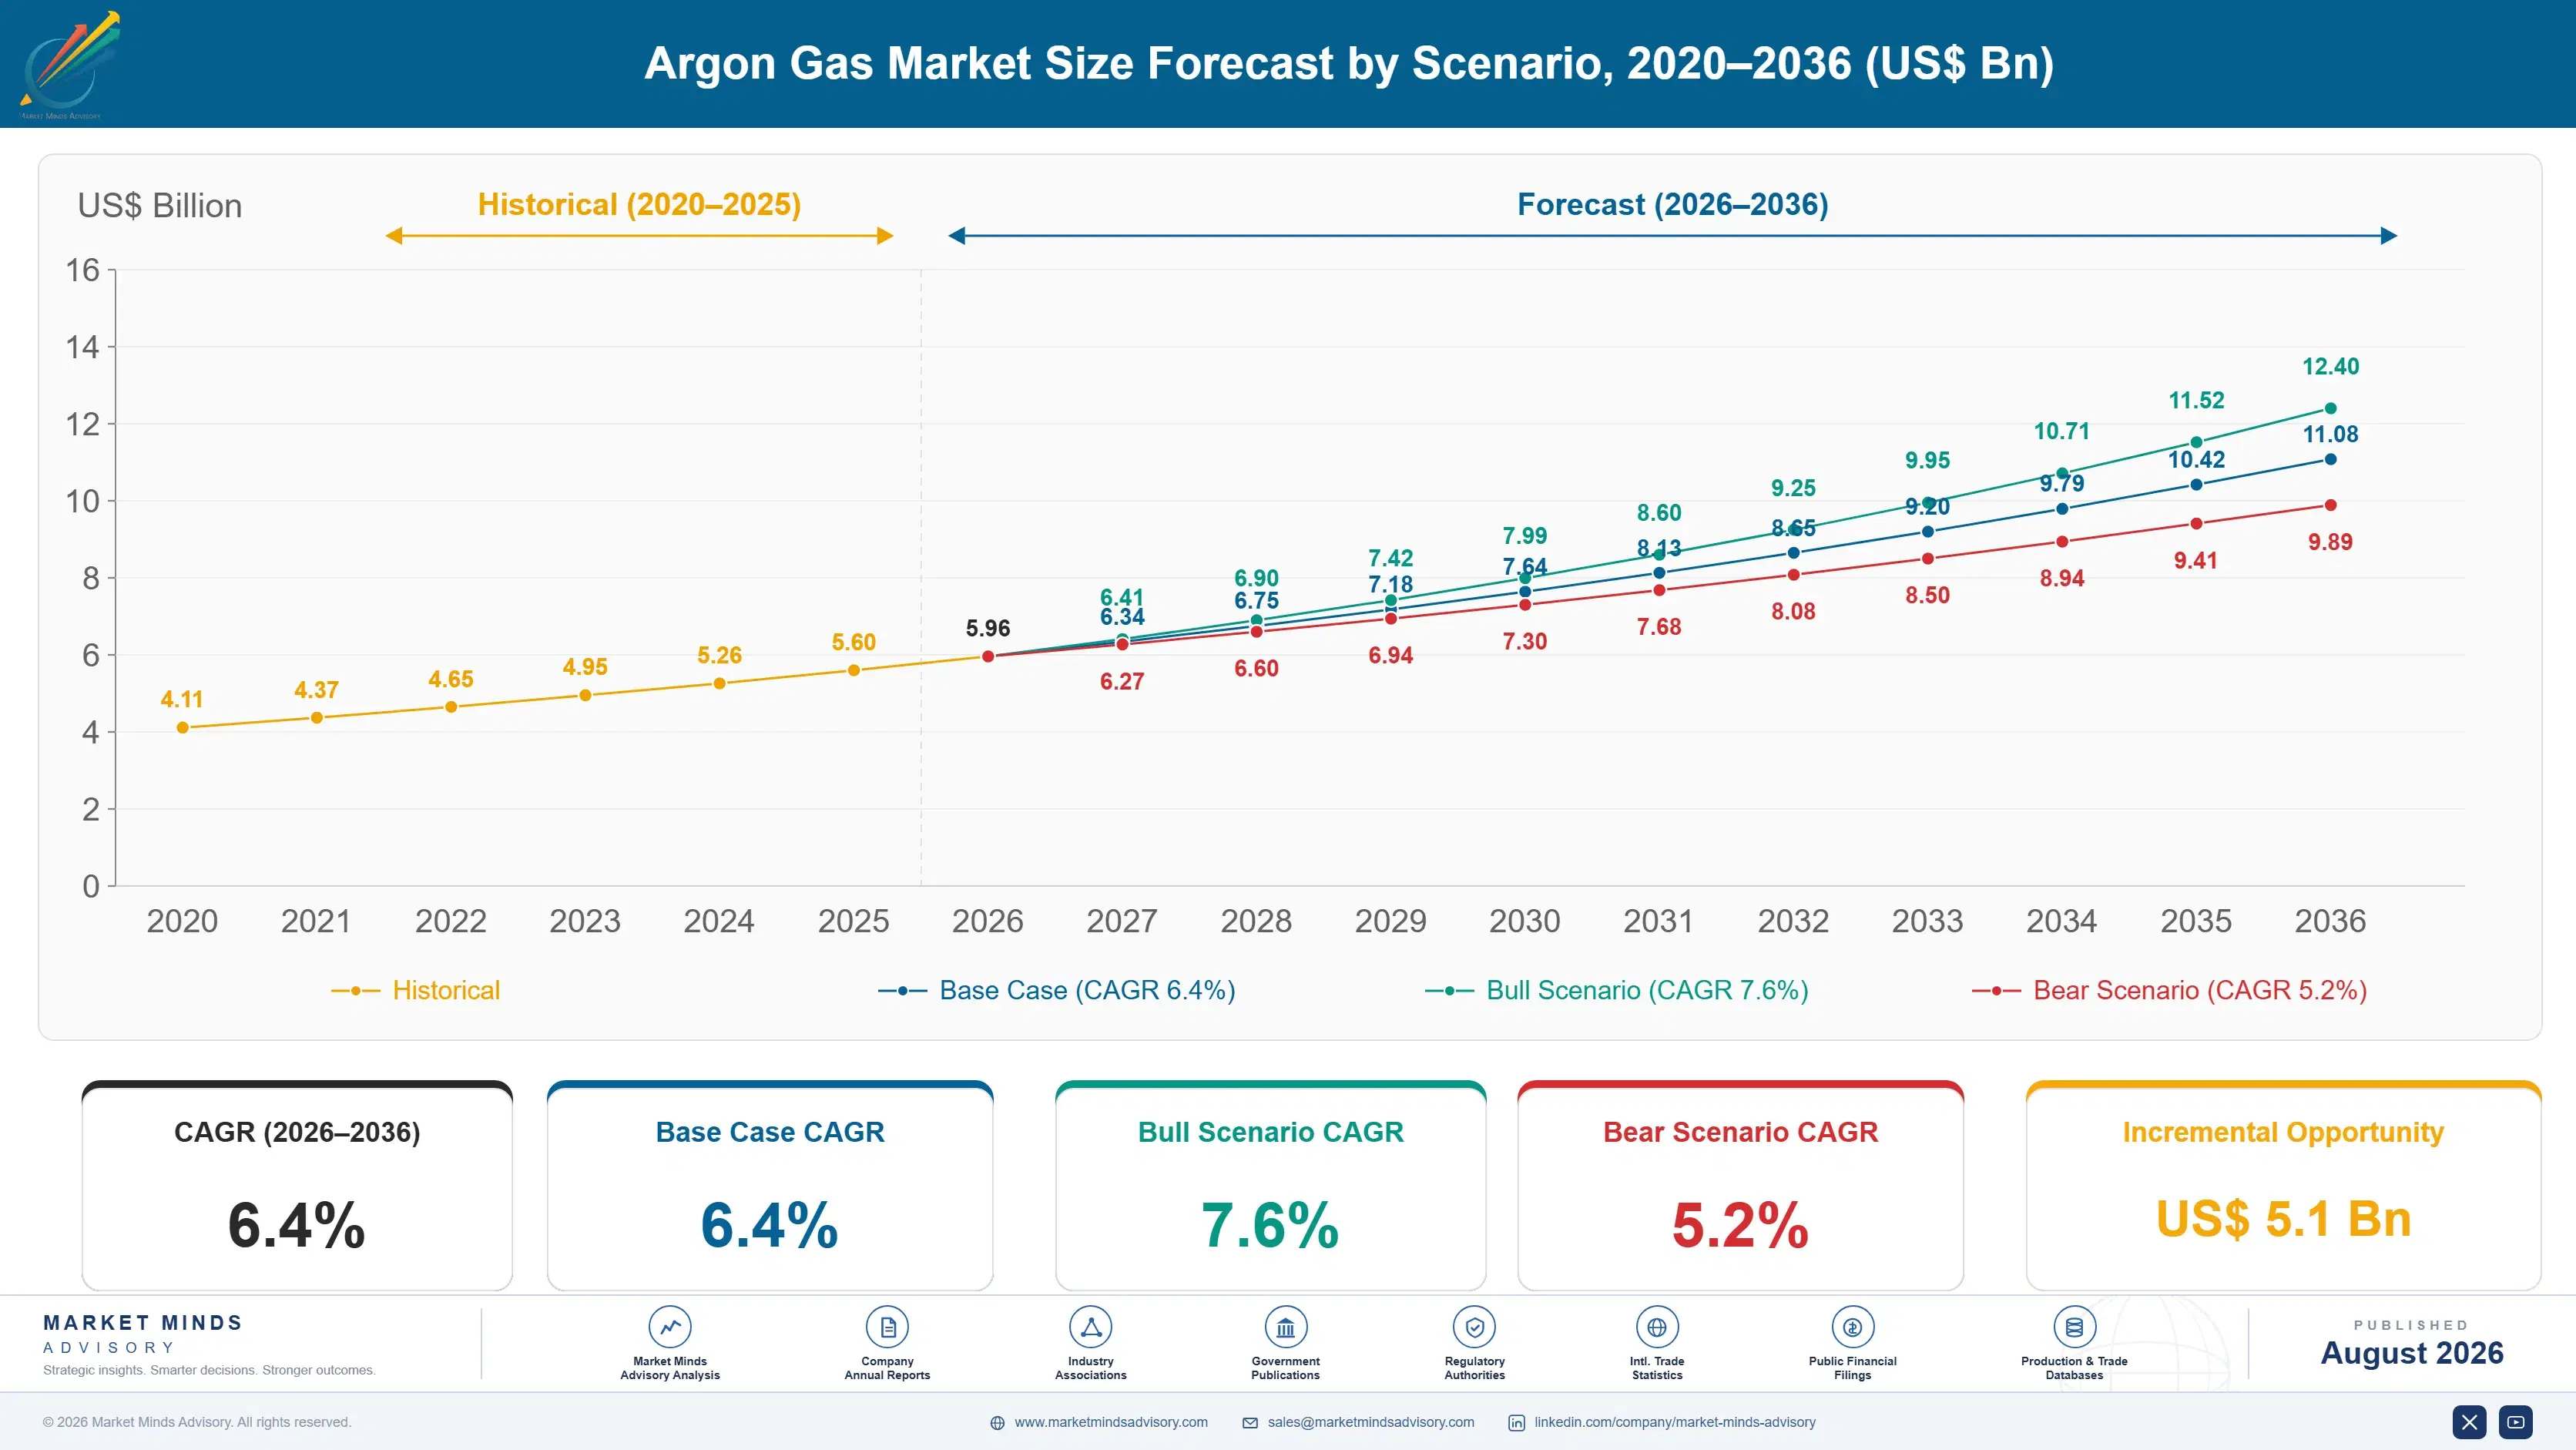
The 2020 to 2025 period ran at 5.4% and it included two genuine supply crises that had nothing to do with argon demand. Steel production cuts and separation unit turnarounds tightened argon availability in 2021 and again in 2022, and prices moved several multiples while welding and fabrication customers went on allocation. Electronic grade demand grew steadily throughout, insulated by contracts that fabs had signed years earlier.
Three mechanisms carry the 6.4% base case. Semiconductor fabrication is the largest, since new fab capacity in Taiwan, Korea, Japan, the United States, and Europe all consumes electronic grade argon at rates that rise with each process node. Metal additive manufacturing is the second, where inert atmosphere consumption per part is high. And stainless and specialty steel production is the third, adding both demand and the oxygen co-production that supplies it.
The 7.6% bull case rests on fab construction schedules holding while steel output stays flat, which would tighten supply enough to reprice the whole market rather than only the electronic grades. The 5.2% bear case is a manufacturing slowdown reducing welding and fabrication demand across several regions at once, since that volume is the base load beneath every separation unit's argon output.

Supply Decided By Somebody Else

Argon is a by-product and behaves like one. Air is under one percent argon, and separation units are built and sized around oxygen and nitrogen demand, which means argon output is whatever the plant happens to yield while serving somebody else's requirement. Around 58% of capacity sits alongside steelmaking, so when a mill cuts output or takes a turnaround the argon disappears with it.
TOP FIVE CONCENTRATION76%High, following separation unit ownership rather than distribution reach
ARGON YIELD PER UNIT0.9%Of the air volume processed through a separation unit
LIQUID DISTRIBUTION RADIUS500 kmBeyond which boil-off losses defeat delivered economics entirely
BOIL-OFF LOSS RATE0.3% dailyFrom cryogenic road tankers and customer storage vessels
ELECTRONIC GRADE PURITY99.9999%Required before a wafer fabrication plant will accept delivery
STEEL LINKED SUPPLY SHARE58%Of capacity co-located with steelmaking oxygen demand across the world
That produces price behaviour no demand model predicts. Argon tightened severely in 2021 and 2022 on steel production cuts and coincident plant turnarounds, and spot prices moved several multiples while fabrication customers went on allocation. Demand had not changed. Buyers who understood the by-product mechanism had contracted volume years earlier; those treating argon as a purchasable commodity discovered that it is not one.
Distribution reinforces the concentration. Liquid argon boils off at roughly 0.3% a day in transit and storage, so beyond about 500 km the delivered economics fail and a nearer source wins. Concentration at 76% therefore reflects separation unit ownership across regions rather than any national distribution advantage, and the market is really a set of regional supply positions held by global companies.
"Customers ask us how to secure argon supply. The honest answer is that you secure it by knowing which steel mill you are actually downstream of, and almost nobody buying argon can tell you that."
Director, Industrial Gases and Electronic Materials Practice · MMA Chemicals and

Market Trends

Semiconductor Demand Grows Faster Than By-Product Supply

Electronic grade argon grows at 9.6% against 6.4% for the market, driven by fab capacity additions across Taiwan, Korea, Japan, the United States, and Europe alongside rising consumption per wafer at advanced nodes. Supply grows only when somebody builds a separation unit for oxygen or nitrogen reasons. That divergence has no self-correcting mechanism, since no producer will build capacity to sell the by-product and strand the main products. Fabs have begun contracting supply years before commissioning as a result. Nothing else secures the volume. Producers cannot conjure molecules on request.
Market Impact: Fabs specify 99.9999% purity
Steel Linkage Creates Shortages Unrelated To Argon Demand

Around 58% of argon capacity is co-located with steelmaking oxygen demand, so mill output cuts and plant turnarounds remove argon supply regardless of what argon customers need. That mechanism produced severe tightness in 2021 and again in 2022, with spot prices moving several multiples while demand was unchanged. Buyers have begun contracting multi-year volumes with take-or-pay commitments rather than purchasing against forecast requirement. Allocation during tightness follows contract structure rather than order size or relationship. Spot buyers went unserved for weeks. Contracted buyers barely noticed anything. Relationship and order size counted for nothing that year.
Market Impact: Mixtures grow at 7.4% annually

Market Opportunities and Growth Drivers

Advanced Nodes Consume More Argon Per Wafer

Argon serves as sputtering carrier, chamber purge, and inert ambient across an increasing number of process steps, and consumption per wafer rises with each node transition rather than falling with efficiency. Fabs specify 99.9999% purity and will not accept anything less, which restricts the qualified supply base considerably. That combination of rising intensity and tightening specification makes semiconductor argon demand grow considerably faster than wafer starts alone. Qualification into a fab takes months of analytical validation and is rarely reopened afterwards. Positions therefore last a plant's life. Few suppliers hold more than several.
Market Impact: Argon is 0.9% of processed air

Metal Additive Manufacturing Consumes Inert Atmosphere Heavily

Powder bed fusion runs under argon atmosphere continuously through builds that take days, and consumption per finished part is high relative to the part's value. Aerospace, medical implant, and tooling applications are all growing, and none of them can substitute a cheaper inert gas without changing metallurgy. Argon mixture demand grows at 7.4% partly on this, and the customers involved are considerably less price sensitive than fabrication is. Recovery equipment installed on those chambers returns atmosphere to service rather than venting it. Producers who fit it hold the customer. Supply contracts alone do less.
Market Impact: Boil-off runs 0.3% each day

Market Restraints and Challenges

By-Product Economics Prevent Any Supply Response

Argon output is fixed by the size and mode of separation units built for oxygen and nitrogen, and the root cause is that air is under one percent argon so no volume justifies building a unit for it. Commercial impact is that shortages persist until unrelated demand changes, since no producer strands its main products to serve a by-product. Mitigation runs through argon recovery upgrades on existing units, take-or-pay contracting, and recycling systems at high consumption sites. None of those mitigations creates argon the air did not contain. They redistribute what exists. The ceiling stays where oxygen demand puts it.
Market Impact: Electronic grade grows at 9.6%

Boil-Off Losses Cap Distribution Distance Sharply

Liquid argon boils off at roughly 0.3% a day in tankers and customer vessels, and the root cause is that maintaining a cryogenic liquid at minus 186 degrees against ambient heat is imperfect at any practical insulation standard. Commercial impact is that delivered economics fail beyond about 500 km and a nearer source always wins. Mitigation runs through regional filling stations, improved vessel insulation, and on-site recovery for the largest consumers. Concentration at 76% follows from that distribution limit as much as from separation unit ownership. Distant producers cannot contest a radius. Scale does not travel cold.
Market Impact: Steel-linked capacity is 58% of sup
3 additional market trends, 4 additional growth drivers, and 2 additional restraints and challenges are covered in the full report. Contact sales@marketmindsadvisory.com to access the complete intelligence.

Segment CAGR and Growth Architecture

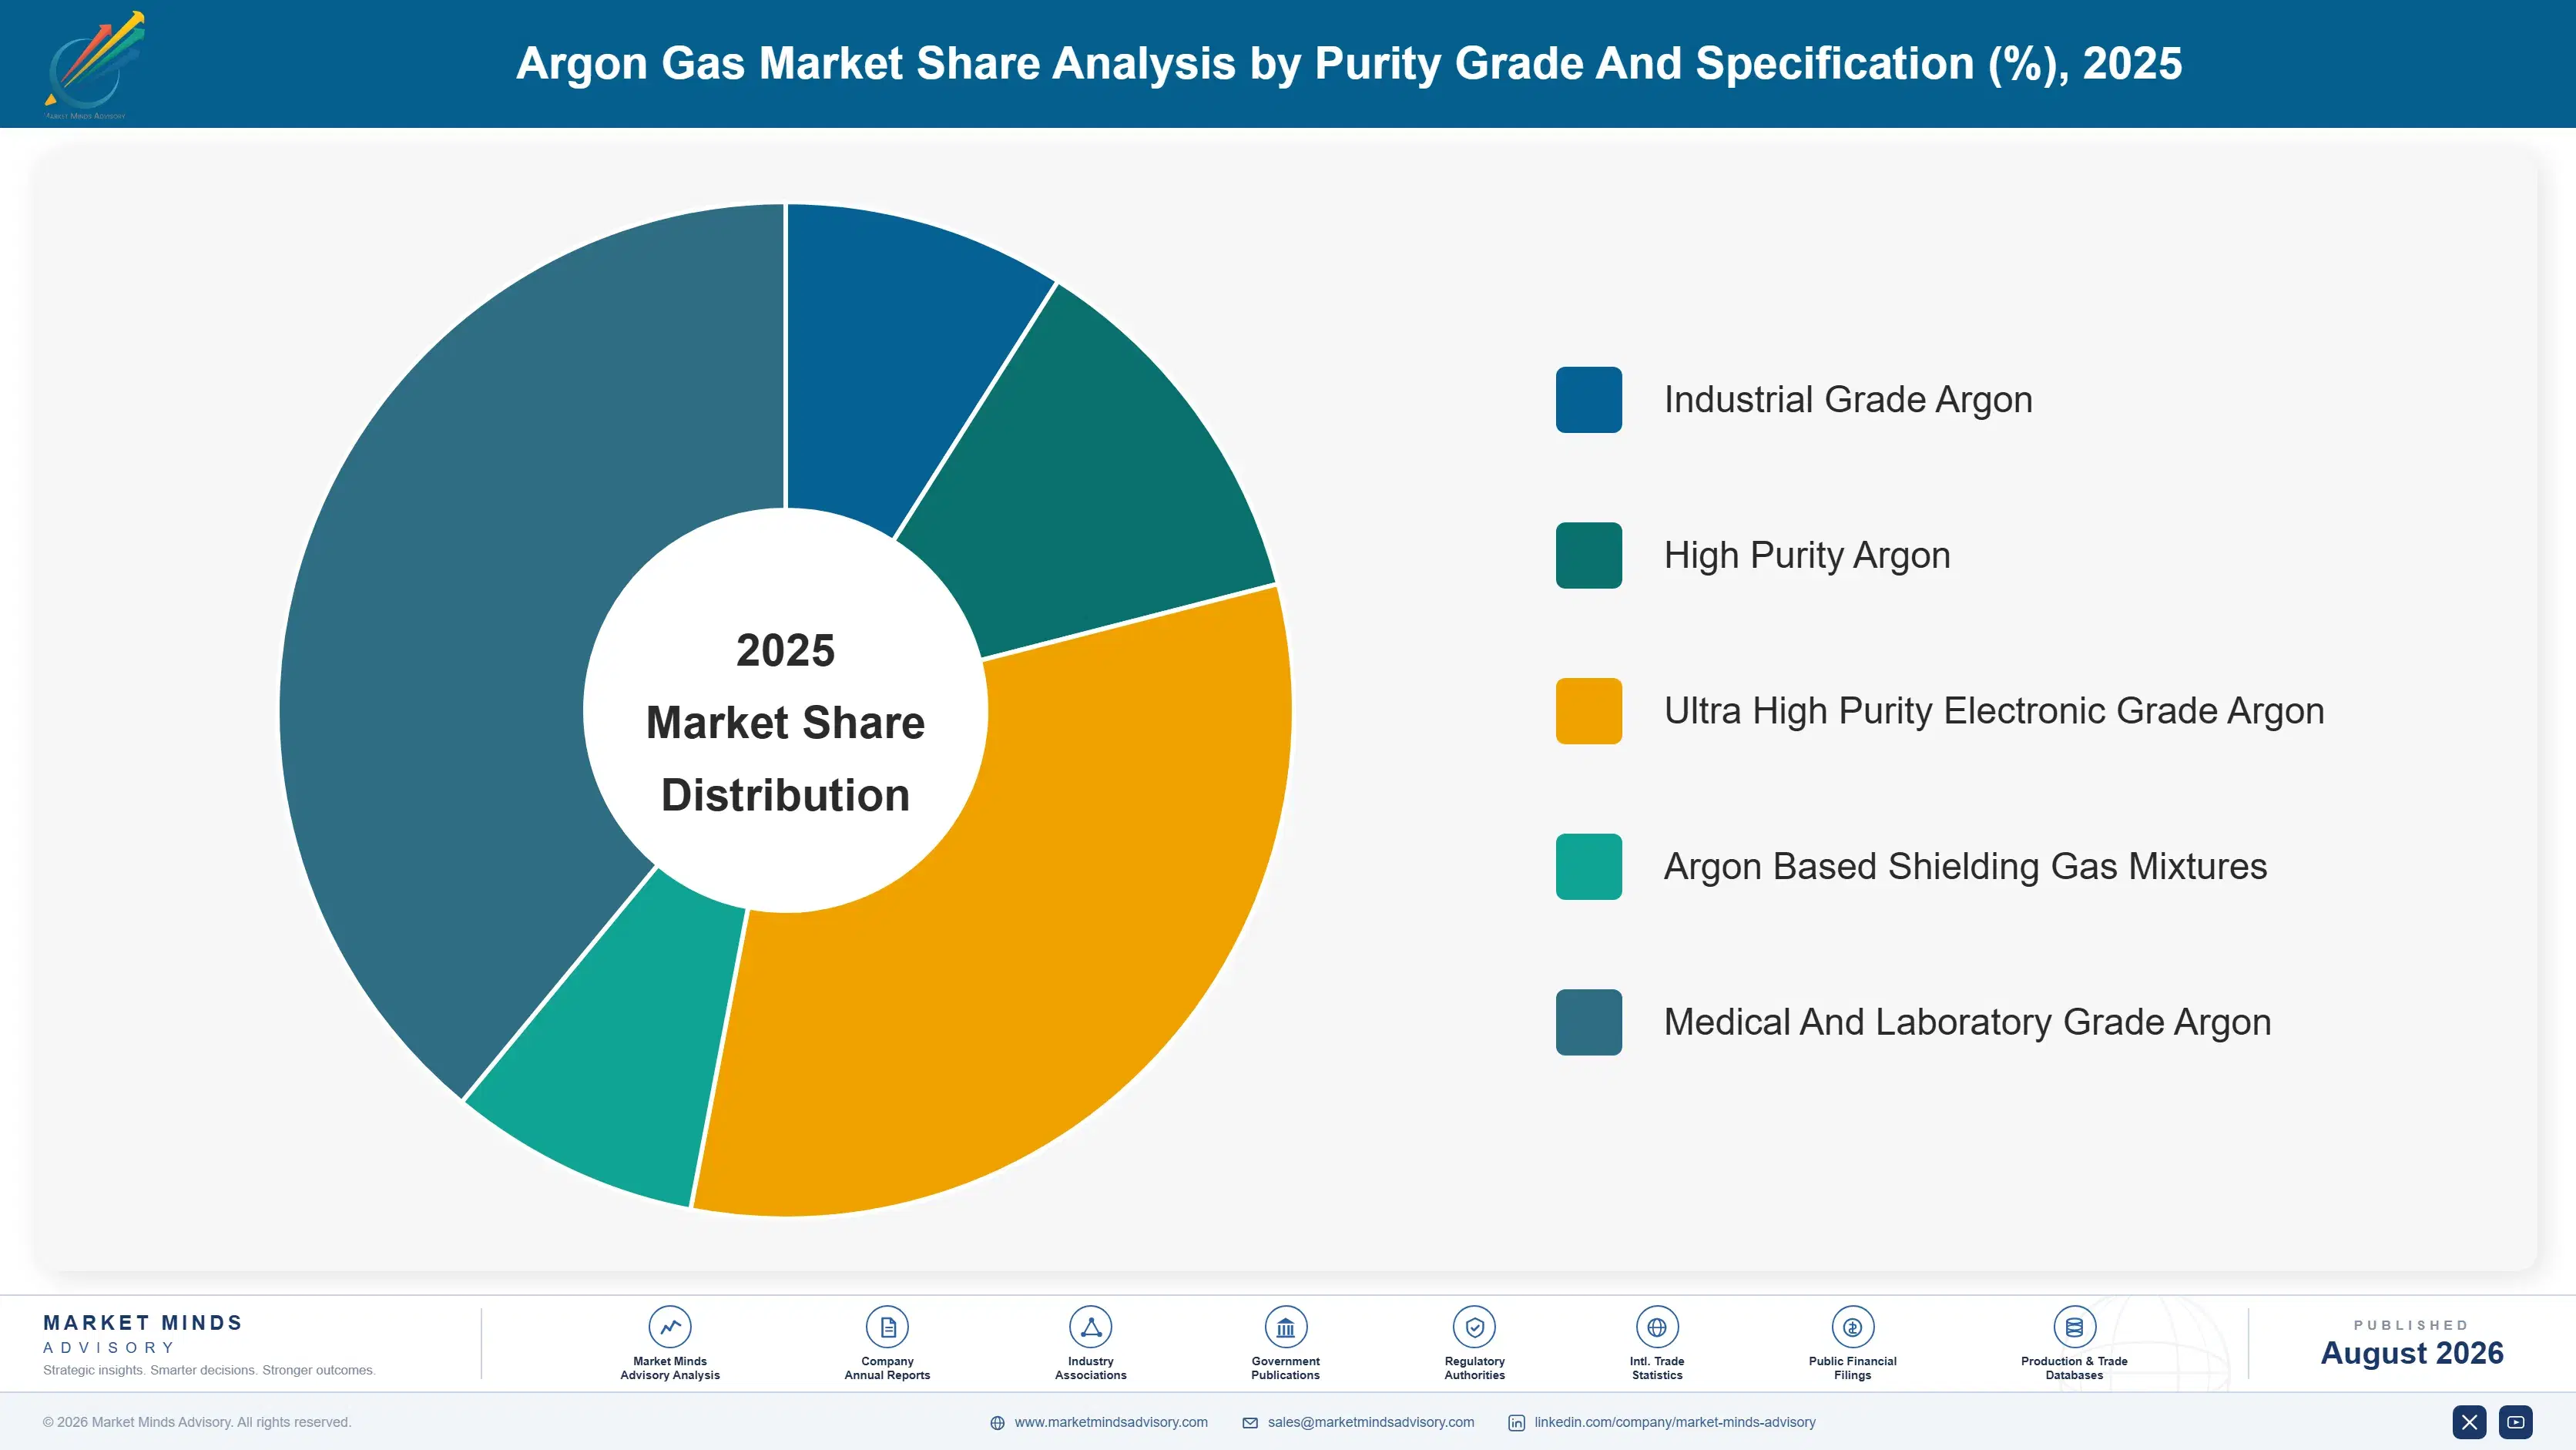
Segmentation follows purity grade and the specification it is certified against, because that determines separation and purification requirement, qualification pathway, price per unit volume, and which producers can credibly supply it. Delivery format and customer industry both cut across every grade rather than separating them, which makes either a weaker primary dimension here. Grade is what the customer certifies against.
argon-gas-market-market-share-analysis-1787302618859

Ultra High Purity Electronic Grade Argon

The fastest grade at 9.6%, exactly 1.50 times the market rate, supplying wafer fabrication where 99.9999% purity is the entry requirement and anything less is simply refused. Consumption per wafer rises with each process node rather than falling with efficiency, so demand grows faster than wafer starts alone would suggest. Qualification into a fab takes months and is rarely reopened, which makes positions durable once won. Purification capability and analytical certification restrict the supplier field far more than separation capacity does at this grade. Fabs contract volume years before commissioning because no production response exists on the supply side at all. Take-or-pay is the normal structure here. Price is rarely the deciding term.
CAGR 9.6%

Argon Based Shielding Gas Mixtures

Second fastest at 7.4%, covering argon blends with carbon dioxide, helium, oxygen, or hydrogen formulated for specific welding processes and base metals. Blending is where a gas company adds application knowledge rather than molecules, and welders rarely change a mixture that produces acceptable results. Metal additive manufacturing has added a demand stream with far higher consumption per part than welding, and those customers are considerably less price sensitive because the powder and the machine time cost more than the gas ever will. Recovery equipment at high consumption sites reduces purchased volume and ties the customer to whoever installed it. That combination holds better than contracts. Few competitors offer both together.
CAGR 7.4%
Full segment breakdown across 5 segments available in the complete report.

Regional Architecture and Country Demand Map

East Asia leads at 42%, far outside band, because Chinese steelmaking and Korean, Taiwanese, and Japanese fabs draw on the same regional separation capacity. North America follows. India grows fastest. Three regional shares sit outside their framework bands. Steel capacity and fab siting explain them.

East Asia

Forty-two percent, far outside the framework band, and justified because Chinese steelmaking supports more air separation capacity than the rest of the world combined while Korean, Taiwanese, and Japanese wafer fabs are the largest concentration of electronic grade demand anywhere. Those two sit on the same continent and draw on overlapping supply. Chinese mill output cuts therefore move argon availability for fabs several hundred kilometres away. Growth at 7.3% runs above the market rate on fab expansion and specialty steel together. Fab operators here contract volume years ahead of commissioning, and take-or-pay structures are considerably more common than anywhere else in the world. The 2021 tightness taught that locally first.
Share: 42% | CAGR: 7.3% (2026 to 2036)

North America

Nineteen percent, below the framework band because supply follows steelmaking and separation capacity rather than manufacturing output generally, and the mix here is shifting quickly toward electronic grades. New fab construction across Arizona, Texas, Ohio, and New York is adding demand into a regional supply base sized for welding and metals. Producers have begun contracting fab volumes years ahead of commissioning. Growth at 6.0% sits near the market rate, with fab demand offsetting flat fabrication volumes. Regional supply was sized around welding and metals demand rather than semiconductor consumption, which leaves the incoming fab load arriving into capacity nobody planned for it. New separation units follow oxygen cases. None are being built for argon.
Share: 19% | CAGR: 6.0% (2026 to 2036)
Regional intelligence for 5 additional markets available in the complete report: Western Europe, South Asia and Pacific, Middle East and Africa, Latin America, Eastern Europe. Contact sales@marketmindsadvisory.com.
argon-gas-market-country-cagr-analysis-1787302619371

Contract Supply Before You Need It

Argon is 0.9% of air, roughly 58% of capacity sits with steelmaking, liquid travels about 500 km, and electronic grade grows at 9.6%. Value comes from long-term contracting, from purification capability, and from recovery systems at high consumption sites. Supply security is worth more than price here. Every buyer learned that in 2022. Nothing else held.

Contract Multi-Year Volume With Take-Or-Pay Commitments

Around 58% of argon capacity is co-located with steelmaking, so availability moves with mill output rather than with argon demand, and shortages in 2021 and 2022 saw spot prices move several multiples while volume was allocated. Buyers who had contracted years earlier were unaffected. Take-or-pay commitments carry genuine volume risk and are the only mechanism that secures supply through a tightness nobody in this market controls. Allocation during a tightness follows contract structure rather than order size, price offered, or relationship length. Spot buyers simply went unserved. Relationship counted for nothing that year.
Market Impact: Steel-linked capacity is 58% of the

Build Purification Capability For Electronic Grade Supply

Electronic grade grows at 9.6% against 6.4% for the market and requires 99.9999% purity with analytical certification that restricts the supplier field far more than separation capacity does. Fab qualification takes months and is rarely reopened afterwards. A producer with separation capacity but no purification and certification capability is supplying the slower-growing part of its own market while watching the faster part contract away from it. Positions won at a fab last that plant's operating life, which makes the certification investment unusually durable. Few producers hold many of them. The barrier is analytical rather than physical.
Market Impact: Electronic grade demands a full 99.

Install Recovery Systems At High Consumption Sites

Powder bed fusion and some fab processes vent argon that can be recovered, purified, and returned to the chamber, which reduces purchased volume by a meaningful margin at sites consuming continuously. Recovery equipment costs capital and pays back against a gas price that has proven capable of moving several multiples in a tightness. Producers selling recovery alongside gas hold the customer more firmly than any supply contract does by itself. Recovery can cut purchased volume by around 30% at a site running continuous builds, which is worth considerably more during a tightness. Payback sits well inside equipment life.
Market Impact: Recovery cuts purchased argon volum

Site Filling Capacity Inside The Delivery Radius

Liquid argon boils off at roughly 0.3% a day and delivered economics fail beyond about 500 km, so a producer serving distant customers from central capacity is losing product and margin on every load. Regional filling stations shorten the run and reduce loss simultaneously. Concentration at 76% reflects separation unit ownership across regions rather than distribution reach, and the two are not the same asset at all. Boil-off at 0.3% a day compounds across every extra hour a tanker spends on the road. Route density fixes more than fleet efficiency.
Market Impact: Delivery radius caps out near 500 k

Who Controls the Margin Pool

Concentration is high at 76% across the top five measured on argon volume supplied, and it follows air separation unit ownership rather than any distribution or commercial advantage. Building a separation unit is capital intensive and the argon is incidental to the investment case, so positions change when industrial complexes are built or closed rather than when anybody competes for them. The leader to challenger gap is widest in electronic grades and narrowest in bulk industrial supply.
Competitive activity runs on three fronts. Regional separation capacity is the first and it is the position itself, since liquid argon cannot travel far enough for a distant producer to contest anything. Purification and fab qualification is the second, where electronic grade growth and pricing both sit. And application services including mixtures and recovery systems are the third, which hold customers more firmly than supply contracts alone.

Pressure arrives from two directions. Regional Chinese and Indian producers have built separation capacity that serves local demand competently and keeps global producers out of those radii. And large fabs have begun contracting directly with producers years ahead of commissioning. Rankings shift on capacity siting rather than on any selling activity.
argon-gas-market-company-positioning-matrix-1787302619889

Competitive Moat and Risk Dimensions

LINDE

Moat: Separation capacity across regions

Air separation units positioned across multiple regional demand centres give supply positions that liquid argon distribution economics make uncontestable from outside a roughly 500 km radius. Electronic grade purification and fab qualification at several of those sites adds a second layer. Neither can be replicated without building comparable capacity in the same places, which requires an oxygen or
LINDE

Risk: Exposure to steel output cycles

Roughly 58% of argon capacity sits alongside steelmaking oxygen demand, so mill curtailments remove argon supply the producer had contracted to deliver. Take-or-pay commitments to customers do not create molecules when the host plant reduces output. That exposure produced allocation and reputational cost across the 2021 and 2022 tightness.
AIR LIQUIDE

Moat: Electronic grade fab qualification depth

Qualification into wafer fabrication plants at 99.9999% purity takes months of analytical validation and is rarely reopened afterwards, which makes each position durable across a fab's operating life. Depth across multiple fab operators in several regions compounds that. Purification and certification capability restricts the qualified supplier field considerably more than separation capacity does at this grade.
AIR LIQUIDE

Risk: Regional producers holding local radii

Chinese and Indian producers have built separation capacity serving local demand competently, and boil-off economics prevent any competitor reaching inside those radii from elsewhere. Global scale confers nothing across a 500 km boundary. Growth in exactly those regions is where the market expands fastest, and the positions there are already taken.

Players Tracked

Prominent Players

Linde
Air Liquide
Air Products and Chemicals
Nippon Sanso Holdings
Messer Group

Other Key Players

SOL Group
Gulf Cryo
Air Water
Iwatani Corporation
Hangzhou Hangyang
Yingde Gases
Baosteel Gases
INOX Air Products
Ellenbarrie Industrial Gases
Southern Industrial Gas
Buzwair Industrial Gases
Samator Indo Gas
Coregas
Norco
nexAir

Recent Developments

FEBRUARY 2025

Fab operator contracts argon years ahead of commissioning

A semiconductor manufacturer signed multi-year electronic grade argon supply covering a plant still under construction, contracting volume well before the fab would consume anything. The agreement was a long-term take-or-pay supply contract rather than any joint venture, acquisition, or equity arrangement with the gas producer involved.
Signal: Fabs are now securing by-product supply ye
MAY 2025

Steel curtailment triggers regional argon allocation

A regional argon shortage followed steel production curtailment across several mills, forcing gas producers to allocate volume to contracted customers and leaving spot buyers largely unserved for a period. The tightness was a by-product supply consequence rather than any change in argon demand or producer commercial policy.
Signal: Argon shortages arrive out of steel produc
AUGUST 2025

Producer commissions argon recovery at additive manufacturing site

An industrial gas producer installed argon recovery and purification equipment at a metal additive manufacturing customer, returning chamber atmosphere to service rather than venting it after each build cycle. The installation was an equipment and service arrangement rather than any joint venture, acquisition, or supply contract restructuring.
Signal: Recovery equipment holds customers conside

Power, Cold Chain and Boil-Off

Delivered cost divides between electricity for air compression and separation at roughly 41%, cryogenic distribution including tanker fuel and boil-off losses near 21%, purification and analytical certification around 13%, storage vessel provision and maintenance about 11%, and labour, testing, and overhead the balance. Electricity dominates because separating air is a compression problem, and it is priced regionally rather than globally.
European industrial electricity prices moved sharply through 2022, and several industrial gas producers disclosed energy cost pass-through and margin pressure in filings covering that year, with IEA reporting the underlying power price movement across the same period. Argon supply tightened separately on steel curtailment, which meant cost and availability pressure arrived together. Producers with indexed energy clauses in customer contracts passed the first through; the second could not be passed

The competitive disadvantage mechanism runs through regional power pricing rather than through operating efficiency. Separation unit efficiency varies within a narrow band across modern plants, while industrial electricity prices differ by a factor of two or more between regions and that difference flows straight into delivered cost. European producers therefore carry a cost position that no operational improvement closes, and boil-off losses add to it wherever the delivery
argon-gas-market-cost-volatility-analysis-1787302620121

Index customer contracts to regional industrial power prices

Electricity carries roughly 41% of delivered cost and moves on regional power markets that no gas producer influences, while customer contracts frequently run annually. Indexed energy clauses shift that exposure to buyers better placed to absorb it across their own cost base. Customers accept indexation more readily during a supply tightness than during comfortable periods, which is when

Reduce boil-off through vessel insulation and route density

Cryogenic distribution carries around 21% of delivered cost, and boil-off at roughly 0.3% a day means product is lost in transit and in customer storage continuously. Improved vessel insulation, higher route density, and shorter delivery runs each reduce it. A producer serving customers beyond about 500 km is losing product on every load and rarely recovers that in pricing.

Upgrade argon recovery on existing separation units

Older air separation units recover a smaller share of the argon in the air they process than modern designs do, and retrofitting recovery columns adds argon output without any additional compression energy or new plant. The capital is significant against a by-product, and it is the only way a producer increases argon supply without needing a new oxygen

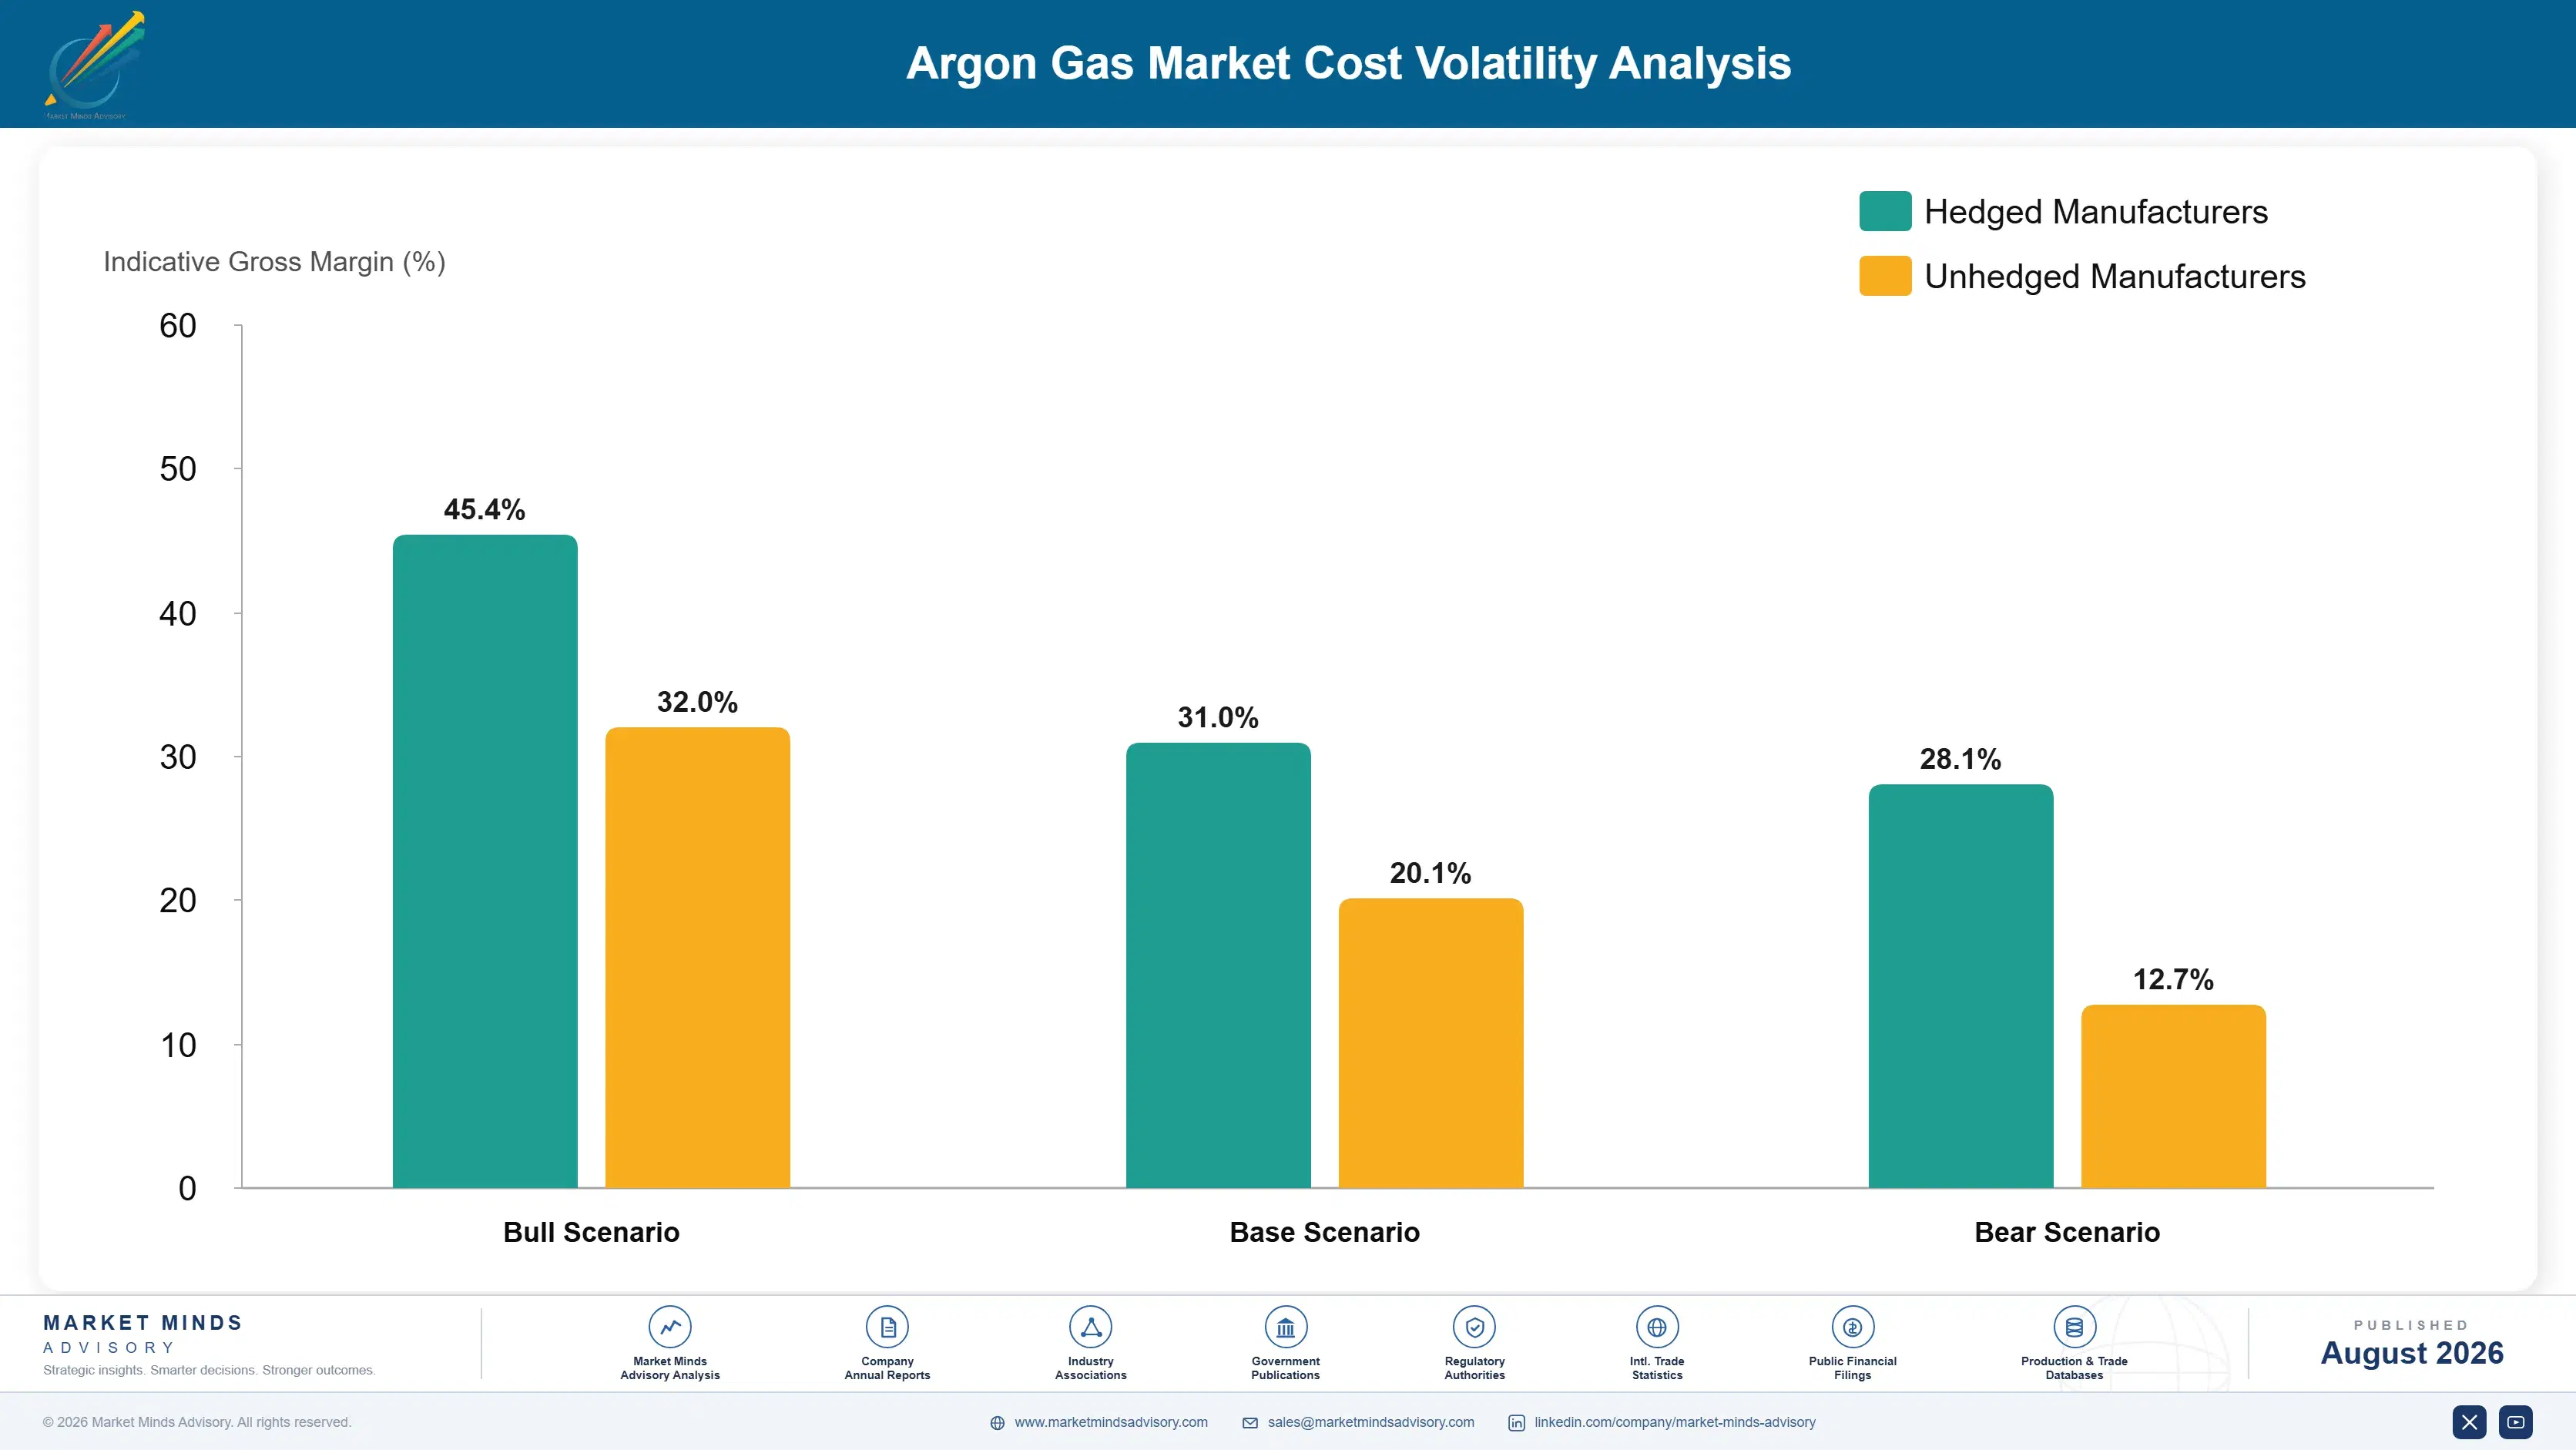
Portfolio Architecture for Margin Defence

Three tiers describe this business and the spread follows purification and certification rather than volume. Bulk industrial argon for welding and fabrication sits at the bottom, where the molecule is a commodity and delivered price inside a radius decides everything. Shielding gas mixtures and high purity grades occupy the middle. Electronic grade argon sits at the top, where 99.9999% purity and fab qualification both apply.
The tension is that bulk volume is what fills a separation unit's argon output and it earns the least, while electronic grade earns the most on volumes that cannot absorb a plant's production. A producer weighted to bulk is exposed to fabrication cycles and regional power pricing together. One weighted to electronic grade holds excellent margin on a customer base that contracts years ahead and rarely changes supplier.

High-value pools concentrate where the specification is unforgiving. Electronic grade is the clearest case, since a fab will not accept below 99.9999% purity and the qualification takes months, which makes the position durable in a way that bulk supply relationships never are. Additive manufacturing atmosphere is the second such pool, where the gas costs far less than the powder and machine time around it.

Volume / Commodity-Adjacent Tier

Bulk industrial argon for welding, cutting, and general fabrication where delivered price inside a radius decides everything. Volume fills the separation unit's argon output and earns the thinnest margin available.
Gross Margin: 18-26%

Premium / Certified Tier

Shielding gas mixtures and high purity grades for metallurgy, heat treatment, and additive manufacturing. Blending adds application knowledge rather than molecules, and welders rarely change a mixture that works. Application support carries real weight here.
Gross Margin: 30-40%

Sustainability / Regulatory / Next-Generation Tier

Ultra high purity electronic grade argon supplied against fab qualification at 99.9999% purity with full analytical certification. Best margin in the portfolio and the most durable positions once qualified. Qualification takes months to complete.
Gross Margin: 42-54%
argon-gas-market-portfolio-architecture-1787302620622

Contracts, Radii and Qualifications

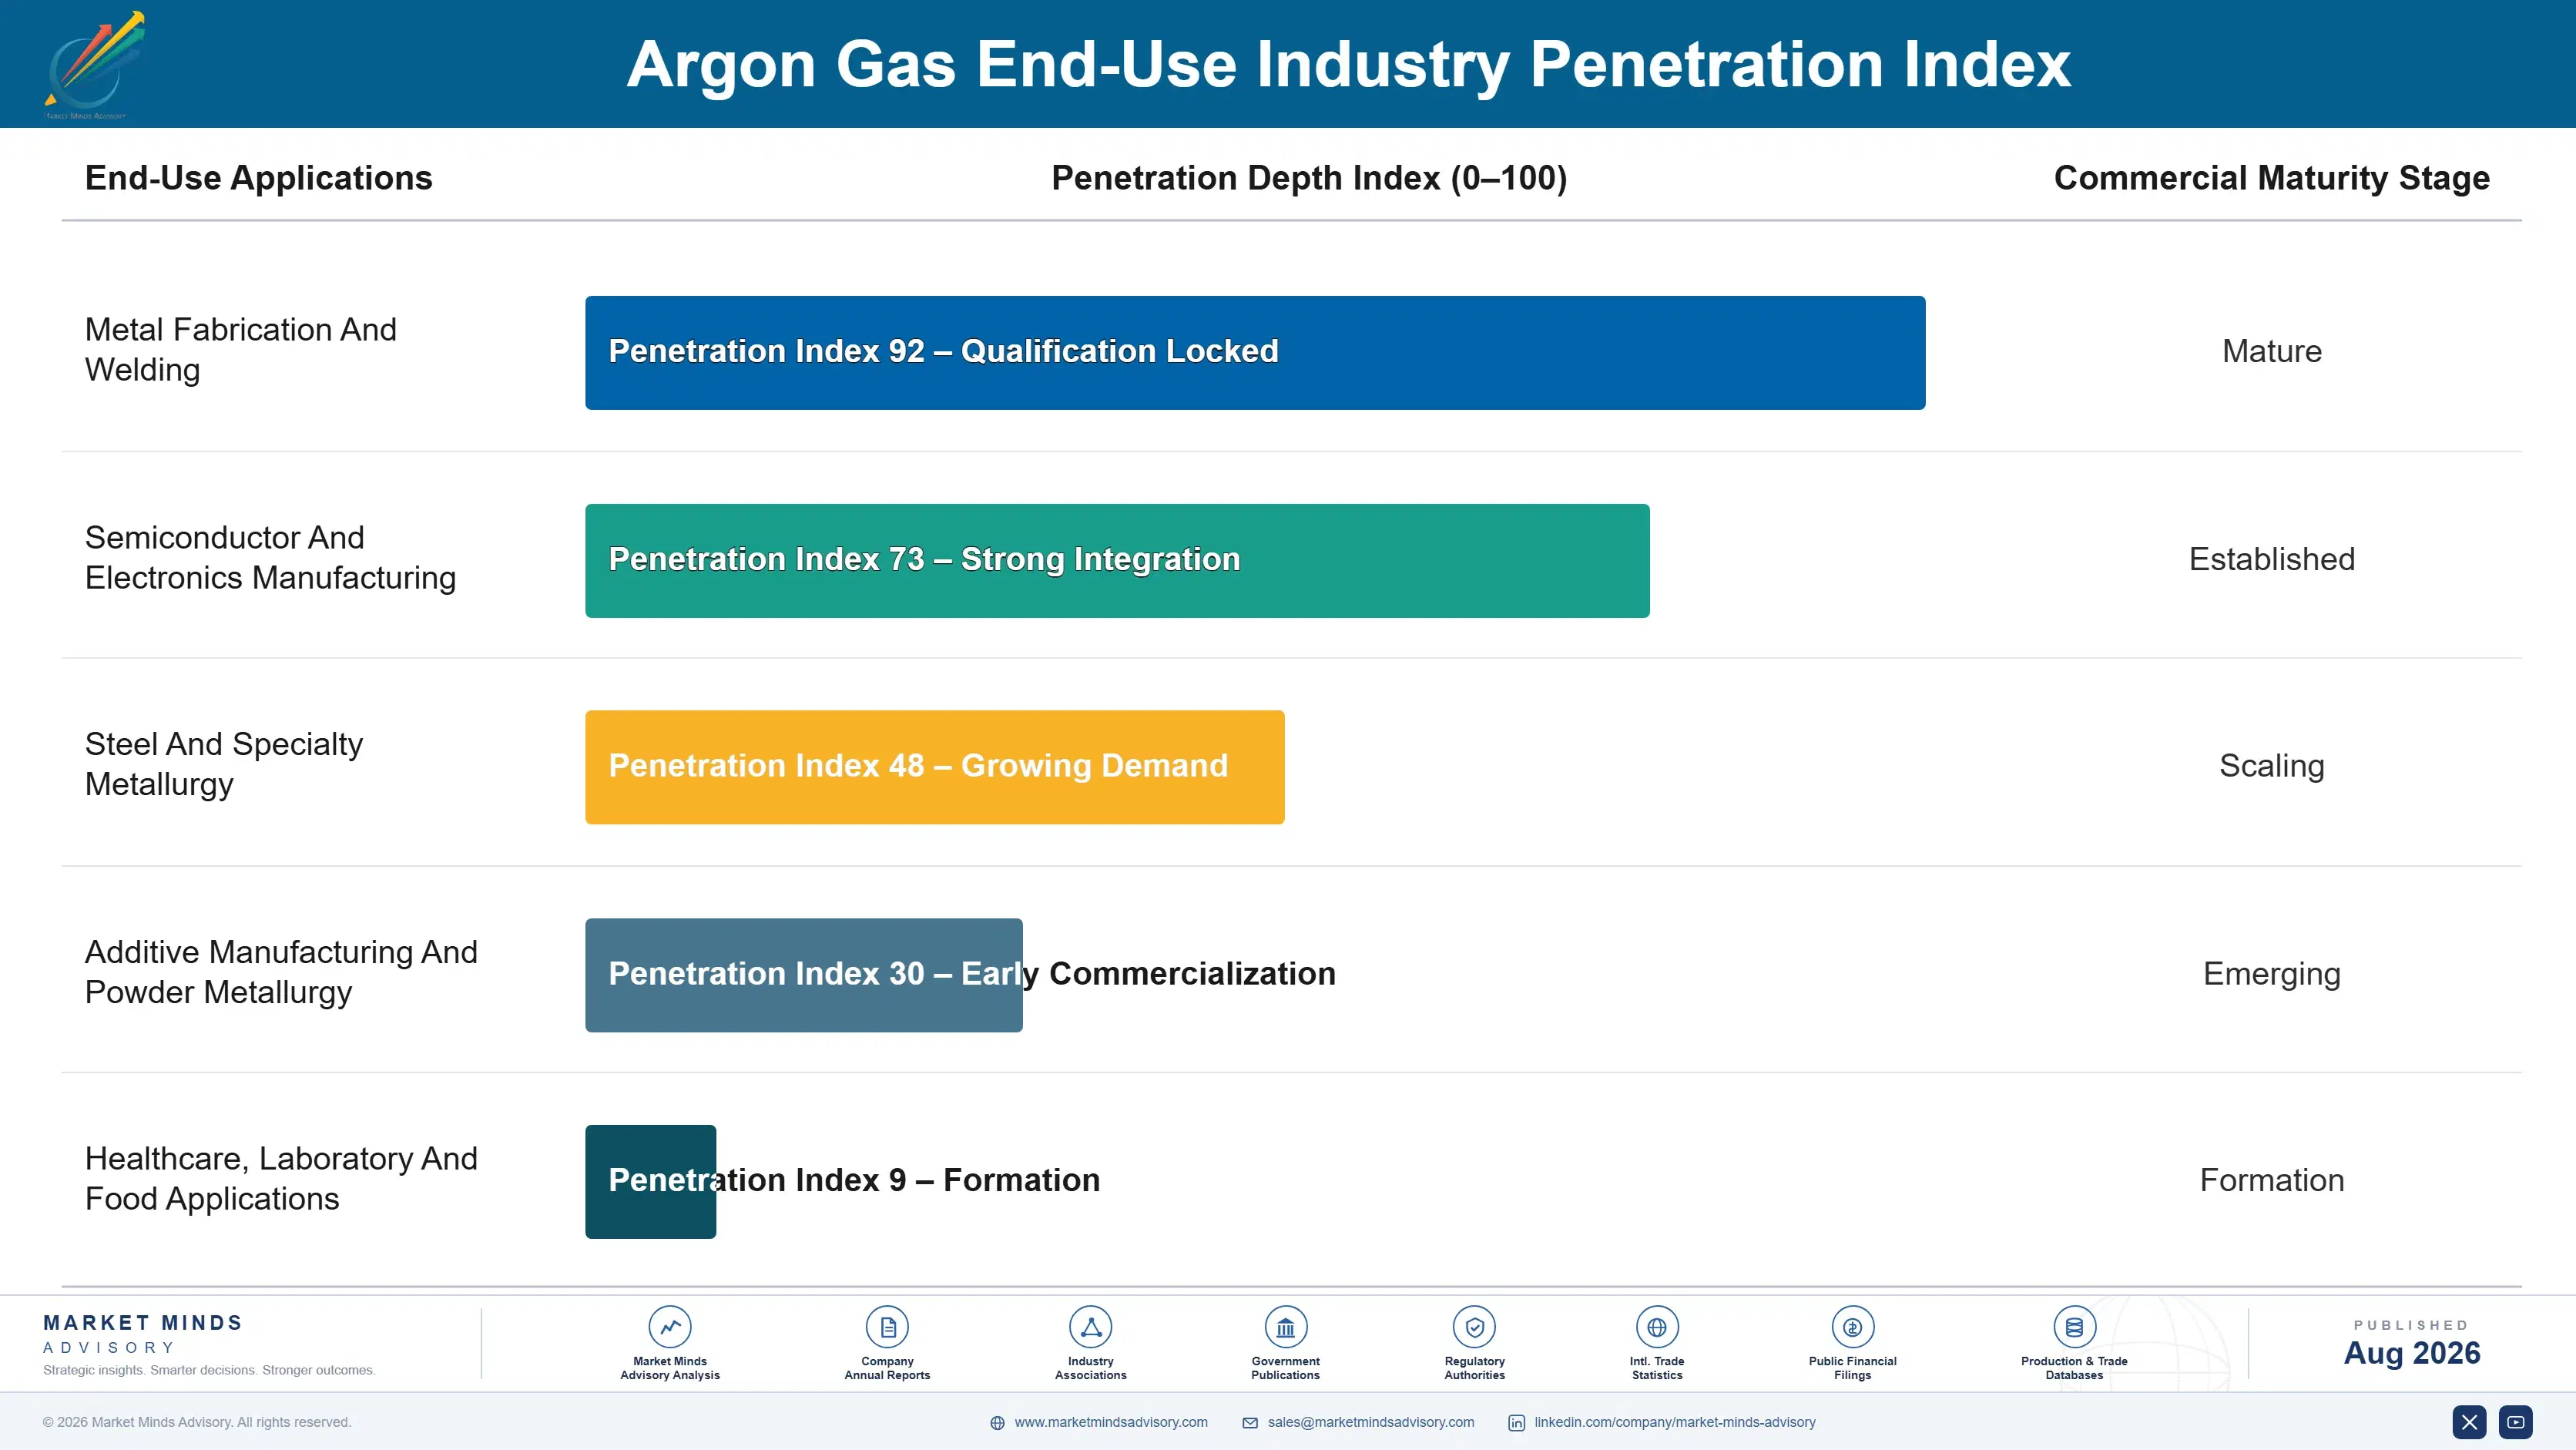
Revenue behaves as a continuous supply annuity once a customer is connected, since argon is consumed rather than installed and volumes track production activity directly. Bulk customers take deliveries against tank telemetry with almost no commercial interaction between contract renewals. That predictability is what makes the by-product supply risk tolerable, because the demand side is the stable half of an equation whose supply half is not.
Stickiness varies sharply by grade and by industry. Fab qualification at 99.9999% purity takes months of analytical validation and is rarely reopened, which makes electronic positions effectively permanent. Additive manufacturing and specialty metallurgy sit in the middle, where recovery equipment and application support both add friction. Welding and general fabrication stick least and do retender on price, though only among producers inside the delivery radius.

Buyer profiles shifted as electronic demand grew and the shortages taught their lesson. The earlier buyer was a fabrication purchasing manager comparing delivered cylinder and bulk prices. The current conversation is increasingly with a fab supply chain director contracting years before a plant is commissioned, who cares about which separation units sit behind the commitment far more than about the price.
argon-gas-market-end-use-penetration-index-1787302621106

What We Would Tell a Board

These are among the four positions where our research anticipates prominent divergence between winners and laggards over the coming forecast period. Each is grounded in the demand model, the regulatory perimeter, and the announced capacity pipeline.
01 / SUPPLY SECURITY CONTRACTING

Contract argon before you need it

Roughly 58% of argon capacity sits alongside steelmaking oxygen demand, so availability moves with mill output rather than with anything argon customers do or forecast themselves. Shortages in 2021 and again in 2022 saw spot prices move several multiples while contracted buyers were served normally and everybody else in the region went entirely unsupplied for weeks. Take-or-pay commitments carry real volume risk and remain the only mechanism that works through a tightness nobody in this market controls, because allocation follows contract structure rather than price.
02 / PURIFICATION CAPABILITY INVESTMENT

Electronic grade needs purification, not more capacity

Electronic grade argon grows at 9.6% against 6.4% for the wider market and requires 99.9999% purity backed by analytical certification that restricts the qualified supplier field far more than separation capacity ever does. Fab qualification takes months of validation work and is rarely reopened afterwards, so each position is durable across a plant's operating life. Producers holding separation capacity but no purification or certification capability are competing entirely in the slower-growing half of their own market while the faster half contracts away from them.
03 / REGIONAL POSITION BUILDING

Global scale means nothing across 500 kilometres

Liquid argon boils off at roughly 0.3% a day and delivered economics fail beyond about 500 km, which makes this a set of regional supply positions rather than one global market at all. Concentration at 76% across the top five reflects separation unit ownership across regions rather than any distribution or commercial advantage that anybody in this industry holds. Regional Chinese and Indian producers hold their own radii completely against every global competitor, and worldwide scale confers nothing whatever against a boundary set by boil-off physics.
04 / RECOVERY SYSTEM SELLING

Sell recovery equipment alongside the molecules

Powder bed fusion and several fab processes vent argon that can be recovered, purified, and returned to service, reducing purchased volume meaningfully at any site consuming continuously through long build or process cycles. The capital pays back against a gas price that has demonstrably moved several multiples during a tightness, and roughly 30% of purchased volume disappears from the invoice permanently. A producer that installed the recovery system itself holds that customer considerably more firmly than any supply contract achieves alone, because the equipment and the molecules arrive together.

Engagement Snapshot From the Field

A live engagement with an industry participant carrying material or product regulatory and market exposure ahead of a defining policy shift, showing how our research translates into a defensible multi-year portfolio strategy.
MARKET MINDS ADVISORY · CLIENT ENGAGEMENT SUMMARY
Argon Gas Producer Strategic Portfolio Review and Transition Roadmap 2026·Investment Scenario on Argon Gas Exposure Evaluation 2025-26
CLIENT PROFILE
A precision metal fabrication and additive manufacturing group with approximately 380 million dollars in annual revenue (client-reported, unverified by MMA), operating six sites across two countries with substantial argon consumption in welding and powder bed fusion. Supply ran on annual contracts at every site, no recovery equipment was installed anywhere, and the 2022 tightness had forced two sites onto reduced production for several weeks.
STRATEGIC CHALLENGE
The board wanted to know why argon had become unobtainable when the group's own demand had not changed, whether the exposure would recur, and what a supply arrangement that survived the next tightness would actually have to look like. Nobody internally could name the separation units behind any of the six sites.
MMA APPROACH
We traced each site's argon back to the specific separation units supplying it and identified the host industrial demand behind each one. Contract structures were assessed for allocation priority during shortage. Recovery economics were modelled at the additive sites, and alternative regional supply points were mapped inside the delivery radius of every location.
KEY FINDINGS
  1. Four of six sites drew argon from separation units co-located with the same steel producer, which the group had never identified and which explained the simultaneous shortage entirely.
  2. Annual contracts placed the group behind take-or-pay customers in allocation priority, which is why supply stopped while other buyers in the same region continued to be served.
  3. Recovery equipment at the two additive sites would have cut purchased argon volume substantially, with payback well inside the equipment life at contracted pricing.
  4. Two sites had a second qualified supply point inside the delivery radius that had never been approached or qualified for use. Nobody had mapped alternatives inside the delivery radius.
CLIENT PROFILE
A precision metal fabrication and additive manufacturing group with approximately 380 million dollars in annual revenue (client-reported, unverified by MMA), operating six sites across two countries with substantial argon consumption in welding and powder bed fusion. Supply ran on annual contracts at every site, no recovery equipment was installed anywhere, and the 2022 tightness had forced two sites onto reduced production for several weeks.
STRATEGIC CHALLENGE
The board wanted to know why argon had become unobtainable when the group's own demand had not changed, whether the exposure would recur, and what a supply arrangement that survived the next tightness would actually have to look like. Nobody internally could name the separation units behind any of the six sites.
MMA APPROACH
We traced each site's argon back to the specific separation units supplying it and identified the host industrial demand behind each one. Contract structures were assessed for allocation priority during shortage. Recovery economics were modelled at the additive sites, and alternative regional supply points were mapped inside the delivery radius of every location.
KEY FINDINGS
  1. Four of six sites drew argon from separation units co-located with the same steel producer, which the group had never identified and which explained the simultaneous shortage entirely.
  2. Annual contracts placed the group behind take-or-pay customers in allocation priority, which is why supply stopped while other buyers in the same region continued to be served.
  3. Recovery equipment at the two additive sites would have cut purchased argon volume substantially, with payback well inside the equipment life at contracted pricing.
  4. Two sites had a second qualified supply point inside the delivery radius that had never been approached or qualified for use. Nobody had mapped alternatives inside the delivery radius.
RECOMMENDED STRATEGY
Phase 1: Phase 1 (months one to eight): convert the three largest sites to multi-year take-or-pay contracts with explicit allocation priority language. Phase 2: Phase 2 (months eight to twenty): install argon recovery at both additive manufacturing sites and requalify supply against reduced purchased volume. Phase 3: Phase 3 (months twenty to thirty-six): qualify second regional supply points at every site with an alternative inside the radius.
OUTCOME
Take-or-pay contracts were signed covering roughly 70% of group consumption within two quarters. Recovery equipment was ordered for both additive sites, and the group identified and qualified two alternative regional supply points it had not previously known existed (client-reported, unverified by MMA). Allocation priority language was written into all three of the largest contracts.

Frequently Asked Questions

Foundational context covering the market sizes, CAGR, scope, country, region and competition that inform every finding below. This section is provided to cover basics and most often pre-purchase conversations, answered from the MMA Primary Research Dataset.

What is the current size of the Argon Gas Market?

The market is valued at USD 5.6 billion in 2025, rising to USD 5.96 billion in 2026. Scope covers argon supplied in gaseous and liquid form, not separation equipment or other industrial gases.

How large will the Argon Gas Market be by 2036?

MMA forecasts USD 11.08 billion by 2036, an increase of USD 5.12 billion over the 2026 base. That represents an expansion multiple of 1.86 times across the forecast period.

What is the CAGR for the Argon Gas Market 2026 to 2036?

The base case CAGR is 6.4%, with a bull case of 7.6% and a bear case of 5.2%. The historical rate from 2020 to 2025 was 5.4%, disrupted by two by-product supply crises.

Which segment is growing fastest?

Ultra high purity electronic grade argon at 9.6%, exactly 1.50 times the market rate. Consumption per wafer rises with each process node rather than falling with efficiency improvements.

Who are the major companies in the Argon Gas Market?

Linde, Air Liquide, Air Products and Chemicals, Nippon Sanso Holdings, and Messer Group lead on argon volume supplied. The top five hold 76%, following air separation unit ownership.

Which country is growing fastest?

India at 8.9%, where new steel capacity brings separation units and argon supply alongside growing fabrication demand. India is unusual in adding supply and demand simultaneously.

Report Segmentation Architecture

The full report scope spans multiple orthogonal segmentation dimensions, with cross-tabulated demand data provided for each dimension pair. Coverage extends further to regional breakdowns, trend trajectories, and the competitive detail needed to support segment-level decision-making.

By Purity Grade And Specification

  • Industrial Grade Argon
  • High Purity Argon
  • Ultra High Purity Electronic Grade Argon
  • Argon Based Shielding Gas Mixtures
  • Medical And Laboratory Grade Argon

By End-Use Industry

  • Metal Fabrication And Welding
  • Semiconductor And Electronics Manufacturing
  • Steel And Specialty Metallurgy
  • Additive Manufacturing And Powder Metallurgy
  • Healthcare, Laboratory And Food Applications

By Commercial Model

  • On-Site Pipeline Supply Agreements
  • Bulk Liquid Tanker Delivery
  • Cylinder And Packaged Gas Supply
  • Distributor And Independent Filler Channels
  • Recovery Equipment And Service Contracts

By Region

  • East Asia
  • North America
  • Western Europe
  • South Asia and Pacific
  • Middle East and Africa
  • Latin America
  • Eastern Europe

Scope, Methodology, and Coverage

Every figure in this report is reproducible from documented input assumptions. The scope below maps the historical period, the forecast horizon, the segmentation dimensions, and the countries covered, alongside the underlying primary and qualitative methodology.
Historical Period
2020 to 2025
Forecast Period
2026 to 2036
Base Year
2025 (USD billions; MMA Primary Research Dataset, August 2026)
Market Definition
This market comprises argon supplied in gaseous and liquid form for industrial, electronic, metallurgical, medical, and laboratory applications, measured at producer revenue across on-site pipeline, bulk liquid, cylinder, distributor, and recovery service channels. Coverage spans industrial grade argon, high purity argon, ultra high purity electronic grade argon at semiconductor specification, argon-based shielding gas mixtures, and medical and laboratory grade argon. Air separation units, cryogenic tanks and vaporisers sold as capital equipment, other industrial gases including oxygen, nitrogen, helium, hydrogen and carbon dioxide supplied separately, welding consumables other than shielding gas, gas dispensing and control equipment, and on-site generation plant sold as capital equipment fall outside scope.
Quantitative Units
USD billions (current prices); argon volume supplied in cubic metres; price per cubic metre by grade; separation unit argon recovery rate
Segmentation Dimensions
By Purity Grade And Specification; By End-Use Industry; By Commercial Model; By Region
Regions Covered
East Asia, North America, Western Europe, South Asia and Pacific, Middle East and Africa, Latin America, Eastern Europe
Countries Covered
China, Japan, South Korea, Taiwan, United States, Canada, Mexico, Germany, France, Italy, United Kingdom, Netherlands, India, Vietnam, Thailand, Indonesia, Australia, Brazil, Chile, Saudi Arabia, United Arab Emirates, South Africa, Poland, Czechia, and additional markets relevant to this sector
Key Companies Profiled
Linde, Air Liquide, Air Products and Chemicals, Nippon Sanso Holdings, Messer Group, SOL Group, Gulf Cryo, Air Water, Iwatani Corporation, Hangzhou Hangyang, Yingde Gases, Baosteel Gases, INOX Air Products, Ellenbarrie Industrial Gases, Southern Industrial Gas, Buzwair Industrial Gases, Samator Indo Gas, Coregas, Norco, nexAir
Quantitative Methodology
Primary survey, n=3,800 respondents, Q4 2025, six countries; demand-side model with trade association cross-validation
Qualitative Methodology
47 expert interviews, Q4 2025; applied to validate demand model assumptions, identify emerging dynamics, and assess competitive positioning
Report Format
PDF and XLSX data workbook (Word format preview document)
Publisher
Market Minds Advisory
Report Code
MMA-2026-CHM-798
Published
August 2026
Contact
sales@marketmindsadvisory.com | www.marketmindsadvisory.com

Purchase the full Argon Gas Market Report (2026 to 2036).

The full report sizes argon across five purity grades, five end-use industries, five commercial models, and seven regions, with by-product supply traced back to host separation unit demand throughout. Steel-linked capacity exposure is quantified region by region, since that determines where shortages originate and who they reach. Delivery radius economics are modelled against boil-off rates and route density. Competitive profiling covers twenty producers on argon volume supplied, and electronic grade purification capability is assessed separately from separation capacity. Regional demand is built from separation unit siting rather than from any manufacturing output measure.
By-product supply traced back to host separation unit demand
Steel-linked capacity exposure quantified region by region
Delivery radius economics modelled against boil-off and route density
Electronic grade purification capability assessed separately from separation capacity
Fab qualification positions mapped by producer and plant
Recovery system economics modelled at high consumption customer sites

Built For The People Who Decide

From boardroom strategy to bench-side execution, this report is read cover-to-cover by leaders shaping the next decade of their industry, turning demand scenarios, market dynamics and valuation benchmarks into decisions.
CXOs/ Presidents/ VPs/ Managers
M&A and Corporate Development
Strategy Teams and R&D Heads
Procurement and Product Directors
Regulatory and Compliance Leaders
Investor Relations and Equity Analysts