

Market Minds Advisory
AR in Retail Market

AR in Retail Market: AR in Retail Market: Asset Economics, Return Reduction and Store Operations, 2026 to 2036

Vendors sell the experience and avoid discussing the forty thousand product models a retailer needs first. Asset production consumes 58% of deployment spending, and catalogue coverage sits near 7% today.

Lead Analyst

Published

September 2026

Make Smarter Decisions with Customized Research Insights

Request a free sample report and evaluate market opportunities, growth trends, and competitive dynamics relevant to your business needs.

2025 MARKET VALUE$3.2BMarket Size 2025
2036 FORECAST VALUE$11.8BBase Case , 2026 to 2036
CAGR 2026 TO 203612.6 %Bull 13.8% / Bear 11.4%
INCREMENTAL OPPORTUNITY$8.2BNet 10- year value creation
EXPANSION MULTIPLE3.28x2036 value over 2026 base
Strategic Levers
M&A Pipeline
Regional Outlook
Country Rankings
Competitive Intelligence
Segmental Deep-dive
Call-Us : 91 93563 13602

Executive Snapshot and Market Trajectory.

The fastest growing part of retail augmented reality faces no customer at all. Store operations and planogram assistance grows at 18.9%, half again the market rate of 12.6%, because it produces a labour saving somebody in finance can count rather than a marketing claim somebody has to believe.
On the customer side the durable argument turned out to be returns rather than conversion. Covered product lines show return rates improving by around 14 points, and in apparel and footwear that is money the business already spends on shipping and processing. Conversion lift claims persuaded marketing teams for a decade and rarely survived a finance review, which is why deployments stalled. Pilots stalled there for years.
Coverage is the constraint nobody advertises. Only about 6.8% of retail assortment has an accurate three dimensional model behind it, and building those models consumes 58% of what a deployment costs. Vendors solved rendering years ago and did not solve asset creation, which is why pilots cover a few hundred products and never reach the catalogue. Concentration is low at 33%, and the vendors gaining ground made models cheap rather than beautiful. Coverage decides everything.
Market Definition
This market covers augmented reality software and services deployed for retail, including face-tracked virtual try-on, body and garment fit visualisation, furniture and space placement, packaging and marketing experiences, in-store navigation and shelf overlay, and store operations and planogram assistance. It excludes headset and device hardware, virtual reality applications, general commerce platforms, computer vision used for loss prevention or checkout-free stores, digital signage, and standalone product photography services.
Base Year Value
$3.2B in 2025 (MMA Primary Research Dataset, September 2026)
Forecast Period
2026 to 2036, eleven discrete annual values
CAGR
12.6% base case. Bull 13.8%. Bear 11.4%.
Fastest Growth Segment
Store Operations And Planogram Assistance: 18.9% CAGR
Fastest Growth Country
China: 17.2% CAGR
Fastest Growth Region
South Asia and Pacific: 14.6% CAGR
Largest Region
East Asia: 33% of 2025 global value
Market Leaders
Perfect Corp, Snap, Threekit, Adobe, and Zappar lead the field. Source: MMA Primary Research Dataset, July 2026.
Primary Survey
n=3,800 procurement and R&D decision-makers, Q4 2025, six countries
Methodology
Demand-side build-up, cross-validated against public data, 47 expert interviews

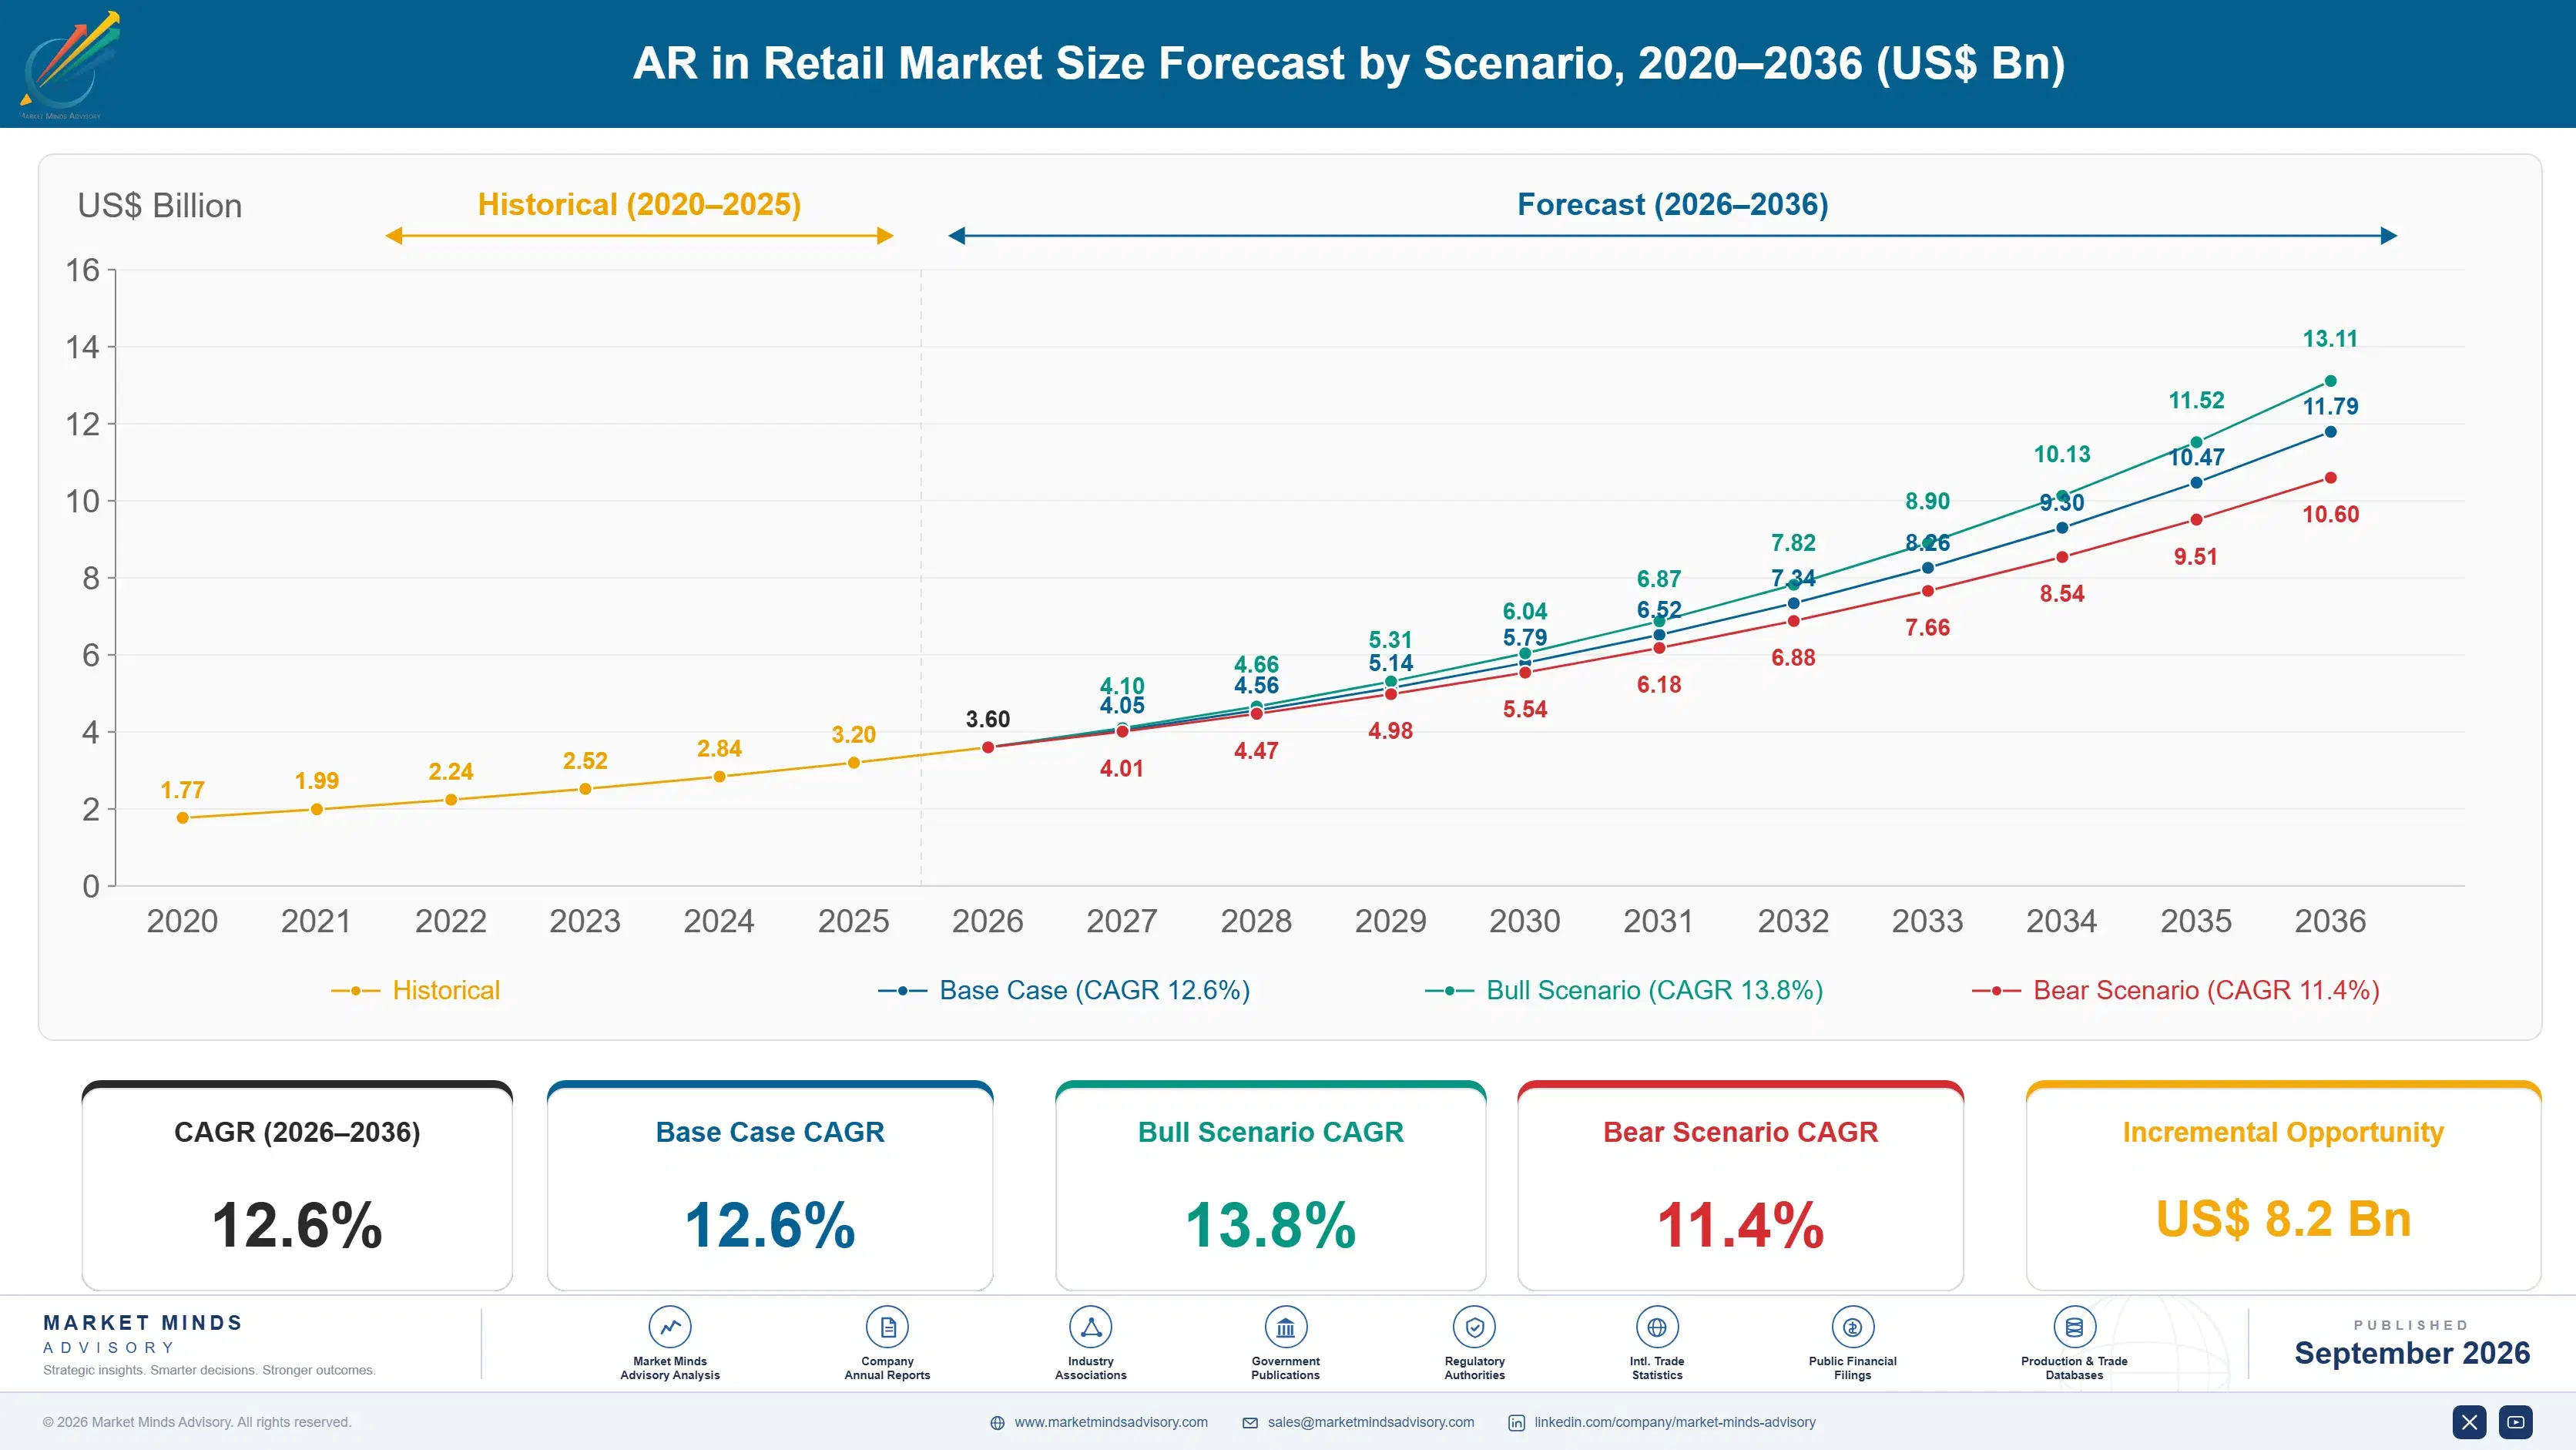
AR in Retail Market Forecast Scenarios

ar-in-retail-market-size-forecast-scenario-1790010958637
Between 2020 and 2025 the category survived its own promises. Headset deployment never arrived in retail and 94% of sessions run on phones, which invalidated investment aimed at a channel with no traffic. Conversion lift claims did not hold up under finance review. Historical growth of 11.2% came from beauty and eyewear try-on and from furniture placement, where the technology genuinely works.
The base case at 12.6% rests on three mechanisms. Store operations work grows fastest because planogram compliance and picking assistance produce measurable labour savings rather than attributed sales. Return reduction of roughly 14 points on covered lines gives customer-facing deployment a case finance accepts. And automated asset generation lowers the cost of the coverage problem that has capped every deployment so far at a fraction of catalogue. None depends on headsets.
The bull case at 13.8% depends on automated model generation reaching accuracy that retailers accept without manual correction, which would move coverage from a few percent toward whole catalogues. The bear case at 11.4% is asset cost holding where it is: at 58% of deployment spending, coverage expands slowly, pilots stay pilots, and the category continues to be evaluated on experiences rather than on catalogue reach.

The Models Cost More Than The Magic

Every augmented reality demonstration works. That has been true for years and it is not the reason deployments stall. What stops them is that a retailer with forty thousand active products needs forty thousand accurate models, and building those consumes 58% of the deployment budget before a single customer sees anything. Coverage sits near 6.8% of assortment across the retailers studied.
TOP FIVE CONCENTRATION33%Share of software revenue held by the leading vendors
CATALOGUE COVERAGE RATE6.8%Retail assortment with an accurate three dimensional model
RETURN REDUCTION EFFECT14 pointsReturn rate improvement measured across covered product lines
ASSET PRODUCTION COST SHARE58%Deployment spending consumed by building three dimensional models
AVERAGE ANNUAL CONTRACTUSD 118,000Subscription value averaged across all enterprise retail deployments
MOBILE SESSION SHARE94%Experiences delivered through phones rather than any headset
The commercial case also moved. Conversion lift was the pitch for a decade and it rarely survived a finance review, because attributing incremental sales to an experience the customer chose to open is genuinely difficult. Return reduction is different. Covered lines improve by around 14 points, returns cost real money in shipping and processing, and the saving appears in accounts the retailer already keeps.
Meanwhile the fastest growing application has no customer in it. Store operations work, covering planogram compliance, shelf audit, and picking assistance, grows at 18.9% because it saves staff hours that show up directly in a labour line. It is unglamorous, it requires far fewer models than a customer-facing deployment, and it is approved considerably faster. It requires far fewer models than a customer catalogue does, which is the other reason it moves quickly.
"Every vendor demonstration uses the same twelve products, beautifully modelled, and everybody in the room knows it. Ask what happens at forty thousand and the conversation changes tone completely. The interesting companies here are not the ones with better rendering. They are the ones who worked out how to make models cheaply."
Practice Director, Retail Technology and Digital Experience · MMA Technology Practice · September 2026

Market Trends

Operations Work Outgrows Every Customer Facing Application

Planogram compliance, shelf audit, and picking assistance produce a saving that appears in a labour line, which is a different kind of argument from attributed conversion lift and a far easier one to approve. Store operations grows at 18.9%, the fastest here. It also needs far fewer three dimensional models, since a fixture layout is a fraction of the modelling work a customer-facing catalogue requires. Vendors positioned entirely around consumer experiences have been slow to notice where the approvals are happening. Approvals are happening in operating budgets rather than campaign ones.
Market Impact: Country grows at 17.2%

Returns Replace Conversion As The Funded Benefit

Attributing incremental sales to an experience a customer chose to open has never convinced a finance function, and a decade of conversion claims produced pilots rather than rollouts. Return reduction of roughly 14 points on covered lines behaves differently, because returns already sit in the accounts as shipping and processing cost. The effect is strongest in eyewear and beauty, where fit and shade drive most returns, and weakest in body-fit apparel, which is where returns hurt most. That mismatch is uncomfortable: the technology works best where returns cost least, and struggles hardest where they cost most.
Market Impact: Coverage sits at 6.8%

Market Opportunities and Growth Drivers

Beauty And Eyewear Suit What Phone Cameras Do Well

Face tracking on a phone is accurate enough to place a lipstick shade or a spectacle frame convincingly, and both categories carry return rates driven by appearance rather than by fit measurement. Chinese growth of 17.2% leads every country covered, supported by beauty commerce running at a scale nothing else approaches and by live selling formats that use try-on directly. The technology fits the application here rather than the application being stretched to fit the technology. Asset costs are lighter here too, since a shade or a frame model costs far less than a physical product.
Market Impact: Consumes 58% of spending

Automated Model Generation Attacks The Coverage Ceiling

Manual three dimensional modelling costs enough that coverage sits near 6.8% of assortment, which caps every deployment regardless of how good the experience is. Generation from product photography and scanning is improving fast, and vendors offering it report coverage expanding several times over within a year at the same budget. Accuracy still requires correction on complex products, but the direction is clear and it addresses the only constraint that has genuinely mattered. Complex products still need manual correction, but the unit economics improve with every catalogue processed rather than staying fixed the way studio labour does.
Market Impact: Fit drives 40% of returns

Market Restraints and Challenges

Asset Production Consumes Most Of The Budget

Building accurate models absorbs 58% of deployment spending, and the root cause is that every product needs its own, while the software needs building once. Commercially this produces pilots covering a few hundred products that never reach catalogue scale, and retailers conclude the category does not work when in fact they never funded coverage. Vendors respond with automated generation from photography, asset reuse across photography and configurators, and pricing tied to catalogue rather than experiences. Retailers then conclude the category does not work, when in fact nobody ever funded coverage.
Market Impact: Segment grows at 18.9%

Body Fit Remains Beyond What Phones Measure

Garment fit is where return rates run highest and where phone-based visualisation performs worst, and the root cause is that estimating body dimensions from a handheld camera is a considerably harder problem than tracking a face. Commercially this leaves the largest returns pool underserved while easier categories take the available spending. Vendors respond with measurement from reference garments the shopper already owns, size recommendation from purchase history, and scanning at store locations. The technology works best where returns cost least and struggles where they cost most, which is an awkward position for the whole category.
Market Impact: Returns improve 14 points
3 additional market trends, 4 additional growth drivers, and 2 additional restraints and challenges are covered in the full report. Contact sales@marketmindsadvisory.com to access the complete intelligence.

Segment CAGR and Growth Architecture

Segmentation follows deployment application. Six categories cover the market: face-tracked virtual try-on, body and garment fit visualisation, furniture and space placement, packaging and marketing experiences, in-store navigation and shelf overlay, and store operations and planogram assistance. Three dimensional asset production is counted within the application it supports rather than separately. Agency creative work sits within its deployment application.
ar-in-retail-market-market-share-analysis-1790010959197

Store Operations And Planogram Assistance

Operations work grows at 18.9%, half again the market rate of 12.6%, and it is the part of this category with no customer in it at all. Overlaying planogram compliance on a shelf, guiding a picker to a location, or auditing facings against a plan saves staff hours that appear directly in a labour line, which is an easier approval than any attributed sales claim. It also requires far fewer three dimensional models, since fixtures and layouts are a fraction of the modelling work a customer catalogue demands. Approval cycles run considerably shorter as a result. Vendors built entirely around consumer experiences have been slow to follow the money here.
CAGR 18.9%

Face-Tracked Virtual Try-On

Face-tracked try-on grows at 13.4% because it is the one consumer application where phone hardware genuinely suits the task. Placing a lipstick shade or a spectacle frame on a tracked face is accurate enough to change a purchase decision, and both categories carry returns driven by appearance rather than by measurement. Chinese beauty commerce and live selling formats deploy it at a scale nothing else approaches. Asset requirements are also lighter than physical product categories, since a shade or a frame model costs far less to produce than a piece of furniture. Data protection rules push face processing onto the device rather than a server, which suits phone deployment anyway.
CAGR 13.4%
Full segment breakdown across 6 segments available in the complete report.

Regional Architecture and Country Demand Map

Regional shares follow commerce scale and the sophistication of retail asset pipelines rather than population or general technology adoption. One region sits outside the standard bands, for the reason named in its paragraph and summarised for operator review below. Asset production and asset consumption sit in different regions.

East Asia

At 33% this region sits above the standard band, and the justification is deployment scale: Chinese beauty and fashion commerce runs at volumes nothing else approaches, and live selling formats use try-on inside the sales moment rather than beside it. Chinese growth of 17.2% leads every country covered. Korean and Japanese beauty brands deploy try-on across their own channels and export the practice with their products. Retail asset pipelines here are more mature than elsewhere, partly because marketplaces require standardised product imagery already. Asset production costs are lower here than in Western markets, which eases the coverage constraint that caps deployments elsewhere and lets retailers fund catalogue breadth earlier. Marketplace imagery standards had already forced disciplined asset pipelines.
Share: 33% | CAGR: 13.6% (2026 to 2036)

North America

Return reduction is the argument that funds deployment here, since return shipping and processing costs are high and the accounting is visible. Furniture and home placement is unusually well developed, supported by retailers with mature three dimensional asset libraries built originally for catalogue photography. Growth of 12.1% is close to the world rate. Store operations adoption is accelerating fastest among grocery and general merchandise chains, where planogram compliance auditing had previously consumed considerable field labour across large store estates. Contract values are the highest of any region, reflecting deployment breadth across large assortments rather than any pricing difference between vendors serving the same retailers. Store operations adoption accelerates fastest among large grocery chains.
Share: 25% | CAGR: 12.1% (2026 to 2036)
Regional intelligence for 5 additional markets available in the complete report: Western Europe, South Asia and Pacific, Latin America, Middle East and Africa, Eastern Europe. Contact sales@marketmindsadvisory.com.
ar-in-retail-market-country-cagr-analysis-1790010959750

Where Vendors Reach Real Budgets

Four commercial moves separate vendors reaching operating budgets from those pitching experiences to marketing teams whose pilots never scale. Each accepts that asset coverage is the binding constraint and that a saving somebody can count beats a lift somebody has to attribute. Rendering quality has decided nothing for several years now. Nobody funds a lift they cannot attribute.

Sell Operations Savings Before Consumer Experiences

Planogram compliance and picking assistance save staff hours that land in a labour line, and store operations grows at 18.9% because that argument clears approval where attributed conversion never did. Vendors leading with operations report sales cycles 2.7 times shorter and far higher pilot-to-rollout conversion. It also requires a fraction of the modelling work, so the deployment reaches useful coverage inside a quarter rather than stalling on an asset backlog. Vendors positioned entirely around consumer experiences keep pitching to the budget that stopped growing. Useful coverage arrives inside a quarter rather than stalling on an asset backlog nobody funded.
Market Impact: Shortens enterprise sales cycles by 2.7 times over

Price Against Return Reduction Not Conversion Lift

Covered lines improve return rates by around 14 points, and returns already sit in the retailer's accounts as shipping and processing cost, so the saving needs no attribution model to defend it. Vendors pricing against measured return improvement close 3.1 times more enterprise deployments than those presenting conversion claims. The measurement uses the retailer's own data, which removes the argument about methodology that has stalled this category for a decade. The effect is strongest in eyewear and beauty and weakest in body-fit apparel, which is worth stating plainly during the sale.
Market Impact: Closes 3.1 times more deployments at large enterprises

Solve Model Generation Rather Than Rendering Quality

Asset production absorbs 58% of deployment spending and coverage sits near 6.8% of assortment, which caps every deployment regardless of visual quality. Vendors generating models from product photography and scanning report customer coverage expanding 4 to 7 times within a year at unchanged budget. Rendering was solved years ago and continues to attract engineering attention it no longer deserves, while the constraint that actually decides outcomes goes comparatively underfunded. Correction effort falls as accuracy improves, rather than staying fixed the way studio labour always has. Rendering keeps attracting engineering attention it stopped deserving some years ago.
Market Impact: Expands catalogue coverage by 4 to 7 times

Sell The Asset Across Every Channel It Serves

A three dimensional model feeds augmented reality, product photography, configurators, and marketplace listings, so charging for it as an augmented reality cost misprices it badly against the value it delivers. Vendors positioning asset production as shared infrastructure across those channels realise contract values 2.3 times higher and face far less budget resistance, because the cost is split across teams rather than loaded onto one experimental line item nobody wants to own. Retailers frequently discover the photography team was rebuilding the same models separately, on a budget nobody had reconciled. Nobody had reconciled it.
Market Impact: Raises enterprise contract values by 2.3 times over

Who Controls the Margin Pool

Concentration is low. Five vendors hold 33% of software revenue, measured consistently on that basis across all participants, and the field divides between face tracking specialists, three dimensional asset platforms, and operations tools that rarely compete with one another directly. Platform holders supply capability inside commerce systems retailers already run, which complicates any assessment of who is actually competing.
Competition currently turns on three things: asset production cost and automation, which decides how far a deployment reaches; measurement of return reduction using the retailer's own data; and operations capability, which reaches budgets consumer experiences never touch. Rendering quality decides almost nothing now, though vendor demonstrations still lead with it. Price decides campaign activations, where budgets are small and renewal is uncertain, and decides considerably less in operations work funded against a labour line somebody already reconciles.

Pressure comes from two directions. Commerce platform providers bundle adequate try-on and placement into systems retailers already pay for. Meanwhile asset production specialists move upward into the experience layer. Rankings will shift toward vendors who made models cheap, since that constraint has capped every deployment in this category for a decade. Rendering specialists hold the weakest position here.
ar-in-retail-market-company-positioning-matrix-1790010960285

Competitive Moat and Risk Dimensions

PERFECT CORP

Moat: Beauty Brand Reference Depth

Long relationships across beauty brands and retailers, with shade libraries and rendering calibrated to real cosmetic products, give the company a position competitors cannot assemble from generic capability. Beauty is also the application where phone hardware genuinely suits the task, which makes it the most defensible consumer category in this market.
PERFECT CORP

Risk: Category Concentration Beyond Beauty

A position anchored in beauty and adjacent appearance categories provides little advantage in furniture placement, garment fit, or store operations, which is where a growing share of budget now goes. Expanding means competing against asset platforms and operations tools built for problems the company has not previously had to solve.
THREEKIT

Moat: Asset Pipeline And Reuse

Capability centred on producing and managing three dimensional assets addresses the constraint that has capped this category, and the same models serve photography, configurators, and listings rather than augmented reality alone. That makes the spending easier for a retailer to justify, since several teams share a cost one team would otherwise carry alone.
THREEKIT

Risk: Platform Bundling From Above

Commerce platform providers increasingly include adequate asset handling and viewing inside systems retailers already pay for, which compresses pricing for standalone providers regardless of quality difference. Competing means demonstrating asset economics at catalogue scale, where the difference is real but harder to show in an evaluation.

Players Tracked

Prominent Players

Perfect Corp
Snap
Threekit
Adobe
Zappar

Other Key Players

Banuba
Wanna
Vntana
Emperia
Obsess
Poplar Studio
Cappasity
Nextech3D.ai
Cart.com
Bold Metrics
3DLOOK
Sayduck
Augment
Ditto
Revery.ai

Recent Developments

JANUARY 2026

Perfect Corp Releases Automated Model Generation From Product Photography

Perfect Corp released automated three dimensional model generation from existing product photography, aimed at retailers whose catalogue coverage had stalled because manual modelling costs made anything beyond best-selling lines unaffordable. Correction is still required on complex products, and the release was positioned against studio cost.
Signal: Vendors are attacking asset cost because coverage rather than experience quality decides deployment outcomes. Coverage is the whole argument.
SEPTEMBER 2025

Snap Acquires Three Dimensional Asset Pipeline Technology Developer

Snap completed an acquisition of a three dimensional asset pipeline developer, adding capture and conversion capability for retail catalogues rather than the rendering and tracking technology the company already held in depth. Rendering and tracking were already strengths, so the purchase addressed the unsolved part.
Signal: Even rendering-strong participants are buying asset production, which says where the remaining problem sits. Rendering was never the gap.
MAY 2025

Threekit Signs Catalogue Conversion Agreement With Furniture Retailer

Threekit entered a multi-year supply agreement converting a furniture retailer's catalogue to three dimensional assets serving placement, photography, and configuration together, with no acquisition or joint venture involved in the arrangement. Cost is shared across merchandising, photography, and marketing budgets rather than loaded onto a single experimental line.
Signal: Retailers fund assets when several teams share the cost rather than one experimental budget line. Shared cost survives review.

What A Deployment Actually Costs

Three input groups dominate cost of revenue. Three dimensional asset creation, covering capture, modelling, and correction, runs 34% to 42%, performed by specialist studios concentrated in Eastern Europe, India, and Southeast Asia. Rendering compute and content delivery take 22% to 30%, with the range reflecting how differently server-rendered and device-rendered deployments consume capacity. Platform engineering adds 20% to 28%, most of it in North America and Western Europe.
Accelerator capacity and pricing tightened through 2024 and into 2025 as demand across generative and rendering workloads absorbed supply, and several vendors described the compute cost effect in their annual reports for those years. SEMI equipment data showed capacity additions arriving behind requirement. Vendors rendering on servers rather than on the customer's device felt it hardest, which has pushed a good deal of processing back onto phones.

The competitive disadvantage mechanism runs through asset production economics rather than software capability. A vendor whose models are built manually cannot reach catalogue coverage at any price a retailer will approve, and cannot fix that quickly because studio capacity scales with people. Exposure varies by vendor type, and manual providers carry the same cost forever.
ar-in-retail-market-cost-volatility-analysis-1790010960481

Automate Model Generation From Existing Product Photography

Manual modelling scales with headcount and caps coverage near a few percent of assortment, which is why deployments stall rather than fail. Generation from photography already held by the retailer improves unit economics with every catalogue processed, and correction effort falls as accuracy improves rather than staying fixed the way studio labour does. Studio capacity scales with people.

Render On The Device Rather Than On Servers

Server rendering consumes accelerator capacity that tightened through two consecutive years and scales directly with session volume rather than with revenue. Device rendering removes that exposure entirely, keeps face tracking data local where data protection rules favour it, and performs adequately for the applications that actually carry commercial weight. Session volume no longer drives cost.

Reuse Assets Across Photography And Configuration Channels

A model built for augmented reality also serves product photography, configurators, and marketplace listings, so charging it against one experimental budget line misprices the work considerably. Positioning assets as shared infrastructure spreads the cost across teams that each gain from it, which is what turns a stalled pilot into a funded programme. Several teams each gain from it.

Portfolio Architecture for Margin Defence

Margin follows how the benefit is proved. Marketing experiences and packaging activations are close to commodity, since the value is asserted rather than measured and budgets move with campaign cycles. Try-on and placement earn better where return reduction is measured in the retailer's own data. Operations tools and asset infrastructure earn most, because both produce savings that appear in accounts somebody already reconciles. Measurability rather than technology decides this entire margin hierarchy.
The tension between volume and premium runs through who signs. A marketing team buys an experience for a season, generates modest revenue, and does not renew when the campaign ends. An operations director funding labour savings, or a merchandising function funding asset infrastructure, buys against an operating budget and stays. The two populations behave nothing alike through a downturn.

High-value pools concentrate where the saving is countable: store labour, return processing, and catalogue asset production shared across several channels. None of those buyers needs an attribution argument. Where the deployment is a seasonal activation with a conversion claim attached, budgets are small, renewal is uncertain, and platform bundling absorbs the work at no incremental charge. Renewal there is genuinely uncertain.

Volume / Commodity-Adjacent

Campaign activations, packaging experiences, and basic try-on sold to marketing budgets on asserted rather than measured benefit. The twelve-point range reflects how much asset production each deployment demands against the modest revenue a seasonal campaign supports.
Gross Margin: 50% to 62%

Premium / Certified

Try-on and placement deployments priced against measured return reduction using the retailer's own transaction data. The ten-point range separates vendors with automated model generation from those carrying manual studio cost on every product they cover.
Gross Margin: 66% to 76%

Sustainability / Regulatory / Next-Generation

Store operations tooling and shared asset infrastructure, both funded from operating budgets against savings that appear in existing accounts. The twelve-point range reflects automation maturity in model generation, which decides unit economics at catalogue scale.
Gross Margin: 72% to 84%
ar-in-retail-market-portfolio-architecture-1790010960983

High-value Sub-segments and Strategic Watch-out

Store Operations Tooling

Highest value and fastest growth at 18.9%, saving staff hours that appear directly in a labour line rather than requiring any attribution argument. The twelve-point range reflects integration depth with the workforce and merchandising systems retailers already operate. Modelling requirements here are a fraction of consumer deployments.
Gross Margin: 74% to 86%

Automated Asset Generation

High value infrastructure attacking the constraint that caps every deployment, since production absorbs 58% of spending today. The twelve-point range reflects generation accuracy, which decides how much manual correction each processed catalogue still requires afterwards. Unit economics improve with every catalogue processed. Manual providers carry the same cost forever.
Gross Margin: 68% to 80%

Return Measured Try-On

Volume core priced against return improvement of roughly 14 points on covered lines, measured in data the retailer already holds. The ten-point range separates vendors with automated model production from those carrying manual studio cost throughout. Attribution arguments no longer arise in these evaluations. Category effects vary widely.
Gross Margin: 64% to 74%

Campaign Activation Experiences

The strategic watch-out. Benefit is asserted rather than measured, budgets follow campaign cycles, and commerce platforms bundle adequate capability into systems retailers already pay for. The twelve-point range reflects asset demand rather than anything defensible. Renewal after a campaign ends is genuinely uncertain. Platform bundling absorbs this work steadily.
Gross Margin: 46% to 58%

How This Revenue Recurs

Two revenue shapes coexist and behave differently. Asset production is largely a one-off cost per product, recurring only as catalogues refresh, which is frequent in apparel and rare in furniture. Software subscription recurs annually and expands with catalogue coverage rather than with traffic. Vendors pricing on sessions rather than coverage found their revenue moved with retail seasonality instead of with the value they delivered.
Attachment depth follows the asset library rather than the software. A retailer whose catalogue models sit inside one vendor's pipeline, feeding photography and configuration as well as augmented reality, cannot change without rebuilding assets that cost 58% of the original deployment. A retailer running a hosted try-on widget on a handful of lines has no attachment at all and drops it after a season.

The buyer has shifted from marketing toward operations and merchandising. Early deployments were funded by marketing teams testing an idea, with campaign budgets and no renewal obligation. Store operations directors funding labour savings and merchandising functions funding shared asset infrastructure now sign the larger contracts. Vendors still presenting engagement metrics are addressing the participant with the smallest budget and the shortest memory.
ar-in-retail-market-end-use-penetration-index-1790010961479

Where This Market Rewards

These are among the four positions where our research anticipates prominent divergence between winners and laggards over the coming forecast period. Each is grounded in the demand model, the regulatory perimeter, and the announced capacity pipeline.
01 / COUNTABLE BENEFIT SELLING

Savings beat lift in every finance review

Store operations grows at 18.9% because planogram compliance and picking assistance save hours that land in a labour line, while a decade of conversion lift claims produced pilots rather than rollouts. Vendors leading with operations report sales cycles 2.7 times shorter and far better pilot-to-rollout conversion rates. It also demands a fraction of the modelling work, so useful coverage arrives inside a quarter rather than stalling on backlog, which is why approvals moved to operating budgets entirely, where campaign budgets never reached in the first place.
02 / ASSET COST ATTACK

Rendering was solved, models were not

Asset production absorbs 58% of deployment spending and catalogue coverage sits near 6.8%, which caps outcomes regardless of how good the visual experience looks in a demonstration. Vendors generating models from product photography report customer coverage expanding 4 to 7 times within a year at unchanged budget. Rendering continues attracting engineering attention it stopped deserving, while the constraint that decides everything remains comparatively underfunded, and studio capacity scales with headcount rather than with software, which is why automation changes the economics permanently.
03 / RETURN DATA MEASUREMENT

Use the retailer's numbers, not yours

Covered lines improve return rates by roughly 14 points, and returns already sit in the accounts as shipping and processing cost, so no attribution model is required to defend the spending. Vendors pricing against measured return improvement close 3.1 times more enterprise deployments than those presenting conversion claims. Using the retailer's own transaction data removes the methodology argument that stalled this category for a decade, and the effect is worth stating honestly by category, since eyewear behaves nothing like body-fit apparel.
04 / SHARED ASSET POSITIONING

One model serves four different channels

A three dimensional model feeds augmented reality, photography, configurators, and marketplace listings, so charging it entirely against an experimental augmented reality line misprices the work badly. Vendors positioning assets as shared infrastructure realise contract values 2.3 times higher and meet far less budget resistance. The cost is split across teams that each benefit rather than loaded onto one line nobody wants to defend, and photography teams are frequently rebuilding the same models anyway on a budget nobody has reconciled against this one.

Engagement Snapshot From the Field

A live engagement with an industry participant carrying material or product regulatory and market exposure ahead of a defining policy shift, showing how our research translates into a defensible multi-year portfolio strategy.
MARKET MINDS ADVISORY · CLIENT ENGAGEMENT SUMMARY
AR in Retail Producer Strategic Portfolio Review and Transition Roadmap 2026·Investment Scenario on AR in Retail Exposure Evaluation 2025-26
CLIENT PROFILE
A multi-category retailer operating across seven countries with roughly 62,000 active products, of which around 3,100 carried three dimensional models. Augmented reality try-on and placement had been deployed two years earlier at an annual platform cost near USD 340,000 (client-reported, unverified by MMA), funded entirely from the marketing budget. The photography team maintained a separate model library nobody had reconciled against it.
STRATEGIC CHALLENGE
Marketing wanted to cancel the deployment because engagement had plateaued and conversion attribution remained contested after two years of argument. Merchandising suspected the problem was coverage rather than the technology, but nobody had measured what happened on covered products against comparable uncovered ones. The argument had run for two full budget cycles without any measurement behind it.
MMA APPROACH
MMA compared return rates and sales on covered products against matched uncovered lines over eighteen months, separated the effect by category, and priced the cost of extending coverage using both manual studio production and automated generation from the retailer's existing product photography. Duplicate modelling effort across photography and merchandising was quantified separately.
KEY FINDINGS
  1. Return rates on covered lines ran 16 points below matched uncovered products in eyewear and 11 points below in furniture, but showed no measurable difference in body-fit apparel.
  2. Coverage stood at 5% of assortment, and the products modelled had been chosen by the agency for visual appeal rather than by return rate or margin contribution.
  3. Extending coverage manually to the top 15,000 products would have cost roughly 4.4 times the annual platform fee, which nobody had ever put in front of the board.
  4. The same models were being rebuilt separately by the photography team for catalogue imagery, duplicating cost across two budgets that had never spoken to each other.
CLIENT PROFILE
A multi-category retailer operating across seven countries with roughly 62,000 active products, of which around 3,100 carried three dimensional models. Augmented reality try-on and placement had been deployed two years earlier at an annual platform cost near USD 340,000 (client-reported, unverified by MMA), funded entirely from the marketing budget. The photography team maintained a separate model library nobody had reconciled against it.
STRATEGIC CHALLENGE
Marketing wanted to cancel the deployment because engagement had plateaued and conversion attribution remained contested after two years of argument. Merchandising suspected the problem was coverage rather than the technology, but nobody had measured what happened on covered products against comparable uncovered ones. The argument had run for two full budget cycles without any measurement behind it.
MMA APPROACH
MMA compared return rates and sales on covered products against matched uncovered lines over eighteen months, separated the effect by category, and priced the cost of extending coverage using both manual studio production and automated generation from the retailer's existing product photography. Duplicate modelling effort across photography and merchandising was quantified separately.
KEY FINDINGS
  1. Return rates on covered lines ran 16 points below matched uncovered products in eyewear and 11 points below in furniture, but showed no measurable difference in body-fit apparel.
  2. Coverage stood at 5% of assortment, and the products modelled had been chosen by the agency for visual appeal rather than by return rate or margin contribution.
  3. Extending coverage manually to the top 15,000 products would have cost roughly 4.4 times the annual platform fee, which nobody had ever put in front of the board.
  4. The same models were being rebuilt separately by the photography team for catalogue imagery, duplicating cost across two budgets that had never spoken to each other.
RECOMMENDED STRATEGY
Phase 1: Phase one: reselect covered products by return rate and margin rather than visual appeal, and move funding from marketing to the returns cost line. Phase 2: Phase two: adopt automated model generation from existing photography, extending coverage toward the top selling lines at a fraction of studio cost. Phase 3: Phase three: merge asset production with the photography team so one model serves imagery, placement, and marketplace listings together. One budget funds it.
OUTCOME
Coverage rose from 5% to 34% of assortment within three quarters at 60% of the previously quoted cost (client-reported, unverified by MMA). Group return rate fell 3.8 points overall. The deployment moved permanently out of marketing and into merchandising operations. Duplicate modelling across photography and merchandising ended entirely.

Frequently Asked Questions

Foundational context covering the market sizes, CAGR, scope, country, region and competition that inform every finding below. This section is provided to cover basics and most often pre-purchase conversations, answered from the MMA Primary Research Dataset.

What is the current size of the AR in Retail Market?

The market was worth USD 3.2 billion in 2025 and reaches USD 3.6 billion in 2026. Value covers augmented reality software and services for retail, excluding hardware.

How large will the AR in Retail Market be by 2036?

MMA forecasts USD 11.8 billion by 2036, an increase of USD 8.2 billion across the forecast period. That represents 3.28 times the 2026 base of USD 3.6 billion.

What is the CAGR for the AR in Retail Market 2026 to 2036?

The base case compound annual growth rate is 12.6%, with a bull case at 13.8% and a bear case at 11.4%. Historical growth from 2020 to 2025 ran at 11.2%.

Which segment is growing fastest?

Store operations and planogram assistance grows at 18.9%, half again the market rate of 12.6%. It saves staff hours that appear directly in a labour line.

Who are the major companies in the AR in Retail Market?

Perfect Corp, Snap, Threekit, Adobe, and Zappar lead, together holding 33% of software revenue. Face tracking specialists and asset platforms rarely compete against each other directly.

Which country is growing fastest?

China grows at 17.2%, supported by beauty and fashion commerce at a scale nothing else approaches and by live selling formats that use try-on inside the sales moment.

Report Segmentation Architecture

The full report scope spans multiple orthogonal segmentation dimensions, with cross-tabulated demand data provided for each dimension pair. Coverage extends further to regional breakdowns, trend trajectories, and the competitive detail needed to support segment-level decision-making.

By Deployment Application

  • Face-Tracked Virtual Try-On
  • Body and Garment Fit Visualisation
  • Furniture and Space Placement
  • Packaging and Marketing Experiences
  • In-Store Navigation and Shelf Overlay
  • Store Operations and Planogram Assistance

By End-Use Industry

  • Beauty and Personal Care
  • Apparel and Footwear
  • Eyewear and Accessories
  • Furniture and Home Improvement
  • Grocery and General Merchandise
  • Consumer Electronics and Toys

By Commercial Dimension

  • Enterprise Retailer Subscription
  • Brand Direct Deployment
  • Commerce Platform Bundled Supply
  • Agency and Integrator Channel
  • Asset Production Service Contract
  • Marketplace Seller Self-Service

By Region

  • East Asia
  • North America
  • Western Europe
  • South Asia and Pacific
  • Latin America
  • Middle East and Africa
  • Eastern Europe

Scope, Methodology, and Coverage

Every figure in this report is reproducible from documented input assumptions. The scope below maps the historical period, the forecast horizon, the segmentation dimensions, and the countries covered, alongside the underlying primary and qualitative methodology.
Historical Period
2020 to 2025
Forecast Period
2026 to 2036
Base Year
2025 (USD billions; MMA Primary Research Dataset, September 2026)
Market Definition
This market covers augmented reality software and services deployed for retail, including face-tracked virtual try-on, body and garment fit visualisation, furniture and space placement, packaging and marketing experiences, in-store navigation and shelf overlay, and store operations and planogram assistance. It excludes headset and device hardware, virtual reality applications, commerce platforms, computer vision for loss prevention or checkout-free stores, digital signage, and standalone photography services.
Quantitative Units
USD billions, software subscription and asset service revenue
Segmentation Dimensions
Deployment application, end-use industry, commercial dimension, region
Regions Covered
East Asia, North America, Western Europe, South Asia and Pacific, Latin America, Middle East and Africa, Eastern Europe
Countries Covered
China, Japan, South Korea, Taiwan, United States, Canada, Mexico, United Kingdom, France, Germany, Italy, Spain, Netherlands, Sweden, Switzerland, India, Indonesia, Singapore, Vietnam, Australia, Brazil, Mexico, Colombia, Chile, Saudi Arabia, United Arab Emirates, Nigeria, South Africa, Poland, Czechia
Key Companies Profiled
Perfect Corp, Snap, Threekit, Adobe, Zappar, Banuba, Wanna, Vntana, Emperia, Obsess, Poplar Studio, Cappasity, Nextech3D.ai, Cart.com, Bold Metrics, 3DLOOK, Sayduck, Augment, Ditto, Revery.ai
Quantitative Methodology
Primary survey, n=3,800 respondents, Q4 2025, six countries; demand-side model with trade association cross-validation
Qualitative Methodology
47 expert interviews, Q4 2025; applied to validate demand model assumptions, identify emerging dynamics, and assess competitive positioning
Report Format
PDF and XLSX data workbook (Word format preview document)
Publisher
Market Minds Advisory
Report Code
MMA-2026-TEC-771
Published
September 2026
Contact
sales@marketmindsadvisory.com | www.marketmindsadvisory.com

Purchase the full AR in Retail Market Report (2026 to 2036).

The full report sizes the retail augmented reality market across six deployment applications, seven regions, and thirty countries, with forecasts to 2036 under base, bull, and bear cases. It examines why asset production rather than experience quality caps every deployment, how return reduction replaced conversion lift as the funded benefit, and why the fastest growing application faces no customer at all. Competitive analysis covers twenty participants evaluated consistently on software revenue, with detailed treatment of asset economics and measurement practice. Cost structure, margin architecture, and regional commerce drivers are analysed throughout. Primary research includes 3,800 survey responses and 47 expert interviews.
Six deployment applications sized and forecast separately
Twenty participants evaluated on software and asset revenue
Regional commerce and asset pipeline maturity across seven geographies
Margin architecture by application and benefit measurability
Catalogue coverage and asset cost benchmarking across retail deployments
Return reduction effects measured by product category and fit dependency

Built For The People Who Decide

From boardroom strategy to bench-side execution, this report is read cover-to-cover by leaders shaping the next decade of their industry, turning demand scenarios, market dynamics and valuation benchmarks into decisions.
CXOs/ Presidents/ VPs/ Managers
M&A and Corporate Development
Strategy Teams and R&D Heads
Procurement and Product Directors
Regulatory and Compliance Leaders
Investor Relations and Equity Analysts