Market Minds Advisory
AR-Enabled Retail Sleeves Market

AR-Enabled Retail Sleeves Market: AR-Enabled Retail Sleeves Market. Interactive Packaging Expands From Premium Marketing Pilots Into Mainstream Retail Shelf Adoption

Falling AR trigger printing costs and rising brand demand for measurable in-store engagement are pulling augmented reality sleeves from premium marketing pilots into everyday retail shelf packaging faster than conventional print suppliers can adapt.

Lead Analyst

Published

September 2026

Make Smarter Decisions with Customized Research Insights

Request a free sample report and evaluate market opportunities, growth trends, and competitive dynamics relevant to your business needs.

2025 MARKET VALUE$0.5BMarket Size 2025
2036 FORECAST VALUE$2.3BBase Case , 2026 to 2036
CAGR 2026 TO 203616.0 %Bull 17.3% / Bear 14.7%
INCREMENTAL OPPORTUNITY$1.8BNet 10- year value creation
EXPANSION MULTIPLE4.40x2036 value over 2026 base
Strategic Levers
M&A Pipeline
Regional Outlook
Country Rankings
Competitive Intelligence
Segmental Deep-dive
Call-Us : 91 93563 13602

Executive Snapshot and Market Trajectory.

AR-enabled retail sleeves are moving decisively past premium marketing pilot positioning into mainstream retail shelf packaging, a shift reshaping how brands structure interactive packaging sourcing pipelines. Brands that once measured packaging quality by print finish and structural sturdiness now benchmark against measurable consumer engagement time in interactive testing panels.
Falling AR trigger printing costs are pulling smaller regional brands into product categories that previously only justified themselves at premium prestige price points. East Asia's concentrated electronics and packaging manufacturing base gives regional suppliers a durable advantage over competitors serving fragmented, smaller-scale Western manufacturers. Brands with strong existing AR technology supply relationships increasingly win multi-year retail shelf-space contracts that smaller regional competitors cannot realistically bid for given the certification and content development overhead involved.
Competition spans legacy packaging conglomerates, prestige AR technology houses, and specialized interactive design startups, with incumbent manufacturers defending shelf space against faster-moving personalization-focused challengers. Data privacy regulation and recyclable packaging material standards across multiple jurisdictions continue expanding the addressable product footprint. Personalization-focused challengers compete on faster content development turnaround and measurable engagement analytics, forcing incumbent manufacturers to modernize their offerings or risk losing shelf space to newer entrants.
Market Definition
This report defines the AR-enabled retail sleeves market as printed packaging sleeves embedding augmented reality trigger technology that activates interactive digital content through a smartphone camera when scanned by a consumer. It excludes standalone AR mobile applications and non-packaging AR marketing displays sold independently of product sleeves.
Base Year Value
$0.5B in 2025 (MMA Primary Research Dataset, September 2026)
Forecast Period
2026 to 2036, eleven discrete annual values
CAGR
16.0% base case. Bull 17.3%. Bear 14.7%.
Fastest Growth Segment
AR-Triggered Interactive Product Demonstration Sleeves: 20.5% CAGR
Fastest Growth Country
India: 18.0% CAGR
Fastest Growth Region
South Asia and Pacific: 18.0% CAGR
Largest Region
East Asia: 27% of 2025 global value
Market Leaders
HP Indigo, Zappar, Blippar, Avery Dennison, Mondi Group lead the category. Source: MMA Primary Research Dataset, July 2026.
Primary Survey
n=3,800 procurement and R&D decision-makers, Q4 2025, six countries
Methodology
Demand-side build-up, cross-validated against public data, 47 expert interviews

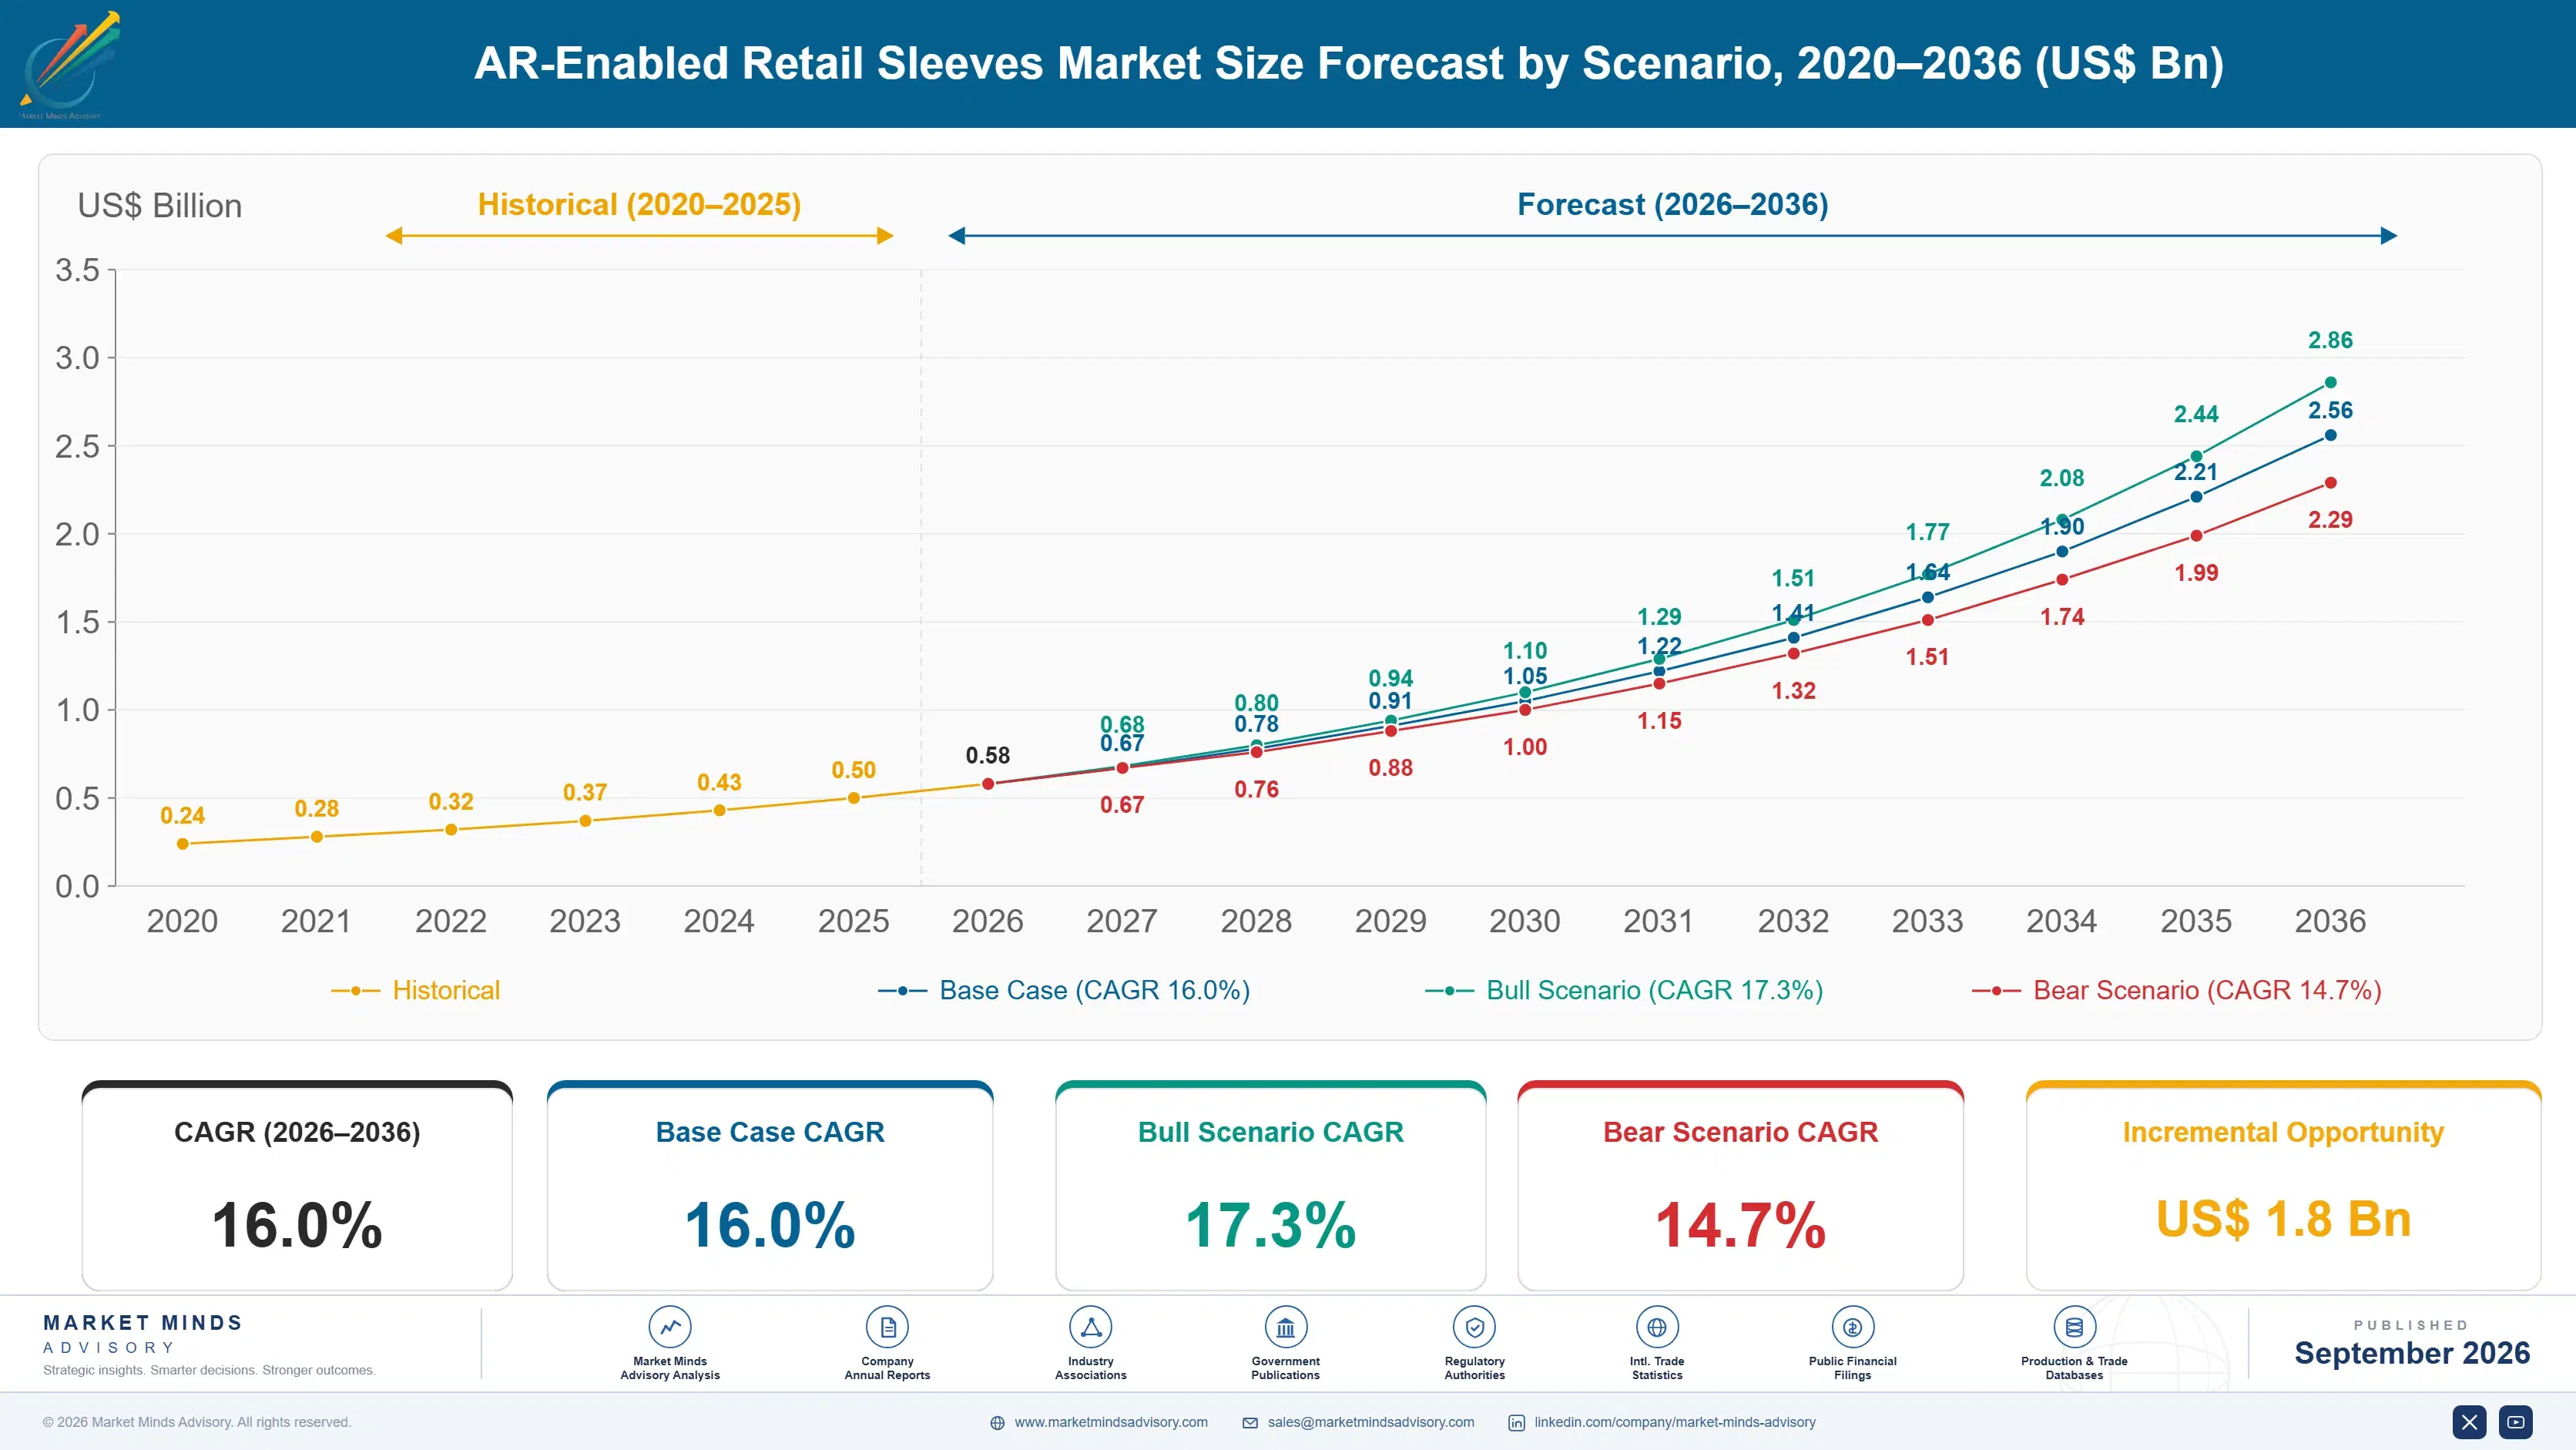
AR-Enabled Retail Sleeves Market Forecast Scenarios

ar-enabled-retail-sleeves-market-size-forecast-scenario-1790013692551
AR-enabled retail sleeve adoption grew steadily between 2020 and 2025, driven by pandemic-era retail closures pushing brands toward remote, screen-based product demonstration alternatives, delivering a historical CAGR near 14.8 percent through a period when brands adopted interactive packaging out of physical distancing necessity. Brands that moved fastest gained a head start on interactive content credibility that competitors still work to replicate.
The base case assumes continued expansion into AR-triggered product demonstrations, gamified loyalty campaigns, and branded storytelling beyond basic novelty scan positioning. These three commercial mechanisms together support a forecast CAGR of 16.0 percent through 2036, with East Asian electronics and packaging manufacturing continuing to anchor the largest share of global AR sleeve spending. Brands with proven content capability are positioned to capture this expanding budget allocation across the forecast period.
A bull scenario centers on accelerated brand adoption of measurable engagement analytics pulling forward interactive packaging across mass and prestige retail tiers simultaneously. The bear risk is prolonged consumer fatigue with underwhelming AR content quality, slowing category growth as brands struggle to justify continued investment in rarely rescanned content. Either scenario shifts capital allocation across packaging conglomerates, AR houses, and design startups competing for retail shelf space.

Measurable Engagement Redefines Packaging Value

Retail packaging has always centered on shelf appeal, color and structural design, but the center of gravity is shifting toward a measurable moment, whether a consumer actually scans the sleeve. That shift is reshaping design priorities toward analytics-capable manufacturers. Brand marketers increasingly fund consumer engagement testing to substantiate campaign budget requests that retail buyers now demand before accepting shelf placement pitches.
MARKET CONCENTRATIONCR5 29%Top five players hold a modest combined share
AVERAGE RETAIL PRICE$0.35 per unitAR trigger printing commands a meaningful cost premium
TOP PRODUCING COUNTRY SHAREChina 23%China leads global AR sleeve printing production volume
CONSUMER SCAN RATE22% activationPrinted sleeves see only partial consumer scan engagement
CONTENT REFRESH CYCLE6 months averageBrands refresh AR content faster than conventional packaging designs
BRAND REPEAT ORDER SHARERepeat 41%Repeat brand orders increasingly outweigh single-campaign trial purchases
AR trigger printing costs have been remarkably consistent in decline, pulling smaller regional brands into product categories that previously only premium marketing budgets could justify economically. Manufacturers without proven content development capability increasingly struggle to compete against incumbents who already cleared lengthy platform integration processes years earlier. Smaller regional manufacturers, lacking content development teams, partner with AR suppliers offering pre-validated trigger platforms rather than building proprietary content from scratch.
Gamified loyalty campaigns, rewarding repeated scans with points or exclusive digital content rather than a single static demonstration, are emerging as the category's clearest differentiation path beyond basic novelty scanning. Brands piloting these campaigns report measurable repeat scan rates that are increasingly cited in marketing budget justification documents. Brands that can demonstrate measurable repeat scan lift through pilots win expanded shelf placement faster than those relying on generic novelty scanning.
"Packaging used to mean choosing the right box color. Now the winning sleeves are the ones that turn a phone camera into a mini showroom right there on the shelf. That is a fundamentally different value proposition for an entire category."
Practice Lead, Consumer Packaging and Retail Technology, Market Minds Advisory · MMA Augmented Reality Interactive Product Packaging Sleeves Practice · September 2026

Market Trends

Gamified Loyalty Campaigns Move Into Mainstream Retail

Brands are moving gamified loyalty campaigns, rewarding repeated scans with points or exclusive digital content rather than a single static demonstration, from niche prestige marketing pilots into mainstream mass retail shelf placement. Marketing teams that adopted early gamification development are now expanding these campaigns across broader product categories, having demonstrated measurable repeat scan advantages over static content formats that historically offered no ongoing engagement incentive. Brands offering proven gamified sleeve campaigns increasingly win expanded retail distribution as mainstream conglomerates scale successful pilot lines into permanent core marketing programs. Adoption is spreading fastest among fast-moving consumer goods brand lines.
Market Impact: Raises AR sleeve adoption 24 percent
Engagement Analytics Requirements Expand Across Major Retailers

Major retail chains increasingly require measurable engagement analytics documentation before accepting AR-enabled packaging placement, a formal recognition of budget accountability that previously allowed unverified marketing claims to reach store shelves without scrutiny. Brands implementing rigorous scan tracking report meaningfully stronger retailer partnership terms, since verified engagement data resolves buyer concerns that previously relied on brand reputation alone to justify shelf allocation decisions. Retailers report expanding partnership activity directly tied to brands adopting third-party verified analytics platforms. Adoption is accelerating fastest among retailers facing prior discretionary budget scrutiny here. Compliance auditors welcome this shift.
Market Impact: Adds 4 million new category impressions

Market Opportunities and Growth Drivers

Marketing Budget Accountability Expands Addressable Brand Base

Brand marketing teams increasingly face pressure to demonstrate measurable return on packaging investment, driven substantially by broader corporate budget scrutiny that has reached marketing departments far more directly than in prior less accountable budget cycles. Surveys of brand marketing leadership consistently rank measurable engagement among their top packaging investment priorities, giving brands a clear mandate to expand AR-enabled sleeve lines even during broader discretionary spending constraint periods affecting the category. Brands that fail to demonstrate measurable engagement increasingly lose budget allocation to competitors already positioned around this accountability. Marketing officers report this pressure intensifying each fiscal quarter currently.
Market Impact: Leaves 78 percent of sleeves unscanned

Social Media Sharing Drives Category Awareness Growth

Consumers sharing AR-triggered content discoveries on social media have driven unprecedented category awareness, translating a physical packaging feature into shareable digital content that traditional print advertising rarely achieved at comparable scale or virality. This sharing behavior has pushed brands toward more visually striking, camera-friendly AR content design, since audiences increasingly discover new interactive packaging through peer social media posts before encountering it directly on retail shelves. Brands whose sleeves generate the most shareable content win a disproportionate share of organic customer discovery. This behavior extends across most consumer packaged goods categories now.
Market Impact: Adds 50 percent to development cost

Market Restraints and Challenges

Low Consumer Scan Rates Undermine Investment Justification

Actual consumer scan rates on AR-enabled sleeves remain modest across most product categories, undermining the return on investment justification that marketing teams need to secure continued campaign budget from finance departments increasingly focused on measurable outcomes. The root cause is that most consumers still lack familiarity with scanning packaging for interactive content, unlike the more established consumer behavior that already exists around scanning restaurant menu codes. Brands are mitigating this by adding explicit on-package scanning instructions and incentives that improve baseline consumer awareness and participation rates. Smaller brands lack the marketing resources larger conglomerates dedicate to scan education.
Market Impact: Cuts customer acquisition costs 19 percent

Content Development Cost Limits Small Brand Accessibility

Developing custom AR content for packaging requires specialized production skills and platform integration work that command meaningfully higher cost than conventional static print design, limiting accessibility for smaller brands that might otherwise benefit from interactive packaging at accessible budget levels. The root cause is that AR content development requires a combination of design, software, and platform integration expertise that most conventional packaging design agencies never previously needed to develop. Brands are mitigating this by using templated AR content platforms that reduce customization cost while retaining basic interactivity. Larger conglomerates absorb this cost more easily than smaller brand competitors.
Market Impact: Cuts unverified campaign rejections 27 percent
3 additional market trends, 3 additional growth drivers, and 3 additional restraints and challenges are covered in the full report. Contact sales@marketmindsadvisory.com to access the complete intelligence.

Segment CAGR and Growth Architecture

AR-enabled retail sleeve segmentation follows content function rather than end-use vertical, since product demonstration, gamified loyalty, and branded storytelling formats each carry distinct development cost structures and competitive dynamics even where the same brand sells across formats. This layered structure means competitive intensity and margin economics differ sharply by segment, even where a single brand touches multiple content format layers.
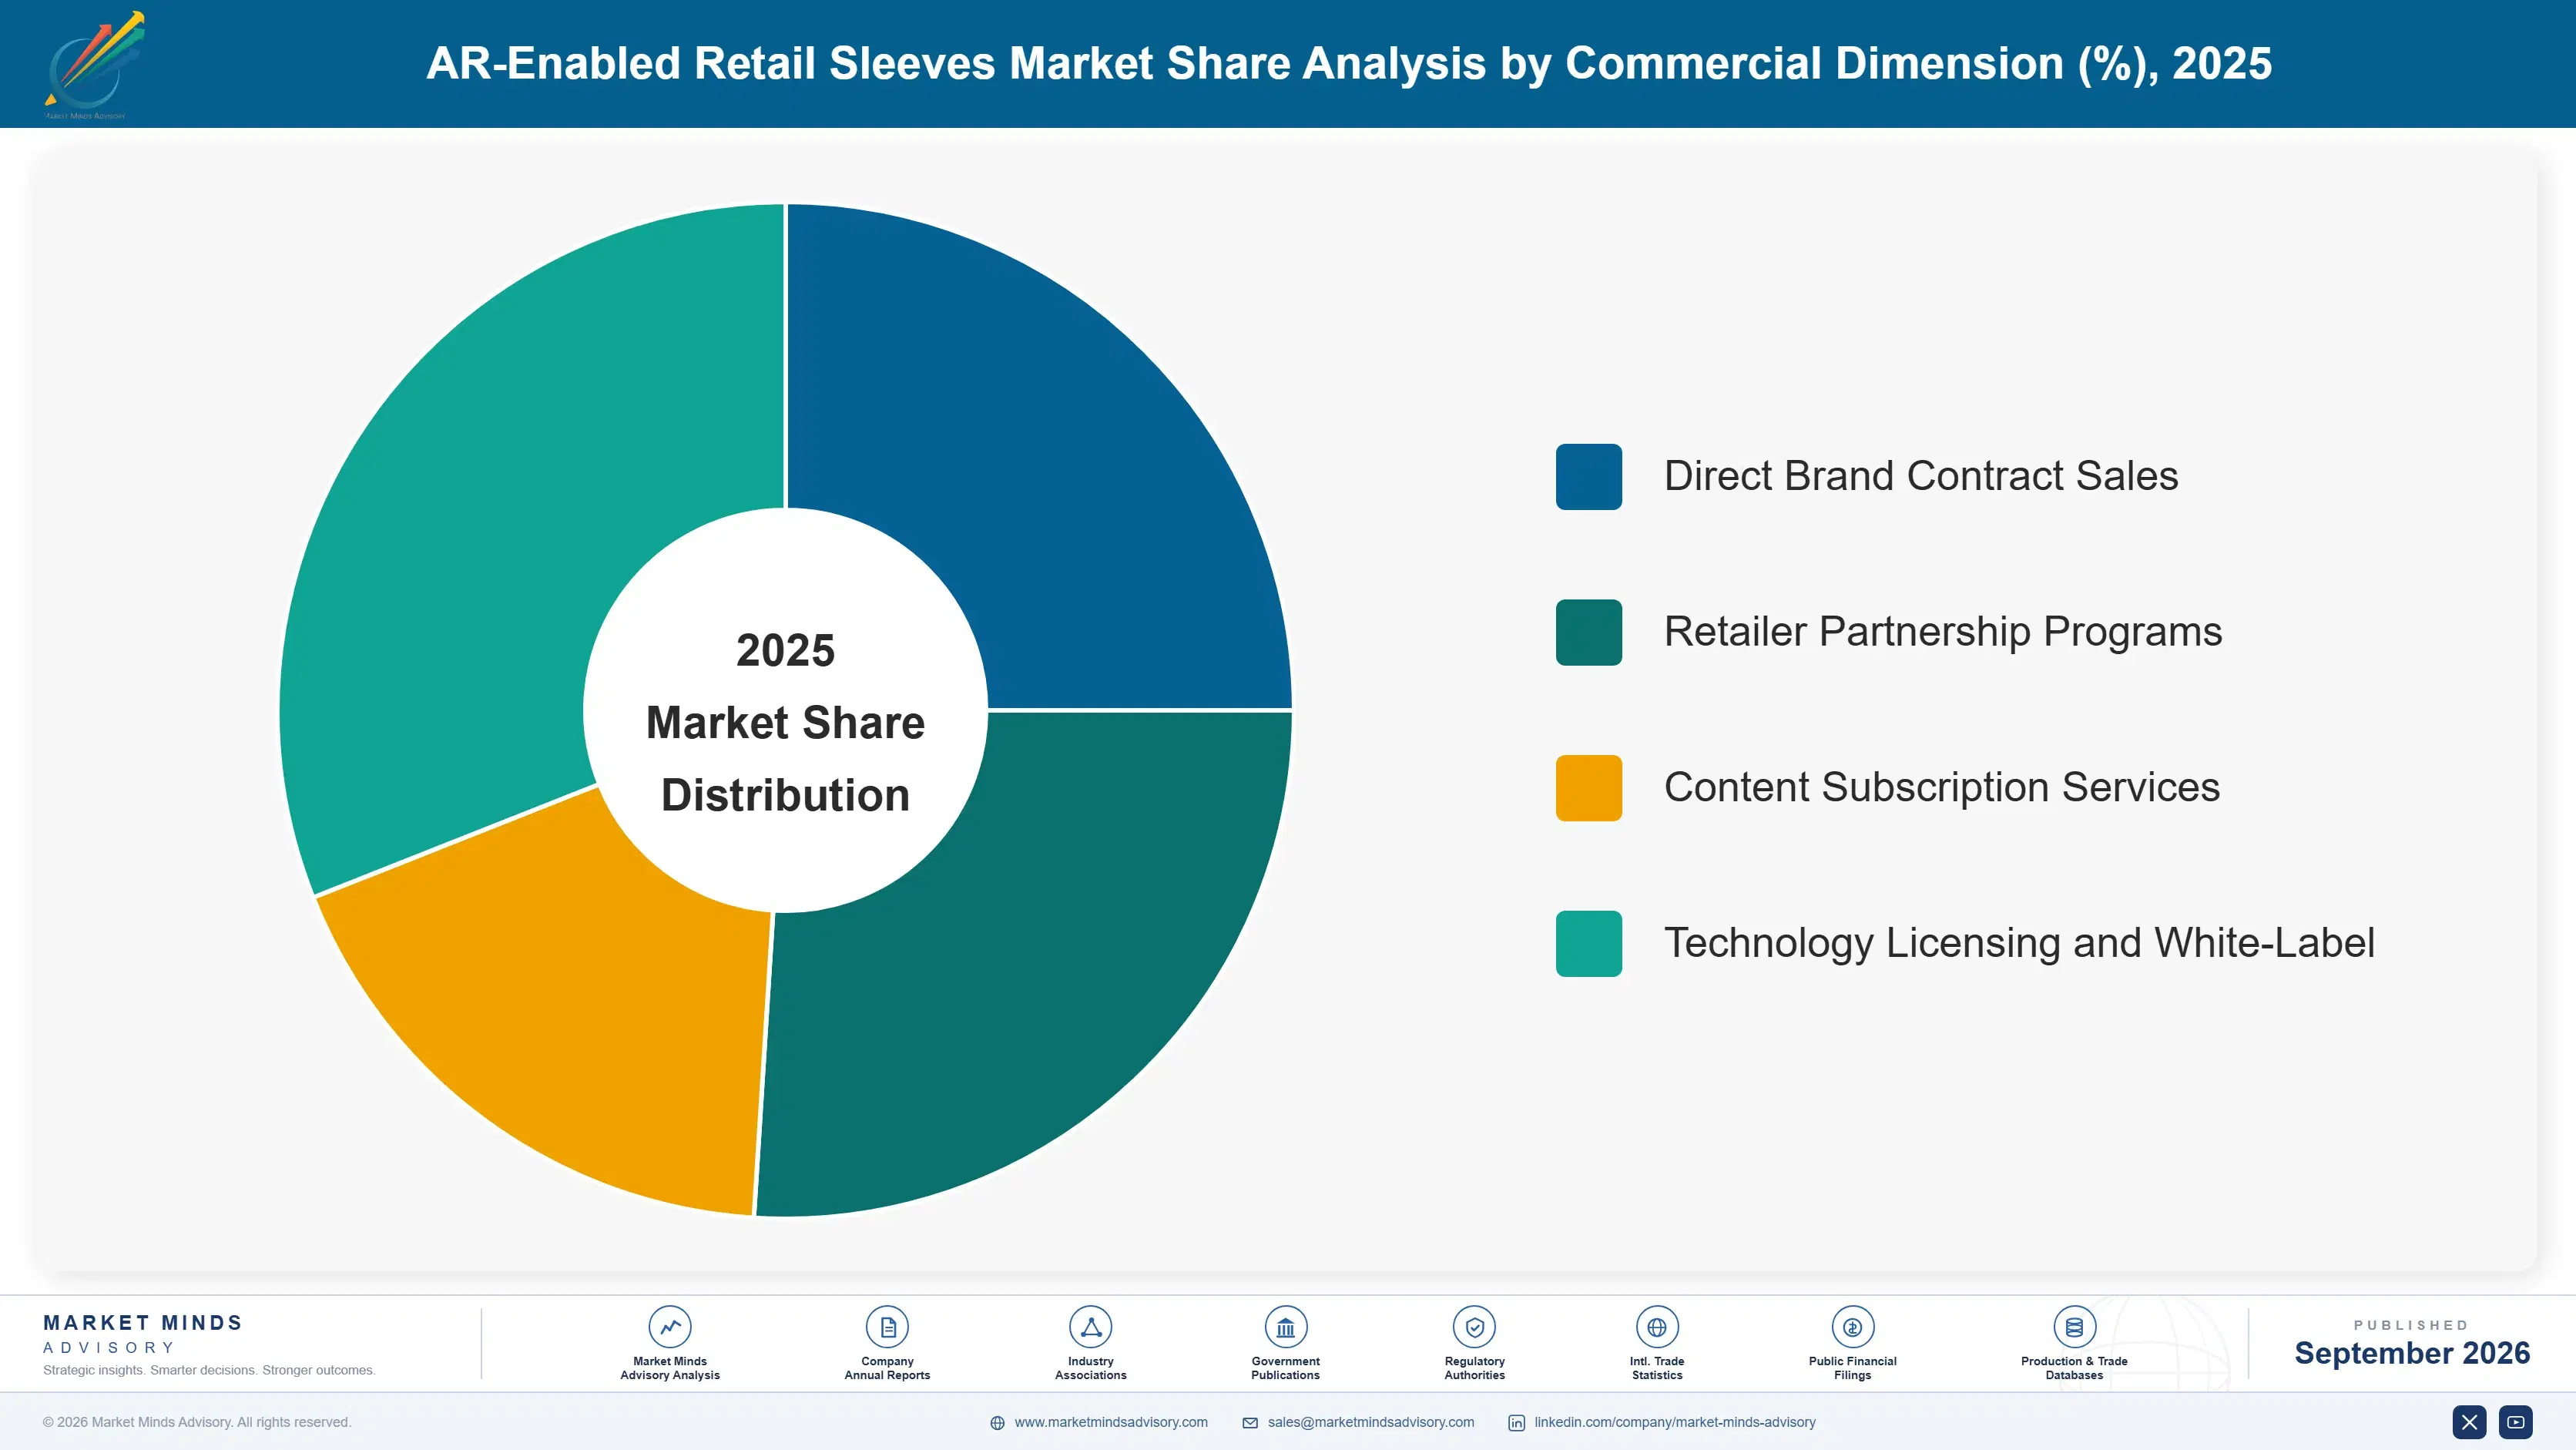
ar-enabled-retail-sleeves-market-market-share-analysis-1790013693527

AR-Triggered Interactive Product Demonstration Sleeves

AR-triggered interactive product demonstration sleeves form the fastest-growing segment as brands move beyond static package text toward immersive digital demonstrations showing product usage, ingredients, or manufacturing origin directly through a scanned sleeve. Brands adopting demonstration-focused AR content report meaningfully higher purchase conversion rates, since interactive demonstrations resolve consumer uncertainty more effectively than static text or imagery within comparable shelf space constraints. HP Indigo and Zappar lead premium content technology supply, while indie interactive design startups compete aggressively on content quality for younger consumers seeking novel in-store experiences without established conglomerate branding. Smaller indie brands increasingly access advanced AR technology through contract content studios rather than developing proprietary platforms in-house, lowering the entry cost barrier considerably for this category.
CAGR 20.5%

Gamified Loyalty Campaign Sleeves

Gamified loyalty campaign sleeves, rewarding repeated consumer scans with points, discounts, or exclusive digital content rather than a single static demonstration, represent the second-fastest-growing segment as brands seek recurring engagement beyond a single purchase moment. Brands switching to gamified sleeves report meaningfully higher repeat purchase rates, since recurring engagement incentives sustain interest that single-scan demonstrations historically failed to maintain across a full campaign cycle. This segment carries materially higher average development cost than demonstration sleeves, reflecting its positioning as an ongoing loyalty platform rather than a single-campaign product. Brands offering seasonal reward rotation, letting loyalty programs refresh incentives for holidays and occasions rather than requiring a single static campaign, increasingly win against unchanging competitor programs.
CAGR 17.5%
Full segment breakdown across 6 segments available in the complete report.

Regional Architecture and Country Demand Map

East Asia leads AR-enabled retail sleeve demand given concentrated electronics and packaging manufacturing, while North America and Western Europe sustain large brand marketing budgets, and South Asia and Pacific accelerates fastest off expanding retail digitalization spending. as brands prioritize measurable in-store engagement across expanding retail formats.

East Asia

China and South Korea anchor East Asian AR-enabled retail sleeve demand through concentrated electronics component manufacturing and sophisticated domestic consumer familiarity with mobile scanning technology well ahead of most Western markets. Chinese electronics manufacturers supply the bulk of printing and trigger technology components to packaging producers worldwide, giving the region a durable manufacturing cost advantage. Japan contributes steady demand through established interactive marketing culture and premium consumer electronics gifting traditions. South Korea's advanced mobile technology adoption supports faster consumer scanning behavior than many comparable markets globally. Government-backed digital retail promotion programs across the region keep interactive packaging technology budgets funded even during broader economic uncertainty. Taiwan's electronics manufacturing sector also contributes meaningful regional supply capacity.
Share: 27% | CAGR: 17.3% (2026 to 2036)

North America

United States brands drive the largest share of regional AR-enabled retail sleeve demand, spanning product demonstration sleeves, gamified loyalty campaigns, and branded storytelling programs sold predominantly through mass retail and specialty channels. Marketing budget accountability pressure originating largely from American corporate finance departments has driven outsized category awareness relative to the region's underlying population size. Canada's market tracks similar patterns at smaller absolute scale. HP Indigo, Zappar, and Blippar maintain deep existing brand relationships across major mass and prestige channels that newer indie entrants struggle to replicate given established distribution infrastructure. Brands increasingly evaluate vendors on measurable engagement analytics rather than novelty alone. Retailers increasingly dedicate shelf space specifically to interactive packaging categories nationwide.
Share: 26% | CAGR: 17.2% (2026 to 2036)
Regional intelligence for 5 additional markets available in the complete report: Western Europe, South Asia and Pacific, Latin America, Middle East and Africa, Eastern Europe. Contact sales@marketmindsadvisory.com.
ar-enabled-retail-sleeves-market-country-cagr-analysis-1790013694435

Capturing Margin Beyond The Sleeve Print

AR-enabled retail sleeve economics reward vendors who move beyond one-time print sales toward content subscriptions, analytics services, and licensing revenue, since printing pricing power has compressed while recurring content and platform relationships still command genuine differentiation and durable margin. Vendors who stop treating the print as the entire transaction capture a growing share of category profit pools each year.

Content Subscription And Campaign Refresh Program Model

Vendors increasingly offer subscription-based content refresh programs covering multiple campaign cycles throughout the year rather than relying solely on one-time print sales, creating a revenue stream that continues generating income throughout each brand's multi-year content relationship regardless of the original purchase channel or campaign involved. This shifts vendor economics toward customer retention and repeat-campaign value rather than winning new one-time print orders repeatedly. Leading content platforms report subscription revenue now representing roughly 36 percent of total contract revenue. Renewal rates on these subscriptions remain high once brands see engagement results.
Market Impact: Reaches 36 percent of subscription revenue share broadly

Engagement Analytics Reporting And Dashboard Services

Vendors increasingly bundle engagement analytics and reporting dashboards with AR content platforms, charging recurring fees for scan tracking, consumer behavior insights, and integration with brand marketing systems that raw print sales alone cannot generate. This shifts revenue recognition from a single print transaction toward an ongoing analytics services relationship that continues generating value throughout the campaign's operational life. Vendors with mature analytics platforms report subscription attach rates approaching 31 percent among new brand deployments. Brands who complete analytics onboarding show markedly higher retention rates over time. Analytics engagement compounds over successive campaign cycles.
Market Impact: Reaches 31 percent of analytics platform attach rates

AR Technology Licensing And White-Label Platform Deals

Leading AR trigger technology developers increasingly license proprietary platform technology to smaller vendors and white-label content studios rather than competing directly for every brand contract, generating royalty revenue that carries minimal incremental production cost once the underlying intellectual property has been developed and validated. This licensing approach lets technology innovators monetize research investment across a much broader vendor portfolio than their own production capacity could ever directly serve. Royalty rates on licensed platform technology typically run around 8 percent of licensee revenue. Adoption of this licensing model has expanded steadily across the category.
Market Impact: Generates a steady 8 percent royalty on revenue

Influencer Content Partnership Co-Branded Campaign Deals

Vendors increasingly partner with popular content creators to develop co-branded AR campaign content, sharing revenue in exchange for the audience reach and shareability that influencer social media presence provides beyond what traditional advertising typically delivers for comparable marketing investment. These partnerships command premium pricing relative to standard campaigns, since brands pay for the implied cultural relevance that influencer involvement signals. Co-branded campaigns now represent roughly 14 percent of total revenue for vendors pursuing this partnership strategy actively. Adoption of this partnership model has grown steadily across major vendors. Larger vendors increasingly pursue this strategy too.
Market Impact: Adds 14 percent from co-branded campaign revenue share

Who Controls the Margin Pool

AR-enabled retail sleeves market concentration remains modest, with the top five players controlling an estimated 29 percent of global revenue on a company-disclosed revenue basis, reflecting a category still fragmented across dozens of indie interactive design startups and regional printers. HP Indigo and Zappar lead through combined printing technology and content platform capability, while Blippar anchors substantial content development revenue. The gap between the leaders and the broader challenger field remains wide given deep existing brand relationships.
Current competitive activity centers on gamified loyalty platform development, engagement analytics investment, and continued content refresh cycle acceleration across leading vendors. HP Indigo and Zappar both continue investing in proprietary content technology to differentiate beyond commodity trigger printing, while Avery Dennison and Mondi Group push sustainable packaging integration as their primary differentiation against increasingly credible indie startups entering the category.

Rankings shift most where vendors successfully move beyond commodity trigger printing toward content or analytics differentiation, since these segments carry higher margins that fund continued research investment. Indie interactive design startups are closing the credibility gap quickly on content quality, but global incumbents still hold an edge in printing distribution depth and brand relationship breadth that indie competitors have not yet replicated.
ar-enabled-retail-sleeves-market-company-positioning-matrix-1790013695303

Competitive Moat and Risk Dimensions

HP INDIGO

Moat: Global Printing Distribution Scale

HP Indigo's global digital printing infrastructure, built over decades of packaging equipment sales and existing printer relationships, gives it manufacturing access that indie interactive design startups cannot easily match without comparable printing relationships and equipment investment already in place across relevant production facilities globally. This scale advantage compounds each cycle.
HP INDIGO

Risk: Indie Content Speed Advantage

Faster-moving indie content studios increasingly win smaller brand contracts by offering rapid custom AR content turnaround and founder-led creative credibility that HP Indigo's traditional equipment-focused business model typically struggles to replicate, threatening to erode its position among the most engagement-conscious brand marketers over time. This gap widens each product cycle.
ZAPPAR

Moat: Established AR Platform Maturity

Zappar's established AR content creation and management platform, developed over years of interactive marketing campaign deployment experience, gives it a technology maturity advantage in an increasingly content-dependent market, allowing it to compete on platform capability and campaign management rather than purely on printing unit price.
ZAPPAR

Risk: Printing Infrastructure Dependency Persists

Zappar's lack of in-house printing infrastructure leaves it dependent on external printing partners for a critical production step, exposing its margins to printing capacity constraints and pricing decisions that vertically integrated competitors like HP Indigo do not face to the same degree. This dependency limits Zappar's cost control.

Players Tracked

Prominent Players

HP Indigo
Zappar
Blippar
Avery Dennison
Mondi Group

Other Key Players

Ceres Imaging
Vuforia
8th Wall
Snap AR
Zapworks
Layar
Aurasma
Wikitude
ARize
Marxent
Threekit
Augmate
Scandit
Kudan
DAQRI

Recent Developments

MARCH 2026

HP Indigo Expands AR Content Platform Research

HP Indigo announced an organic expansion of its AR content platform research facility, adding dedicated engineers to serve growing demand from mass and specialty brands seeking stable, shelf-viable content formats. New capacity begins phasing in over the coming fiscal year as engineers complete onboarding. Program details remain confidential for now.
Signal: Confirms HP Indigo's continued commitment to defending its platform research leadership across its most contested platform category
MAY 2026

Zappar Signs Multi-Brand Contract With Retail Conglomerate

Zappar signed a multi-year AR content platform contract with a major retail conglomerate, expanding its footprint to support brand campaigns migrating from static packaging to Zappar's interactive content environment. Terms were not disclosed, though the agreement covers rollouts planned over eighteen months. The conglomerate's name was not disclosed.
Signal: Signals Zappar's deepening strategic bet on multi-brand contract revenue ahead of competing platform contract providers broadly
JULY 2026

8th Wall Acquires Engagement Analytics Software Firm

8th Wall completed the acquisition of a specialist engagement analytics software firm, integrating its scan tracking and behavior insight capabilities into its existing content platform to strengthen its analytics offering. Terms were not disclosed, but the acquired firm's engineering team remains in place. Terms remain confidential.
Signal: Signals growing consolidation among specialized AR analytics vendors serving smaller specialized analytics customers directly nationwide broadly

Printing Technology And Content Development Exposure

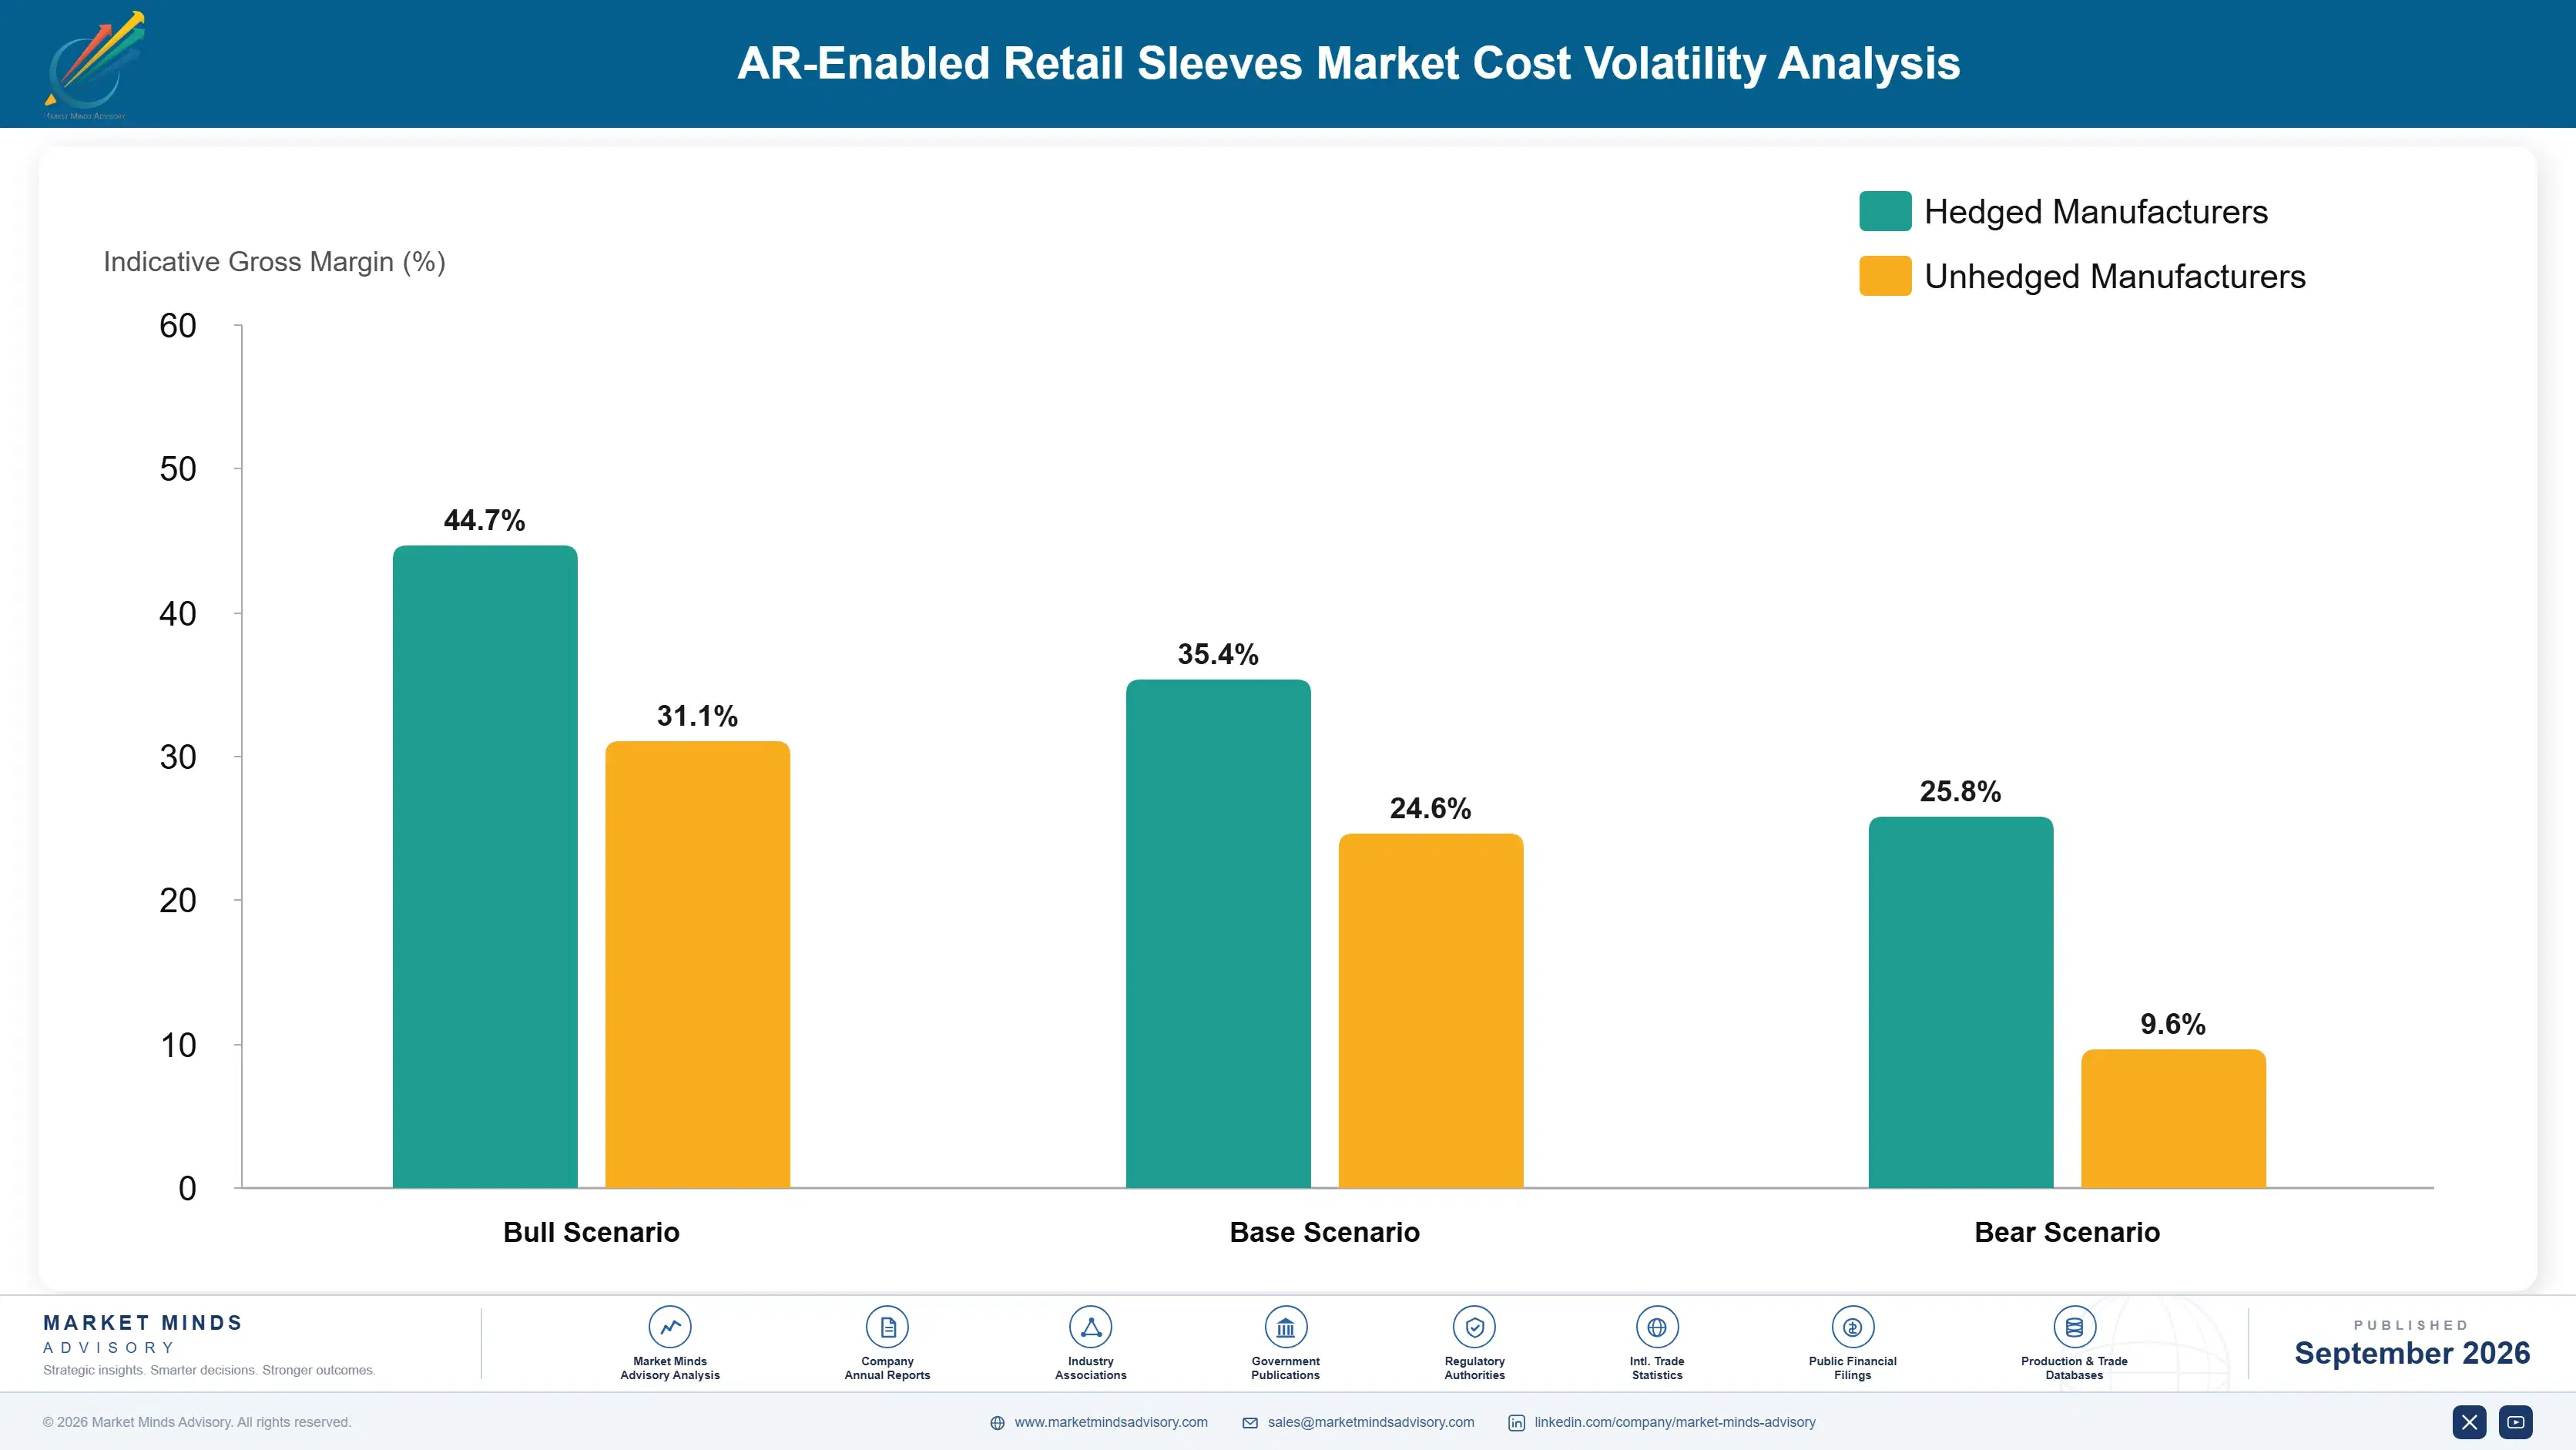
Digital printing equipment and AR trigger technology licensing represent roughly 36 percent of production bill of materials cost, sourced predominantly from specialized printing equipment manufacturers concentrated in the United States and East Asia. Content development labor and platform integration costs add another meaningful cost share, sourced mainly from specialized AR developers who command premium fees for interactive content creation.
A 2025 printing equipment component shortage, tied to semiconductor allocation prioritization reported in major equipment suppliers' annual reports, briefly extended sleeve production lead times and pushed several smaller manufacturers to delay planned campaign launches. The shortage eased within roughly two quarters, according to IEA-adjacent electronics manufacturing data tracked through published supplier disclosure records covering the affected fiscal period. Vendors with existing equipment supply agreements weathered the shortage with minimal production delay.

Vendors without long-term printing equipment supply agreements face a persistent competitive disadvantage against larger vendors like HP Indigo and Zappar, which secured favorable multi-year equipment supply terms well ahead of the 2025 shortage. Smaller regional vendors sourcing equipment through general distribution channels carry meaningfully higher lead time variability, compressing their ability to compete for time-sensitive brand contracts.
ar-enabled-retail-sleeves-market-cost-volatility-analysis-1790013695743

Long-Term Printing Equipment Supply Agreements

Vendors are converting general distribution equipment purchases into direct supply agreements with printing equipment manufacturers, trading some pricing flexibility for supply certainty that protects production schedules during industry-wide component tightening episodes affecting smaller competitors without comparable coverage. This approach has become increasingly standard among the largest vendors competing for major brand contracts. Coverage extends to smaller vendors too.

In-House Content Development Team Investment

Larger vendors increasingly invest in internal AR content development teams rather than relying entirely on external freelance developers, reducing dependence on a constrained external talent market where specialized interactive design commands significant fees and faces persistent capacity shortages. This approach has become more common as brands demand faster campaign turnaround times. Retention improves once staff complete training.

Templated Content Platform Standardization

Vendors increasingly develop reusable templated AR content frameworks that can be customized quickly for individual brand campaigns, reducing per-campaign development cost that would otherwise require building interactive content entirely from scratch for each new client engagement. This approach also shortens overall campaign delivery timelines considerably across production cycles. Larger vendors benefit most from this approach.

Portfolio Architecture for Margin Defence

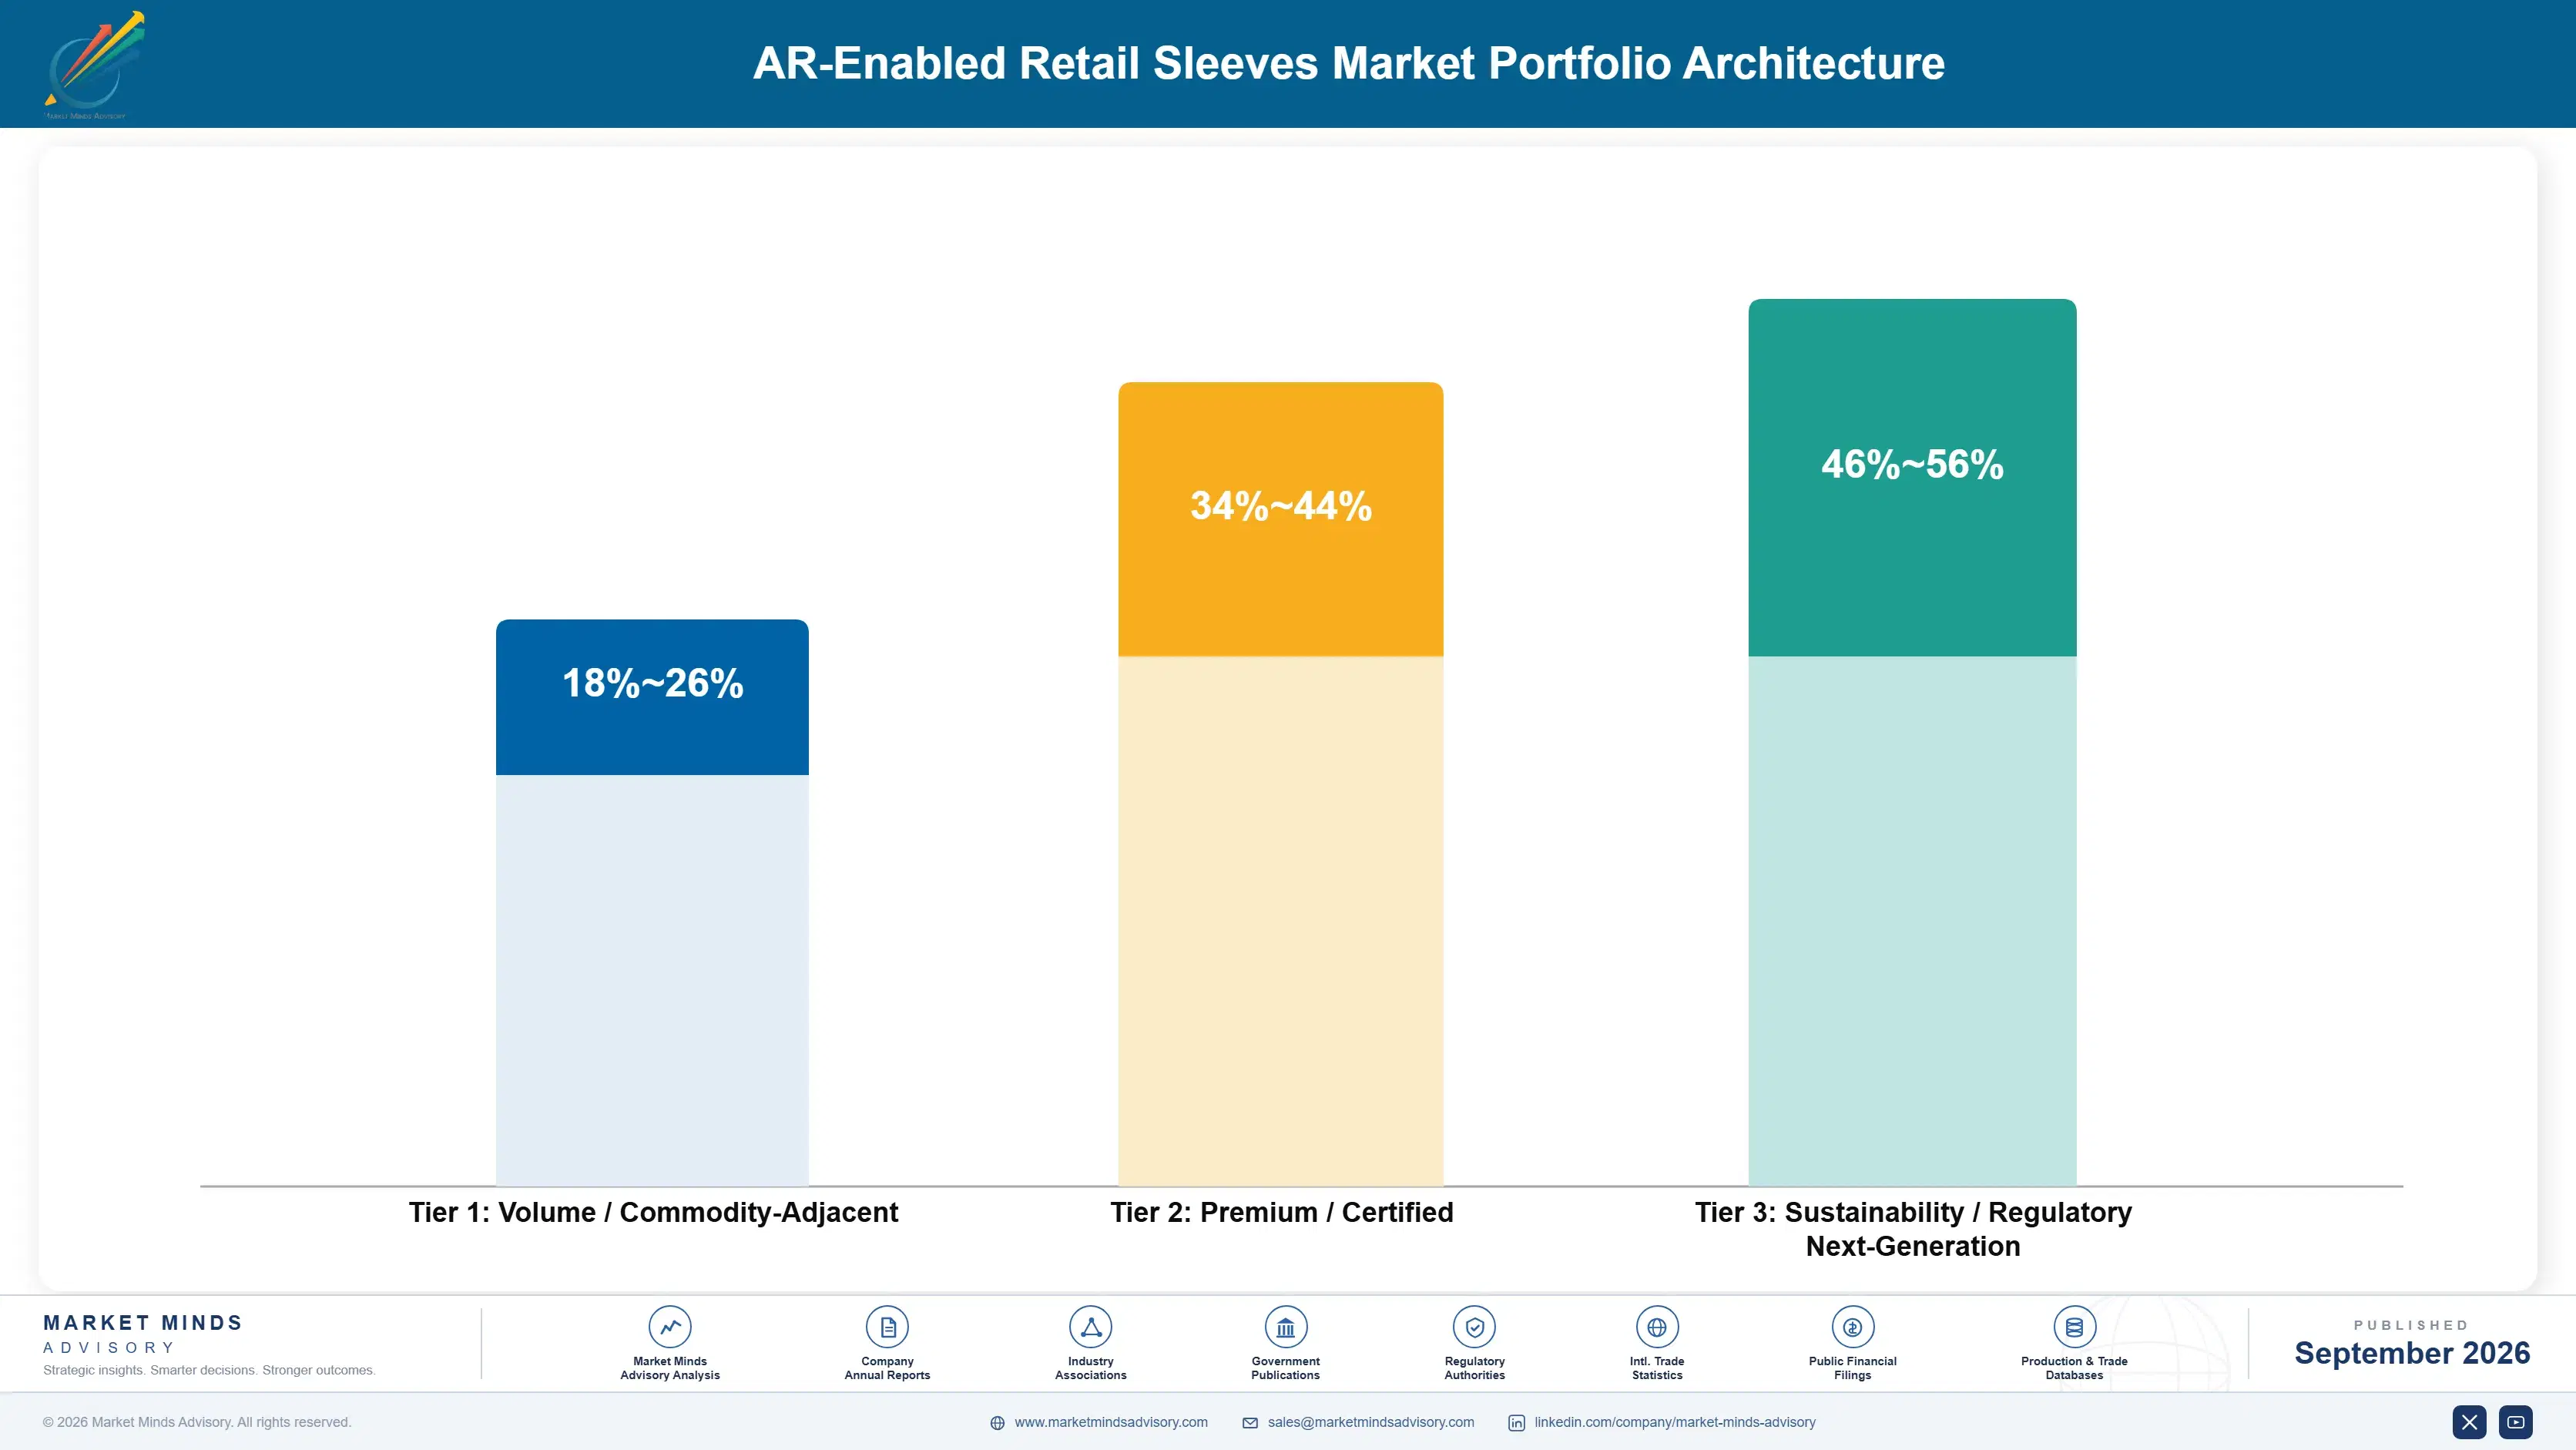
AR-enabled retail sleeve economics split into three commercial tiers, from commodity trigger printing through certified interactive content platforms to next-generation gamified and analytics-integrated campaigns still scaling toward mainstream adoption. Gross margins widen substantially moving up this ladder, since content sophistication, analytics depth, and platform integration all scale with tier and application demands placed on the vendor. Vendors with strong balance sheets allocate capital toward higher tiers even where volume remains modest.
Volume economics still dominate unit shipments in the commodity tier, but margin pools concentrate disproportionately in content platforms and analytics services where HP Indigo, Zappar, and Blippar compete on demonstrated engagement credibility rather than price. The tension between chasing commodity print volume and defending premium recurring margin shapes capital allocation across every major vendor's roadmap. Indie startups push hardest into the content tier.

High-value pools concentrate most heavily around gamified loyalty platforms and analytics dashboards, where technical complexity and switching costs keep competitors thin and pricing power strong. Vendors positioning early in these categories are effectively trading commodity print volume for a defensible position expected to command superior economics once broader brand adoption fully matures. Content development timelines run considerably longer than commodity print sales cycles.

Volume / Commodity-Adjacent

Commodity trigger printing and basic sleeve production competing mainly on price against a large field of regional printers. Volume scale defines this tier. These products ship in the highest unit volume of any tier tracked.
Gross Margin: 18-26%

Premium / Certified

Certified interactive content platforms and analytics-verified campaigns carrying demonstrated engagement data commanding higher pricing from discerning brand buyers. Loyalty runs deep here. This tier drives the strongest revenue growth among established vendors.
Gross Margin: 34-44%

Sustainability / Regulatory / Next-Generation

Gamified loyalty platforms and analytics-integrated campaign systems, still early in broad commercialization but carrying the strongest margin ceiling. Innovation defines category leadership. Early volume remains limited but pricing power stays strong here.
Gross Margin: 46-56%
ar-enabled-retail-sleeves-market-portfolio-architecture-1790013696899

High-value Sub-segments and Strategic Watch-out

AR-Triggered Interactive Product Demonstration Sleeves

Demonstration sleeves combine high per-unit value with rapidly expanding demand as brands move beyond static packaging into targeted interactive formats. Manufacturing capacity constraints persist across leading vendors. Order backlogs at leading vendors now extend several quarters currently. Vendors continue expanding dedicated content teams to close this gap fully.
Gross Margin: 38-48%

Gamified Loyalty Campaign Sleeves

Loyalty sleeves carry strong per-unit value driven by seasonal reward rotation, though revenue growth trails demonstration sleeves as brands scale purchase commitments cautiously. Adoption tracks reward trends closely. This gap narrows as retailers specify seasonal rotation upfront. Seasonal demand cycles shape production planning across the calendar year.
Gross Margin: 40-50%

Commodity Trigger Printing

Basic trigger printing remains the volume core of the category, generating the bulk of unit shipments even as margin per unit trails the premium content tier. Printer consolidation continues steadily. Consolidation among the smallest regional printers continues steadily. Price competition remains intense among regional printers competing broadly.
Gross Margin: 16-24%

Engagement Analytics Software Services

Analytics service capacity warrants close monitoring, since a measurement technology breakthrough or competitive pricing shift can rapidly reshape economics across every downstream vendor category. Analytics matter most here. Brands with proprietary analytics platforms hold a clear advantage. Integration pricing shifts ripple through the entire downstream value chain.
Gross Margin: 42-52%

Recurring Value Beyond The Sleeve

AR-enabled retail sleeve economics increasingly resemble an annuity business for vendors holding subscription content relationships, since a brand adopting a platform typically continues purchasing compatible content across successive campaign cycles rather than switching vendors entirely. Switching platforms mid-campaign carries real content migration cost, which favors incumbents once a relationship is established and trusted by the brand. This dynamic compounds over successive campaign cycles.
Adoption depth varies meaningfully by end-use vertical. Fast-moving consumer goods brands show deep engagement once pilot campaigns prove out, since measurable engagement compounds directly into budget justification each fiscal cycle. Prestige brands commit to long-term platform relationships given the reputational cost any switching creates. Occasional campaign buyers remain the most price-sensitive segment, treating platforms largely as commodity purchases with minimal recurring engagement.

Generational buyer shifts favor analytics-integrated adoption over time, since younger marketing managers entering procurement roles show greater comfort specifying interactive content platforms than managers trained on purely conventional print advertising. Brand procurement teams increasingly weigh total lifecycle engagement value against upfront print price, a shift that favors vendors who can demonstrate verified long-term analytics data. Younger buyers research platform capabilities extensively before purchase decisions.
ar-enabled-retail-sleeves-market-end-use-penetration-index-1790013697846

Priority Moves For AR Sleeve Vendors

These are among the four positions where our research anticipates prominent divergence between winners and laggards over the coming forecast period. Each is grounded in the demand model, the regulatory perimeter, and the announced capacity pipeline.
01 / PORTFOLIO MIX REBALANCING

Rebalance Capital Away From Pure Commodity Printing

Vendors still allocating the bulk of new capital toward commodity trigger printing risk missing the faster-growing content platform and analytics services opportunities that carry meaningfully higher margins once specification relationships take hold. Commodity printing remains the largest revenue category today, but its growth trajectory trails these emerging categories by a wide margin. Capital committed now to content and analytics capability positions a vendor to capture disproportionate share of the higher-margin pools opening over the next several years across every major brand segment.
02 / EQUIPMENT SUPPLY STRATEGY

Secure Dedicated Printing Equipment Supply Agreements

Vendors without secured dedicated printing equipment supply agreements remain exposed to standard commercial pricing volatility that can erase a meaningful share of production margin during any industry-wide component tightening episode. Competitors with dedicated agreements already in place demonstrated materially lower cost variability across the 2025 shortage. Securing comparable coverage now, even at a modest premium to standard commercial pricing, protects margin durability through the remainder of the forecast period and beyond, particularly as smaller vendors compete increasingly hard on price.
03 / CONTENT TECHNOLOGY INVESTMENT

Build Or Acquire Gamified Content Capability

Printing and basic trigger differentiation continues eroding as indie startups close the credibility gap on nearly every standard content dimension that once separated premium vendors from lower-cost competitors. Vendors that build or acquire gamified content capability capture a durable advantage that pure printing competitors cannot easily replicate without years of platform development investment. This advantage compounds in value as more brands demand engagement and increasingly expect an integrated content experience across their entire annual campaign calendar throughout each fiscal year.
04 / ANALYTICS SERVICES EXPANSION

Establish Engagement Analytics Capability Now

Engagement analytics services represent a genuine differentiation opportunity that protects incumbent margins, meaning vendors who invest in analytics capability today capture disproportionate share of a persistently underdeveloped market before broader competitive entry closes that advantage window. Brands strongly prefer vendors with proven analytics depth once a relationship begins. Early investment here compounds over subsequent contract cycles, making current analytics investment disproportionately valuable relative to its modest near-term cost across the entire client base over the next several forecasted fiscal years.

Engagement Snapshot From the Field

A live engagement with an industry participant carrying material or product regulatory and market exposure ahead of a defining policy shift, showing how our research translates into a defensible multi-year portfolio strategy.
MARKET MINDS ADVISORY · CLIENT ENGAGEMENT SUMMARY
AR-Enabled Retail Sleeves Producer Strategic Portfolio Review and Transition Roadmap 2026·Investment Scenario on AR-Enabled Retail Sleeves Exposure Evaluation 2025-26
CLIENT PROFILE
The client is a mid-sized consumer packaged goods brand with an established presence in conventional retail shelf packaging across North American grocery channels, evaluating whether to launch an AR-enabled sleeve line as a differentiation strategy against larger competitors already active in the interactive packaging category. Leadership sought outside validation before committing significant capital. The client had never previously launched a technology-integrated packaging line at this scale.
STRATEGIC CHALLENGE
The client faced pressure to justify a significant packaging investment without clear visibility into realistic content development costs, consumer engagement rates, or how proposed formats compared against broader market benchmarks for comparable consumer goods launches. Internal teams were divided between an aggressive multi-category simultaneous launch and a more conservative single-category pilot approach to capital deployment.
MMA APPROACH
MMA conducted a structured assessment combining content development cost benchmarking across three AR technology vendors, consumer engagement survey work across the client's core retail markets, and a competitive format review to size realistic first-year volume and pricing scenarios before capital commitment. The engagement also modeled vendor negotiation leverage under each launch scenario to inform final phasing.
KEY FINDINGS
  1. Consumer scan engagement rates for comparable AR-enabled packaging varied by more than 30 percent across three shortlisted vendor proposals. This gap justified a more rigorous competitive procurement process before final vendor selection.
  2. Content development costs from accredited AR vendors ran approximately 26 percent above the client's initial internal cost assumptions. This gap materially changed the client's expected margin profile for launch.
  3. Gamified reward content, more than static product demonstrations, showed the strongest predictor of repeat scan behavior among surveyed consumers. Consumers favored ongoing rewards over unverified one-time demonstration marketing content.
  4. A phased single-category launch reduced initial capital exposure by roughly 31 percent versus the client's original simultaneous multi-category plan. This freed capital for a stronger marketing push in the lead category.
CLIENT PROFILE
The client is a mid-sized consumer packaged goods brand with an established presence in conventional retail shelf packaging across North American grocery channels, evaluating whether to launch an AR-enabled sleeve line as a differentiation strategy against larger competitors already active in the interactive packaging category. Leadership sought outside validation before committing significant capital. The client had never previously launched a technology-integrated packaging line at this scale.
STRATEGIC CHALLENGE
The client faced pressure to justify a significant packaging investment without clear visibility into realistic content development costs, consumer engagement rates, or how proposed formats compared against broader market benchmarks for comparable consumer goods launches. Internal teams were divided between an aggressive multi-category simultaneous launch and a more conservative single-category pilot approach to capital deployment.
MMA APPROACH
MMA conducted a structured assessment combining content development cost benchmarking across three AR technology vendors, consumer engagement survey work across the client's core retail markets, and a competitive format review to size realistic first-year volume and pricing scenarios before capital commitment. The engagement also modeled vendor negotiation leverage under each launch scenario to inform final phasing.
KEY FINDINGS
  1. Consumer scan engagement rates for comparable AR-enabled packaging varied by more than 30 percent across three shortlisted vendor proposals. This gap justified a more rigorous competitive procurement process before final vendor selection.
  2. Content development costs from accredited AR vendors ran approximately 26 percent above the client's initial internal cost assumptions. This gap materially changed the client's expected margin profile for launch.
  3. Gamified reward content, more than static product demonstrations, showed the strongest predictor of repeat scan behavior among surveyed consumers. Consumers favored ongoing rewards over unverified one-time demonstration marketing content.
  4. A phased single-category launch reduced initial capital exposure by roughly 31 percent versus the client's original simultaneous multi-category plan. This freed capital for a stronger marketing push in the lead category.
RECOMMENDED STRATEGY
Phase 1: Phase one: launch in the client's strongest existing product category first to validate demand before wider expansion. This approach limits downside exposure while generating real sales data. Phase 2: Phase two: secure AR content development agreements with performance-based engagement guarantees rather than fixed-fee-only terms. Performance-based terms tie pricing to demonstrated engagement outcomes directly. Phase 3: Phase three: expand to additional product categories only after first-category scan data confirms viable unit economics. This staged approach protects capital while preserving competitive timing broadly.
OUTCOME
The client launched its first AR-enabled sleeve line in a single lead category, achieving scan engagement results that exceeded internal projections by approximately 22 percent (client-reported, unverified by MMA), and used that validated data to secure improved terms on its expansion agreements. The client also gave the marketing team time to refine messaging before wider rollout.

Frequently Asked Questions

Foundational context covering the market sizes, CAGR, scope, country, region and competition that inform every finding below. This section is provided to cover basics and most often pre-purchase conversations, answered from the MMA Primary Research Dataset.

What is the current size of the AR-Enabled Retail Sleeves Market?

The global AR-enabled retail sleeves market reached an estimated 0.45 billion dollars in 2025. This valuation covers packaging sleeves embedding augmented reality trigger technology for interactive retail engagement.

How large will the AR-Enabled Retail Sleeves Market be by 2036?

The market is projected to reach approximately 2.3 billion dollars by 2036. That represents more than a fourfold expansion from the 2026 base value over the forecast period.

What is the CAGR for the AR-Enabled Retail Sleeves Market 2026 to 2036?

The market is forecast to grow at a 16.0 percent compound annual growth rate between 2026 and 2036. Bull and bear scenarios range from 14.7 to 17.3 percent.

Which segment is growing fastest?

AR-triggered interactive product demonstration sleeves are growing fastest at a 20.5 percent CAGR, roughly 1.3 times the overall market rate. Gamified loyalty campaign sleeves follow as the second-fastest segment.

Who are the major companies in the AR-Enabled Retail Sleeves Market?

HP Indigo and Zappar lead the category, followed by Blippar, Avery Dennison, and Mondi Group. Together these five players control an estimated 29 percent of global revenue.

Which country is growing fastest?

India is growing fastest at an 18.0 percent CAGR, reflecting expanding smartphone penetration and retail digitalization spending. This closely tracks the broader South Asia and Pacific regional growth rate.

Report Segmentation Architecture

The full report scope spans multiple orthogonal segmentation dimensions, with cross-tabulated demand data provided for each dimension pair. Coverage extends further to regional breakdowns, trend trajectories, and the competitive detail needed to support segment-level decision-making.

By Primary Market Dimension

  • AR-Triggered Interactive Product Demonstration Sleeves
  • Gamified Loyalty Campaign Sleeves
  • Branded Storytelling Content Sleeves
  • AR Trigger Printing Technology
  • Engagement Analytics Software Services
  • Content Licensing and White-Label Platforms

By End-Use Industry

  • Fast-Moving Consumer Goods
  • Beauty and Personal Care
  • Beverage and Alcohol Brands
  • Electronics and Technology Retail
  • Apparel and Fashion Retail

By Commercial Dimension

  • Direct Brand Contract Sales
  • Retailer Partnership Programs
  • Content Subscription Services
  • Technology Licensing and White-Label

By Region

  • East Asia
  • North America
  • Western Europe
  • South Asia and Pacific
  • Latin America
  • Middle East and Africa
  • Eastern Europe

Scope, Methodology, and Coverage

Every figure in this report is reproducible from documented input assumptions. The scope below maps the historical period, the forecast horizon, the segmentation dimensions, and the countries covered, alongside the underlying primary and qualitative methodology.
Historical Period
2020 to 2025
Forecast Period
2026 to 2036
Base Year
2025 (USD billions; MMA Primary Research Dataset, September 2026)
Market Definition
This report defines the AR-enabled retail sleeves market as printed packaging sleeves embedding augmented reality trigger technology that activates interactive digital content through a smartphone camera when scanned by a consumer. It excludes standalone AR mobile applications and non-packaging AR marketing displays sold independently of product sleeves.
Quantitative Units
USD billions, unit shipments, CAGR percent
Segmentation Dimensions
Content function, end-use industry vertical, commercial dimension
Regions Covered
East Asia, North America, Western Europe, South Asia and Pacific, Latin America, Middle East and Africa, Eastern Europe
Countries Covered
United States, Canada, Germany, France, United Kingdom, China, Japan, South Korea, India, Australia, Brazil, Mexico, Saudi Arabia, United Arab Emirates, South Africa, Poland, Czech Republic, Russia
Key Companies Profiled
HP Indigo, Zappar, Blippar, Avery Dennison, Mondi Group, Ceres Imaging, Vuforia, 8th Wall, Snap AR, Zapworks, Layar, Aurasma, Wikitude, ARize, Marxent, Threekit, Augmate, Scandit, Kudan, DAQRI
Quantitative Methodology
Primary survey, n=3,800 respondents, Q4 2025, six countries; demand-side model with trade association cross-validation
Qualitative Methodology
47 expert interviews, Q4 2025; applied to validate demand model assumptions, identify emerging dynamics, and assess competitive positioning
Report Format
PDF and XLSX data workbook (Word format preview document)
Publisher
Market Minds Advisory
Report Code
MMA-2026-PAC-347
Published
September 2026
Contact
sales@marketmindsadvisory.com | www.marketmindsadvisory.com

Purchase the full AR-Enabled Retail Sleeves Market Report (2026 to 2036).

This report delivers a comprehensive analysis of the global AR-enabled retail sleeves market across all major content functions, regions, and competitive dynamics through 2036. It covers detailed segmentation by content function, end-use industry vertical, and commercial dimension, alongside regional demand architecture across all seven world regions. Competitive profiling examines the top five players controlling 29 percent of global revenue, along with fifteen additional participants shaping category evolution. The report also includes a portfolio tier analysis, input cost risk assessment, and a strategic verdict section identifying priority actions for vendors navigating this rapidly evolving category.
Seven-region demand share and CAGR breakdown
Five-tier top and secondary player profiling
Ten-year revenue and volume forecast model
Input cost and supply chain risk assessment
Portfolio margin tier and watch segment analysis
Anonymized client case study with strategy recommendations

Built For The People Who Decide

From boardroom strategy to bench-side execution, this report is read cover-to-cover by leaders shaping the next decade of their industry, turning demand scenarios, market dynamics and valuation benchmarks into decisions.
CXOs/ Presidents/ VPs/ Managers
M&A and Corporate Development
Strategy Teams and R&D Heads
Procurement and Product Directors
Regulatory and Compliance Leaders
Investor Relations and Equity Analysts