Market Minds Advisory
Aquaponics Market

Aquaponics Market: Water Savings That Sell Themselves, Energy Bills That Close Farms, and the Dual-Crop Complexity Nobody Prices In

Aquaponics saves more than ninety percent of the water field agriculture uses, yet energy and dual-crop labour have closed roughly two in five commercial ventures within five years of commissioning.

Lead Analyst

Lisa Gevelber

Published

September 2026

Make Smarter Decisions with Customized Research Insights

Request a free sample report and evaluate market opportunities, growth trends, and competitive dynamics relevant to your business needs.

2025 MARKET VALUE$1.5BMarket Size 2025
2036 FORECAST VALUE$5.4BBase Case , 2026 to 2036
CAGR 2026 TO 203612.4 %Bull 13.7% / Bear 11.1%
INCREMENTAL OPPORTUNITY$3.7BNet 10- year value creation
EXPANSION MULTIPLE3.21x2036 value over 2026 base
Strategic Levers
M&A Pipeline
Regional Outlook
Country Rankings
Competitive Intelligence
Segmental Deep-dive
Call-Us : 91 93563 13602

Executive Snapshot and Market Trajectory

Aquaponics has the best sustainability story in agriculture and one of the worst commercial records. Water use falls by more than ninety percent against field production, yet roughly two in five commercial ventures stop operating within five years, and almost none of those failures were caused by biology.
Commercial power sits with operators who treat the fish as a nutrient system rather than as a second revenue line. Aquaculture output typically contributes under a fifth of farm income while consuming a large share of management attention, and surviving farms have accepted that and optimised for produce. Vertical tower systems grow fastest at 16.8%, roughly 1.35 times the market, on space efficiency in urban and Gulf deployments. East Asia holds 30% of value.
The sector is barely concentrated, with the top five holding about 12% of installed commercial capacity, because most builds are bespoke and most integrators are small. Regulation splits the market sharply: American organic certification permits aquaponic produce while European Union organic rules require soil, which closes the highest-value European channel entirely. Energy pricing, not technology, has decided most outcomes since 2022. Nothing else explains the pattern.
Market Definition
This report covers integrated aquaponic production systems combining recirculating aquaculture with soilless plant cultivation, measured as installed system value plus equipment, controls, and engineering services supplied to commercial, institutional, and household operators. Coverage spans deep water culture, nutrient film technique, media bed, vertical tower, aeroponic, and substrate trough growing architectures. Standalone hydroponics without an aquaculture loop, standalone recirculating aquaculture, and the wholesale value of harvested produce and fish fall outside scope.
Base Year Value
$1.5B in 2025 (MMA Primary Research Dataset, August 2026)
Forecast Period
2026 to 2036, eleven discrete annual values
CAGR
12.4% base case. Bull 13.7%. Bear 11.1%.
Fastest Growth Segment
Vertical Tower Systems: 16.8% CAGR
Fastest Growth Country
United Arab Emirates: 15.8% CAGR
Fastest Growth Region
South Asia and Pacific: 14.5% CAGR
Largest Region
East Asia: 30% of 2025 global value
Market Leaders
Pentair, Nelson and Pade, Superior Fresh, ECF Farmsystems, Priva. Source: MMA Analysis based on company annual reports.
Primary Survey
n=3,800 procurement and R&D decision-makers, Q4 2025, six countries
Methodology
Demand-side build-up, cross-validated against public data, 47 expert interviews

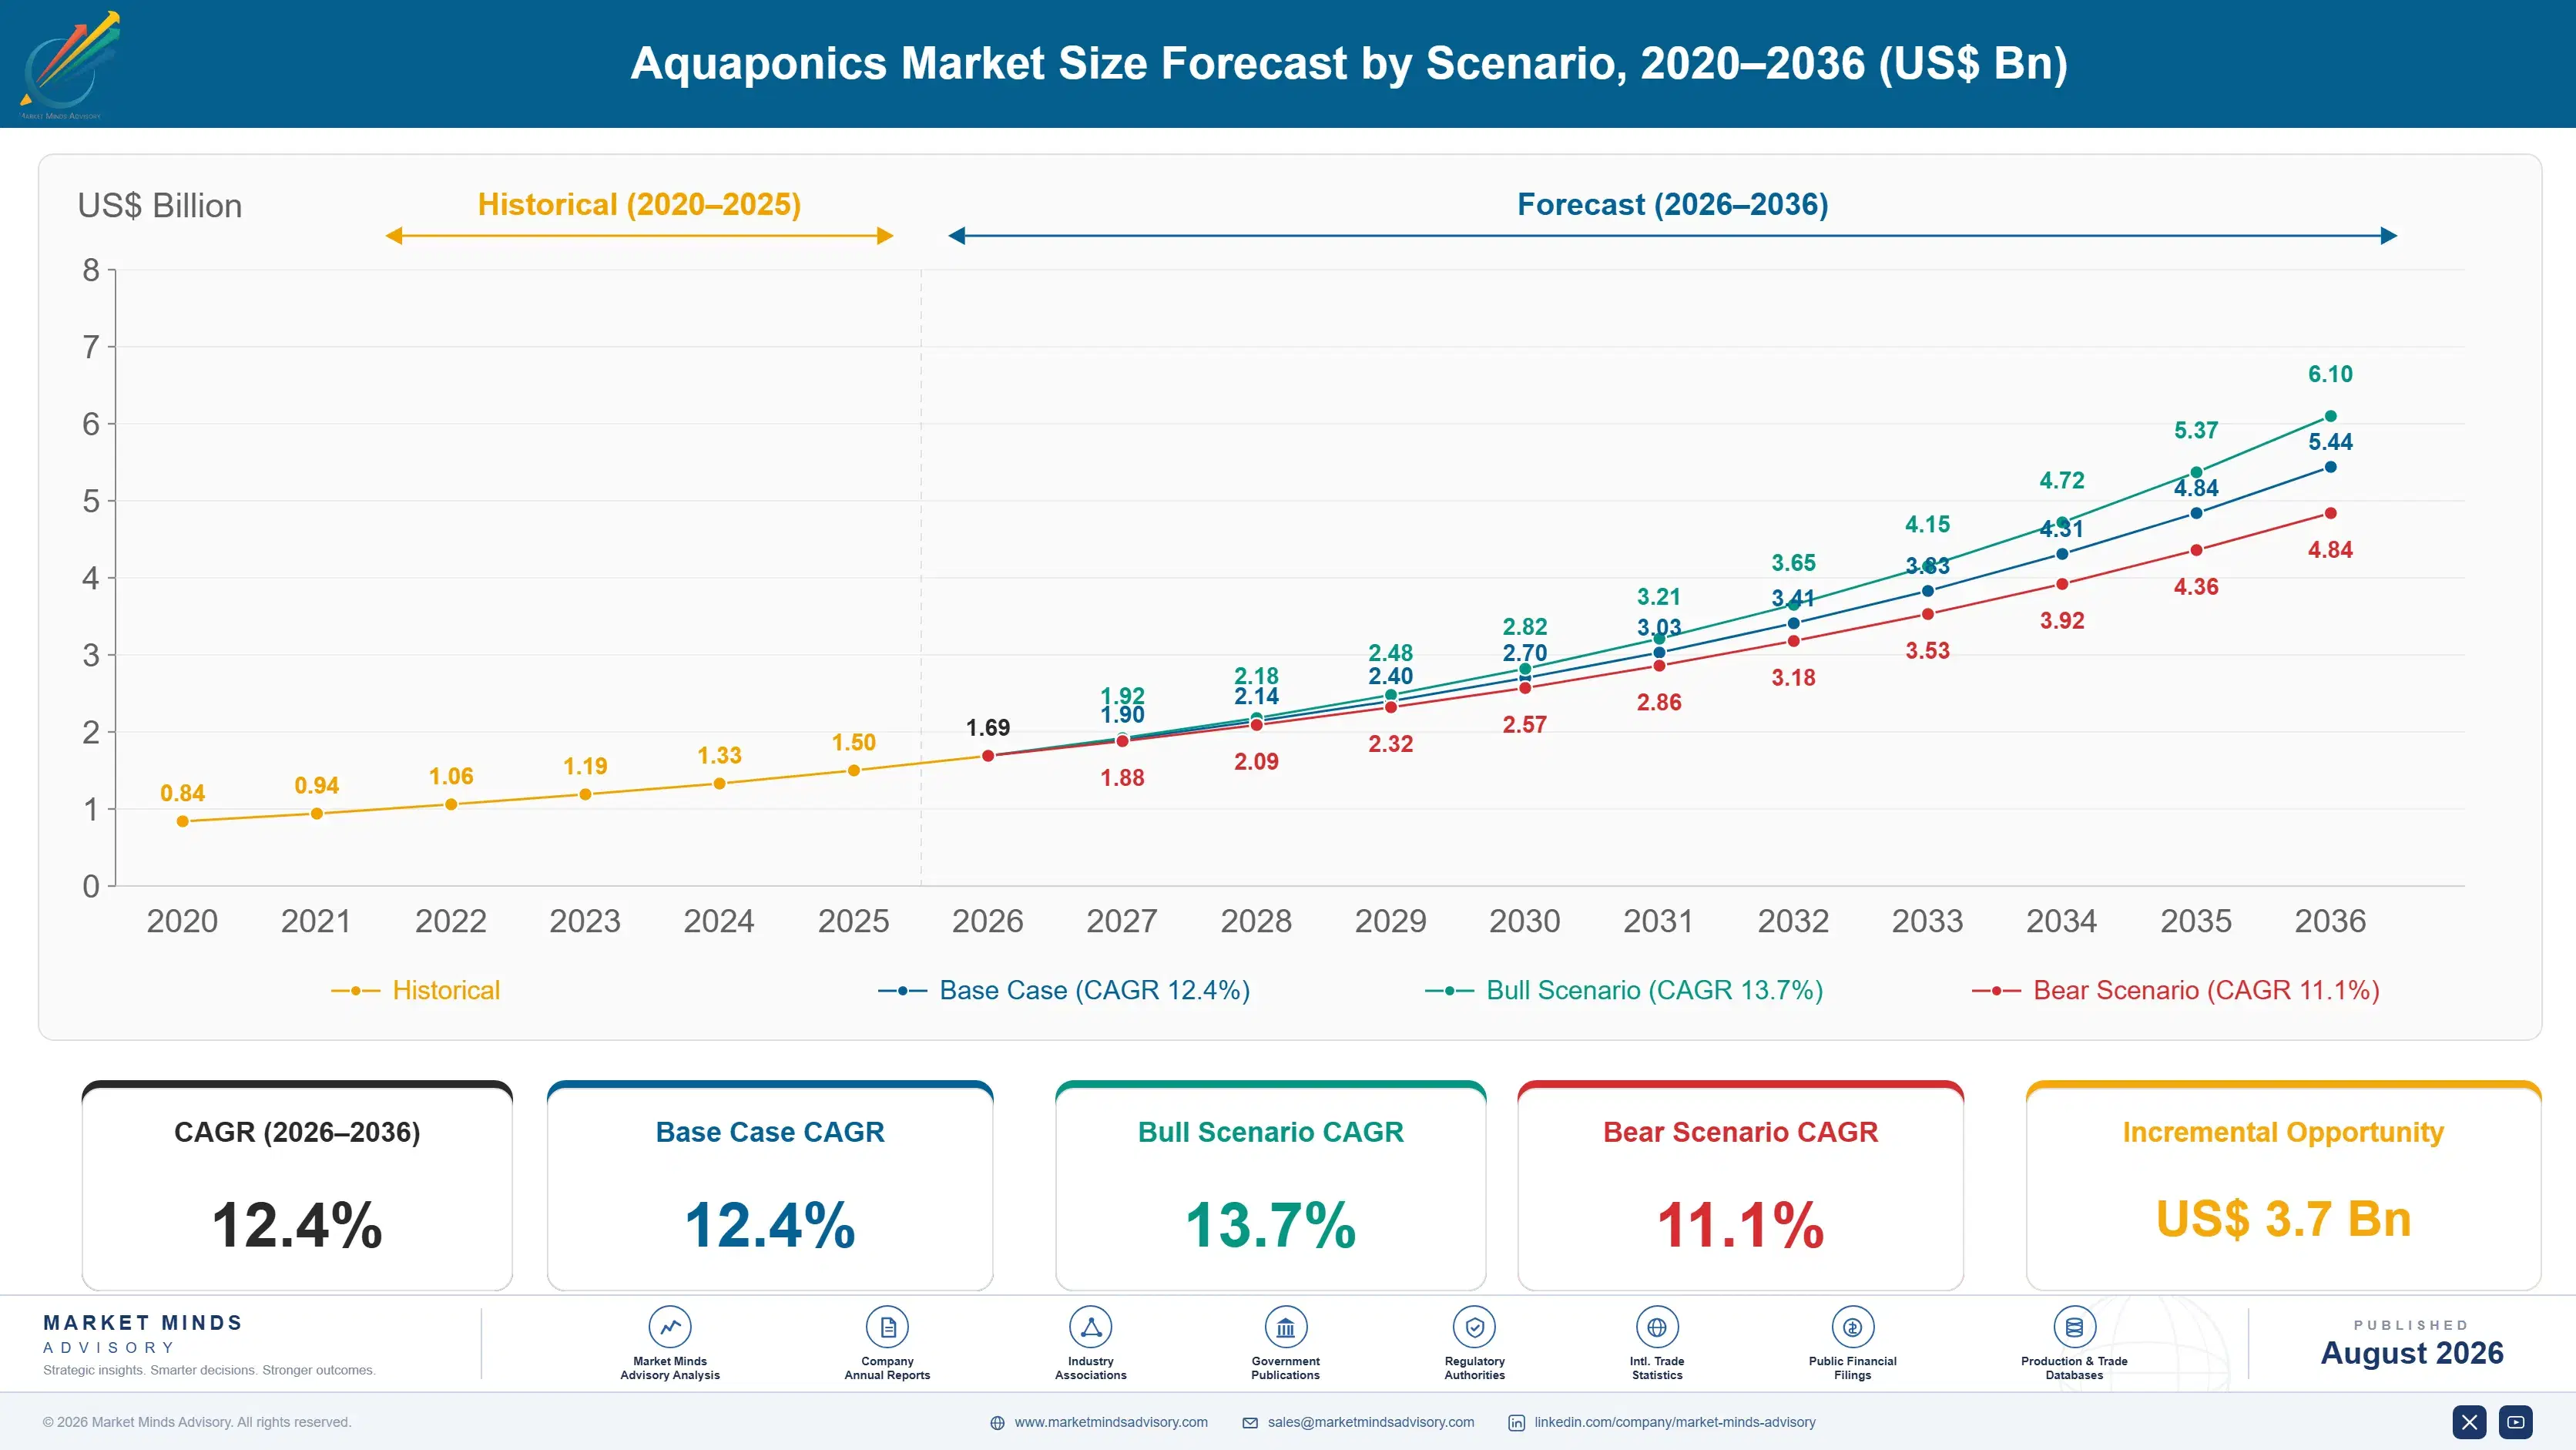
Aquaponics Market Forecast Scenarios

aquaponics-market-size-forecast-scenario-1787462429338
The 2020 to 2025 period was a filter rather than a growth run. Pandemic interest in local food production drove a wave of commissioning through 2020 and 2021, then European and North American energy prices tripled across 2022, and many of those installations closed or sold at distressed values. The 11.0% historical growth conceals that churn, because equipment sales continued even as operating farms failed.
The 12.4% base case rests on three mechanisms. Gulf and North African food security programmes keep funding controlled environment capacity where water scarcity makes the economics work despite energy cost. Urban vertical deployments keep expanding in East Asian cities where land price rather than energy dominates the cost equation. And institutional demand from schools, prisons, and municipal food programmes keeps growing steadily, insulated from commercial return requirements. Household system sales add a small but reliable base.
The 13.7% bull case assumes renewable generation paired with aquaponic facilities removes the energy constraint that has closed most failed ventures. The 11.1% bear case reflects sustained high electricity prices combined with continued field produce price competition, which together would keep commercial returns below what private capital requires. Energy price trajectories will decide between those two paths.

Why Energy, Not Water, Decides Viability

Three forces govern this market and only one of them appears in the marketing material. Water scarcity genuinely drives adoption wherever irrigation is constrained or expensive, and the ninety percent saving is real. Energy cost then governs whether the operation survives, because pumps, aeration, heating, and supplemental lighting run continuously. And dual-crop complexity, needing aquaculture and horticulture competence in one team, quietly defeats operators who budgeted for neither.
TOP-FIVE CONCENTRATION12%Share of installed commercial capacity held by leading suppliers
AVERAGE SYSTEM COST$385/sqmInstalled capital cost across commercial greenhouse aquaponic builds
WATER USE REDUCTION92%Saving measured against equivalent soil-grown field crop production
ENERGY COST SHARE31%Electricity and heating within total operating cost base
FISH REVENUE CONTRIBUTION18%Portion of farm income derived from aquaculture output
COMMERCIAL FAILURE RATE43%Share of ventures ceasing operation within five years
The commercial character is unusual for an agricultural technology. Equipment integrators sell systems and get paid; farm operators buy them and frequently do not. That mismatch produced a supplier base that grew while its customers churned, and it explains why installed capacity figures overstate operating capacity. The integrators performing best now sell operating support, agronomy, and monitoring alongside hardware, because a customer who survives buys again.
The next decade turns on whether energy can be decoupled from grid pricing. Facilities pairing solar generation or waste heat from adjacent industry with aquaponic production show operating economics standalone grid-connected sites cannot approach. Gulf projects with cheap solar and expensive water are the clearest case. Where both energy and water are cheap, aquaponics has never made commercial sense and probably never will.
"Every failed aquaponic farm we have examined had an excellent water story and no answer on electricity. The fish were fine, the lettuce was fine, and the bill arrived every month regardless of either."
Director, Controlled Environment Agriculture Practice · MMA Controlled Environment Agriculture / Integrated Food Production Practice · August 2026

Market Trends

Gulf Food Security Programmes Fund Water-Constrained Production Capacity

The United Arab Emirates National Food Security Strategy and Saudi Vision 2030 agricultural programmes both direct capital toward domestic production in conditions where conventional farming consumes desalinated water at ruinous cost. Aquaponic and hybrid controlled environment facilities have been commissioned across Abu Dhabi, Dubai, Riyadh, and Qatar with public or sovereign backing that removes the private return requirement most ventures fail to meet. Cheap solar generation addresses the energy problem that closed European operators, and expensive water makes the saving genuinely valuable. That combination exists in few other places. Procurement runs on strategic rather than commercial timetables.
Market Impact: Cuts water consumption by 92%
Decoupled Multi-Loop Designs Replace Single-Recirculation Architecture

Classic aquaponics circulates one body of water between fish and plants, which forces a compromise on pH, temperature, and nutrient concentration that suits neither organism well. Decoupled designs run separate loops connected by controlled transfer, letting each side operate at its own optimum and permitting mineral supplementation without harming fish. Yields improve materially and crop range widens beyond leafy greens into fruiting vegetables. The trade-off is capital cost and control complexity, so adoption concentrates among larger commercial builds rather than institutional or household systems where simplicity still wins. Retrofitting an existing single-loop facility is rarely economic at all.
Market Impact: Delivers 11% of system sales

Market Opportunities and Growth Drivers

Irrigation Constraint Makes Water Saving Commercially Decisive

Aquaponic systems recirculate, losing water principally to plant transpiration and harvest removal, which cuts consumption by more than ninety percent against equivalent field production. In regions where groundwater is depleting, allocation is capped, or supply comes from desalination, that saving translates directly into permission to farm at all. Gulf states, southern Spain, California's Central Valley, and northern India all face binding constraints of this kind. The economics only work where water is genuinely expensive or rationed, which is precisely why adoption maps to scarcity rather than to agricultural sophistication. Water abundance, oddly, is the real barrier to adoption.
Market Impact: Consumes 31% of operating cost

Institutional and Educational Demand Grows Outside Commercial Returns

Schools, universities, prisons, hospitals, and municipal food programmes install aquaponic systems for curriculum, rehabilitation, and local food objectives rather than for financial return, which insulates that demand from the energy economics closing commercial farms. Procurement runs through public budgets on multi-year cycles and favours suppliers with training, curriculum, and maintenance support rather than the lowest capital cost. Volumes per installation are small but the segment is unusually stable. For integrators, it also provides reference sites and steady service revenue between larger commercial projects. Public buyers also renew, which venture-funded commercial farms have repeatedly failed to do.
Market Impact: Removes 35% price premium

Market Restraints and Challenges

Electricity Cost Determines Survival More Than Any Other Variable

Pumps, aeration, water heating, and supplemental lighting run continuously, and electricity accounts for roughly 31% of operating cost before any lighting-intensive vertical configuration is considered. The root cause is thermodynamic rather than managerial: recirculating water must be moved, oxygenated, and held at temperature whatever the electricity price does. European operators caught by the 2022 price surge closed in numbers, and several North American ventures followed. Responses include on-site solar, heat recovery from adjacent industry, seasonal production scheduling, and siting decisions that prioritise power cost over market proximity. No efficiency measure removes that continuous base load entirely.
Market Impact: Backs 15.8% Emirati growth rate

European Organic Rules Exclude Aquaponic Produce From Premium Channels

European Union organic regulation requires production in soil, which means aquaponic and hydroponic output cannot carry organic certification anywhere in the bloc, while American National Organic Program rules permit it. The root cause is a philosophical position on soil health rather than any assessment of the produce itself. Commercially this removes the price premium that would otherwise offset higher operating cost, and it leaves European operators competing against field produce on price alone. Participants respond by pursuing pesticide-free and local sourcing claims, retail partnerships, and foodservice contracts where certification matters less.
Market Impact: Lifts crop yield 24% typically
3 additional market trends, 2 additional growth drivers, and 4 additional restraints and challenges are covered in the full report. Contact sales@marketmindsadvisory.com to access the complete intelligence.

Segment CAGR and Growth Architecture

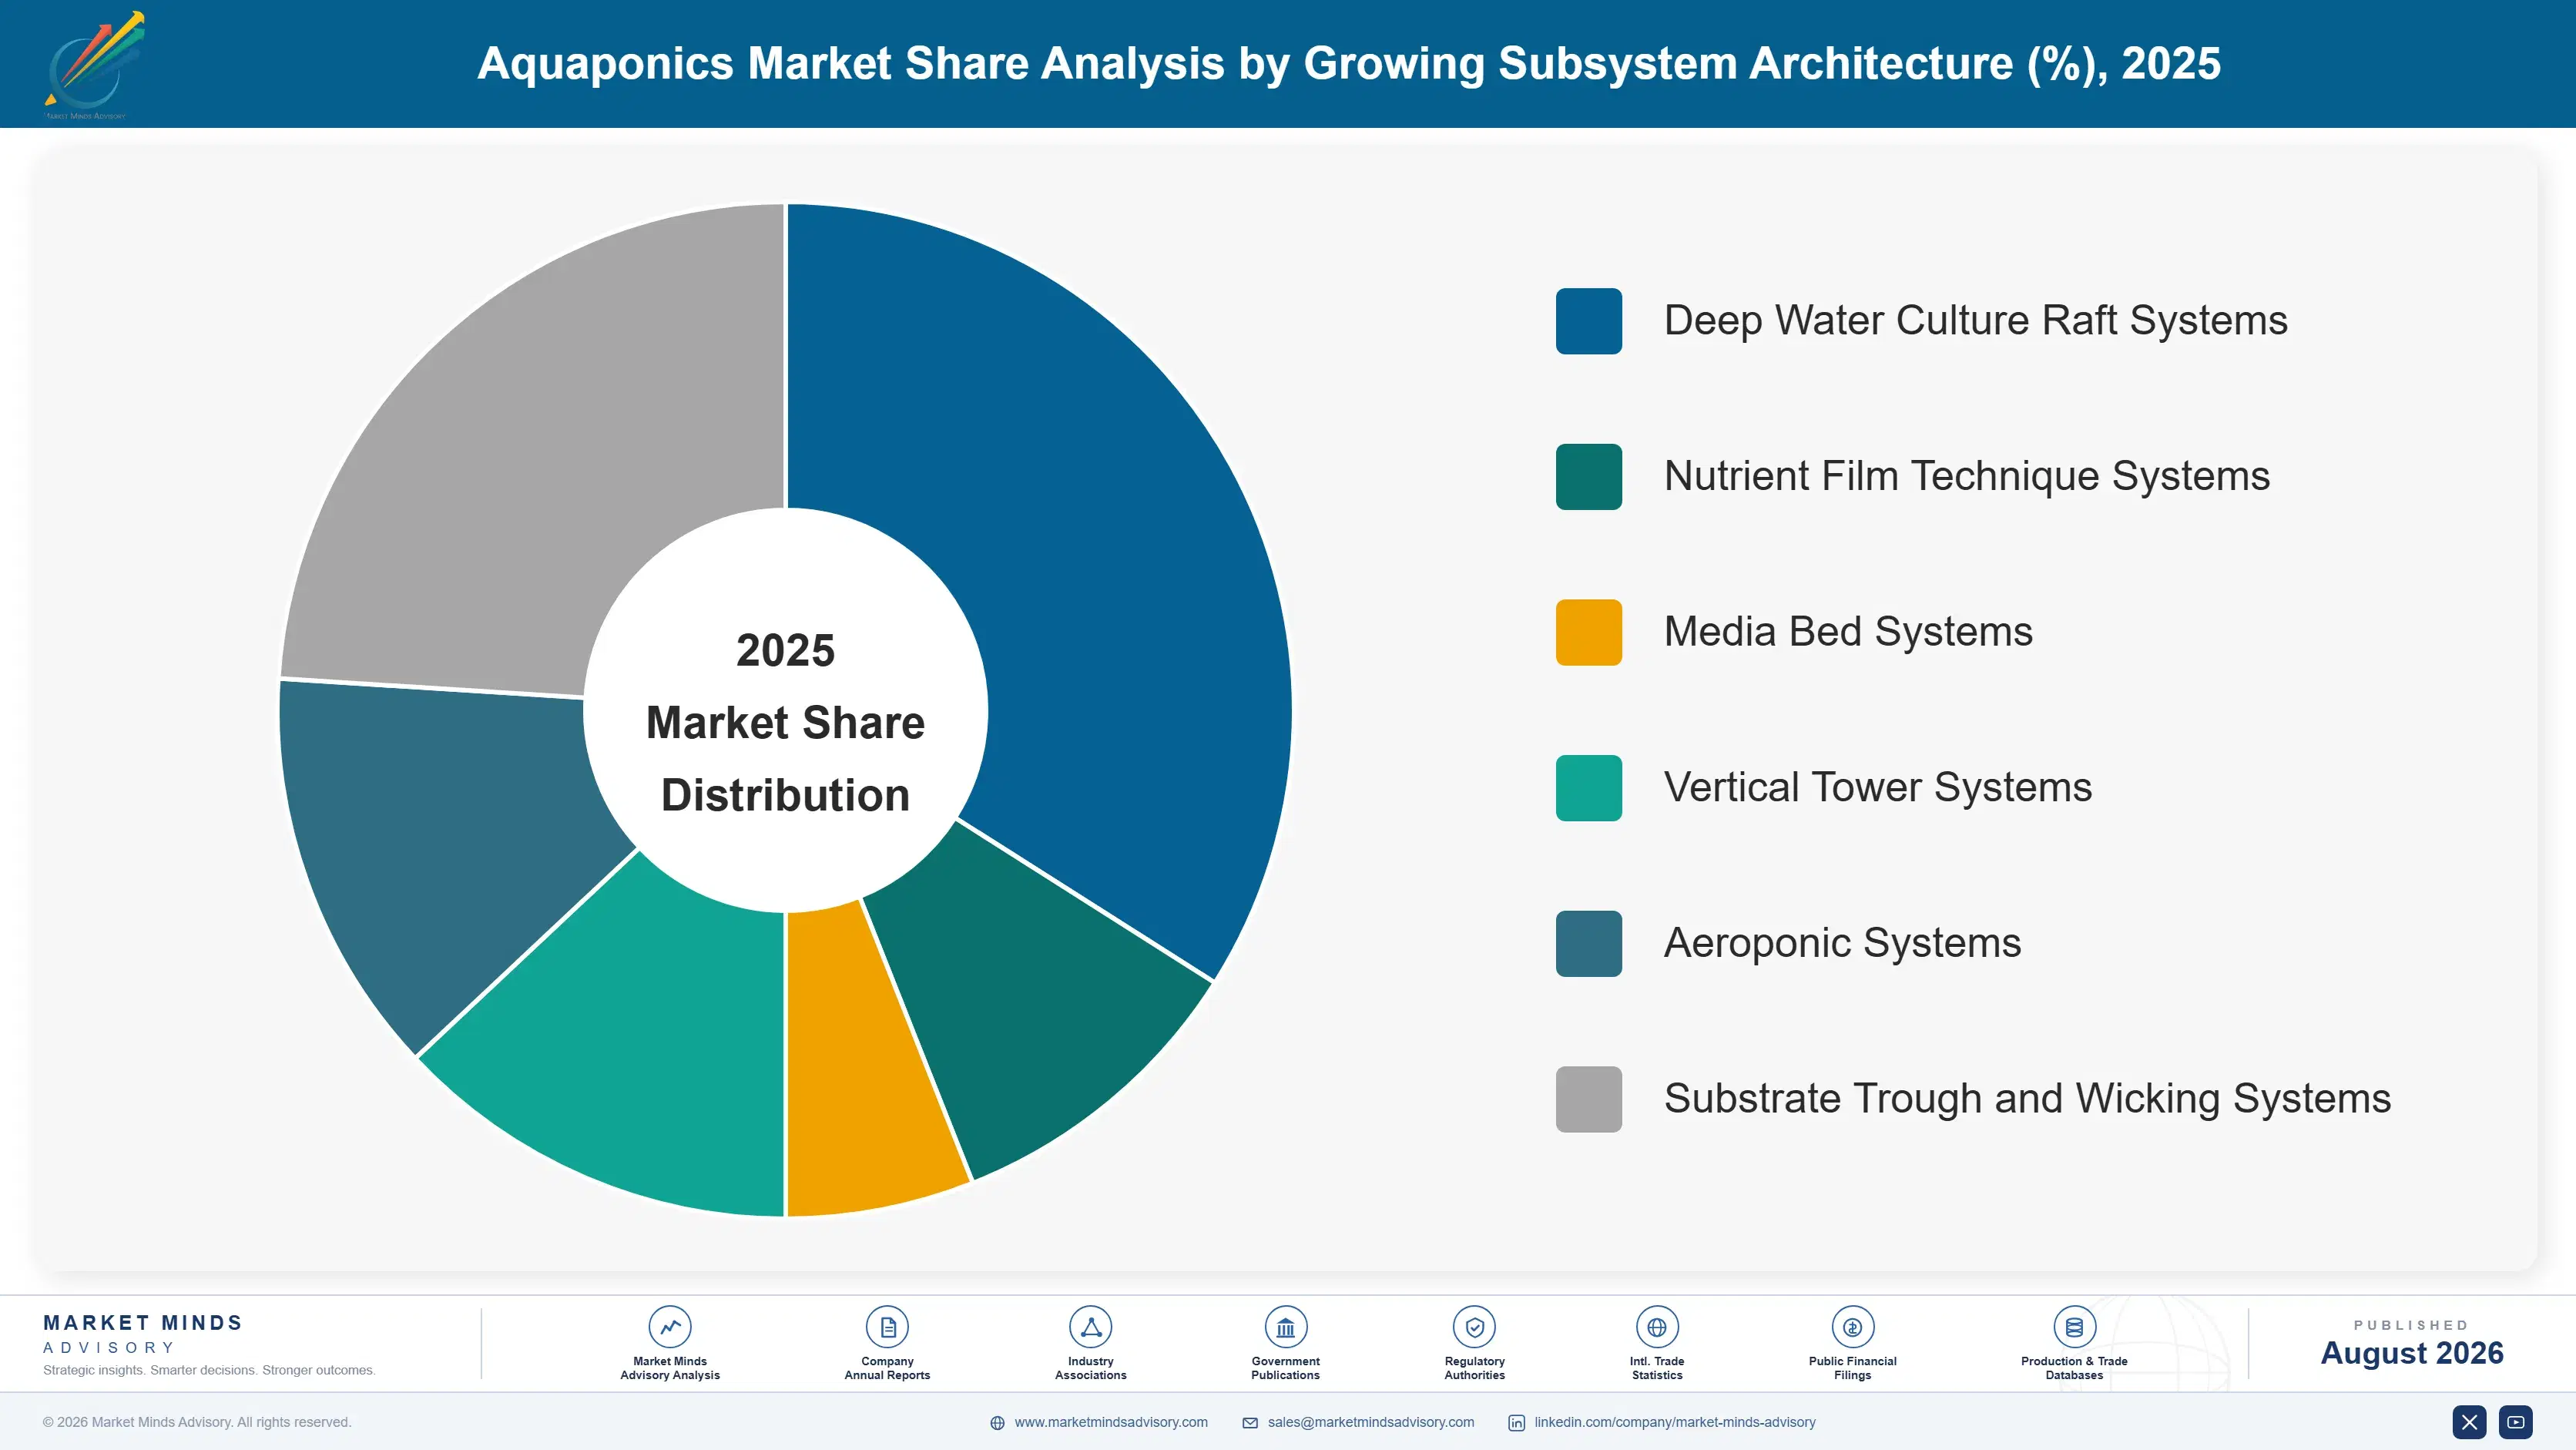
Segmentation follows growing subsystem architecture, the single engineering logic that determines capital cost per square metre, crop range, labour intensity, and energy load. Architecture decides what an operator can profitably grow and how much power the facility draws. Operator type, facility scale, and procurement channel appear separately in the framework as commercial dimensions rather than parallel segments.
aquaponics-market-market-share-analysis-1787462429876

Vertical Tower Systems

Growth of 16.8%, roughly 1.35 times the market, comes from places where land costs more than electricity. Stacked tower configurations multiply growing area within a footprint, which suits urban East Asian deployments, Gulf facilities inside industrial zones, and retail-adjacent installations selling on proximity. The trade-off is severe: vertical arrangements almost always require supplemental lighting, which pushes energy from roughly a third of operating cost toward half. Crop range narrows to leafy greens, herbs, and strawberries that tolerate the light and root volume available. The segment therefore grows fastest and fails most often, and the operators surviving are those with either subsidised power or a retail contract priced well above field produce.
CAGR 16.8%

Aeroponic Systems

Aeroponic integration misting roots rather than immersing them delivers the highest oxygen availability of any architecture, which produces faster growth rates and shorter cycles than deep water culture achieves. Growth of 15.2% reflects adoption among operators chasing yield per square metre in high-value crops. The engineering demands are the constraint: nozzles clog with the biological solids an aquaculture loop inevitably carries, so filtration must be far more rigorous than other architectures require, and a pump failure kills a crop within hours rather than days. Adoption therefore concentrates among well-capitalised commercial builds with redundancy and monitoring, and almost never appears in institutional or household installations. Insurance and financing terms reflect that fragility, raising the effective cost of capital.
CAGR 15.2%
Full segment breakdown across 6 segments available in the complete report.

Regional Architecture and Country Demand Map

East Asia holds the largest share at 30%, driven by Chinese controlled environment agriculture investment and dense urban deployments where land cost dominates. South Asia and Pacific grows fastest on Indian and Southeast Asian water constraint, while Middle East and Africa punches well above its share.

North America

This region has both the largest installed base and the longest list of closures, and the two facts are related. A wave of venture-funded commercial aquaponic farms commissioned through 2020 and 2021 across the Midwest, Northeast, and Pacific Northwest, and a substantial share ceased operating when energy prices rose and retail leafy green pricing did not follow. Superior Fresh in Wisconsin remains the reference case for what works at scale. American National Organic Program rules permit aquaponic produce to carry organic certification, which is a decisive commercial advantage over Europe. Institutional installations across schools and correctional facilities provide steady demand at 11.6% regional growth. Certification access is the single largest advantage American operators hold.
Share: 23% | CAGR: 11.6% (2026 to 2036)

Western Europe

European organic regulation requires soil-based production, so aquaponic output cannot carry organic certification anywhere in the bloc, and that single rule removes the premium channel that would make the economics work. Dutch, German, and Belgian operators consequently compete against field and greenhouse produce on price while carrying higher energy cost. The 2022 electricity surge closed several commissioned facilities outright. What remains is concentrated among suppliers of equipment and controls, where Priva, Ridder, and Certhon export horticultural technology globally rather than operating farms themselves. Growth of 10.8% is the slowest of any region and reflects regulation rather than any technical shortcoming. Technology exports now outlast the domestic farms that once proved them commercially viable.
Share: 19% | CAGR: 10.8% (2026 to 2036)
Regional intelligence for 5 additional markets available in the complete report: East Asia, South Asia and Pacific, Latin America, Middle East and Africa, Eastern Europe. Contact sales@marketmindsadvisory.com.
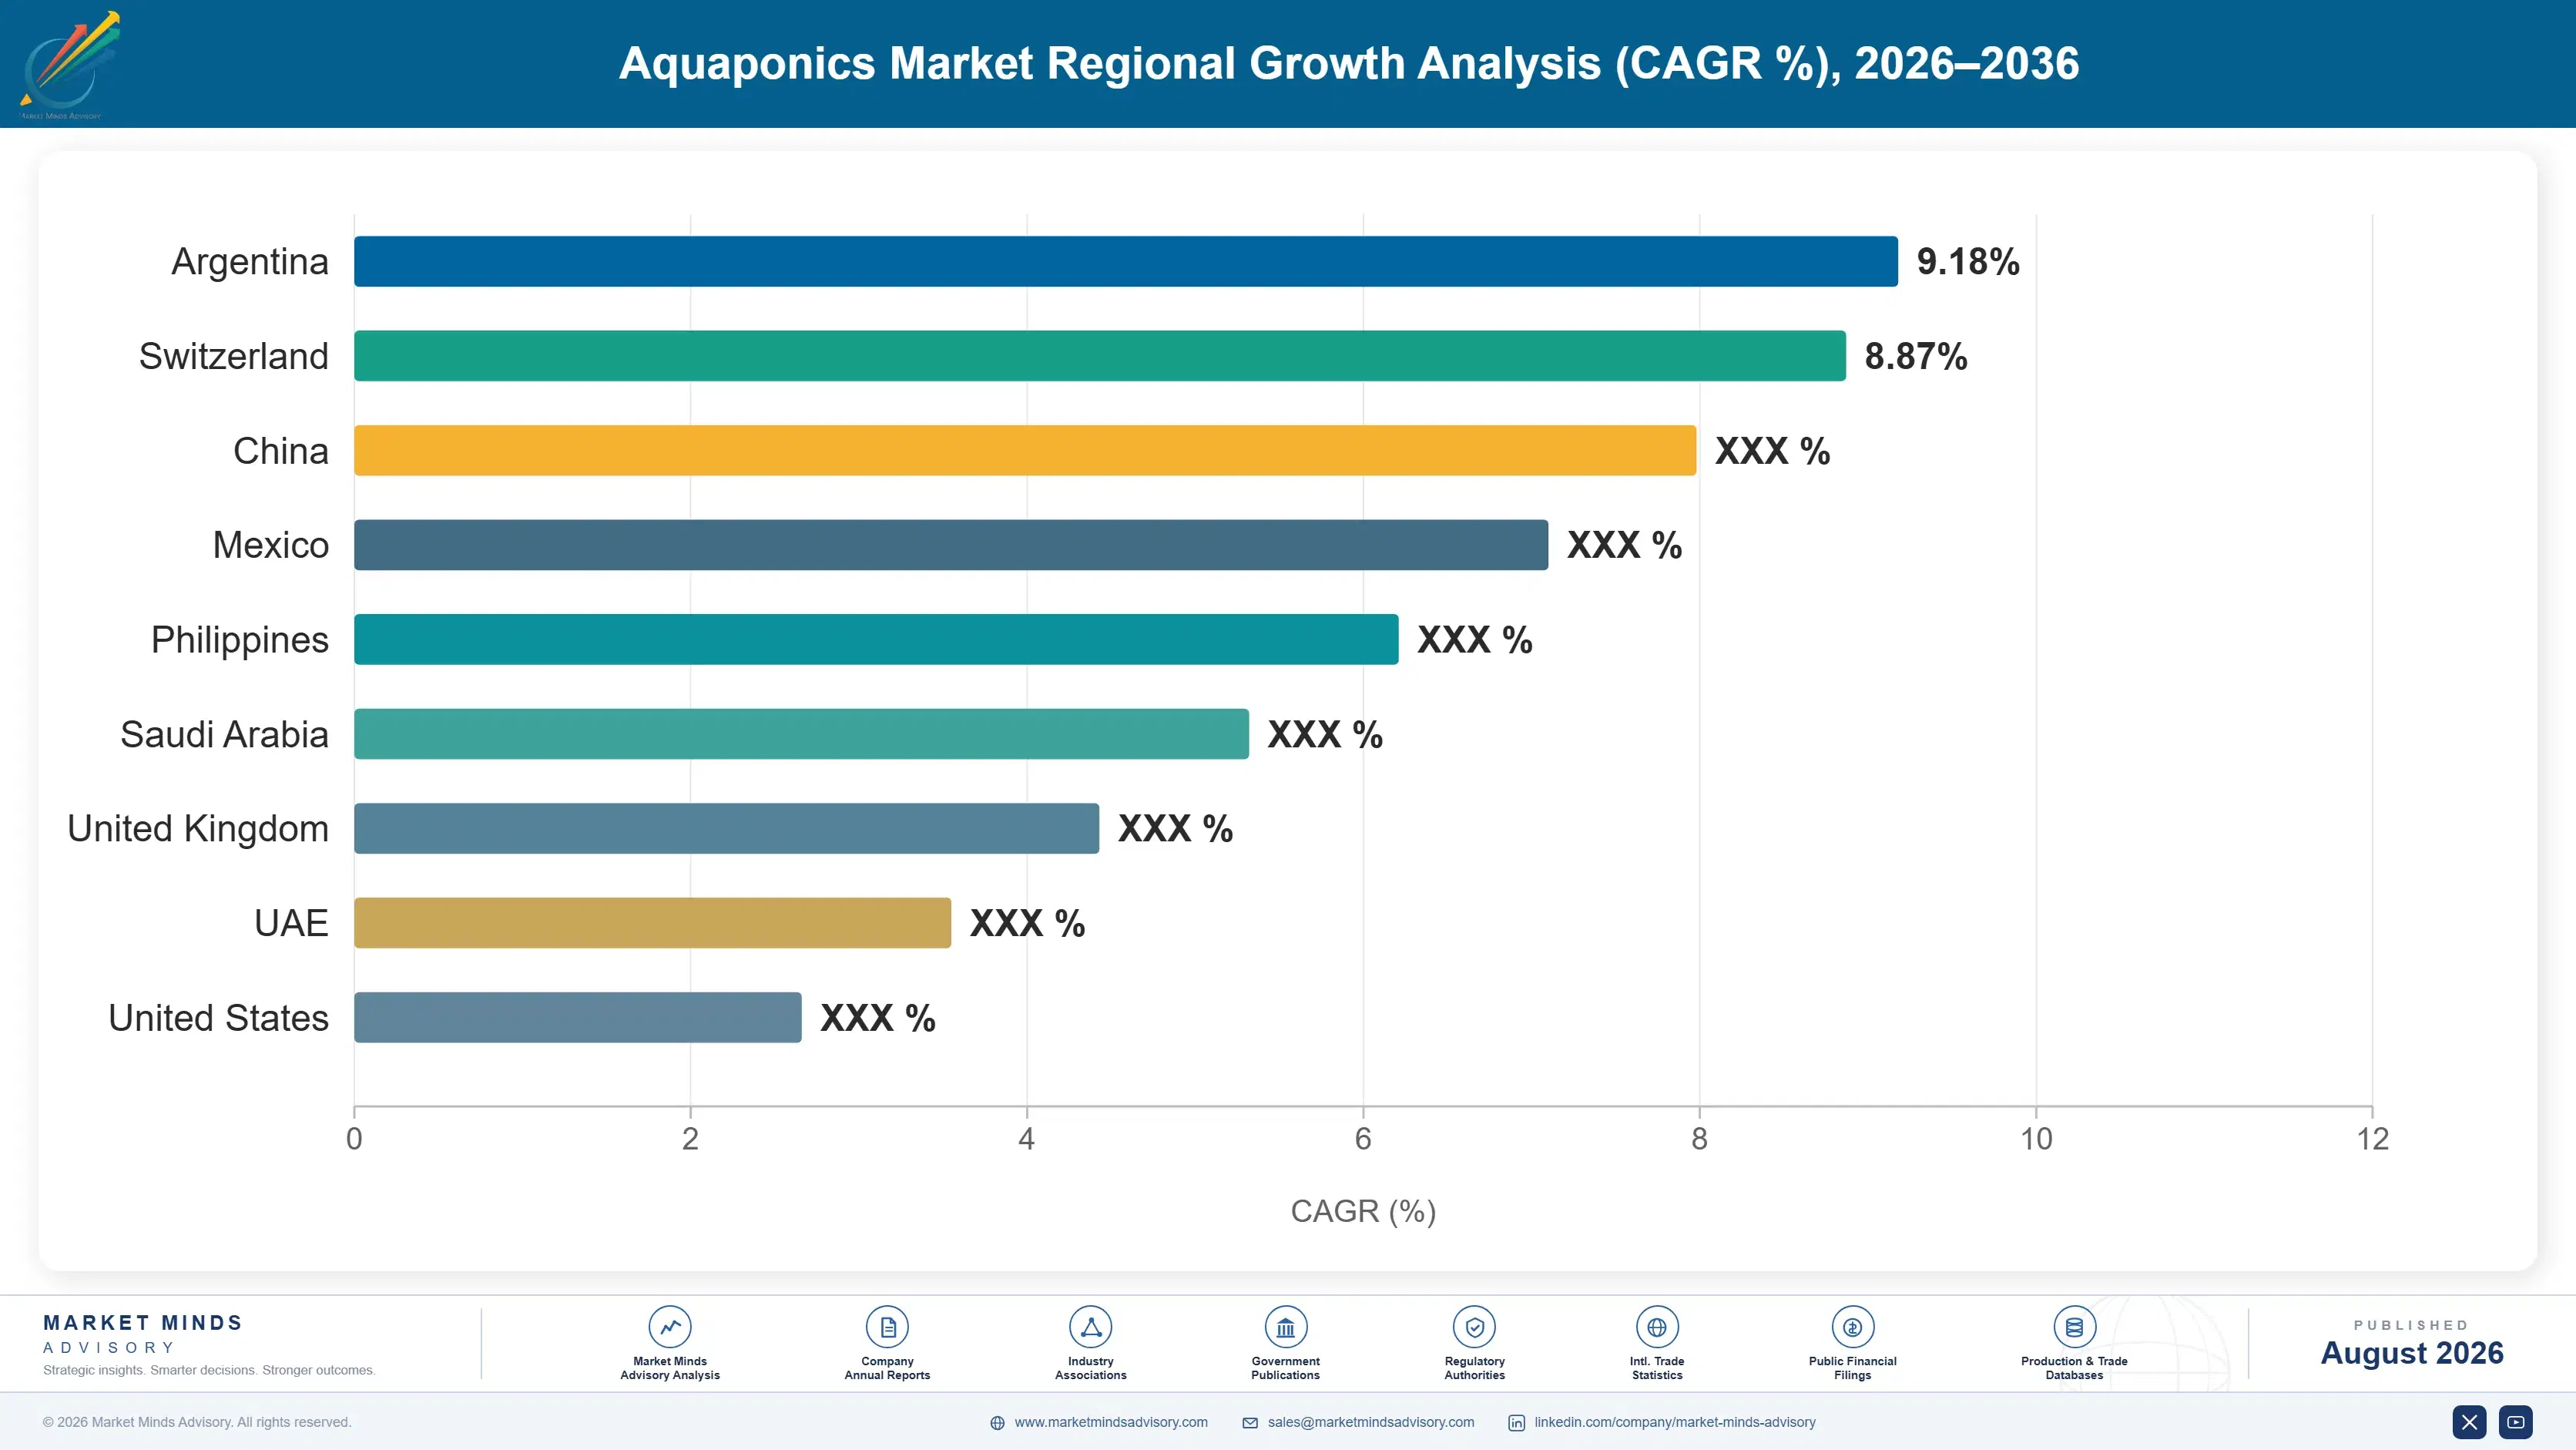
aquaponics-market-country-cagr-analysis-1787462430408

Where Aquaponic Operations Actually Make Money

Selling lettuce against field production is how most aquaponic farms have gone out of business. The four moves below shift revenue toward positions field agriculture cannot contest: contracted energy independence, crops that travel badly, service revenue attached to hardware, and retail relationships priced on proximity rather than on commodity produce benchmarks. None of the four requires new technology.

Pair Facilities With Owned or Contracted Generation Capacity

Electricity is roughly 31% of operating cost and the single variable that has closed most failed ventures, so removing exposure to grid pricing changes the business rather than merely improving it. On-site solar, waste heat capture from adjacent industry, or long-term power purchase agreements typically cut delivered energy cost by 35% to 55% depending on latitude and industrial neighbours. Capital runs around $600,000 for a mid-sized commercial greenhouse installation. Gulf and Australian operators have demonstrated the model, and temperate operators without it remain one price shock from closure. Siting for power cost now outranks siting for market access.
Market Impact: Cuts delivered energy cost by 35 to 55%

Grow Crops That Cannot Survive a Supply Chain

Leafy greens are grown everywhere and priced accordingly, which is why competing on them fails. Living herbs, micro-greens, edible flowers, wasabi, and delicate varietals lose quality within a day of harvest, so proximity is worth real money to chefs and premium retailers rather than being a marketing claim. These crops sell at 3 to 6 times commodity lettuce pricing per square metre of growing area. The commercial demand is relationship-intensive rather than volume-driven, which suits an operation with limited area and high fixed cost far better. A single restaurant account can absorb 40 to 60 square metres of production.
Market Impact: Earns 3 to 6x commodity produce pricing levels

Attach Agronomy and Monitoring Services to Every System Sale

Integrators who sell hardware and walk away watch roughly two in five customers fail within five years, which destroys repeat business and reference sites at the same time. Bundling remote monitoring, water chemistry support, and agronomy advice under annual subscription typically adds $18,000 to $40,000 per commercial site each year at high margin. More importantly it keeps customers operating, and an operating customer expands. The service capability also generates operating data across many sites that no single farm could accumulate on its own. Farms that survive expand, and farms that fail never buy again.
Market Impact: Adds $18,000 to $40,000 per commercial site annually

Target Institutional Buyers Insulated From Commercial Return Tests

Schools, universities, prisons, hospitals, and municipal programmes buy aquaponic systems for curriculum, rehabilitation, and local food objectives, not for payback calculations that commercial farms cannot meet. Procurement runs on public budgets across multi-year cycles and rewards training, curriculum materials, and maintenance contracts over lowest capital cost. Margins run 8 to 14 points above competitive commercial tenders. The segment supplies roughly 11% of system sales and, unlike venture-funded commercial farms, its buyers are still there five years later ready to expand. Reference sites that stay open are worth more than the margin itself does.
Market Impact: Adds 8 to 14 points of gross margin

Who Controls the Margin Pool

Concentration is very low: the top five hold roughly 12% of installed commercial capacity, measured consistently as system value delivered at commissioning. Most builds are bespoke engineering projects rather than product sales, and hundreds of small integrators operate regionally. Pentair, Priva, and the Dutch horticultural technology firms compete on components and controls rather than complete farms, while Nelson and Pade and ECF sell integrated designs.
Competition runs along three lines. Component and controls supply is the first, where established horticultural technology companies hold reliability and support advantages specialist aquaponic firms cannot match. Turnkey system integration is the second, contested by small firms competing largely on installed cost. The third is operating know-how, where the handful of successful production farms have accumulated agronomy and fish husbandry data that nobody else holds.

Two pressures are reshaping the field. Customer failure at scale has damaged the sector's financing reputation, which makes capital harder to raise for both operators and integrators. Meanwhile controlled environment agriculture suppliers without aquaculture loops are taking projects on simpler economics and lower operating risk. The exposed position is a turnkey integrator selling hardware alone into commercial ventures, with no service revenue and no institutional channel to fall back on.
aquaponics-market-company-positioning-matrix-1787462430933

Competitive Moat and Risk Dimensions

PENTAIR

Moat: Aquaculture Equipment Installed Base

Pentair supplies pumps, filtration, aeration, and water treatment across recirculating aquaculture generally, so aquaponics is an adjacent application of equipment already engineered and stocked worldwide. That scale delivers component reliability and spare parts availability specialist aquaponic firms cannot approach. For an operator whose crop dies within hours of a pump failure, that support network matters more than system design elegance.
PENTAIR

Risk: Component Rather Than System Position

Selling components into projects designed by others limits value capture and leaves the company dependent on integrators whose customers frequently fail. When a wave of commercial farms closed after 2022, equipment demand fell with them. Without a service or agronomy position, Pentair captures none of the recurring revenue that keeps operators alive and buying replacement equipment over time.
PRIVA

Moat: Climate and Process Control Depth

Priva controls manage climate, irrigation, and energy across commercial horticulture worldwide, and that software and sensing capability transfers directly into aquaponic facilities where control precision determines whether the operation survives. Decades of greenhouse operating data inform algorithms no aquaponic specialist could replicate. The company also benefits from being trusted by growers who already run its systems in conventional production.
PRIVA

Risk: Limited Aquaculture Loop Expertise

The company's strength sits on the plant side, and aquaponic failures more often originate in water chemistry, fish health, or the interaction between loops than in climate control. Partnering fills the gap but leaves accountability divided when something goes wrong. Operators increasingly want one supplier answerable for the whole system, and that expectation favours integrators over component specialists.

Players Tracked

Prominent Players

Pentair
Nelson and Pade
Superior Fresh
ECF Farmsystems
Priva

Other Key Players

Hydrofarm Holdings
Signify
Argus Control Systems
The Aquaponic Source
Bioaqua Farm
GreenLife Farms
Urban Crop Solutions
Ridder
Certhon
Autogrow Systems
Aquaponic Lynx
Symbiotic Aquaponic
Green Acre Aquaponics
Aponic Ltd
Water Farmers Aquaponics

Recent Developments

APRIL 2025

Emirati food security programme commissions further controlled environment capacity

Additional controlled environment production capacity was commissioned in the United Arab Emirates under national food security objectives, combining soilless cultivation with integrated aquaculture loops and solar generation. The projects target domestic leafy green and herb supply where conventional farming would consume desalinated water at prohibitive cost across the growing season.
Signal: Sovereign capital, not commercial return, is funding the only region where every aquaponic economic condition aligns.
NOVEMBER 2024

European aquaponic operators consolidate after sustained energy pressure

Several European commercial aquaponic operations were sold, restructured, or wound down following two years of elevated electricity costs and the absence of any organic certification premium under European Union rules. Equipment and controls suppliers reported continued export demand even as the domestic operating base contracted noticeably during the period.
Signal: European technology exports are outlasting European farms, which tells you where the regulatory problem actually sits.
JULY 2025

Superior Fresh extends Wisconsin production and salmon capacity

Superior Fresh continued expanding its integrated Wisconsin operation, combining Atlantic salmon production with large-scale leafy green cultivation under one roof. The facility remains the most frequently cited demonstration that aquaponics can operate profitably at commercial scale when energy, species, and retail channel decisions align correctly.
Signal: Profitable scale aquaponics exists but remains rare enough that one American farm still anchors the argument.

Electricity, Feed, and Capital Recovery

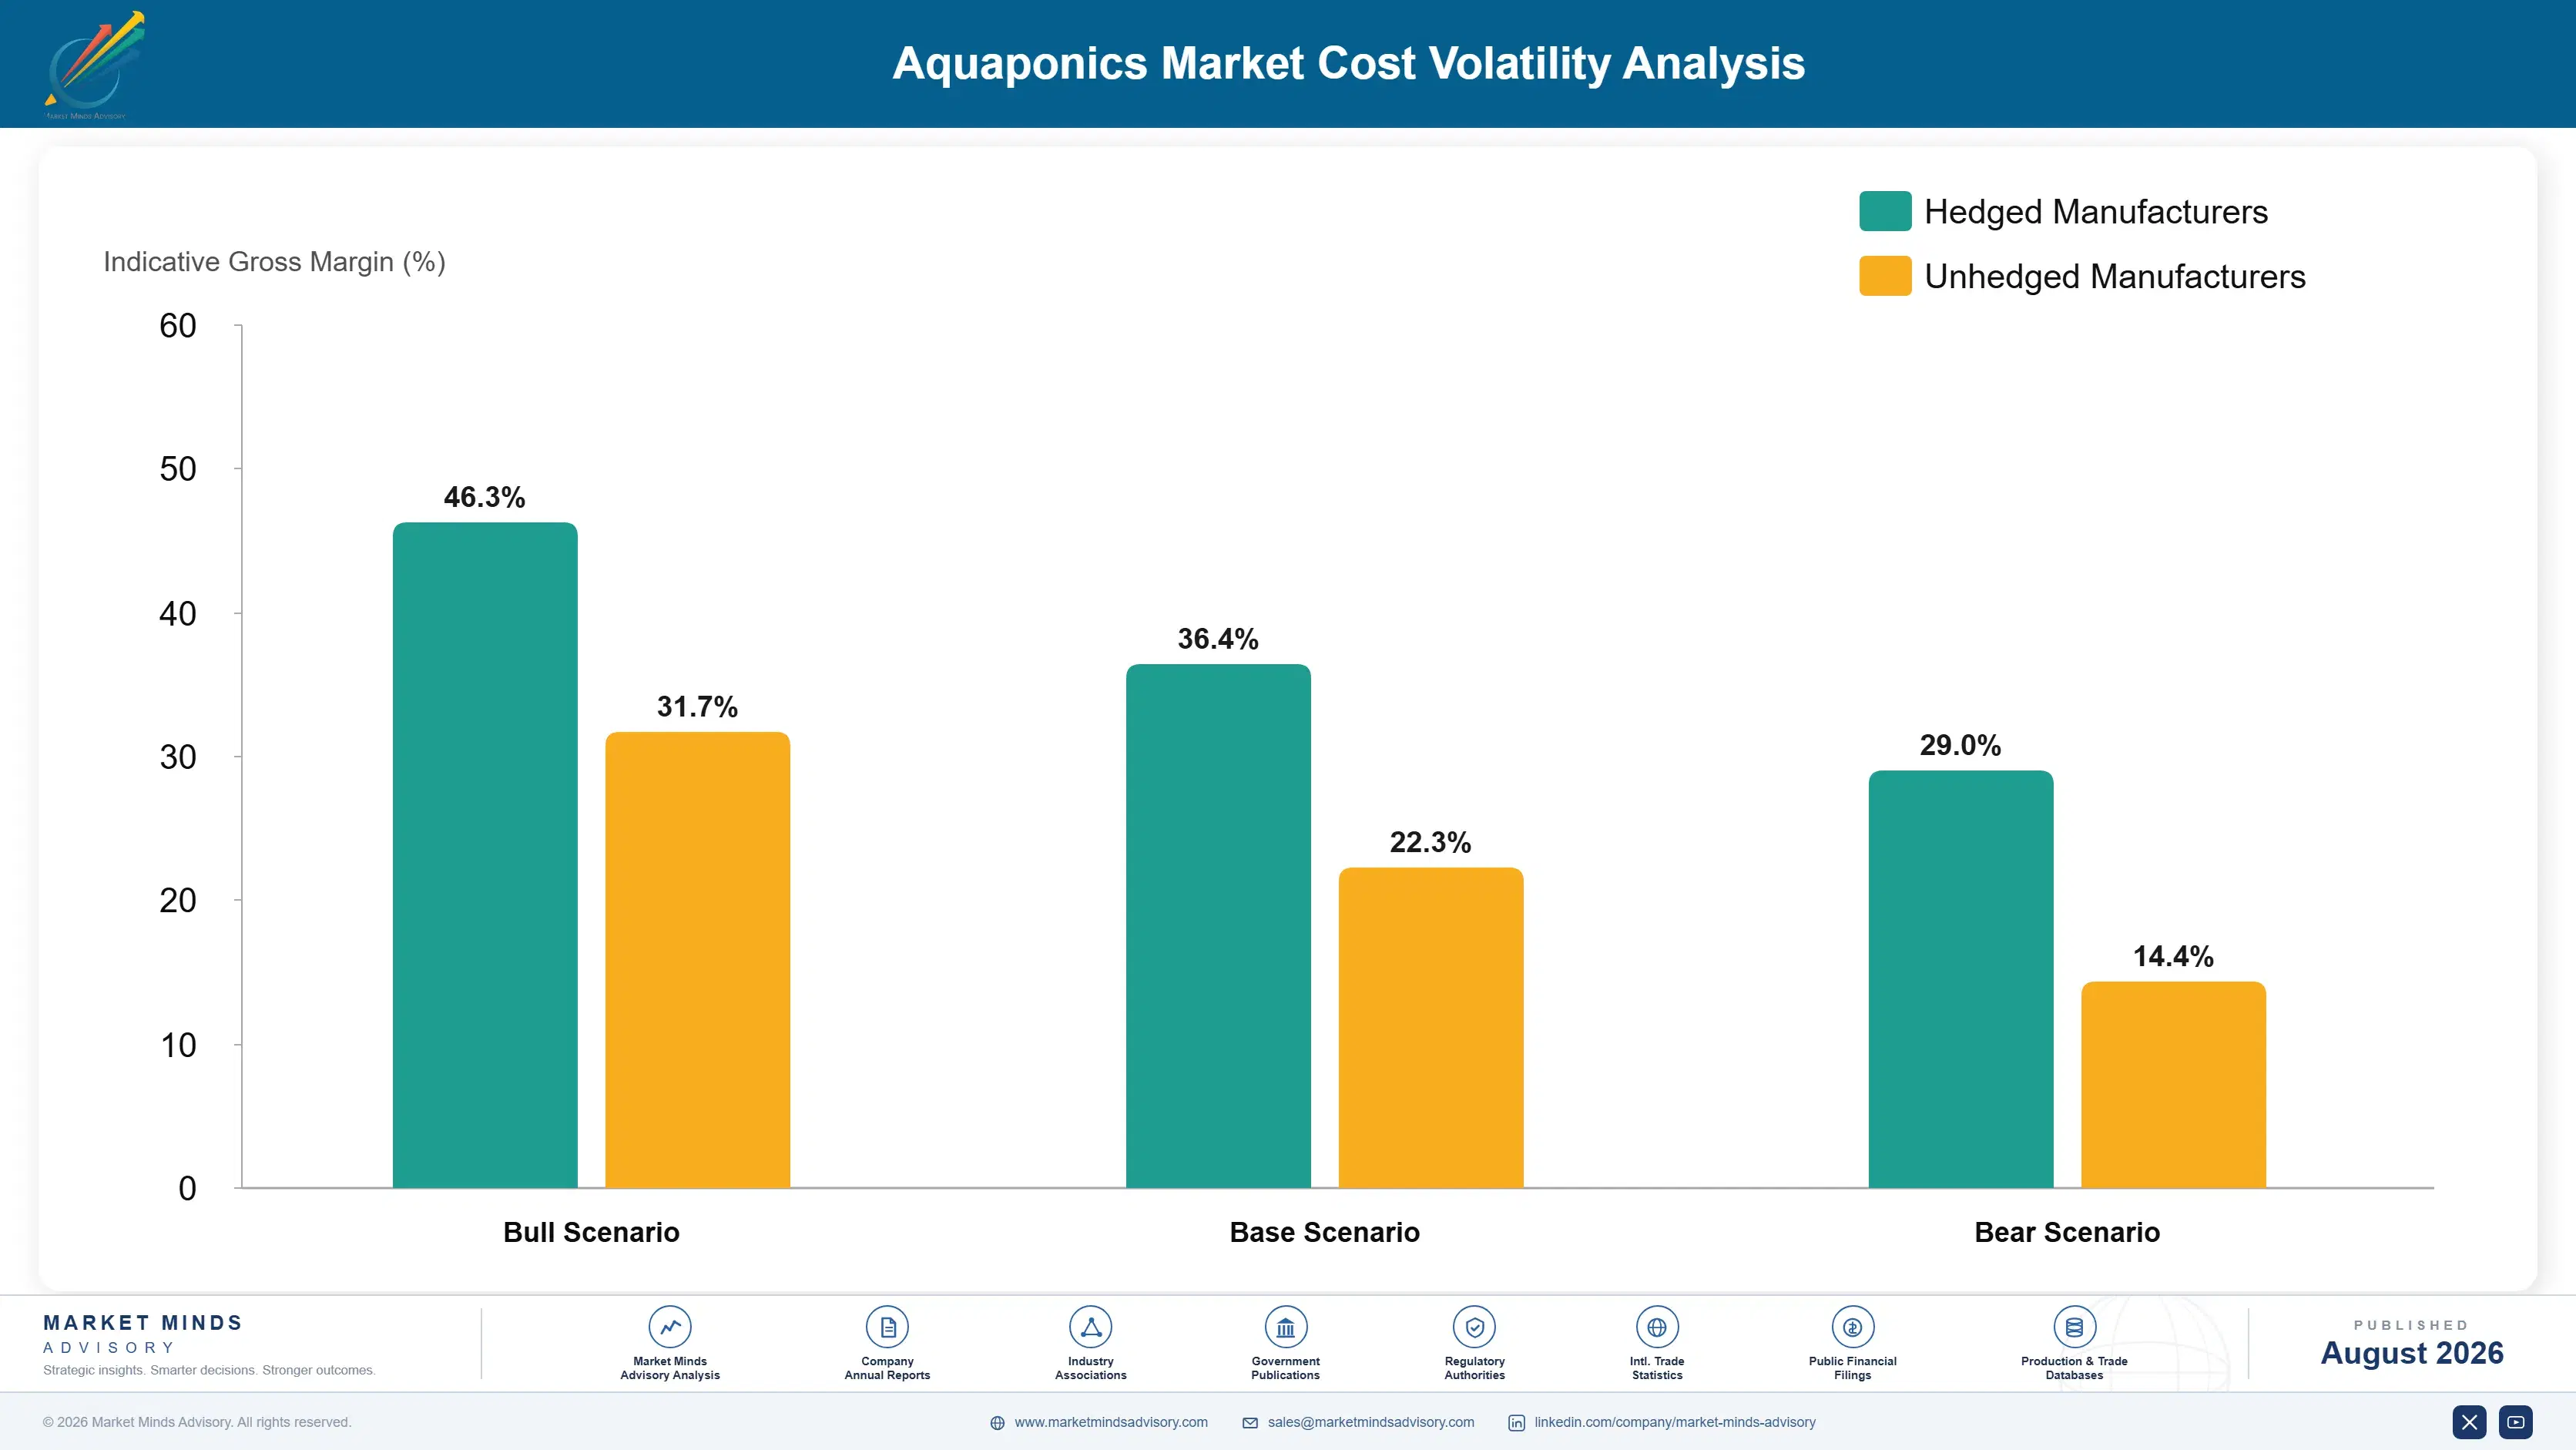
Electricity accounts for roughly 31% of operating cost, covering pumping, aeration, water heating, and supplemental lighting, drawn from grid supply in most temperate installations and increasingly from on-site solar in Gulf and Australian facilities. Fish feed contributes around 14%, priced against fishmeal and oilseed meal markets. Labour takes 27%, reflecting the dual competence a facility requires. Capital recovery, nutrient supplementation, and packaging absorb the rest.
European electricity prices for industrial users rose steeply through 2022 and remained elevated into 2023 according to IEA reporting, and aquaponic operations felt it more sharply than conventional greenhouses because pumping and aeration cannot be suspended overnight. Several commissioned European facilities ceased operation rather than continue at negative contribution. Fish feed costs rose simultaneously as Peruvian anchoveta quota disruption lifted fishmeal pricing, compounding the pressure.

Exposure varies enormously by siting and by generation arrangement rather than by scale. Facilities with on-site solar, waste heat access, or long-term power contracts held cost position through the surge. Grid-exposed temperate operators absorbed the full movement and many did not survive it. Warm-climate operators in Brazil, Mexico, and Southeast Asia carry a permanent advantage, because water heating drove much of the load that closed European farms.
aquaponics-market-cost-volatility-analysis-1787462431130

On-site generation or waste heat capture sized to base load

Pumping and aeration run continuously and predictably, which makes them well suited to on-site solar with storage or to waste heat recovery from an adjacent industrial neighbour. Sizing generation against base load rather than peak avoids overbuilding. Gulf and Australian operators have demonstrated the approach, and temperate operators without something equivalent remain one price shock away from closure.

Seasonal production scheduling matched to tariff and daylight patterns

Where supplemental lighting and heating dominate winter cost, deliberately reducing or suspending production through the worst months can beat running at negative contribution. Operators resist this because fixed costs continue, but the arithmetic frequently favours it. Scheduling high-value short-cycle crops into the strong-daylight months concentrates revenue where energy cost is naturally lowest. Fixed costs continue either way regardless.

Species selection matched to ambient water temperature ranges

Tilapia demand warm water and trout demand cold, and choosing a species that fights the local climate converts heating into a permanent operating burden. Matching species to ambient conditions removes a large share of the thermal load before any efficiency measure is considered. Several failed temperate operations were running tropical species in heated water throughout winter.

Portfolio Architecture for Margin Defence

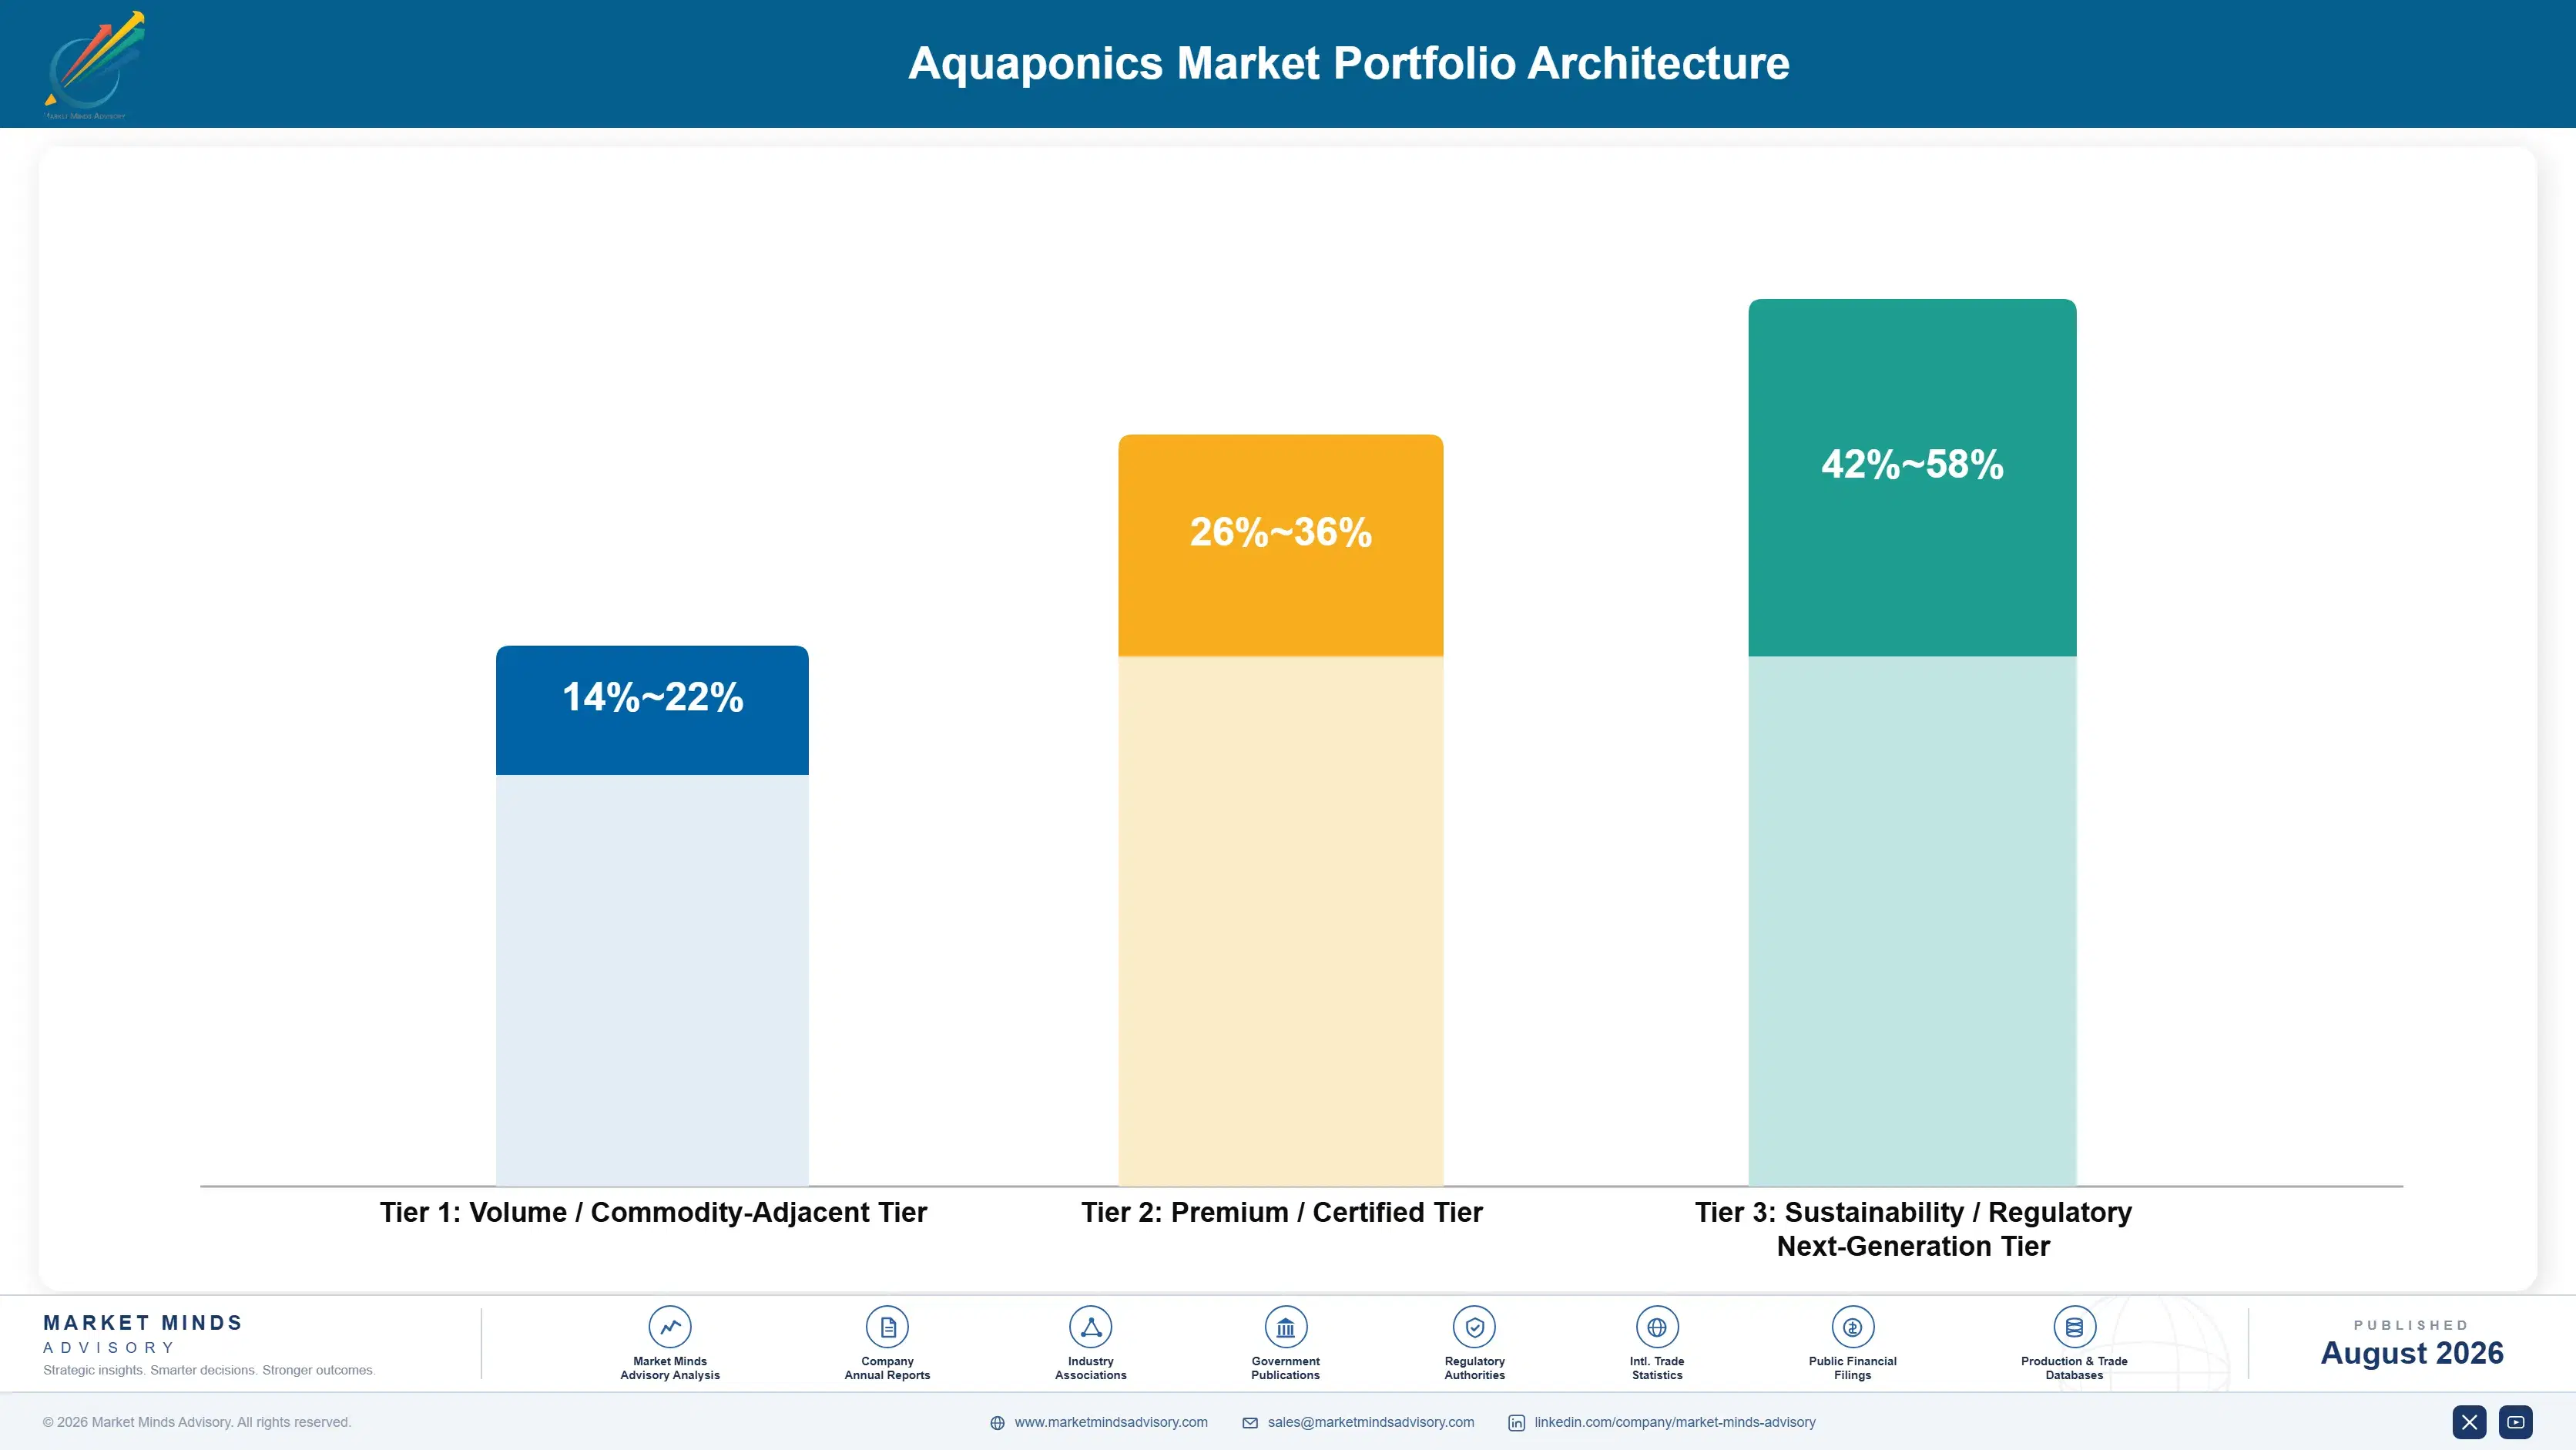
Three tiers separate on who bears the operating risk. Turnkey commercial system builds sold on installed cost earn 14% to 22% and expose the integrator to a customer base with a poor survival record. Institutional and educational installations with training and maintenance contracts earn 26% to 36%, because buyers value support over price. Service, monitoring, and agronomy subscriptions earn most of all, and they are the only tier whose revenue recurs.
The tension is that hardware volume funds the service capability but attracts exactly the customers least likely to survive. Integrators chasing installed square metres have repeatedly built revenue on ventures that closed within five years, destroying reference sites and financing reputation together. The operators performing best now qualify customers on energy arrangements and crop plan before quoting, declining projects that fail those tests even when the capital is available.

High-value pools sit where the buyer is not testing a payback calculation. Institutional procurement, sovereign food security programmes, and service subscriptions attached to surviving farms all generate revenue insulated from the commercial economics that have defeated most private aquaponic ventures. Those three pools hold the sector's durable revenue, and they are not where capital has gone.

Volume / Commodity-Adjacent Tier

Turnkey commercial system builds and household kit sales competing on installed cost per square metre. Exposed to a customer base with high failure rates. The wide range reflects large differences between bespoke engineering projects and standardised packaged installations.
Gross Margin: 14%-22%

Premium / Certified Tier

Institutional and educational installations supplied with training, curriculum, and maintenance contracts through public procurement. Buyers pay for support rather than price. Range width separates simple demonstration units from fully supported multi-year institutional programmes within the tier.
Gross Margin: 26%-36%

Sustainability / Regulatory / Next-Generation Tier

Remote monitoring, agronomy subscription, decoupled multi-loop engineering, and integrated generation design. Recurring revenue and accumulated operating data, rather than hardware margin, sustain the economics across this tier throughout the forecast period.
Gross Margin: 42%-58%
aquaponics-market-portfolio-architecture-1787462431633

High-value Sub-segments and Strategic Watch-out

Monitoring and Agronomy Subscriptions

Highest value in the market and the only recurring revenue available. Adds $18,000 to $40,000 per commercial site annually while keeping customers operating, which protects repeat sales. Accumulated cross-site operating data is an asset no single farm can build alone. Nothing else in this market recurs.
Gross Margin: 48%-58%

Sovereign Food Security Installations

High value with strong growth, funded by Gulf and North African programmes where water scarcity, cheap solar, and policy capital align uniquely. Buyers do not apply commercial payback tests. Range width separates equipment supply from full engineering and operating contracts. Payback tests do not apply here.
Gross Margin: 30%-42%

Turnkey Commercial Greenhouse Builds

The volume core and the position carrying the sector's failure record. It generates the revenue that funds service capability, but customers should be qualified on energy arrangements and crop plan before quoting, not merely on their ability to pay. Qualify the customer, not just the order.
Gross Margin: 12%-20%

Vertical Urban Production Systems

The strategic watch-out. Fastest growth at 16.8% and the highest failure rate, because supplemental lighting pushes energy toward half of operating cost. Viable only with subsidised power or a retail contract priced well above field produce benchmarks. Growth rate and failure rate move together in this segment.
Gross Margin: 16%-28%

Why Retail Contracts Decide Survival

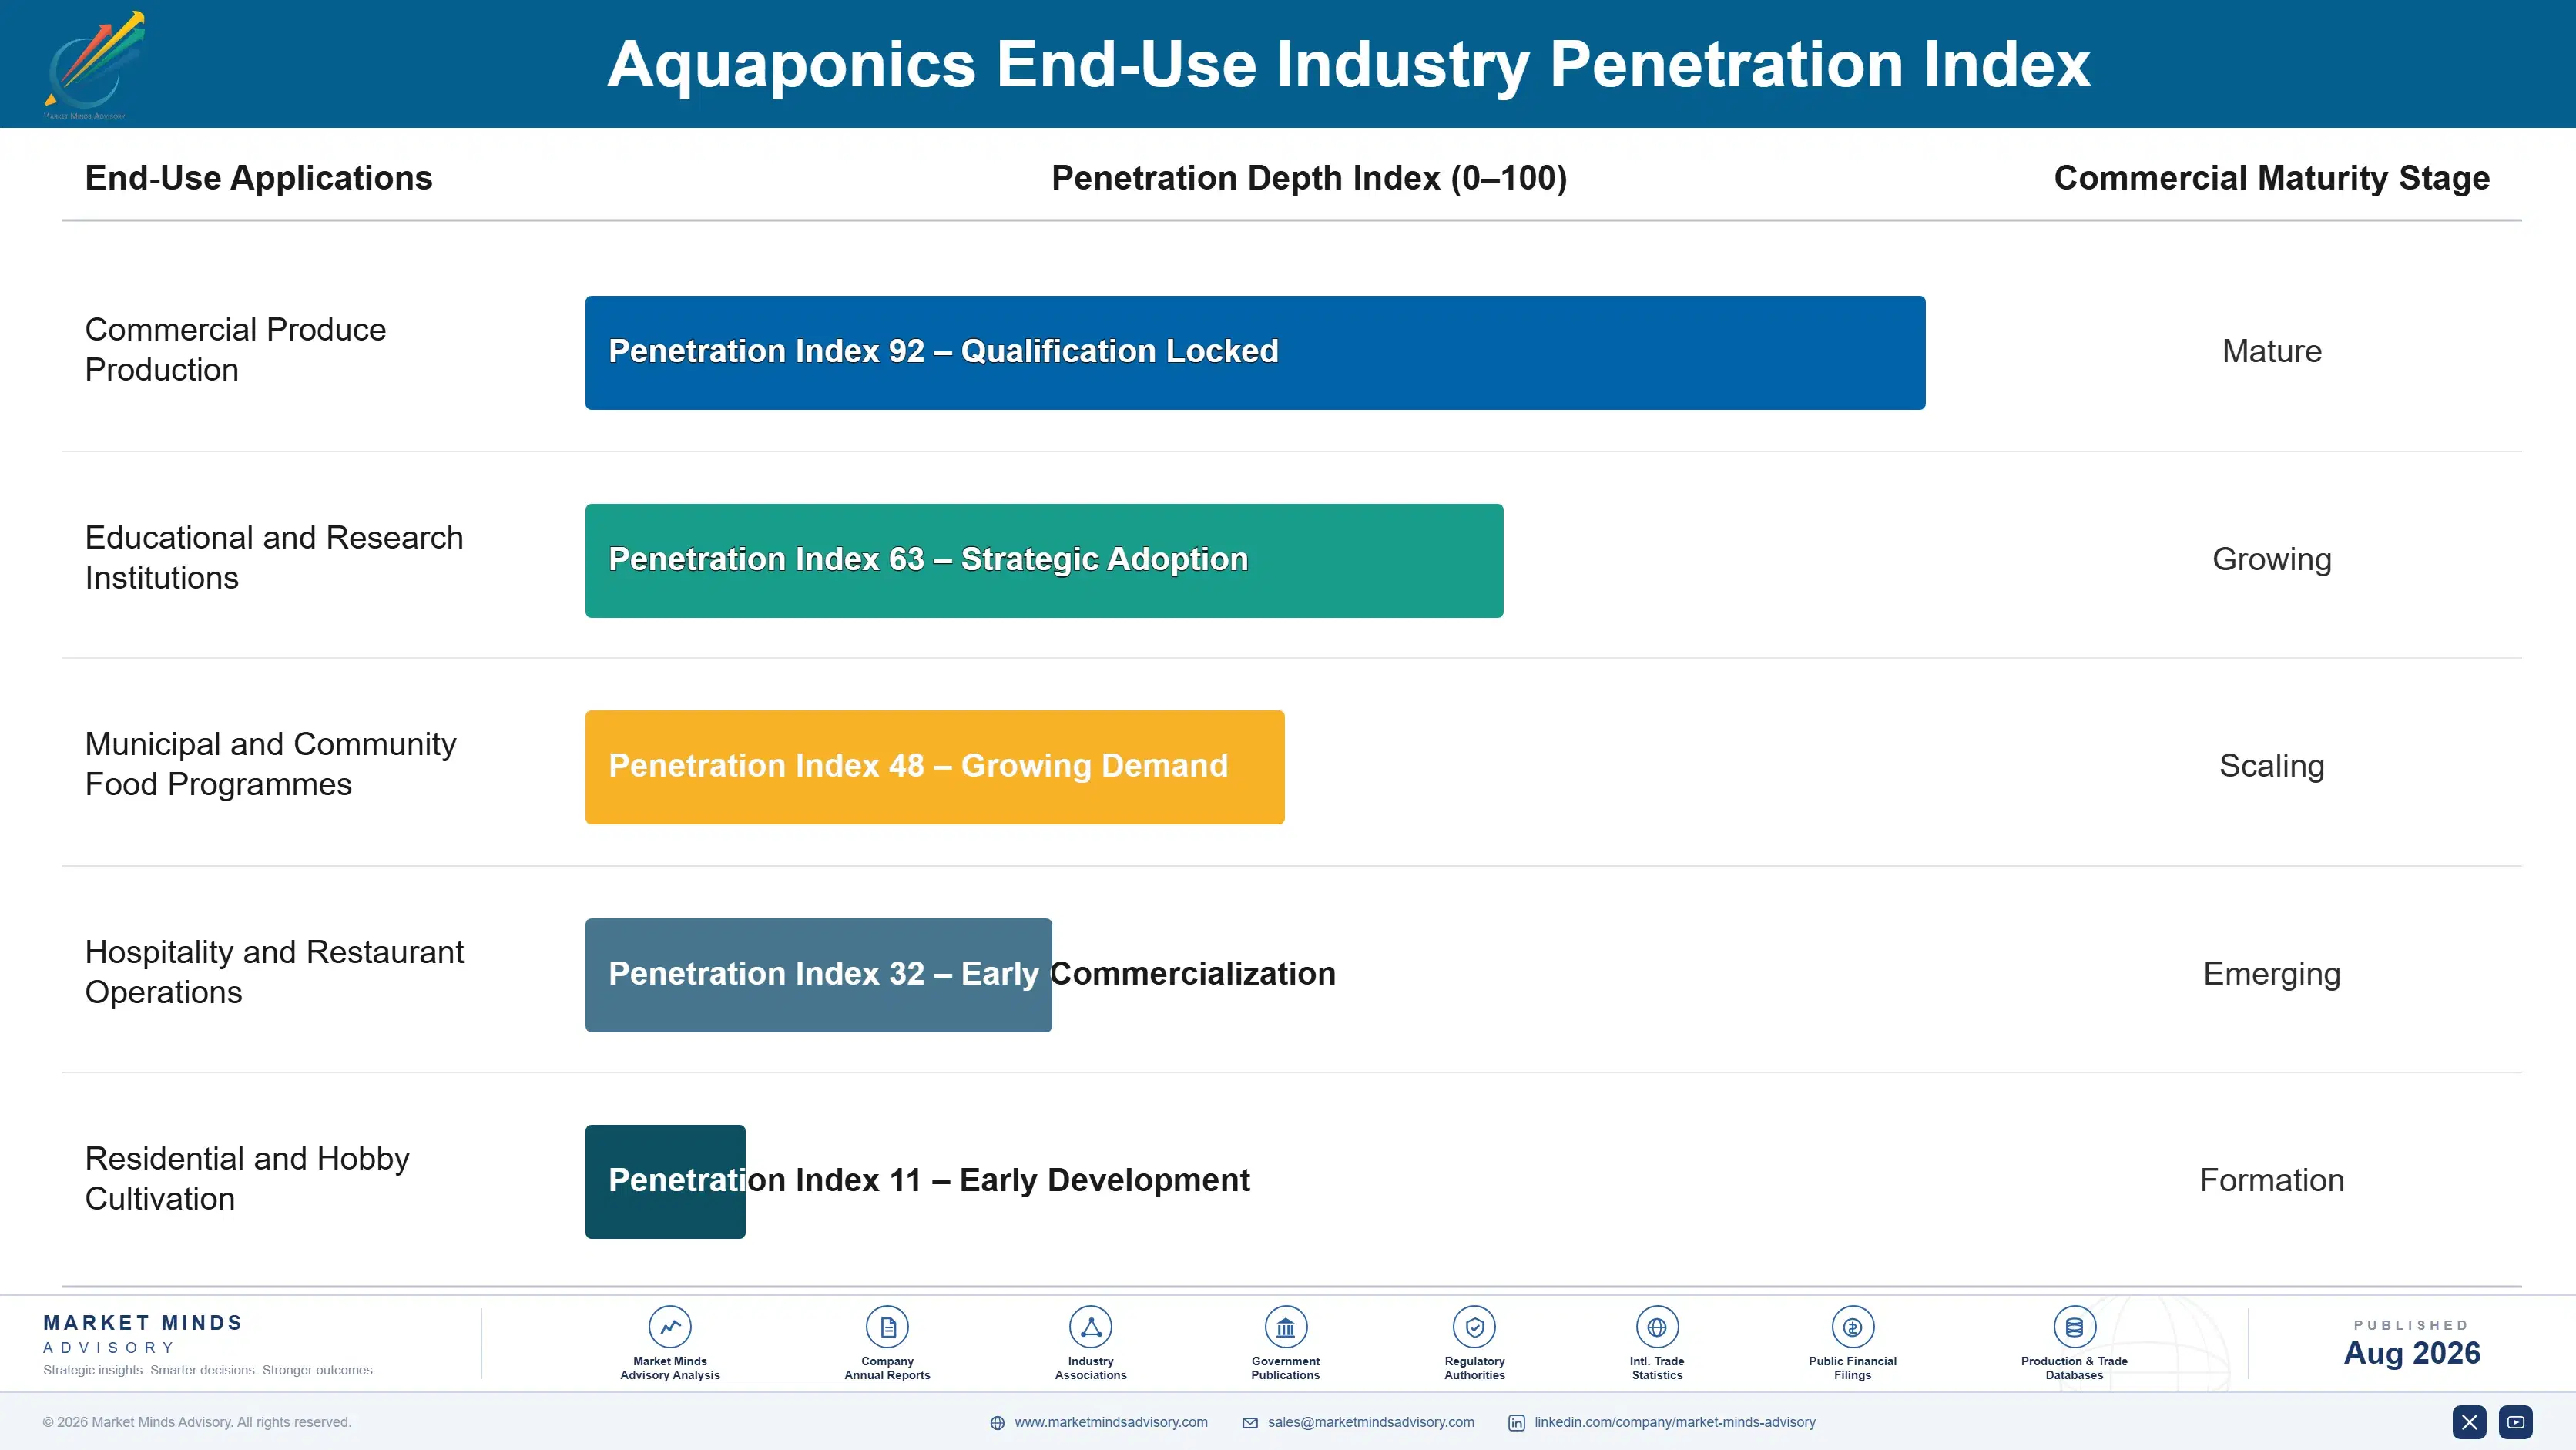
Aquaponic revenue behaves as an annuity only at the retail contract level, and that is the layer most operators neglect. A grower who secures a multi-year supply agreement with a premium retailer or foodservice group at pricing above field produce has a business; one selling into wholesale spot markets does not, whatever the system efficiency. Typical retail supply agreements run three to five years, and the qualification work behind them takes a season of consistent delivery to earn.
Stickiness varies sharply by customer type. Institutional installations are the most durable of all, since public budgets renew on cycles and curriculum programmes rarely get dismantled once established. Premium chefs and specialist retailers buying short-shelf-life crops come next, because proximity genuinely matters and substitution is difficult. Wholesale leafy green supply is the least sticky, retendered constantly against field production and offering an aquaponic operator no defensible position whatsoever.

Buyer profiles have shifted considerably. Retail sustainability teams now ask about water use and pesticide status before pricing, and municipal procurement increasingly writes local production and educational access into tender criteria rather than treating them as optional extras. That shift favours operators who can document water use and pesticide status precisely.
aquaponics-market-end-use-penetration-index-1787462432124

Where Aquaponics Capital Should Go

These are among the four positions where our research anticipates prominent divergence between winners and laggards over the coming forecast period. Each is grounded in the demand model, the regulatory perimeter, and the announced capacity pipeline.
01 / ENERGY INDEPENDENCE INVESTMENT

Fix electricity exposure before anything else in the business case

Electricity is roughly 31% of operating cost and the variable that has closed most failed ventures, while water savings, the thing everyone markets, have never really been the problem. On-site solar, waste heat capture, or long-term power contracts cut delivered energy cost by 35% to 55% depending on latitude and industrial neighbours, at capital of around $600,000 for a mid-sized commercial greenhouse. Gulf and Australian operators have proven this works, and temperate operators without it remain one price shock away from closure.
02 / CROP SELECTION DISCIPLINE

Stop growing lettuce and start growing what cannot travel

Commodity leafy greens are produced everywhere at scale and priced accordingly, which is precisely why competing on them has bankrupted so many aquaponic ventures over the past decade. Living herbs, micro-greens, edible flowers, and delicate varietals lose quality within a day of harvest, so proximity becomes worth real money rather than remaining a marketing claim on a label. These crops earn three to six times commodity lettuce pricing per square metre, which is what a high fixed-cost facility actually needs.
03 / RECURRING SERVICE REVENUE

Sell agronomy and monitoring, not just hardware and commissioning

Integrators who deliver a system and then leave watch roughly two in five customers fail within five years, destroying both repeat business and the reference sites that would have won the next project. Monitoring, water chemistry support, and agronomy subscriptions add $18,000 to $40,000 per commercial site annually at very high margin, and more importantly they keep those customers alive and expanding capacity. The accumulated cross-site operating data becomes an asset that no individual farm could ever assemble on its own.
04 / CUSTOMER QUALIFICATION STANDARDS

Decline projects that fail the energy and crop plan tests

The sector's financing reputation has been damaged by a failure rate near 43% within five years, and integrators contributed to that by quoting every project where the capital was available regardless of viability. Qualifying customers on generation arrangements, species and climate match, and committed retail pricing before quoting will lose some revenue in the short term. It will also stop building a portfolio of reference sites that close, which has cost the industry considerably more than the declined projects ever would.

Engagement Snapshot From the Field

A live engagement with an industry participant carrying material or product regulatory and market exposure ahead of a defining policy shift, showing how our research translates into a defensible multi-year portfolio strategy.
MARKET MINDS ADVISORY · CLIENT ENGAGEMENT SUMMARY
Aquaponics Producer Strategic Portfolio Review and Transition Roadmap 2026·Investment Scenario on Aquaponics Exposure Evaluation 2025-26
CLIENT PROFILE
A Northern European commercial aquaponic operator running a single greenhouse facility producing tilapia alongside leafy greens and herbs, with annual revenue near EUR 4.6 million (client-reported, unverified by MMA). Roughly 78% of produce volume went into wholesale leafy green supply at prices benchmarked against imported field production, and the facility drew entirely on grid electricity with no generation arrangement of any kind.
STRATEGIC CHALLENGE
Electricity costs had risen sharply and stayed elevated, pushing energy above a third of operating cost and taking the operation to negative contribution during winter months. The absence of European organic certification removed any premium channel, tilapia required continuous water heating in a cold climate, and the board was weighing closure against a capital raise nobody had yet agreed to underwrite.
MMA APPROACH
MMA rebuilt facility economics month by month against actual delivered energy cost rather than annual averages, isolating which crops and which months generated positive contribution. Species alternatives were assessed against ambient water temperature and local demand. Retail and foodservice channels were sized for short-shelf-life crops, and generation options costed. Findings were tested through 47 expert interviews during Q4 2025.
KEY FINDINGS
  1. Wholesale leafy green supply, at 78% of volume, generated negative contribution across five months of the year once actual delivered electricity cost was correctly allocated.
  2. Switching from tilapia to trout would remove most winter water heating load, since the species suits ambient temperatures the facility already fights to raise continuously.
  3. Living herbs and micro-greens sold to regional chefs and specialist retailers were achieving 4.3 times the per-square-metre revenue of the wholesale leafy green lines.
  4. A rooftop solar installation with storage would cut delivered energy cost by an estimated 38% annually and pay back within six years at prevailing tariffs.
CLIENT PROFILE
A Northern European commercial aquaponic operator running a single greenhouse facility producing tilapia alongside leafy greens and herbs, with annual revenue near EUR 4.6 million (client-reported, unverified by MMA). Roughly 78% of produce volume went into wholesale leafy green supply at prices benchmarked against imported field production, and the facility drew entirely on grid electricity with no generation arrangement of any kind.
STRATEGIC CHALLENGE
Electricity costs had risen sharply and stayed elevated, pushing energy above a third of operating cost and taking the operation to negative contribution during winter months. The absence of European organic certification removed any premium channel, tilapia required continuous water heating in a cold climate, and the board was weighing closure against a capital raise nobody had yet agreed to underwrite.
MMA APPROACH
MMA rebuilt facility economics month by month against actual delivered energy cost rather than annual averages, isolating which crops and which months generated positive contribution. Species alternatives were assessed against ambient water temperature and local demand. Retail and foodservice channels were sized for short-shelf-life crops, and generation options costed. Findings were tested through 47 expert interviews during Q4 2025.
KEY FINDINGS
  1. Wholesale leafy green supply, at 78% of volume, generated negative contribution across five months of the year once actual delivered electricity cost was correctly allocated.
  2. Switching from tilapia to trout would remove most winter water heating load, since the species suits ambient temperatures the facility already fights to raise continuously.
  3. Living herbs and micro-greens sold to regional chefs and specialist retailers were achieving 4.3 times the per-square-metre revenue of the wholesale leafy green lines.
  4. A rooftop solar installation with storage would cut delivered energy cost by an estimated 38% annually and pay back within six years at prevailing tariffs.
RECOMMENDED STRATEGY
Phase 1: Phase 1 (months one to five): exit wholesale leafy green supply, suspend production across the two worst winter months, and reprice remaining output. Phase 2: Phase 2 (months six to fourteen): convert the aquaculture loop from tilapia to trout and build direct chef and specialist retail channels for short-shelf-life crops. Phase 3: Phase 3 (months fifteen to twenty-six): commission rooftop solar with storage sized against continuous pumping and aeration base load requirements.
OUTCOME
The operator exited wholesale supply and reported contribution margin moving from negative to 21% within thirteen months on roughly a third less volume (client-reported, unverified by MMA). The species conversion completed ahead of the second winter. Solar commissioning is scheduled for 2027 and the closure decision was withdrawn.

Frequently Asked Questions

Foundational context covering the market sizes, CAGR, scope, country, region and competition that inform every finding below. This section is provided to cover basics and most often pre-purchase conversations, answered from the MMA Primary Research Dataset.

What is the current size of the Aquaponics Market?

The market was valued at USD 1.5 billion in 2025, rising to an estimated USD 1.69 billion in 2026. East Asia holds the largest regional share at 30% of global value.

How large will the Aquaponics Market be by 2036?

MMA forecasts USD 5.42 billion by 2036 under the base case, an expansion multiple of 3.21 times the 2026 level. Incremental value creation across the period reaches USD 3.73 billion.

What is the CAGR for the Aquaponics Market 2026 to 2036?

The base case CAGR is 12.4%, with a bull case of 13.7% and a bear case of 11.1%. Historical growth between 2020 and 2025 ran at 11.0%, concealing substantial operator churn.

Which segment is growing fastest?

Vertical tower systems, at 16.8%, roughly 1.35 times the overall market rate. They multiply growing area within a footprint but push energy costs toward half of operating expenditure.

Who are the major companies in the Aquaponics Market?

Pentair, Nelson and Pade, Superior Fresh, ECF Farmsystems, and Priva lead, though the top five hold only about 12% of installed capacity. Ridder and Certhon follow in controls.

Which country is growing fastest?

The United Arab Emirates, at 15.8%, driven by national food security funding where desalinated water is costly and solar generation is cheap. Commercial return requirements are relaxed there.

Report Segmentation Architecture

The full report scope spans multiple orthogonal segmentation dimensions, with cross-tabulated demand data provided for each dimension pair. Coverage extends further to regional breakdowns, trend trajectories, and the competitive detail needed to support segment-level decision-making.

By Growing Subsystem Architecture

  • Deep Water Culture Raft Systems
  • Nutrient Film Technique Systems
  • Media Bed Systems
  • Vertical Tower Systems
  • Aeroponic Systems
  • Substrate Trough and Wicking Systems

By End-Use Industry

  • Commercial Produce Production
  • Educational and Research Institutions
  • Municipal and Community Food Programmes
  • Hospitality and Restaurant Operations
  • Residential and Hobby Cultivation

By Commercial Dimension

  • Turnkey Integrated System Supply
  • Component and Controls Supply
  • Engineering and Consulting Services
  • Monitoring and Agronomy Subscription

By Region

  • North America
  • Western Europe
  • East Asia
  • South Asia and Pacific
  • Latin America
  • Middle East and Africa
  • Eastern Europe

Scope, Methodology, and Coverage

Every figure in this report is reproducible from documented input assumptions. The scope below maps the historical period, the forecast horizon, the segmentation dimensions, and the countries covered, alongside the underlying primary and qualitative methodology.
Historical Period
2020 to 2025
Forecast Period
2026 to 2036
Base Year
2025 (USD billions; MMA Primary Research Dataset, August 2026)
Market Definition
The market comprises integrated aquaponic production systems combining recirculating aquaculture with soilless plant cultivation, valued as installed system value together with equipment, controls, engineering, and recurring service revenue supplied to commercial, institutional, and household operators. Coverage spans deep water culture, nutrient film technique, media bed, vertical tower, aeroponic, and substrate trough architectures. Standalone hydroponic and standalone recirculating aquaculture installations, and the wholesale value of harvested produce and fish, fall outside scope.
Quantitative Units
USD billions (current prices); square metres of installed growing area; USD per square metre installed cost
Segmentation Dimensions
By Growing Subsystem Architecture; By End-Use Industry; By Commercial Dimension; By Region
Regions Covered
North America, Western Europe, East Asia, South Asia and Pacific, Latin America, Middle East and Africa, Eastern Europe
Countries Covered
USA, China, Germany, France, UK, Japan, South Korea, India, Australia, Canada, Brazil, Mexico, Indonesia, Vietnam, Thailand, Malaysia, UAE, Saudi Arabia, South Africa, Nigeria, Turkey, Poland, Netherlands, Italy, Spain, Sweden, Switzerland, Argentina, Colombia, Singapore, and additional markets relevant to this sector
Key Companies Profiled
Pentair, Nelson and Pade, Superior Fresh, ECF Farmsystems, Priva, Hydrofarm Holdings, Signify, Argus Control Systems, The Aquaponic Source, Bioaqua Farm, GreenLife Farms, Urban Crop Solutions, Ridder, Certhon, Autogrow Systems, Aquaponic Lynx, Symbiotic Aquaponic, Green Acre Aquaponics, Aponic Ltd, Water Farmers Aquaponics
Quantitative Methodology
Primary survey, n=3,800 respondents, Q4 2025, six countries; demand-side model with trade association cross-validation
Qualitative Methodology
47 expert interviews, Q4 2025; applied to validate demand model assumptions, identify emerging dynamics, and assess competitive positioning
Report Format
PDF and XLSX data workbook (Word format preview document)
Publisher
Market Minds Advisory
Report Code
MMA-2026-AGR-129
Published
August 2026
Contact
sales@marketmindsadvisory.com | www.marketmindsadvisory.com

Purchase the full Aquaponics Market Report (2026 to 2036).

The full report sizes aquaponic system demand across six growing architectures and seven regions with 2026 to 2036 forecasts under base, bull, and bear cases. It models facility operating economics against delivered electricity cost by latitude and generation arrangement, showing precisely where commercial viability begins and ends. Competitive profiles cover twenty suppliers assessed consistently on installed system value, service capability, and controls depth. Regulatory analysis maps organic certification eligibility, food security funding programmes, and municipal procurement criteria by jurisdiction. Commercial guidance addresses generation investment, crop selection, service revenue, and customer qualification standards.
Six growing architectures sized and forecast separately
Facility economics modelled against delivered electricity cost
Twenty supplier profiles on consistent installed value basis
Organic certification eligibility mapped across major jurisdictions
Commercial failure analysis across five years of closures
Generation and waste heat investment payback benchmarks included

Built For The People Who Decide

From boardroom strategy to bench-side execution, this report is read cover-to-cover by leaders shaping the next decade of their industry, turning demand scenarios, market dynamics and valuation benchmarks into decisions.
CXOs/ Presidents/ VPs/ Managers
M&A and Corporate Development
Strategy Teams and R&D Heads
Procurement and Product Directors
Regulatory and Compliance Leaders
Investor Relations and Equity Analysts