Market Minds Advisory
Aquaculture Nutrition Market

Aquaculture Nutrition Market: The Omega-3 Ceiling, Weaning Diet Economics, and Feed Conversion as the Only Real Lever

Feed is roughly two-thirds of what it costs to grow a fish, and the long-chain omega-3 supply that salmon diets depend on has been effectively fixed since the anchoveta quota system began.

Lead Analyst

Lisa Gevelber

Published

September 2026

Make Smarter Decisions with Customized Research Insights

Request a free sample report and evaluate market opportunities, growth trends, and competitive dynamics relevant to your business needs.

2025 MARKET VALUE$68.5BMarket Size 2025
2036 FORECAST VALUE$158.1BBase Case , 2026 to 2036
CAGR 2026 TO 20367.9 %Bull 9.2% / Bear 6.6%
INCREMENTAL OPPORTUNITY$84.2BNet 10- year value creation
EXPANSION MULTIPLE2.14x2036 value over 2026 base
Strategic Levers
M&A Pipeline
Regional Outlook
Country Rankings
Competitive Intelligence
Segmental Deep-dive
Call-Us : 91 93563 13602

Executive Snapshot and Market Trajectory

Feed is roughly 62% of aquaculture production cost, which makes the nutrition supplier the single most consequential vendor a fish farmer deals with. Everything else, genetics, equipment, health products, matters at the margin. Feed conversion decides whether a farm makes money, and everyone in the chain knows it.
Commercial power sits with suppliers who can formulate around marine ingredient scarcity without losing performance. Long-chain omega-3 supply is effectively fixed by fishery quota, so salmon diets have fallen to around 9% marine inclusion and the shortfall now comes from algal oil, modified canola, and rendered sources. Transition and weaning nutrition grows fastest at 12.8%, roughly 1.62 times the market. East Asia holds 30% of value.
Concentration is moderate at roughly 44% for the top five, with Skretting, BioMar, and Cargill dominating salmonid supply while Haid, Tongwei, and Charoen Pokphand handle the far larger Asian volume in carp, tilapia, and shrimp. The gap between those two worlds is enormous: a salmon diet costs several times a carp diet per tonne and carries formulation work that Asian volume feeds simply do not require or reward. Two businesses, one balance sheet.
Market Definition
This report covers nutritional products supplied to aquaculture producers, spanning hatchery and larval nutrition, nursery and starter feed, grow-out compound feed, finishing and pre-harvest diets, broodstock and maturation feed, and transition and weaning nutrition. Value is measured at feed product level as sold to farms, hatcheries, and integrators. Live feed organisms produced on farm, aquaculture equipment, veterinary medicines, water treatment chemicals, and standalone feed ingredients sold to feed mills fall outside scope.
Base Year Value
$68.5B in 2025 (MMA Primary Research Dataset, August 2026)
Forecast Period
2026 to 2036, eleven discrete annual values
CAGR
7.9% base case. Bull 9.2%. Bear 6.6%.
Fastest Growth Segment
Transition and Weaning Nutrition: 12.8% CAGR
Fastest Growth Country
Vietnam: 11.3% CAGR
Fastest Growth Region
South Asia and Pacific: 10.1% CAGR
Largest Region
East Asia: 30% of 2025 global value
Market Leaders
Skretting, BioMar Group, Cargill Aqua Nutrition, Guangdong Haid Group, Charoen Pokphand Foods. Source: MMA Analysis based on company annual reports.
Primary Survey
n=3,800 procurement and R&D decision-makers, Q4 2025, six countries
Methodology
Demand-side build-up, cross-validated against public data, 47 expert interviews

Aquaculture Nutrition Market Forecast Scenarios

aquaculture-nutrition-market-trends-size-forecast-scenario-1787462381713
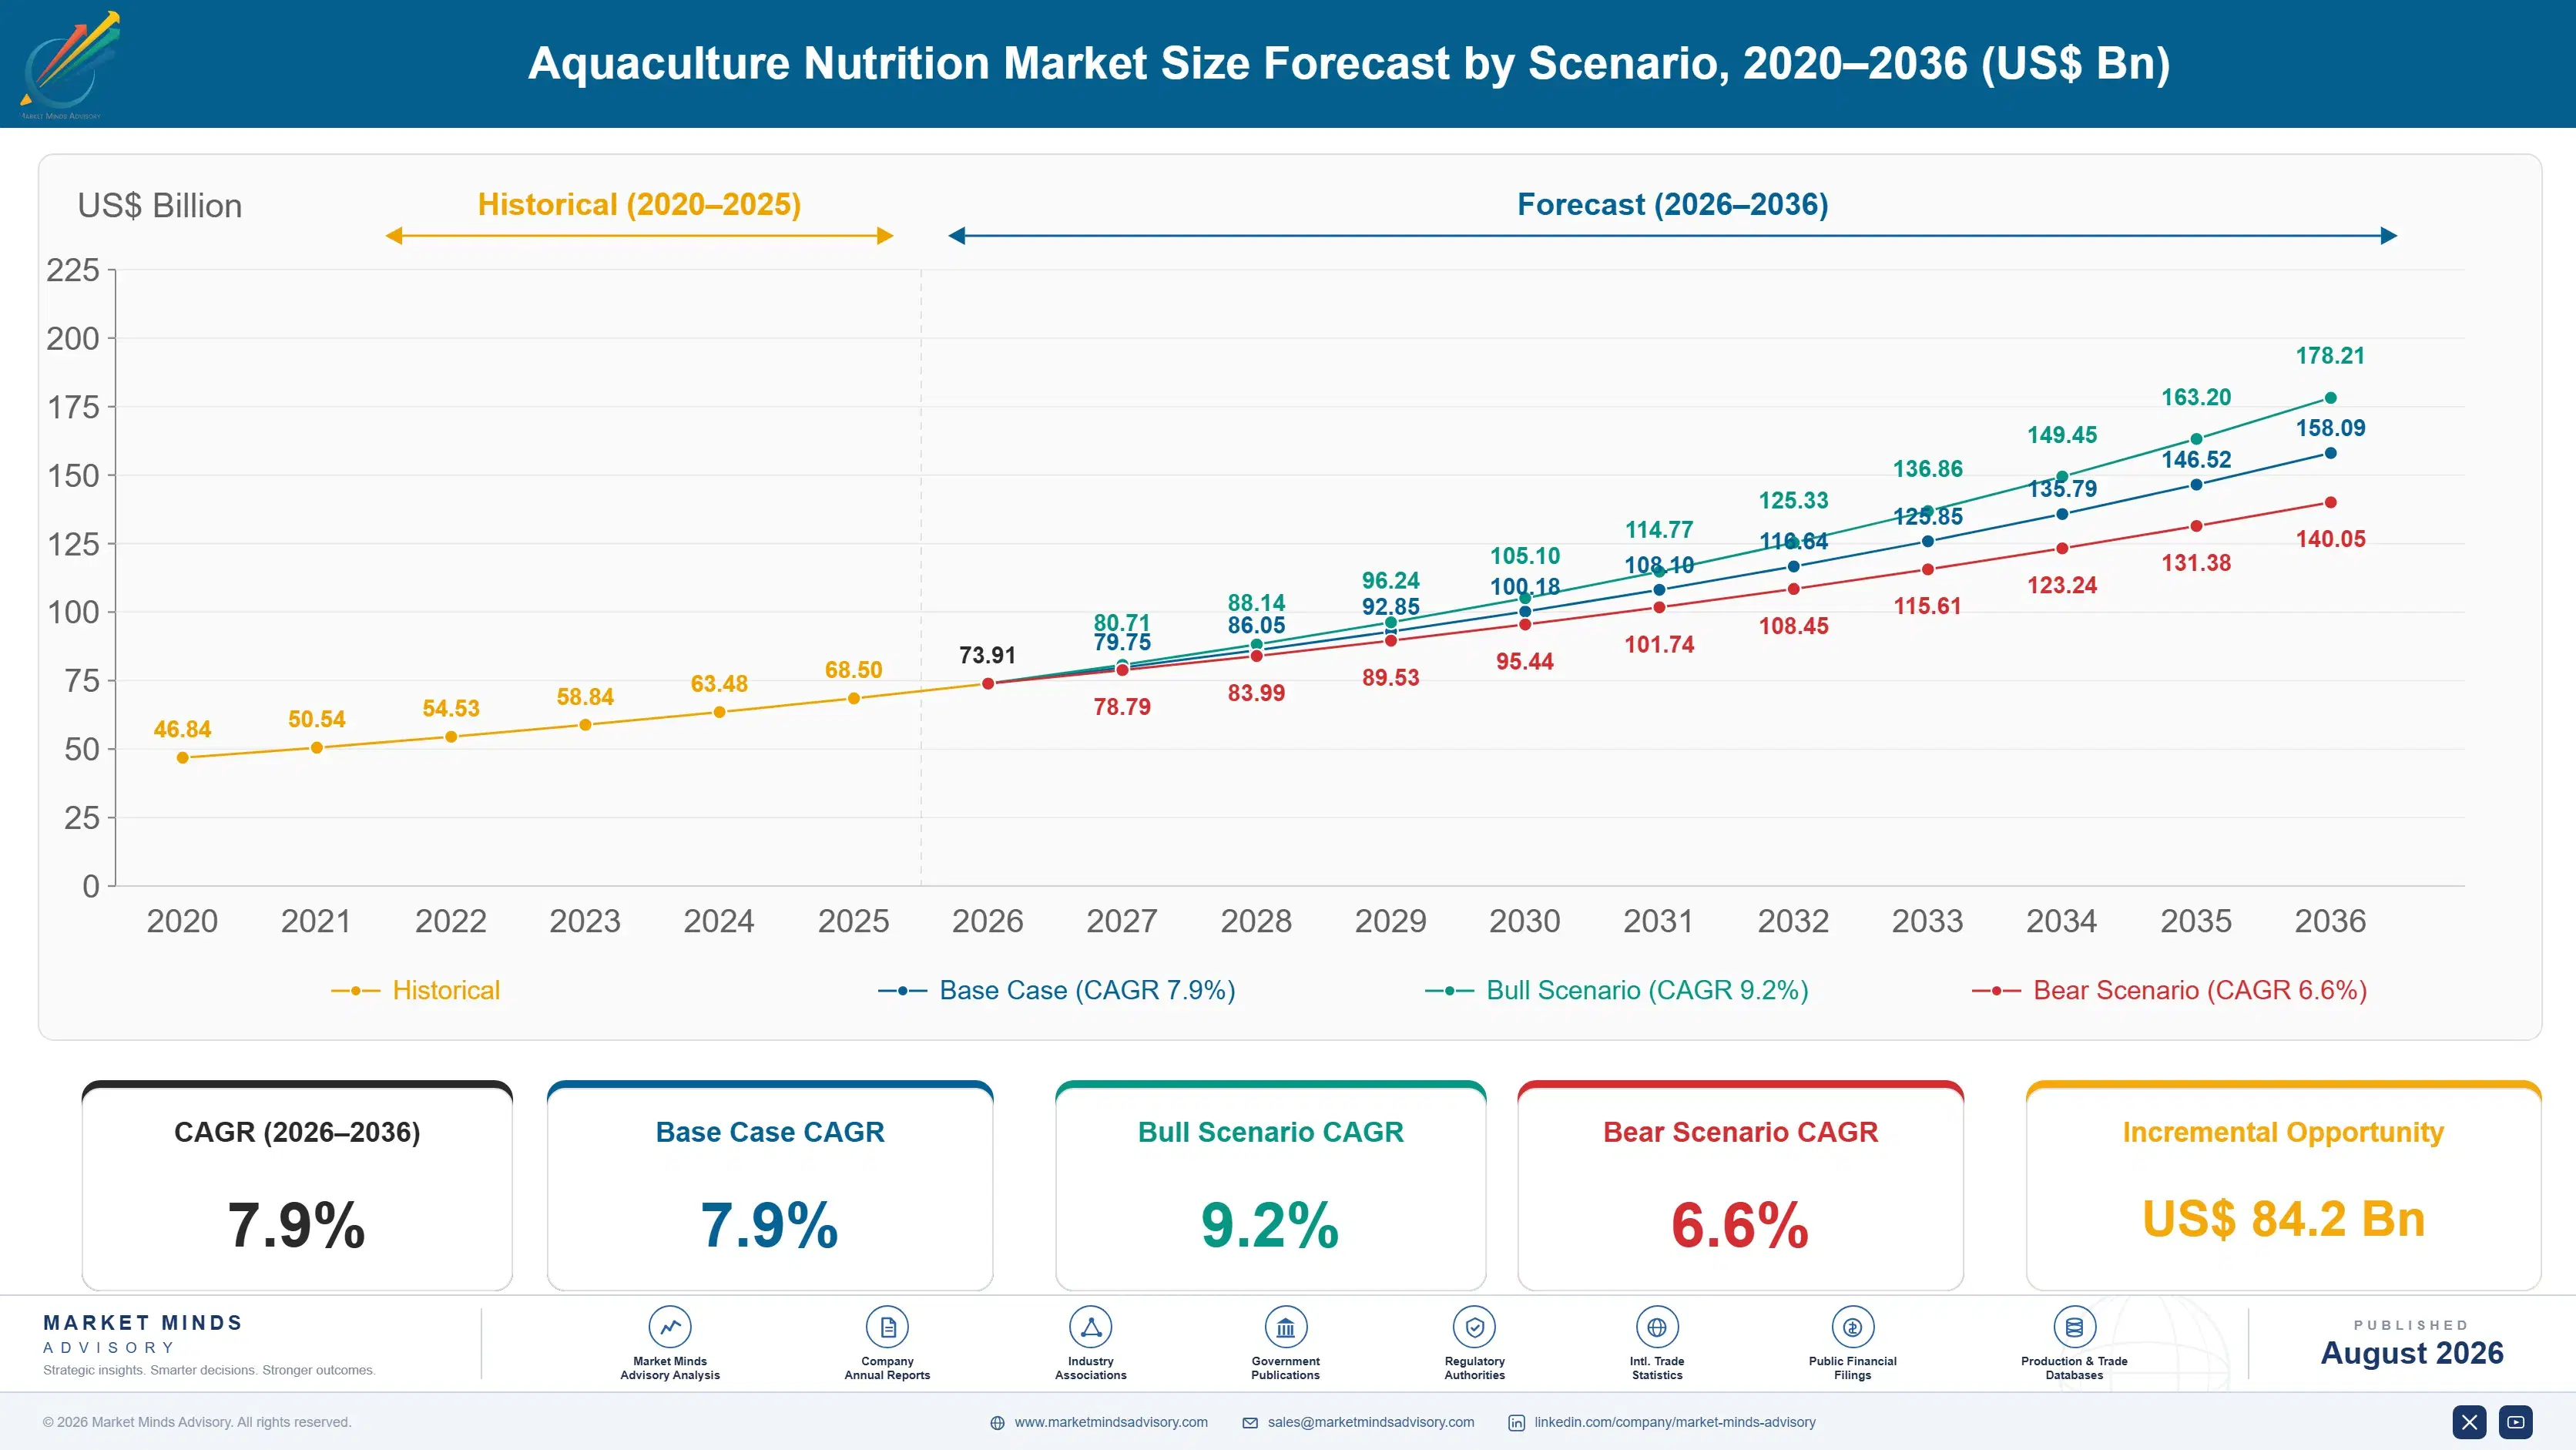
The 2020 to 2025 period was governed by marine ingredient scarcity rather than by aquaculture volume. Peru cancelled its first anchoveta season in 2023, fishmeal and fish oil prices reached records, and formulators accelerated substitution programmes that had moved cautiously. Salmonid diets pushed marine inclusion down while algal oil capacity came online. The 6.7% historical growth mixes volume expansion with pricing that reflected ingredient stress more than demand.
The 7.9% base case rests on three mechanisms. Asian aquaculture volume keeps rising as shrimp, tilapia, and pangasius production expands and farmers continue converting from farm-mixed to commercial extruded feed. Functional and health diets keep gaining share as disease pressure rises with stocking density, and those products price well above standard grow-out. And hatchery, weaning, and broodstock nutrition keeps growing faster than volume feeds, because early survival pays back many times over across the cycle.
The 9.2% bull case assumes algal and modified oilseed omega-3 capacity scales fast enough to release the constraint on salmonid expansion. The 6.6% bear case reflects disease outbreaks cutting shrimp biomass across Asia and Latin America, which removes feed tonnage immediately and takes several cycles to recover fully. Disease outcomes will decide much of the difference.

Why Omega-3 Supply Caps Salmon Growth

Three constraints shape this market. Long-chain omega-3 supply is the first and hardest, because EPA and DHA come from a quota-governed wild fishery, and aquaculture growth does not increase what the ocean produces. Disease pressure is the second, rising with stocking density and shifting demand toward functional diets. And the gap between salmonid and Asian volume feeds is the third, since a company selling both runs two businesses.
TOP-FIVE CONCENTRATION44%Share of global compound aquafeed volume held collectively
AVERAGE SELLING PRICE$1,340/tonneBlended price across grow-out and specialised nutritional products
FEED COST SHARE62%Feed as proportion of total aquaculture production cost
MARINE INGREDIENT INCLUSION9%Fishmeal and fish oil share of finished salmonid diets
FEED CONVERSION RATIO1.24Average kilograms of feed per kilogram of biomass
CAPACITY UTILISATION76%Average loading across extrusion and pelleting plant assets
That produces a commercial character split down the middle. Salmonid nutrition is a technical business won on documented growth performance, flesh quality, and health outcomes, where a customer will pay several times the price of a carp diet for demonstrable feed conversion improvement. Asian volume feed is a cost business won on delivered price and mill proximity, where formulation sophistication earns little. Companies attempting both from one organisation frequently under-serve the second.
The next decade turns on omega-3 substitution reaching scale. Algal oil and modified canola both deliver long-chain omega-3, work technically, and remain expensive relative to fish oil. Whether that gap closes determines how much salmonid production can expand. Everything else in aquaculture nutrition is solvable with formulation work; this one is a supply arithmetic problem.
"Salmon farming is not limited by sites, licences, or demand. It is limited by how much EPA and DHA exists on the planet, and that number has not moved since the quota system started."
Director, Aquaculture Nutrition Practice · MMA Animal Nutrition / Aquaculture Inputs Practice · August 2026

Market Trends

Algal and Modified Oilseed Oils Displace Marine Omega-3

Algal oil produced by fermentation and canola engineered to accumulate long-chain omega-3 both deliver EPA and DHA without touching a wild fishery, and salmon producers in Norway, Chile, and Scotland have written both into commercial diets. The commercial logic is availability rather than sustainability marketing: fish oil supply is capped by anchoveta quota while salmon biomass keeps growing, so something has to fill the gap. Both routes still cost more than fish oil per unit of omega-3, which limits inclusion. Capacity additions announced through 2024 and 2025 are narrowing that gap steadily.
Market Impact: Converts 4 million tonnes annually
Functional Health Diets Displace Veterinary Intervention

Sea lice in salmonids, acute hepatopancreatic necrosis in shrimp, and streptococcal disease in tilapia have all pushed producers toward diets formulated for immune support, gut integrity, and stress resilience rather than growth alone. Regulatory and retail pressure on antibiotic use makes nutritional intervention the preferred route, and functional diets price 25% to 40% above standard grow-out. The evidence bar is high, since farmers judge these products on mortality and harvest outcomes rather than on laboratory markers. Suppliers with commercial trial data across real production systems hold positions competitors cannot easily contest.
Market Impact: Costs 12x grow-out per tonne

Market Opportunities and Growth Drivers

Asian Farmers Convert From Farm-Mixed to Commercial Feed

Across Vietnam, India, Indonesia, and inland China, a substantial share of aquaculture production still runs on farm-mixed rations assembled from local ingredients, and that volume is converting steadily to commercial extruded feed as export quality requirements tighten and cold chain reaches further. Each converted farm moves from outside the addressable market to inside it, which makes this the largest single volume driver available. Extruded pellets also improve water stability and feed conversion measurably. Conversion tracks feed mill reach and farmer credit access more than it tracks any preference. Nothing else adds addressable tonnage anywhere near this scale.
Market Impact: Caps marine inclusion near 9%

Early Stage Nutrition Pays Back Across the Whole Cycle

Hatchery, weaning, and nursery diets represent a tiny share of feed tonnage across a production cycle but a disproportionate share of outcome, because survival and growth uniformity established in the first weeks compound through every subsequent stage. Producers have worked this out and now buy early stage nutrition on performance rather than price, accepting costs per tonne many times grow-out levels. Artemia replacement diets in particular remove a live feed operation that is expensive, variable, and labour-intensive. Growth of 12.8% in weaning nutrition reflects that arithmetic rather than any tonnage expansion.
Market Impact: Removed 18% of regional tonnage

Market Restraints and Challenges

Fishery Quota Caps Long-Chain Omega-3 Availability Absolutely

EPA and DHA in aquafeed originate almost entirely from reduction fisheries governed by biological quota, and Peru cancelled its first anchoveta season outright in 2023 while cutting allocations in others. The root cause is ecological rather than commercial, since the biomass simply cannot be expanded to meet demand. Salmonid diets have already fallen to around 9% marine inclusion, close to the floor at which flesh omega-3 content and consumer expectations can still be met. Responses include algal oil, modified canola, rendered by-product sourcing, and pre-harvest finishing diets that concentrate omega-3 where it matters.
Market Impact: Replaces 15% of fish oil

Disease Outbreaks Remove Feed Tonnage Without Warning

Acute hepatopancreatic necrosis and white spot in shrimp, infectious salmon anaemia in salmonids, and harmful algal blooms in Chile have each removed substantial biomass within weeks, and every lost animal is feed that will never be sold. The root cause is stocking density interacting with pathogen pressure in open or semi-open systems. Commercially this makes aquafeed demand far more volatile than terrestrial livestock feed. Suppliers respond by diversifying across species and geographies, by building functional diet portfolios, and by contracting on programme rather than tonnage terms where farmers will accept it.
Market Impact: Prices 25 to 40% above standard
3 additional market trends, 2 additional growth drivers, and 4 additional restraints and challenges are covered in the full report. Contact sales@marketmindsadvisory.com to access the complete intelligence.

Segment CAGR and Growth Architecture

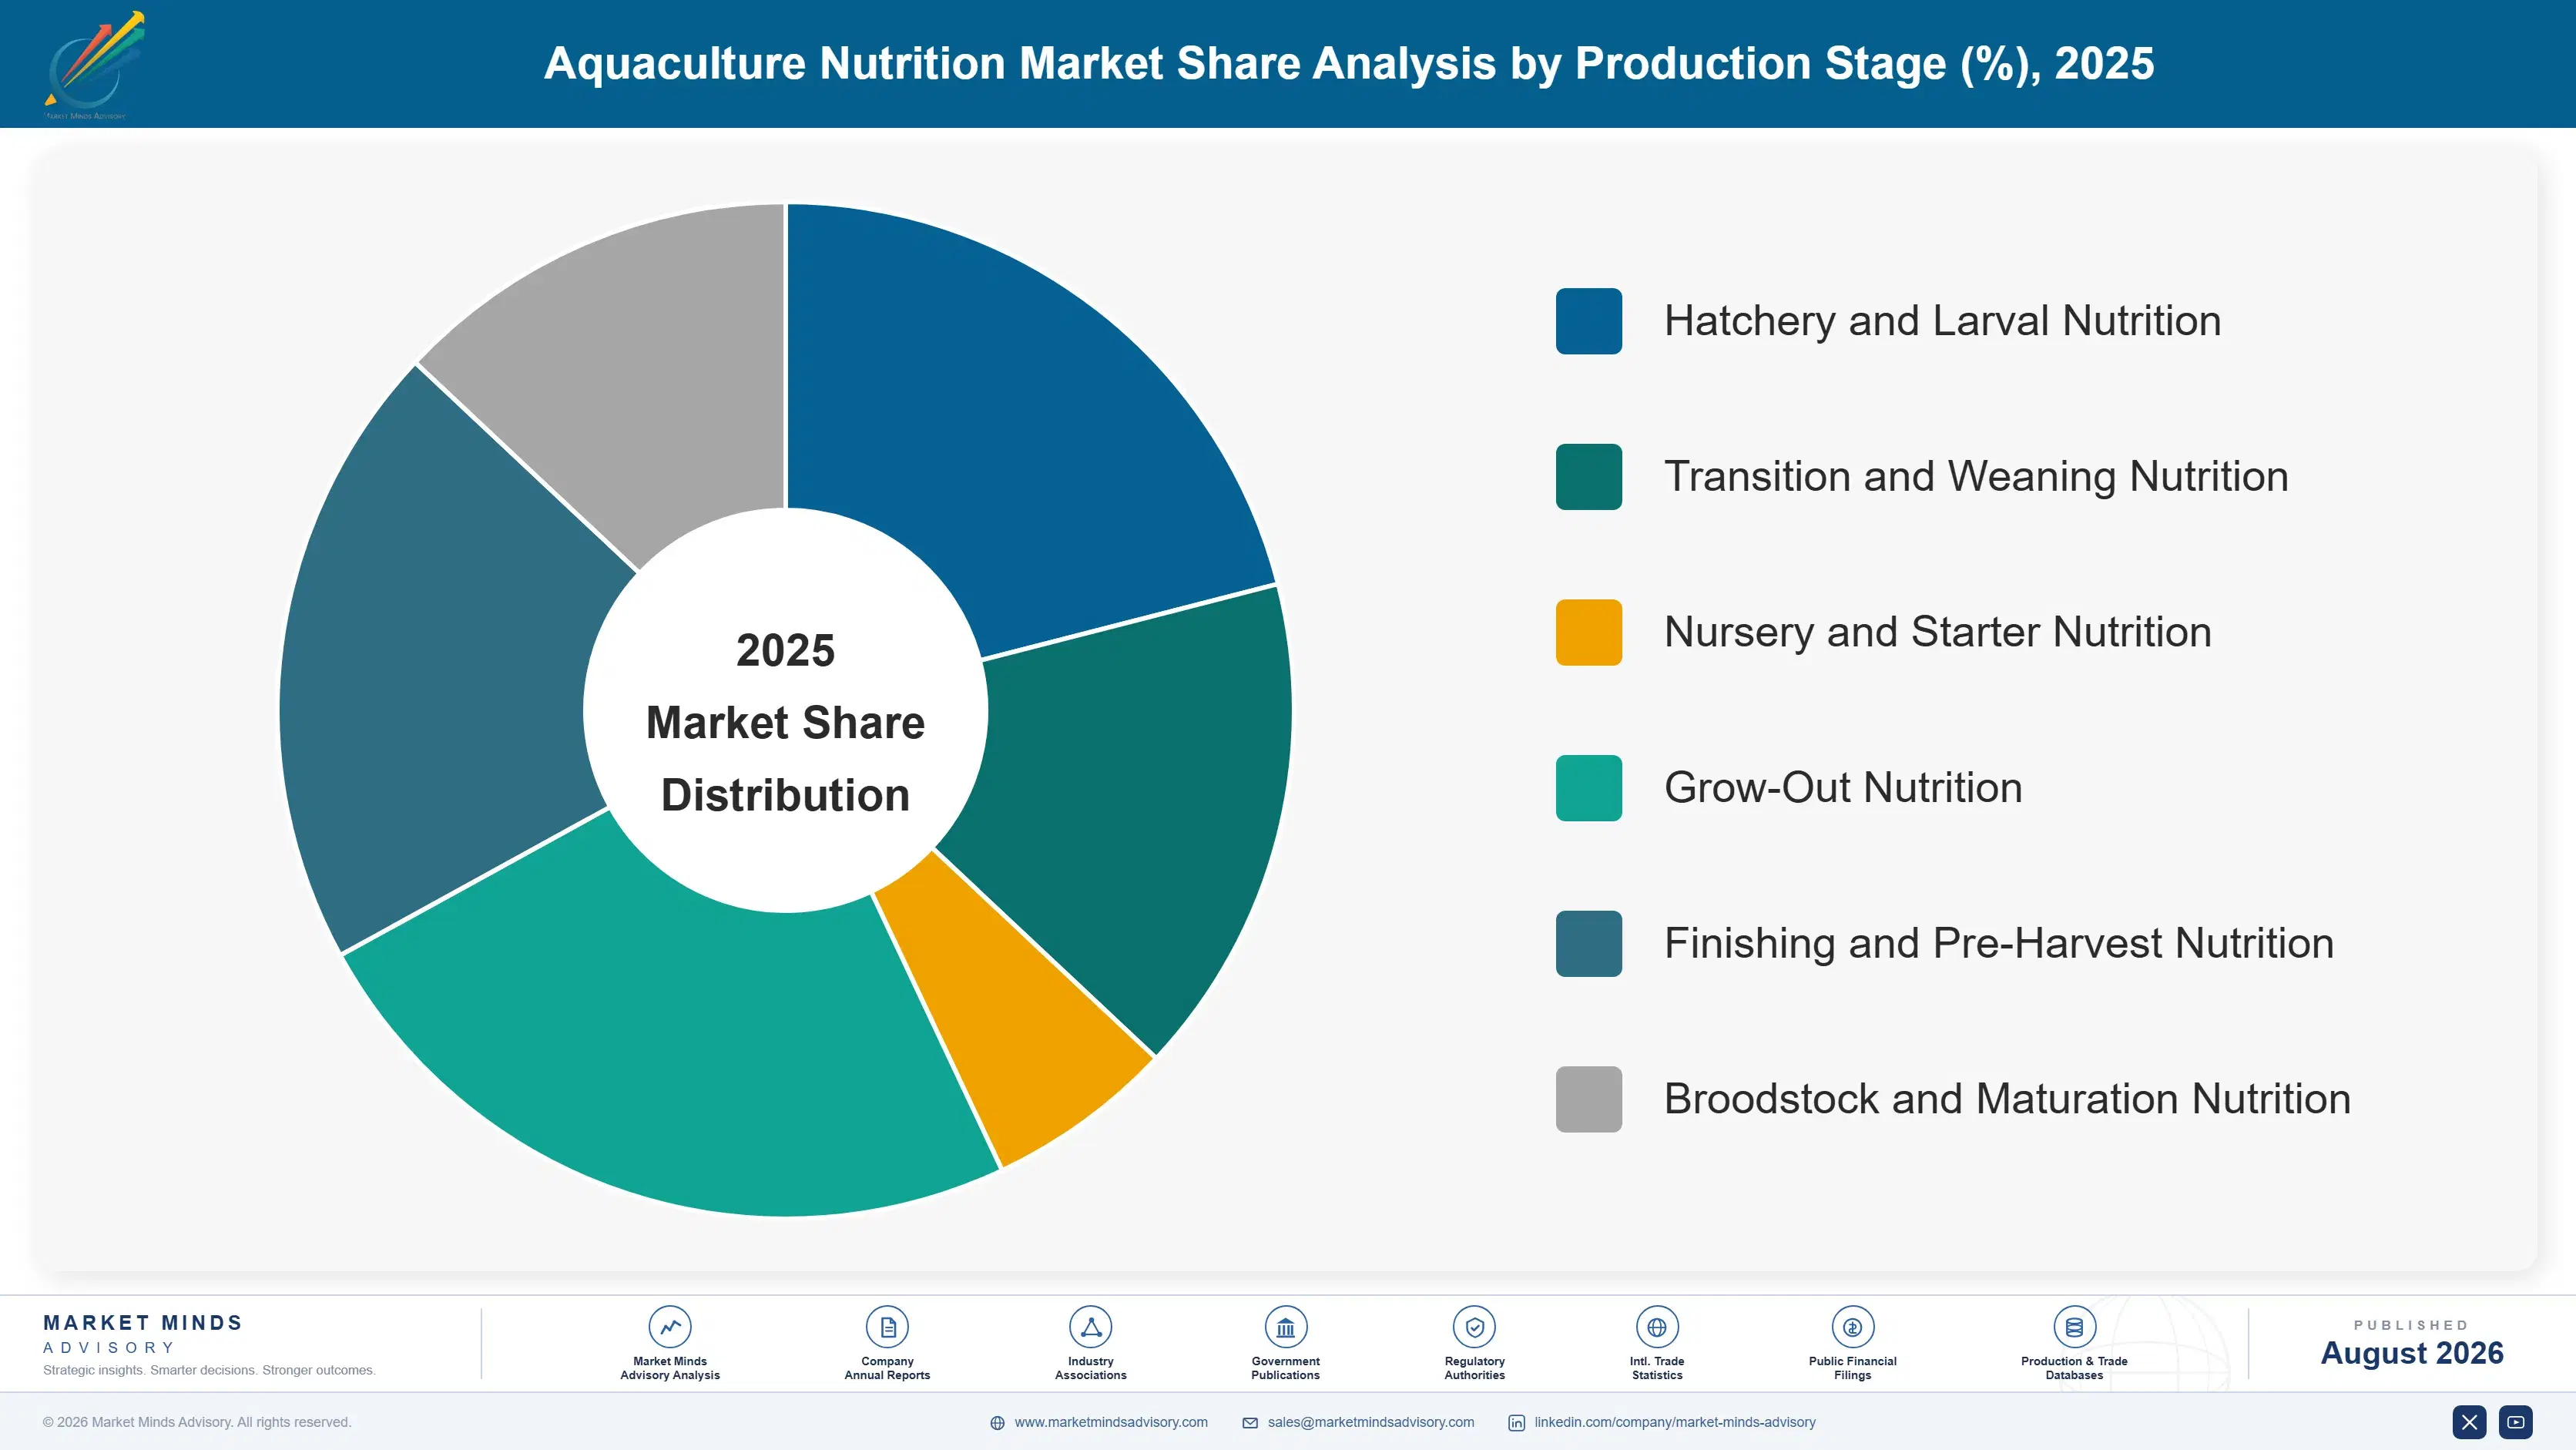
Segmentation follows production stage, the single biological logic that determines particle size, nutrient density, digestibility requirement, and price per tonne. Stage decides what the animal can physically eat and what its metabolism needs, which no other dimension captures. Species farmed, production system, and channel structure appear separately in the framework as commercial dimensions rather than as parallel segments.
aquaculture-nutrition-market-trends-market-share-analysis-1787462382263

Transition and Weaning Nutrition

Weaning diets replace live artemia and rotifer feeding, which is the most expensive, variable, and labour-intensive operation in any hatchery. Growth of 12.8%, roughly 1.62 times the market, comes from hatcheries adopting formulated micro-diets that arrive in a bag rather than requiring an on-site live culture unit with its own biosecurity risk. Price per tonne runs many multiples of grow-out feed, and hatchery managers buy on survival and uniformity rather than on cost, because failures at this stage compound through the entire production cycle. The technical demands are severe: particles measured in hundreds of microns must remain intact in water, deliver complete nutrition, and be accepted by larvae with barely developed digestive systems.
CAGR 12.8%

Hatchery and Larval Nutrition

Larval nutrition sits alongside weaning as the highest-value tonnage in aquaculture and the least price-sensitive. Growth of 11.6% follows hatchery capacity expansion across shrimp, marine finfish, and increasingly land-based salmonid smolt production, where controlled environments demand tighter nutritional specification than sea-based grow-out ever did. Buyers here are technical staff who measure survival, deformity rates, and size uniformity, and they change supplier reluctantly because a failed batch costs a full production cycle rather than a feeding period. Suppliers holding hatchery positions also gain influence over subsequent grow-out specification, since producers prefer nutritional continuity across stages where they can arrange it. Land-based smolt production has become a notable new source of demand at this stage.
CAGR 11.6%
Full segment breakdown across 6 segments available in the complete report.

Regional Architecture and Country Demand Map

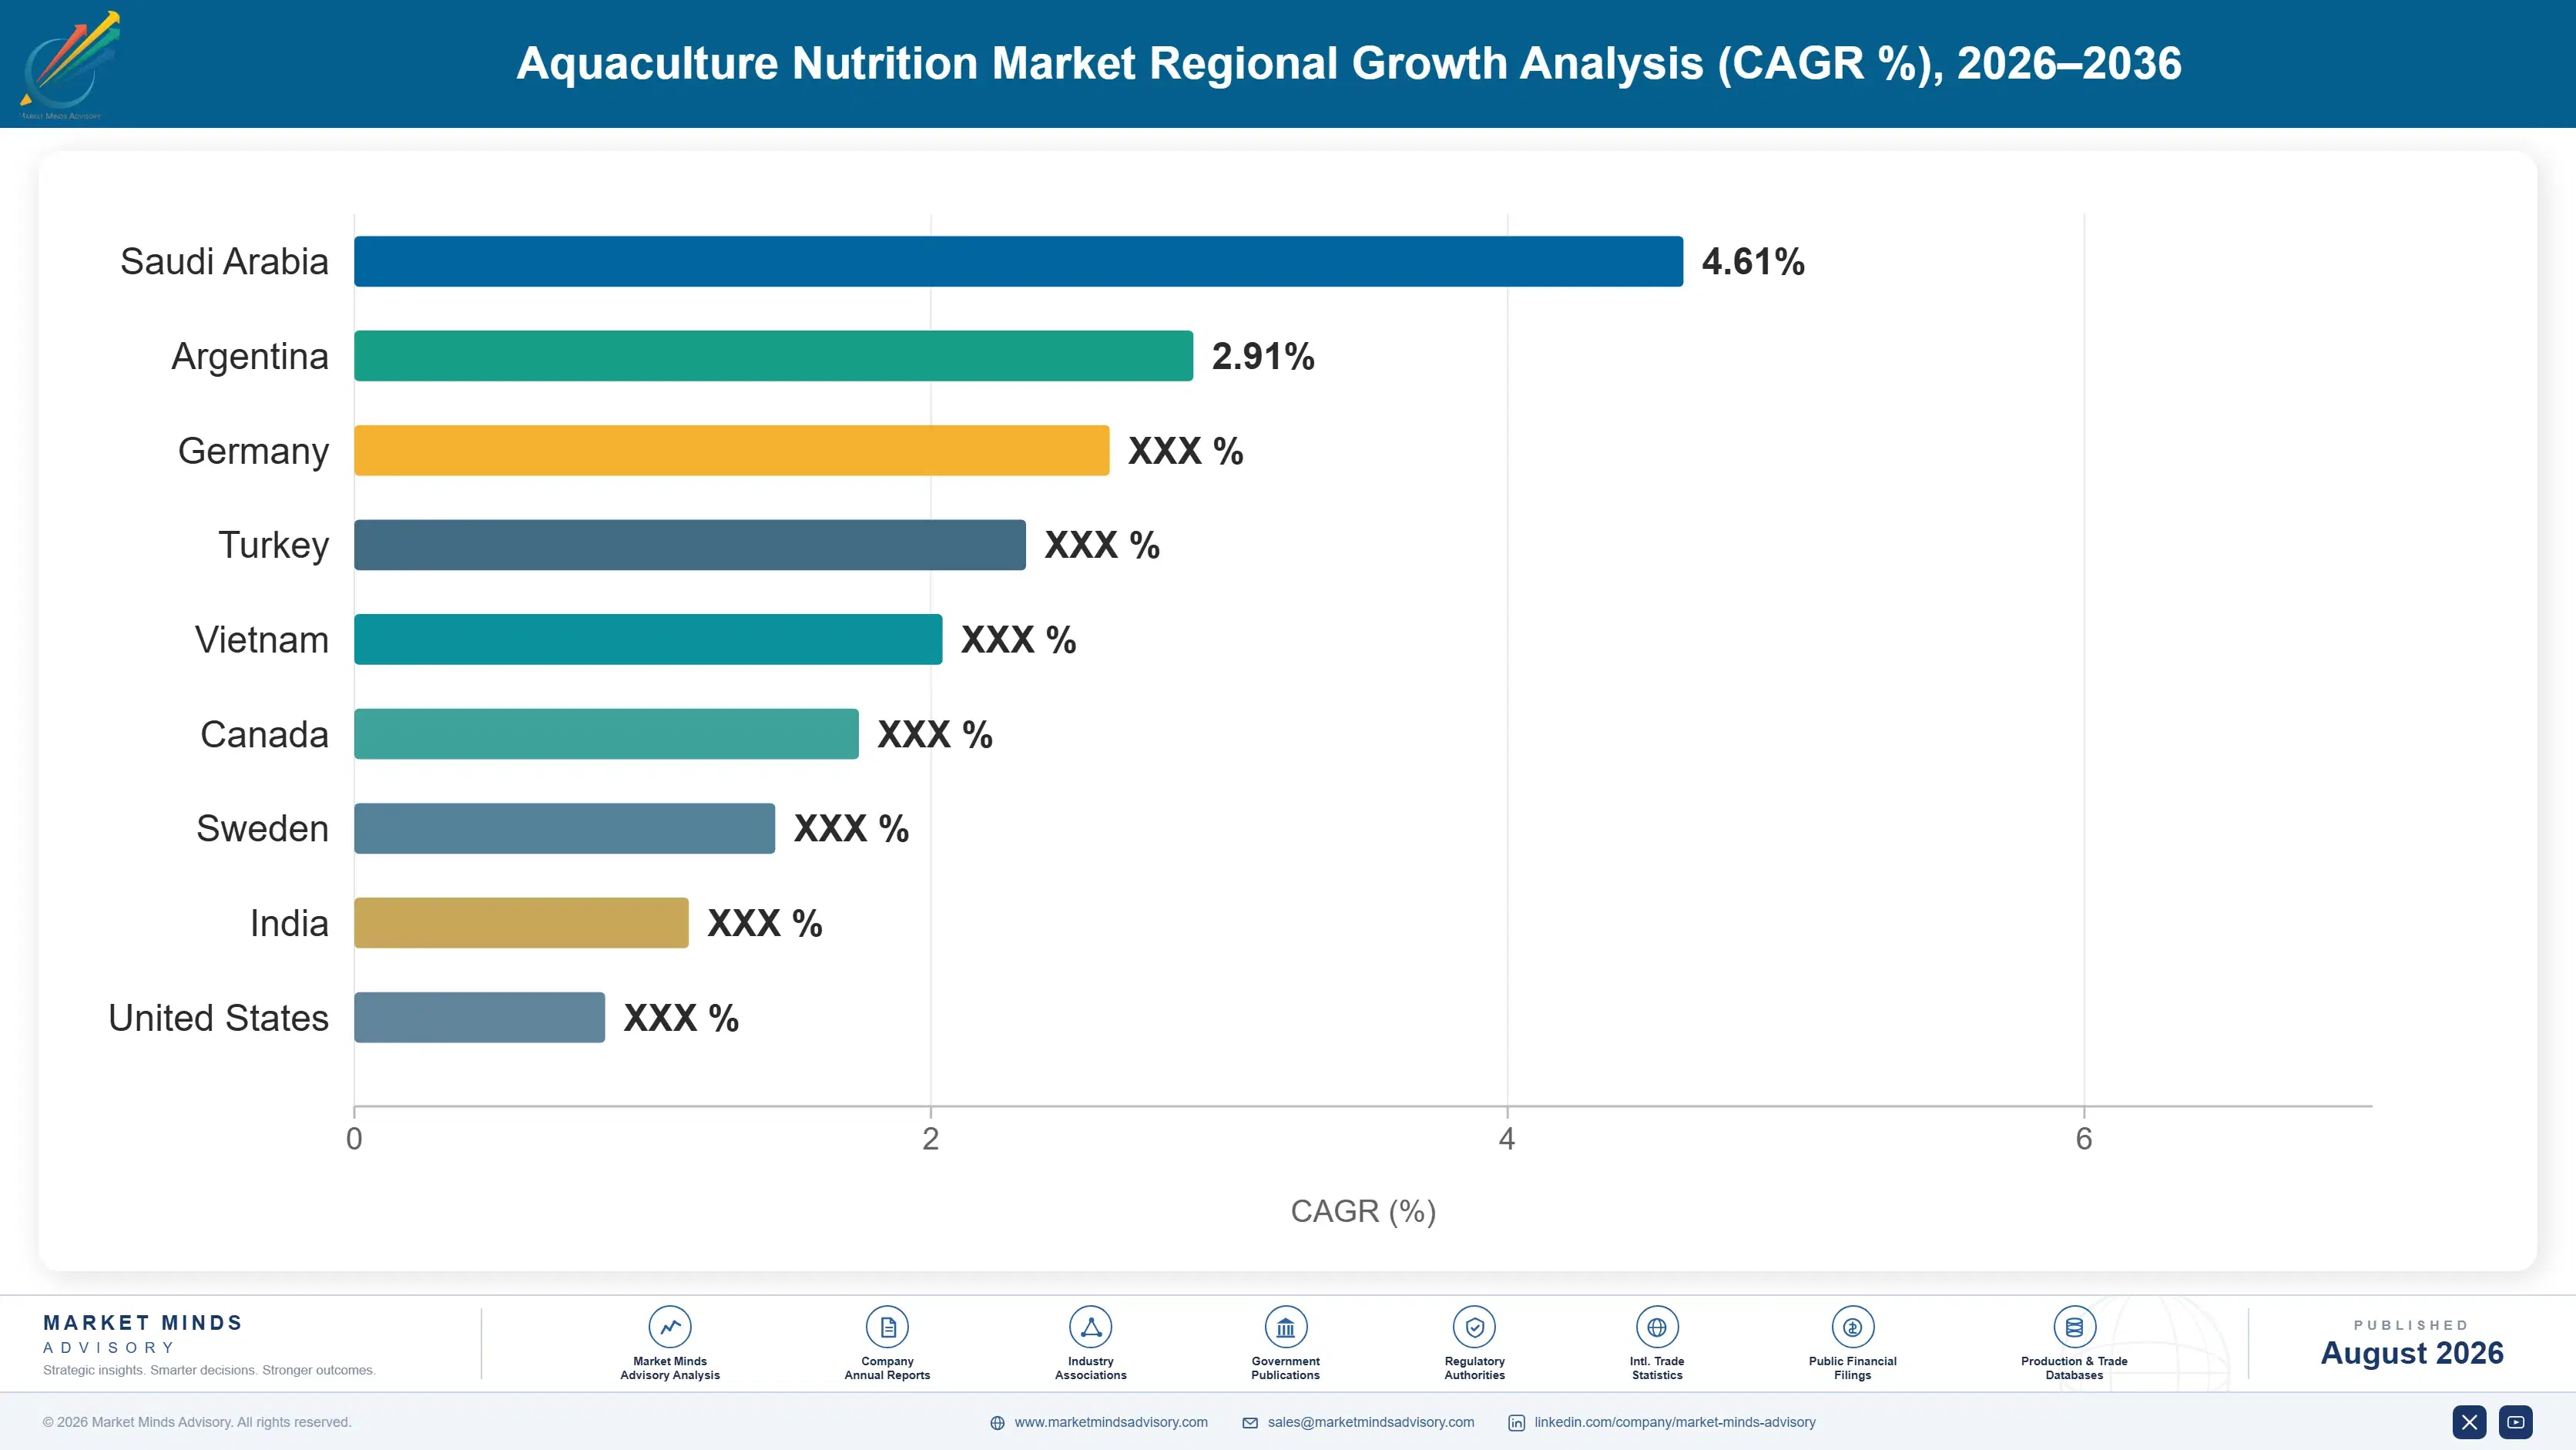
East Asia holds the largest share at 30%, reflecting Chinese aquaculture output that exceeds every other region combined. South Asia and Pacific grows fastest as Vietnamese and Indian farmers convert to commercial feed, while Western Europe and Latin America anchor high-value salmonid nutrition demand. Middle East demand is programme-led.

North America

Land-based recirculating aquaculture is reshaping nutritional requirements here more than anywhere else. Operators in Maine, Florida, Ohio, and Ontario run closed systems where undigested nutrient becomes a water treatment cost, so feed digestibility and faecal stability matter in ways sea-based farming never demanded. Catfish production across Mississippi and Alabama provides steady volume on plant-heavy diets. Pacific salmon and trout operations in British Columbia and Washington buy through the same mills serving Chile. Smolt production for land-based systems is growing quickly and buys high-specification early stage nutrition. Regional growth of 7.2% is carried by recirculating system expansion rather than by conventional net pen volume. Digestibility matters more here than in any other regional market.
Share: 22% | CAGR: 7.2% (2026 to 2036)

Western Europe

Norwegian salmon farming anchors the region and sets the technical standard the whole industry follows. Feed mills operated by Skretting, BioMar, and Cargill formulate diets where marine inclusion has fallen to around 9% and algal oil and modified canola fill the omega-3 gap that anchoveta quota created. Certification requirements under Aquaculture Stewardship Council and comparable schemes push feed ingredient traceability well beyond regulatory minimums. Scottish, Faroese, and Irish production follows Norwegian specification closely. Sea lice management has moved substantially toward functional nutrition as chemical treatment options narrowed. Growth of 6.4% reflects a mature biomass base constrained by licensing and by omega-3 availability. Omega-3 availability, not licensing, is the binding constraint on further growth.
Share: 18% | CAGR: 6.4% (2026 to 2036)
Regional intelligence for 5 additional markets available in the complete report: East Asia, South Asia and Pacific, Latin America, Middle East and Africa, Eastern Europe. Contact sales@marketmindsadvisory.com.
aquaculture-nutrition-market-trends-country-cagr-analysis-1787462382791

Where Aquaculture Nutrition Margin Actually Sits

Selling grow-out pellets by the tonne against a mill down the road is the least defensible position in this industry. The four moves below shift revenue toward customers who buy on outcome rather than price: early stage nutrition, functional health diets, omega-3 formulation capability, and conversion-linked contracting that ties supplier revenue to farm performance.

Build Hatchery and Weaning Positions Ahead of Grow-Out

Early stage diets carry prices per tonne roughly twelve times grow-out levels and are bought by technical staff measuring survival rather than by procurement measuring cost. Winning the hatchery also shapes subsequent grow-out specification, because producers prefer nutritional continuity across stages wherever they can arrange it. Micro-diet capability requires particle engineering most feed mills do not possess, which is exactly why the pricing holds. Development runs around $7 million for a commercial line, and the position influences several times its own tonnage downstream. Most regional mills cannot make particles this small reliably at all.
Market Impact: Earns roughly 12x grow-out feed pricing per tonne

Own Omega-3 Formulation Rather Than Buying Oil Blends

Fish oil supply is capped by anchoveta quota while salmon biomass keeps growing, so the ability to hit flesh omega-3 targets at 9% marine inclusion using algal oil, modified canola, and rendered sources is now a formulation competence rather than a purchasing decision. Suppliers who hold that capability and the trial data behind it defend salmonid accounts that competitors cannot serve at all. Securing algal oil offtake ahead of demand costs perhaps $14 million in commitment but locks access when capacity tightens again. Peru showed in 2023 how quickly a whole season disappears entirely.
Market Impact: Defends salmonid accounts at 9% marine inclusion levels

Sell Functional Diets on Mortality, Not on Ingredients

Farmers judge health diets on harvest outcomes rather than on laboratory markers, and most suppliers still sell them on ingredient stories. Generating commercial trial evidence across real production systems, measuring mortality, harvest weight, and cycle length, costs roughly $1.6 million per species programme and produces claims competitors cannot match. Functional diets already price 25% to 40% above standard grow-out. Evidence turns that premium from a marketing position into a defensible one, and farmers who see it in their own ponds rarely revisit the decision. Ingredient stories are matched within a single selling season.
Market Impact: Supports a 25 to 40% diet price premium

Contract Against Feed Conversion Rather Than Tonnage Delivered

Feed is 62% of production cost, so a farmer cares about kilograms of fish per kilogram of feed and nothing else, yet almost every contract is written on tonnes delivered. Pricing against measured conversion, with a floor and shared upside, aligns the supplier with the only number the customer actually watches. Programmes structured this way show retention roughly 45% higher through disease events and price cycles. The structure also filters competitors, since only suppliers confident in field performance will offer it. Tonnage contracts measure the wrong thing entirely, and both parties know it.
Market Impact: Lifts account retention 45% through full production cycles

Who Controls the Margin Pool

The top five hold roughly 44% of global compound aquafeed volume, measured consistently as tonnage produced at mill level. The industry splits cleanly in two: Skretting, BioMar, and Cargill dominate high-value salmonid and marine finfish nutrition, while Guangdong Haid, Tongwei, and Charoen Pokphand handle the far larger Asian tonnage in carp, tilapia, and shrimp at a fraction of the price per tonne.
Competition runs along three lines. Omega-3 formulation capability is the first, deciding who can serve salmonid producers as marine inclusion falls toward its practical floor. Early stage and functional nutrition is the second, where technical evidence rather than delivered cost decides purchases. The third is mill footprint, since extruded aquafeed is expensive to freight and proximity to farming regions determines who can compete on Asian volume at all.

Two pressures will reshape positions. Asian producers are moving up the specification ladder, building formulation and additive capability that was previously a Western advantage, and they hold cost positions multinationals cannot match. Meanwhile omega-3 substitution is becoming the defining technical contest in salmonid nutrition. The exposed position is a mid-sized mill selling standard grow-out feed without early stage capability, functional portfolio, or secured alternative omega-3 access.
aquaculture-nutrition-market-trends-company-positioning-matrix-1787462383314

Competitive Moat and Risk Dimensions

SKRETTING

Moat: Salmonid Formulation and Trial Depth

Skretting operates research stations and commercial trial capacity across salmonid producing regions, generating the growth, flesh quality, and health outcome data that Norwegian and Chilean producers buy on. That evidence base took decades and is not purchasable. Combined with mill proximity in every major salmon farming region, it makes displacement difficult even where a competitor matches formulation on paper.
SKRETTING

Risk: Omega-3 Supply Dependence

Salmonid diets depend on long-chain omega-3 the company does not control, and fishery quota decisions in Peru move availability and cost without warning. Algal oil and modified canola reduce that exposure but cost more per unit. If a competitor secures better alternative omega-3 access, a formulation advantage matters less than a supply position does.
GUANGDONG HAID GROUP

Moat: Chinese Mill Network Density

Haid operates mill capacity across Chinese aquaculture regions at a density no multinational approaches, which matters enormously because extruded aquafeed is costly to freight and farmers buy locally. The network also carries technical service, fingerling supply, and farmer credit, embedding the company in production decisions well beyond feed. Replicating it would require both capital and decades of regional relationships.
GUANGDONG HAID GROUP

Risk: Limited High-Value Species Exposure

The business is concentrated in carp, tilapia, and shrimp feeds priced at a fraction of salmonid diets, where formulation sophistication earns little premium and competition is intensely local. Moving into higher-value marine finfish and salmonid nutrition means competing against companies with decades of trial evidence. Growth therefore depends on Chinese volume and specification improvement rather than on entering better-priced segments.

Players Tracked

Prominent Players

Skretting
BioMar Group
Cargill Aqua Nutrition
Guangdong Haid Group
Charoen Pokphand Foods

Other Key Players

Tongwei Co.
Alltech Coppens
Ridley Corporation
Aller Aqua
De Heus
Avanti Feeds
Growel Feeds
Adisseo
dsm-firmenich
Novonesis
Kemin Industries
INVE Aquaculture
Zeigler Bros
Vitapro
Uni-President Vietnam

Recent Developments

MARCH 2025

Algal omega-3 producers expand capacity for salmonid diets

Producers of fermentation-derived algal oil extended manufacturing capacity aimed at salmonid feed formulators seeking long-chain omega-3 independent of reduction fishery quota. The additional volume supports higher inclusion in commercial diets across Norway, Scotland, and Chile, though unit costs remain above fish oil on an equivalent omega-3 basis.
Signal: Omega-3 supply is slowly decoupling from fishery quota, which would release the binding constraint on salmonid growth.
OCTOBER 2024

BioMar advances functional diets for shrimp disease resilience

BioMar extended functional feed offerings targeting shrimp disease resilience, supported by commercial pond trial data from Ecuadorian and Southeast Asian production systems. The products address hepatopancreatic conditions where antibiotic intervention faces regulatory restriction and retail buyer resistance across major export destinations. Commercial rollout began during the quarter.
Signal: Functional nutrition is replacing veterinary intervention as disease management moves upstream into the feed formulation itself.
JULY 2025

Vietnamese producers accelerate conversion to commercial extruded feed

Vietnamese pangasius and shrimp producers continued shifting from farm-mixed rations toward commercial extruded feed, driven by export market quality requirements and improving farmer access to working capital through integrator arrangements. Regional mill capacity additions followed, targeting both domestic supply and export-oriented production clusters. Additional capacity was announced regionally.
Signal: Feed conversion from farm-mixed rations is the single largest source of genuine volume growth remaining in aquaculture.

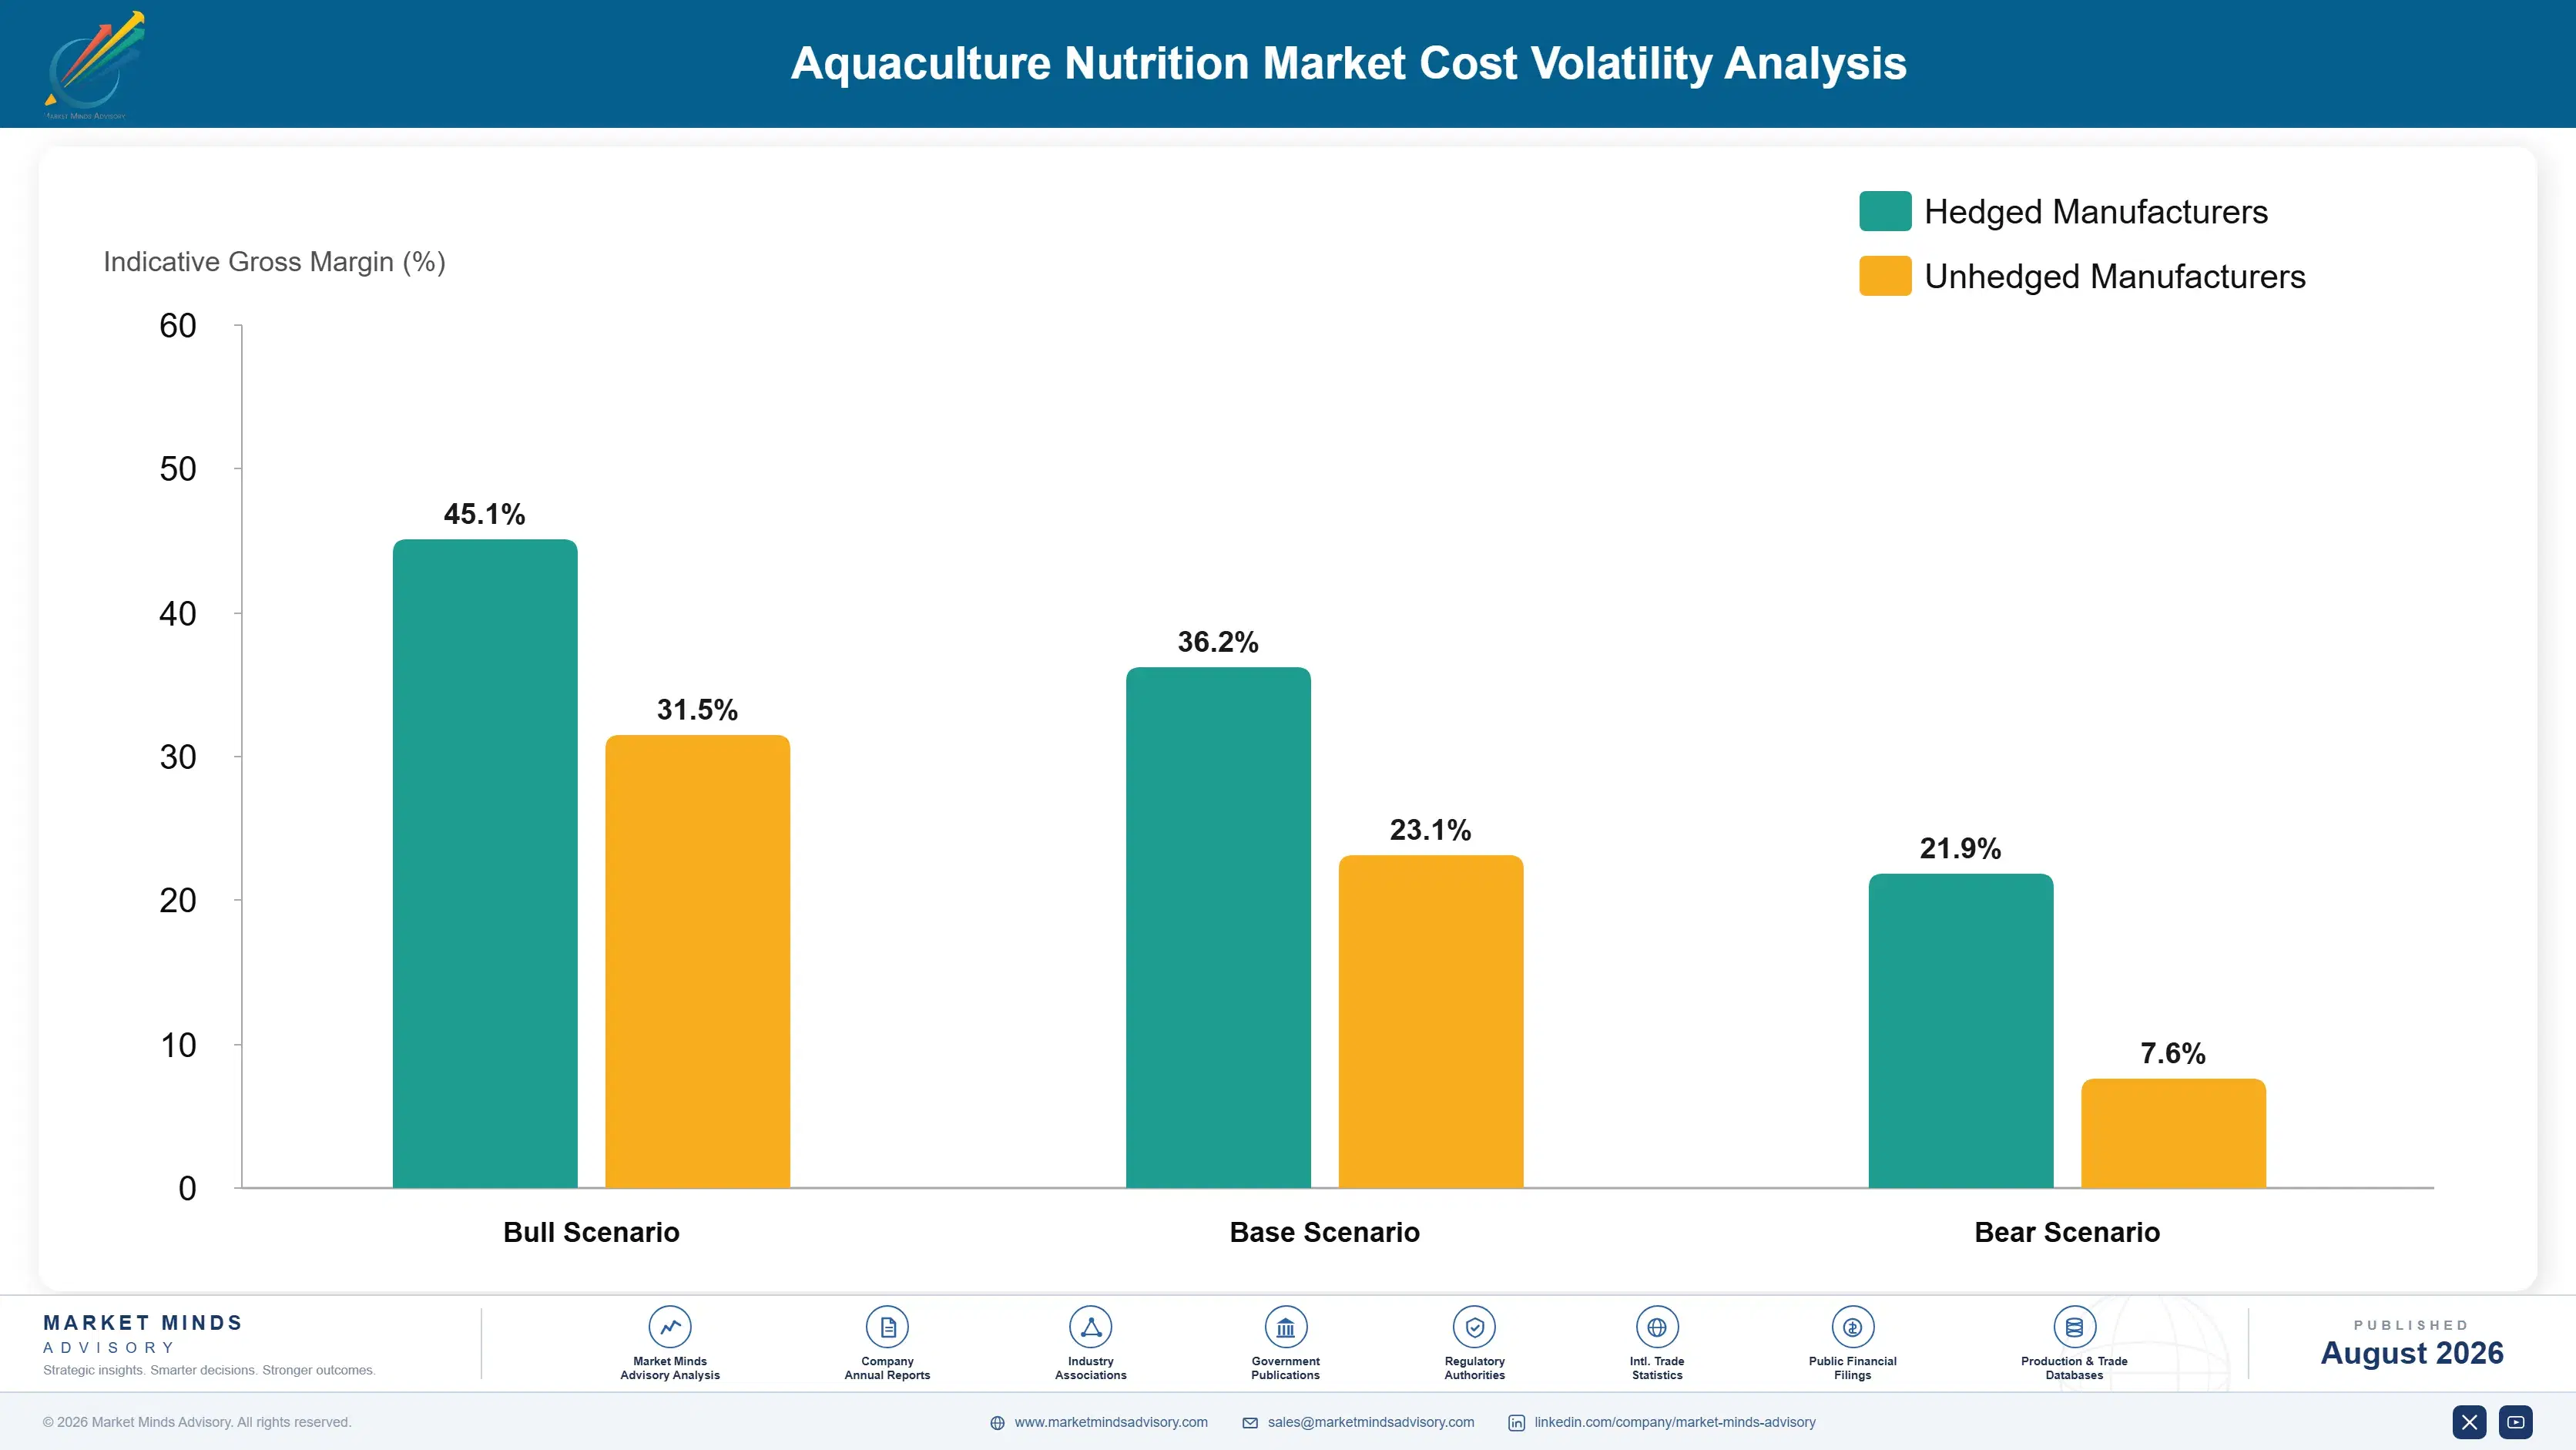
Marine Ingredients, Grains, and Extrusion Energy

Protein and oil ingredients account for roughly 71% of aquafeed cost, spanning fishmeal and fish oil from Peru and Chile, soybean and rapeseed meals from the Americas and Europe, and rendered and novel proteins. Extrusion and drying energy takes 9%, drawn from gas and grid power. Vitamins, minerals, and functional additives contribute 8%, and packaging, labour, and freight absorb the balance.
Peru cancelled its first anchoveta season in 2023 and constrained allocations afterwards, sending fishmeal and fish oil to records and forcing formulators to accelerate substitution ahead of plan. Black Sea disruption lifted grain and oilseed meal prices through the same window, so marine and plant ingredients inflated together rather than offsetting. European energy costs for extrusion rose steeply according to IEA reporting, and Nutreco and BioMar both referenced input cost pressure across their reporting in that period.

Exposure varies with formulation flexibility more than with scale. Suppliers holding qualified alternatives across protein and oil sources reformulated within a quarter and held margin; those with fixed specifications absorbed the full movement or passed it through late and lost accounts. Asian volume feed producers, buying locally with far lower marine inclusion, felt the anchoveta shock much less severely.
aquaculture-nutrition-market-trends-cost-volatility-analysis-1787462383511

Pre-qualify alternative protein and oil sources before scarcity arrives

Holding completed digestibility, palatability, and performance data for rendered proteins, novel proteins, algal oil, and modified oilseed oils turns a supply shock into a specification switch rather than a six-month reformulation. The 2023 anchoveta cancellation separated suppliers who had done that work from those who had not, and the difference showed up directly in retained accounts.

Contract algal and modified oilseed omega-3 offtake ahead of demand

Alternative omega-3 capacity is expanding but remains limited, and commitments made before scarcity secure allocation that spot buyers will not obtain when quota is cut again. The cost is a volume commitment rather than a premium. Salmonid formulators without secured alternative access are effectively dependent on Peruvian fishery decisions they cannot influence at all.

Site extrusion capacity close to farming regions rather than ingredients

Extruded aquafeed is bulky and expensive to freight relative to its value, so mill proximity to farms outweighs proximity to ingredient supply in almost every case. Ingredients ship efficiently; finished pellets do not. This is why Asian mill networks compete so effectively on delivered cost and why importing finished feed into volume markets rarely works commercially.

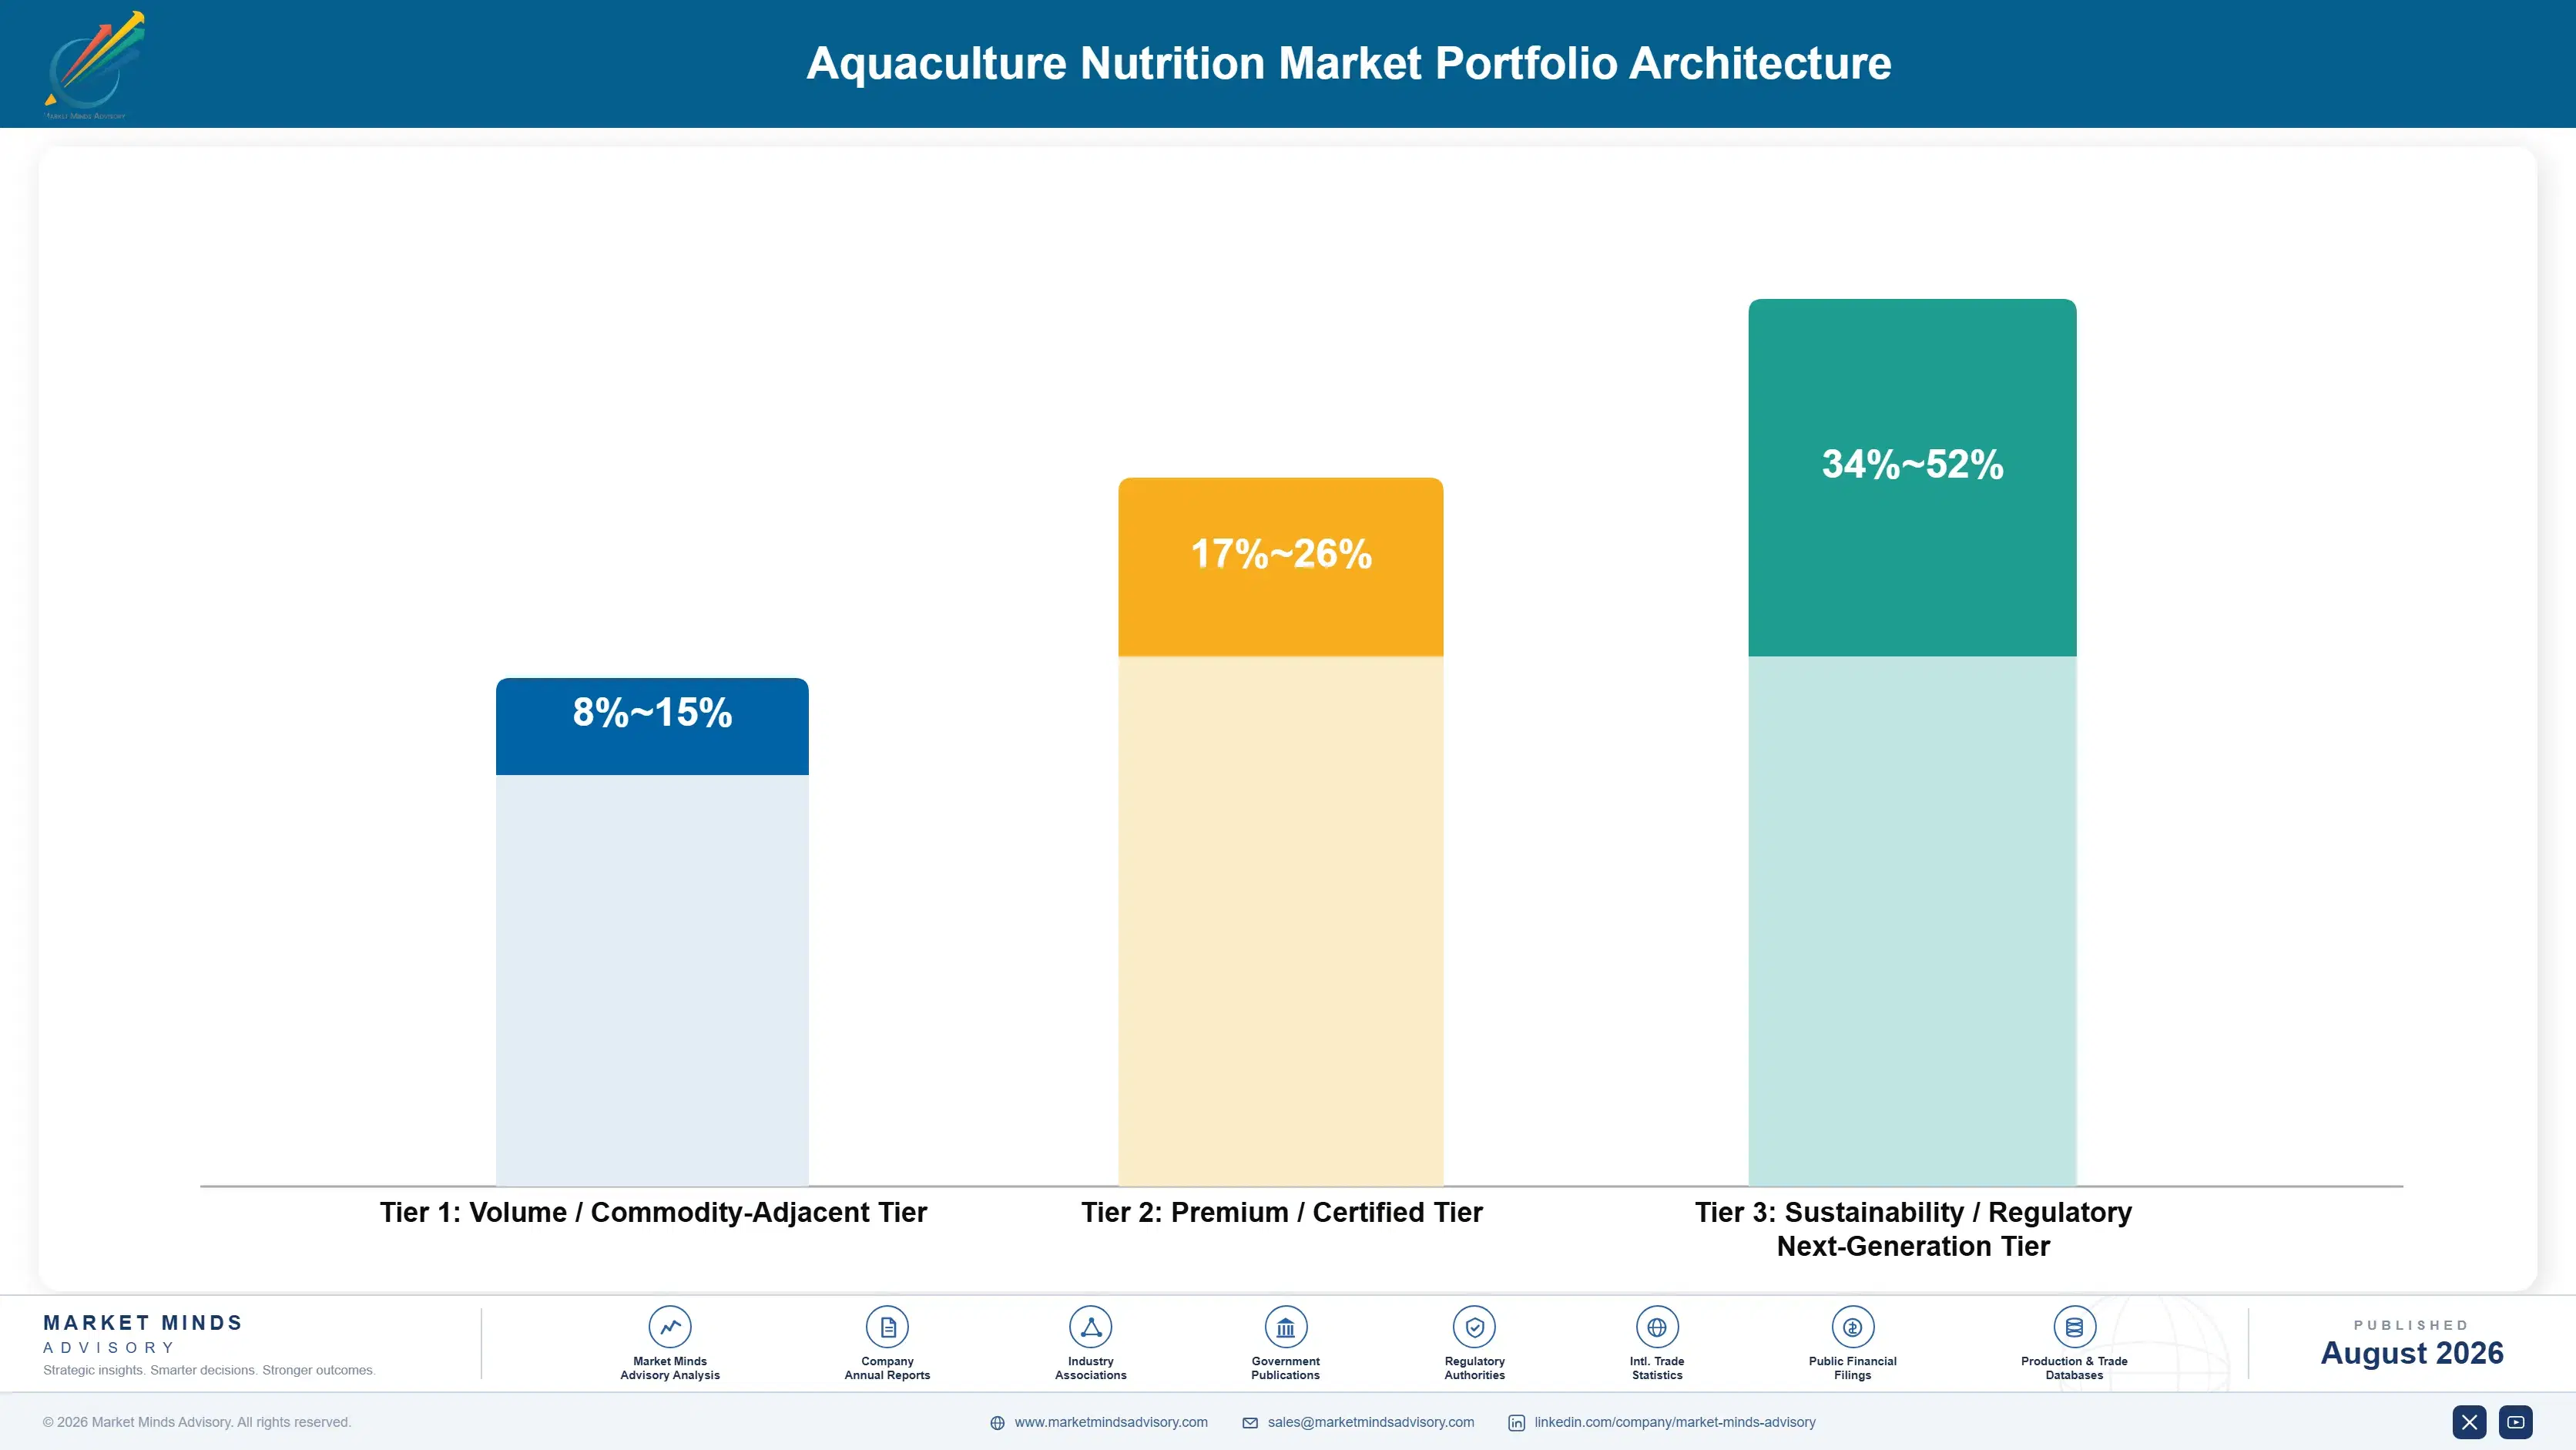
Portfolio Architecture for Margin Defence

Three tiers separate on what the customer is actually buying. Standard grow-out feed for carp, tilapia, and pangasius earns 8% to 15%, because the farmer is buying tonnes and comparing delivered price against a mill down the road. Salmonid and marine finfish grow-out diets earn 17% to 26%, since documented conversion and flesh quality justify a real premium. Early stage, weaning, and functional nutrition earn most of all, and that gap keeps widening.
The tension is that volume tonnage carries the extrusion assets while earning almost nothing. A mill needs throughput to recover fixed cost, and standard grow-out delivers exactly that at margins that barely cover it. Several suppliers have concluded that the right structure is high-volume Asian mills run deliberately as cost businesses, with technical capability and development spend concentrated entirely on early stage, functional, and salmonid products where evidence commands price.

High-value pools sit where the buyer measures outcome rather than cost. Hatchery survival, disease resilience, and feed conversion are all things a farmer can observe directly in their own system, which is why products demonstrating them resist the price comparison that governs standard grow-out tonnage completely.

Volume / Commodity-Adjacent Tier

Standard grow-out feed for carp, tilapia, pangasius, and commodity shrimp sold on delivered price against local mills. Freight economics make proximity decisive. The wide range reflects large differences in mill scale and ingredient sourcing position between operators.
Gross Margin: 8%-15%

Premium / Certified Tier

Salmonid and marine finfish grow-out diets with documented conversion, flesh quality, and certified ingredient traceability under stewardship schemes. Buyers pay for demonstrated performance. Range width separates standard salmonid formulations from fully certified traceable supply within the tier.
Gross Margin: 17%-26%

Sustainability / Regulatory / Next-Generation Tier

Hatchery, weaning, and broodstock nutrition plus functional health diets and alternative omega-3 formulations. Technical difficulty and outcome evidence, rather than production economics, sustain the margin structure across this tier throughout the forecast period.
Gross Margin: 34%-52%
aquaculture-nutrition-market-trends-portfolio-architecture-1787462384007

High-value Sub-segments and Strategic Watch-out

Weaning and Larval Micro-Diets

Highest value in the market at roughly twelve times grow-out pricing, growing at 12.8%. Particle engineering requirements exclude most feed mills entirely. Winning the hatchery also shapes subsequent grow-out specification, which multiplies the position well beyond its own tonnage. Nobody enters this segment casually or quickly.
Gross Margin: 42%-52%

Functional Disease Resilience Diets

High value with strong growth, pricing 25% to 40% above standard grow-out as antibiotic use faces regulatory and retail restriction. Farmers judge on mortality and harvest outcomes. Commercial trial evidence separates defensible positions from ingredient stories that competitors match easily. Pond results persuade farmers; laboratory markers do not.
Gross Margin: 36%-48%

Asian Volume Grow-Out Feed

The volume core and the largest tonnage pool in aquaculture, sold on delivered price where mill proximity decides the outcome. It loads extrusion assets and generates cash, but it should be run deliberately as a cost business rather than a margin one. Load it, price it, expect nothing more.
Gross Margin: 7%-14%

High Marine Inclusion Salmonid Diets

The strategic watch-out. Fishery quota caps long-chain omega-3 absolutely, and diets have already fallen near their practical inclusion floor. Suppliers without secured algal or modified oilseed access are dependent on Peruvian fishery decisions they cannot influence. Secure alternative oil access now, or simply accept that dependence permanently.
Gross Margin: 15%-24%

Why Diet Specifications Stay Fixed

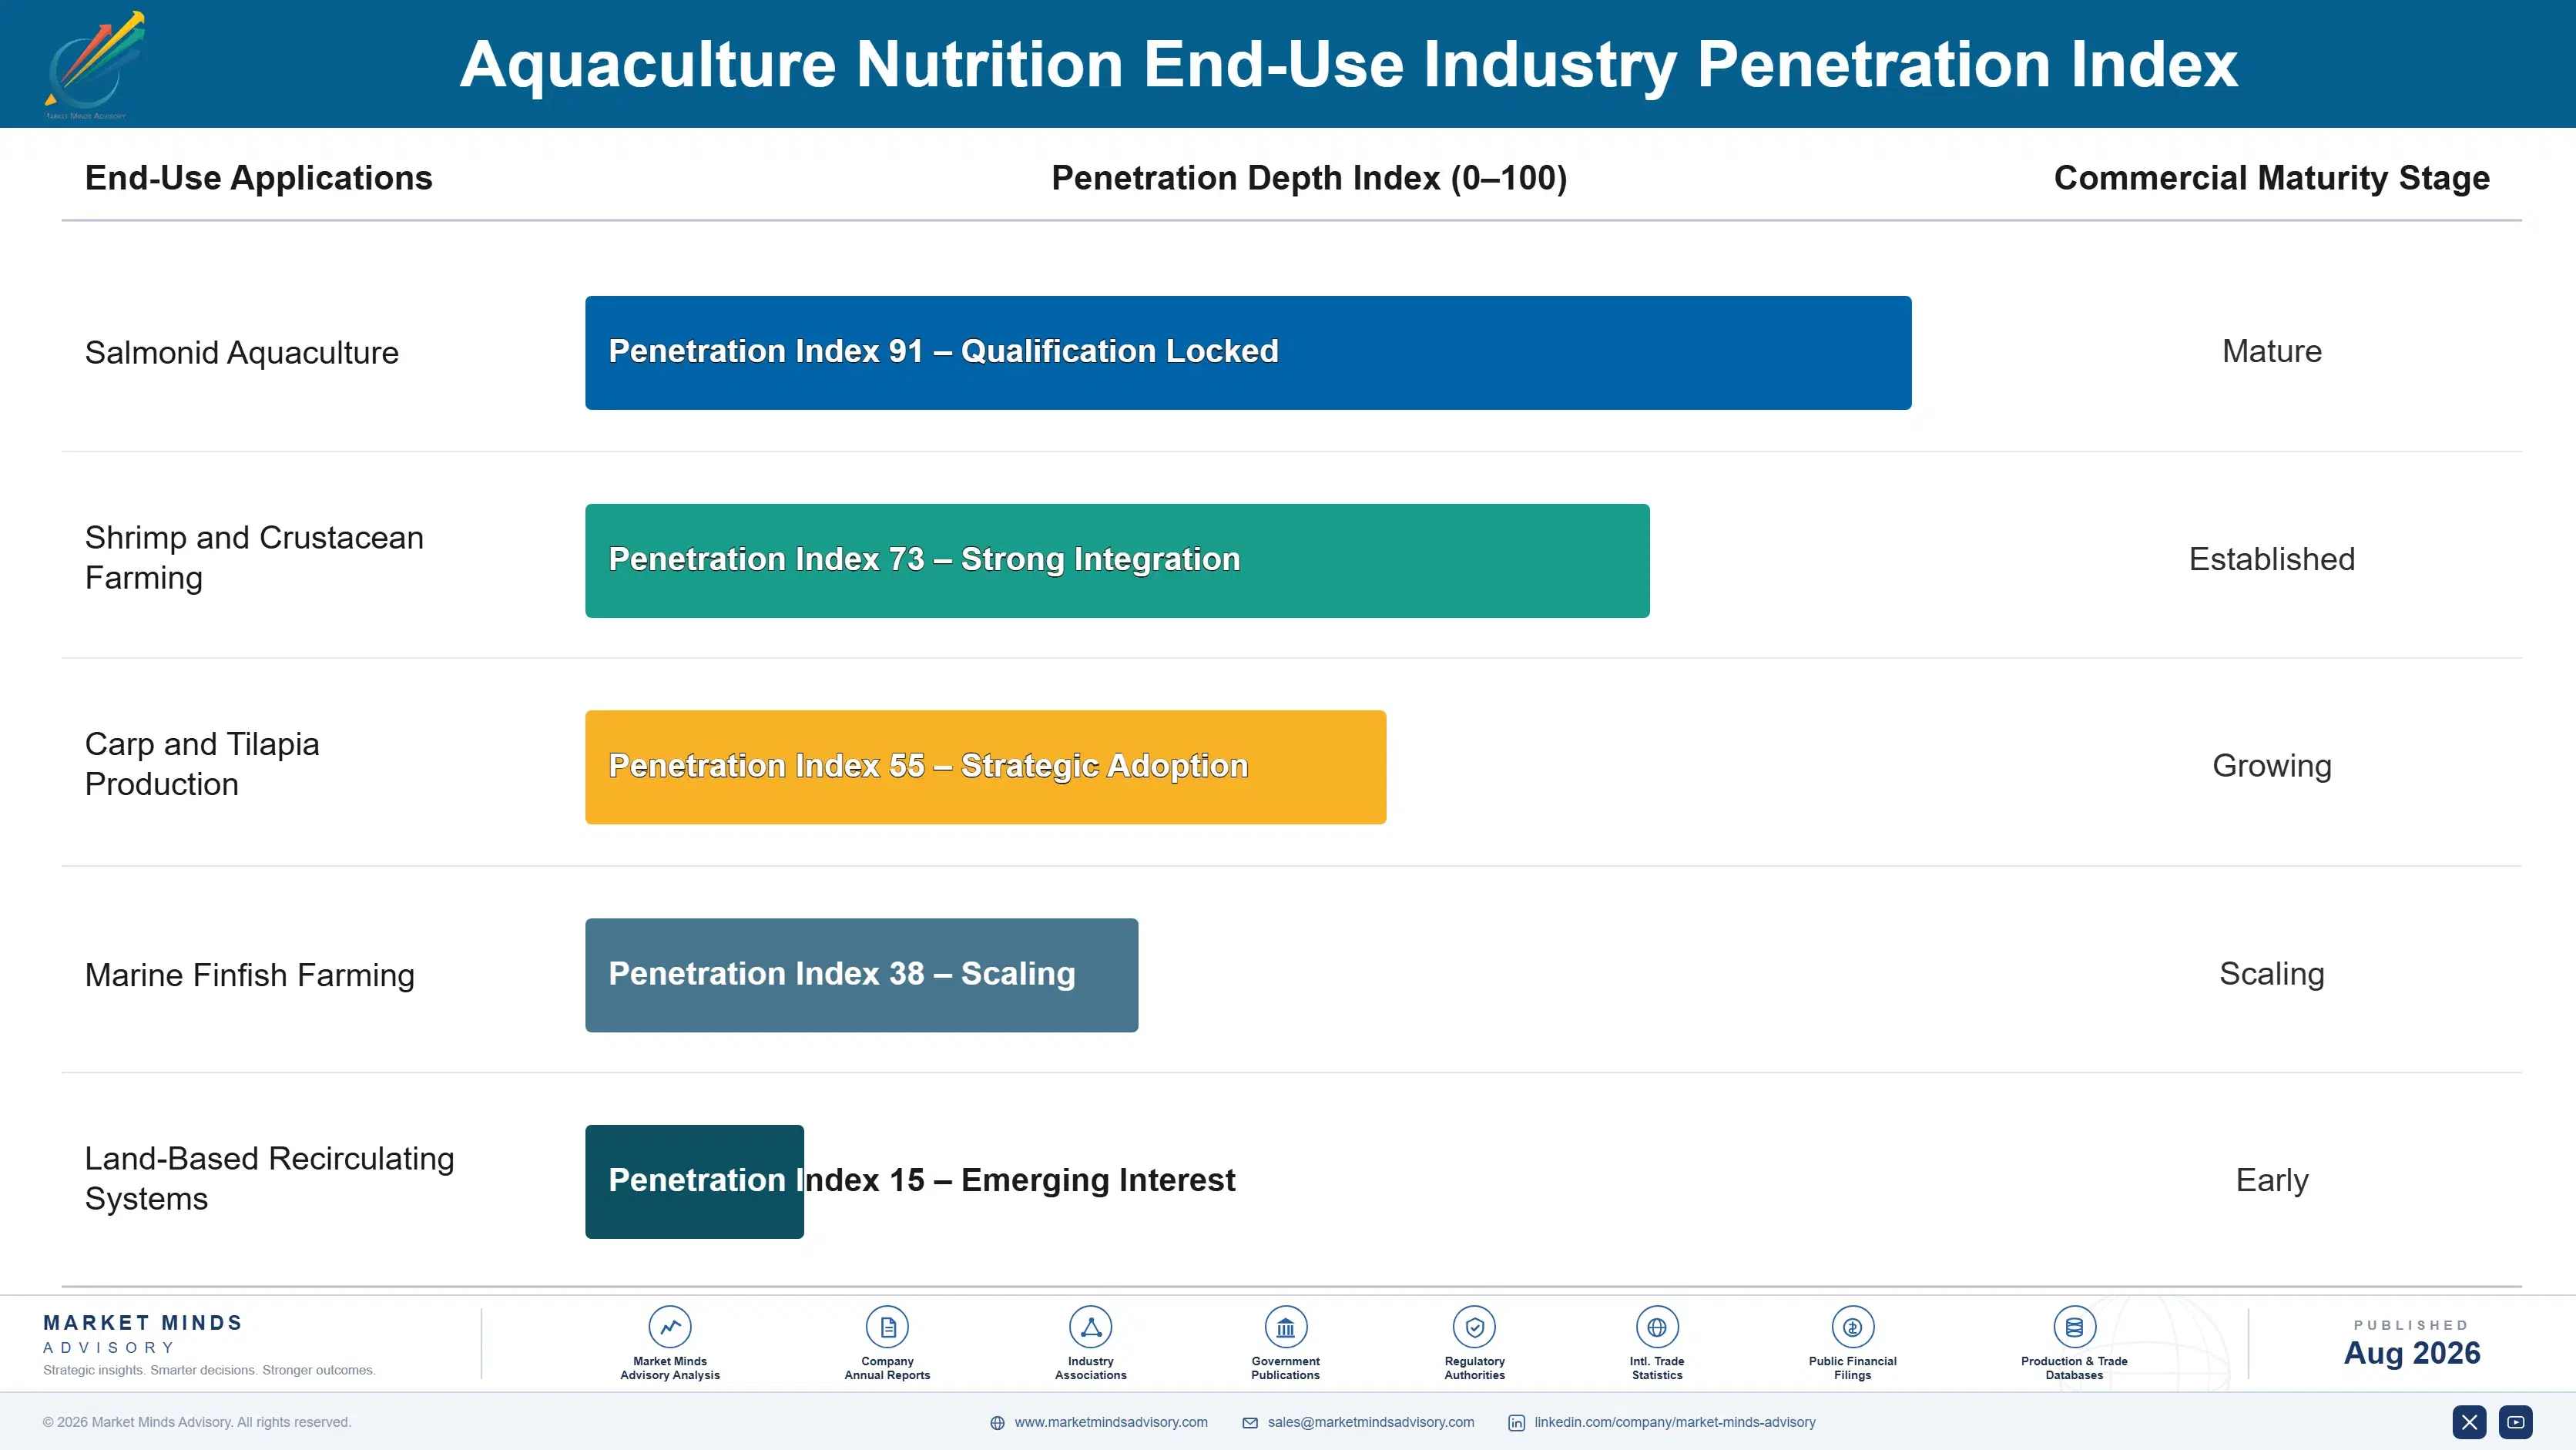
Aquafeed revenue is annuity revenue at the specification level, because changing a diet mid-cycle risks an entire production run rather than a delivery. A producer who has validated a feed across trial pens, then across commercial cycles, then against a full year of harvest data covering seasonal variation, has accumulated evidence that no competitor's brochure displaces. Typical specification tenure runs five to eight years in salmonid production and somewhat less in shrimp, where cycles are shorter and switching is easier to attempt.
Stickiness varies enormously by stage and by species. Hatchery and weaning positions are the most durable, since a failed larval batch costs a full production cycle and nobody experiments casually with a diet that works. Salmonid grow-out comes next, protected by trial evidence and by the integration of feed into farm management systems. Asian volume grow-out is the least sticky of all, retendered constantly on delivered price with mill proximity deciding most outcomes and almost no loyalty attached.

Buyer profiles have shifted. Farm technical managers now request commercial system trial data rather than pen results, and certification bodies increasingly require documented feed ingredient sourcing before a farm can carry its scheme label.
aquaculture-nutrition-market-trends-end-use-penetration-index-1787462384502

Where Aquafeed Capital Should Go

These are among the four positions where our research anticipates prominent divergence between winners and laggards over the coming forecast period. Each is grounded in the demand model, the regulatory perimeter, and the announced capacity pipeline.
01 / EARLY STAGE NUTRITION POSITION

Win the hatchery, because it shapes everything downstream

Early stage diets carry prices per tonne roughly twelve times grow-out levels and are purchased by technical staff measuring survival and uniformity rather than by procurement measuring delivered cost per bag. Winning the hatchery also shapes subsequent grow-out specification, since producers strongly prefer nutritional continuity across stages wherever they can arrange it commercially. Micro-diet particle engineering requires capability most feed mills simply do not possess, at around $7 million for a commercial line, which is exactly why the pricing has held.
02 / OMEGA-3 SUPPLY SECURITY

Contract alternative long-chain omega-3 before the next quota cut

Fish oil supply is capped by anchoveta quota while salmon biomass keeps growing, and Peru demonstrated in 2023 that an entire season can disappear without warning, appeal, or any commercial recourse. Suppliers holding secured algal oil and modified oilseed offtake contracts, plus the formulation competence to hit flesh omega-3 targets at 9% marine inclusion, can serve salmonid accounts that competitors simply cannot reach at all. Commitments cost perhaps $14 million in volume obligation, which is cheap against losing a salmonid account permanently.
03 / FUNCTIONAL DIET EVIDENCE

Prove mortality reduction in ponds, not in laboratories

Farmers judge health diets on harvest outcomes rather than on laboratory markers, yet most suppliers still sell them on ingredient narratives that any competitor can assemble within a season. Commercial trial evidence across real production systems, measuring mortality, harvest weight, and cycle length, costs roughly $1.6 million per species programme and produces claims that cannot be matched from a brochure. Functional diets already price 25% to 40% above standard grow-out, and evidence makes that premium defensible rather than merely asserted.
04 / VOLUME TIER DISCIPLINE

Run Asian grow-out as a cost business, deliberately and openly

Standard grow-out feed for carp, tilapia, and pangasius earns only 8% to 15% because the farmer is buying tonnes and comparing delivered price against another mill within trucking distance, and formulation sophistication earns almost nothing at all there. Extruded feed freights badly, so proximity decides outcomes and no amount of technical marketing will change that arithmetic. Load the assets, protect throughput, price deliberately to recover fixed cost, and concentrate every development budget on early stage, functional, and salmonid nutrition instead.

Engagement Snapshot From the Field

A live engagement with an industry participant carrying material or product regulatory and market exposure ahead of a defining policy shift, showing how our research translates into a defensible multi-year portfolio strategy.
MARKET MINDS ADVISORY · CLIENT ENGAGEMENT SUMMARY
Aquaculture Nutrition Producer Strategic Portfolio Review and Transition Roadmap 2026·Investment Scenario on Aquaculture Nutrition Exposure Evaluation 2025-26
CLIENT PROFILE
A Southeast Asian aquafeed manufacturer operating five extrusion plants supplying shrimp, pangasius, and tilapia diets across three countries, with annual revenue near USD 540 million (client-reported, unverified by MMA). Standard grow-out feed supplied roughly 86% of tonnage, the company held no hatchery or weaning product capability, and functional diets were sold on ingredient descriptions without any commercial trial evidence behind them.
STRATEGIC CHALLENGE
Grow-out margins had compressed to 6% as regional mill capacity expanded faster than demand, two large shrimp integrators had moved volume to a competitor on delivered price, and a disease outbreak in one production cluster had removed roughly a tenth of expected tonnage within a single quarter. Management wanted growth options that were not another extrusion plant.
MMA APPROACH
MMA rebuilt margin by product, stage, and customer, separating tonnage that covered fixed cost from tonnage that did not. Hatchery and weaning market opportunity was sized across regional shrimp and marine finfish hatcheries, with micro-diet capability costed against available technology partners. Functional diet trial programme requirements were specified and benchmarked, with findings tested through 47 expert interviews during Q4 2025.
KEY FINDINGS
  1. Standard grow-out tonnage covered fixed cost but contributed almost nothing beyond it, and two of the five plants were operating below the throughput their cost base required.
  2. Regional shrimp hatcheries were importing weaning micro-diets from European suppliers at landed prices roughly fourteen times the company's grow-out realisation per tonne.
  3. Functional diets represented 4% of tonnage but 19% of contribution, and customers buying them cited a competitor's pond trial data rather than any evidence the company had generated.
  4. Disease-driven tonnage volatility was concentrated in three customers, all of whom purchased on delivered price alone and had no functional diet or health programme in place.
CLIENT PROFILE
A Southeast Asian aquafeed manufacturer operating five extrusion plants supplying shrimp, pangasius, and tilapia diets across three countries, with annual revenue near USD 540 million (client-reported, unverified by MMA). Standard grow-out feed supplied roughly 86% of tonnage, the company held no hatchery or weaning product capability, and functional diets were sold on ingredient descriptions without any commercial trial evidence behind them.
STRATEGIC CHALLENGE
Grow-out margins had compressed to 6% as regional mill capacity expanded faster than demand, two large shrimp integrators had moved volume to a competitor on delivered price, and a disease outbreak in one production cluster had removed roughly a tenth of expected tonnage within a single quarter. Management wanted growth options that were not another extrusion plant.
MMA APPROACH
MMA rebuilt margin by product, stage, and customer, separating tonnage that covered fixed cost from tonnage that did not. Hatchery and weaning market opportunity was sized across regional shrimp and marine finfish hatcheries, with micro-diet capability costed against available technology partners. Functional diet trial programme requirements were specified and benchmarked, with findings tested through 47 expert interviews during Q4 2025.
KEY FINDINGS
  1. Standard grow-out tonnage covered fixed cost but contributed almost nothing beyond it, and two of the five plants were operating below the throughput their cost base required.
  2. Regional shrimp hatcheries were importing weaning micro-diets from European suppliers at landed prices roughly fourteen times the company's grow-out realisation per tonne.
  3. Functional diets represented 4% of tonnage but 19% of contribution, and customers buying them cited a competitor's pond trial data rather than any evidence the company had generated.
  4. Disease-driven tonnage volatility was concentrated in three customers, all of whom purchased on delivered price alone and had no functional diet or health programme in place.
RECOMMENDED STRATEGY
Phase 1: Phase 1 (months one to six): reprice grow-out contracts to recover fixed cost explicitly and consolidate production from five plants into four. Phase 2: Phase 2 (months seven to twenty): license micro-diet particle technology and commission a weaning line targeting regional shrimp and marine finfish hatcheries. Phase 3: Phase 3 (months twenty-one to thirty-four): run commercial pond trials for functional diets across two species and reprice against demonstrated mortality outcomes.
OUTCOME
The producer consolidated to four plants and reported blended gross margin improving from 6% to 13% within seventeen months (client-reported, unverified by MMA). The weaning line commissioned on schedule and reached 54% utilisation in two quarters. Functional diet trials completed for shrimp, with repricing under way.

Frequently Asked Questions

Foundational context covering the market sizes, CAGR, scope, country, region and competition that inform every finding below. This section is provided to cover basics and most often pre-purchase conversations, answered from the MMA Primary Research Dataset.

What is the current size of the Aquaculture Nutrition Market?

The market was valued at USD 68.5 billion in 2025, rising to an estimated USD 73.9 billion in 2026. East Asia holds the largest regional share at 30% of global value.

How large will the Aquaculture Nutrition Market be by 2036?

MMA forecasts USD 158.1 billion by 2036 under the base case, an expansion multiple of 2.14 times the 2026 level. Incremental value creation across the period reaches USD 84.2 billion.

What is the CAGR for the Aquaculture Nutrition Market 2026 to 2036?

The base case CAGR is 7.9%, with a bull case of 9.2% and a bear case of 6.6%. Historical growth between 2020 and 2025 ran at 6.7% under sustained marine ingredient stress.

Which segment is growing fastest?

Transition and weaning nutrition, at 12.8%, roughly 1.62 times the overall market rate. Formulated micro-diets are replacing live artemia culture, which is expensive and biologically variable.

Who are the major companies in the Aquaculture Nutrition Market?

Skretting, BioMar, Cargill Aqua Nutrition, Guangdong Haid, and Charoen Pokphand Foods lead, holding roughly 44% of global aquafeed volume between them. Tongwei and De Heus follow.

Which country is growing fastest?

Vietnam, at 11.3%, driven by pangasius and shrimp producers converting from farm-mixed rations to commercial extruded feed under export quality requirements and improving credit access.

Report Segmentation Architecture

The full report scope spans multiple orthogonal segmentation dimensions, with cross-tabulated demand data provided for each dimension pair. Coverage extends further to regional breakdowns, trend trajectories, and the competitive detail needed to support segment-level decision-making.

By Production Stage

  • Hatchery and Larval Nutrition
  • Transition and Weaning Nutrition
  • Nursery and Starter Nutrition
  • Grow-Out Nutrition
  • Finishing and Pre-Harvest Nutrition
  • Broodstock and Maturation Nutrition

By End-Use Industry

  • Salmonid Aquaculture
  • Shrimp and Crustacean Farming
  • Carp and Tilapia Production
  • Marine Finfish Farming
  • Land-Based Recirculating Systems

By Commercial Dimension

  • Integrated Producer Direct Supply
  • Independent Farm and Cooperative Sales
  • Hatchery and Nursery Direct Supply
  • Distributor and Dealer Networks

By Region

  • North America
  • Western Europe
  • East Asia
  • South Asia and Pacific
  • Latin America
  • Middle East and Africa
  • Eastern Europe

Scope, Methodology, and Coverage

Every figure in this report is reproducible from documented input assumptions. The scope below maps the historical period, the forecast horizon, the segmentation dimensions, and the countries covered, alongside the underlying primary and qualitative methodology.
Historical Period
2020 to 2025
Forecast Period
2026 to 2036
Base Year
2025 (USD billions; MMA Primary Research Dataset, August 2026)
Market Definition
The market comprises nutritional products supplied to aquaculture producers, covering hatchery and larval nutrition, transition and weaning nutrition, nursery and starter feed, grow-out compound feed, finishing and pre-harvest diets, and broodstock and maturation feed. Value is measured at feed product level as sold to farms, hatcheries, cooperatives, and integrators. Live feed organisms cultured on farm, aquaculture equipment and systems, veterinary medicines, water treatment chemicals, and standalone feed ingredients sold into feed mills fall outside scope.
Quantitative Units
USD billions (current prices); million tonnes of compound feed; USD per tonne average selling price
Segmentation Dimensions
By Production Stage; By End-Use Industry; By Commercial Dimension; By Region
Regions Covered
North America, Western Europe, East Asia, South Asia and Pacific, Latin America, Middle East and Africa, Eastern Europe
Countries Covered
USA, China, Germany, France, UK, Japan, South Korea, India, Australia, Canada, Brazil, Mexico, Indonesia, Vietnam, Thailand, Malaysia, UAE, Saudi Arabia, South Africa, Nigeria, Turkey, Poland, Netherlands, Italy, Spain, Sweden, Switzerland, Argentina, Colombia, Singapore, and additional markets relevant to this sector
Key Companies Profiled
Skretting, BioMar Group, Cargill Aqua Nutrition, Guangdong Haid Group, Charoen Pokphand Foods, Tongwei Co., Alltech Coppens, Ridley Corporation, Aller Aqua, De Heus, Avanti Feeds, Growel Feeds, Adisseo, dsm-firmenich, Novonesis, Kemin Industries, INVE Aquaculture, Zeigler Bros, Vitapro, Uni-President Vietnam
Quantitative Methodology
Primary survey, n=3,800 respondents, Q4 2025, six countries; demand-side model with trade association cross-validation
Qualitative Methodology
47 expert interviews, Q4 2025; applied to validate demand model assumptions, identify emerging dynamics, and assess competitive positioning
Report Format
PDF and XLSX data workbook (Word format preview document)
Publisher
Market Minds Advisory
Report Code
MMA-2026-AGR-193
Published
August 2026
Contact
sales@marketmindsadvisory.com | www.marketmindsadvisory.com

Purchase the full Aquaculture Nutrition Market Report (2026 to 2036).

The full report sizes aquaculture nutrition demand across six production stages and seven regions with 2026 to 2036 forecasts under base, bull, and bear cases. It models long-chain omega-3 availability against salmonid biomass growth, quantifying exactly how much expansion alternative oil capacity can support. Competitive profiles cover twenty suppliers assessed consistently on compound feed tonnage, formulation capability, and mill footprint. Ingredient analysis traces marine, plant, rendered, and novel protein exposure by species and region. Commercial guidance addresses early stage positioning, omega-3 supply security, functional diet evidence, and volume tier discipline.
Six production stages sized and forecast separately
Omega-3 availability modelled against salmonid biomass growth
Twenty supplier profiles on consistent tonnage basis
Farm-mixed to commercial feed conversion tracked by country
Functional diet evidence positions assessed for each leading supplier
Mill footprint and freight economics mapped across producing regions

Built For The People Who Decide

From boardroom strategy to bench-side execution, this report is read cover-to-cover by leaders shaping the next decade of their industry, turning demand scenarios, market dynamics and valuation benchmarks into decisions.
CXOs/ Presidents/ VPs/ Managers
M&A and Corporate Development
Strategy Teams and R&D Heads
Procurement and Product Directors
Regulatory and Compliance Leaders
Investor Relations and Equity Analysts