Market Minds Advisory
Aqua Probiotic Market

Aqua Probiotic Market: Aqua Probiotic Market. Disease Pressure, Antibiotic Limits and Farm-Level Proof

Aqua probiotics promise disease resistance and cleaner ponds as regulators cut antibiotic use, but variable field results, farmer cash limits and tough tropical conditions keep growth tied to proven strains and reliable delivery.

Lead Analyst

Published

September 2026

Make Smarter Decisions with Customized Research Insights

Request a free sample report and evaluate market opportunities, growth trends, and competitive dynamics relevant to your business needs.

2025 MARKET VALUE$1.0BMarket Size 2025
2036 FORECAST VALUE$2.5BBase Case , 2026 to 2036
CAGR 2026 TO 20368.5 %Bull 9.8% / Bear 7.2%
INCREMENTAL OPPORTUNITY$1.4BNet 10- year value creation
EXPANSION MULTIPLE2.26x2036 value over 2026 base
Strategic Levers
M&A Pipeline
Regional Outlook
Country Rankings
Competitive Intelligence
Segmental Deep-dive
Call-Us : 91 93563 13602

Executive Snapshot and Market Trajectory.

Aqua probiotics are live bacteria added to feed, ponds and hatchery water to protect fish and shrimp from disease and keep water clean. Antibiotic limits push farmers toward them, but results vary by pond, and farmers judge products on survival and feed conversion in the next crop.
Shrimp and Prawn Probiotics grow fastest as farmers fight early mortality syndrome, white spot and hepatopancreatic microsporidiosis with water and gut products, while freshwater finfish still carry large volume. South Asia and Pacific holds the largest share because Vietnam, India, Indonesia and Thailand run the world's largest shrimp and pangasius farms, with East Asia close behind on Chinese production. Price sensitivity remains high. Pricing follows results.
Competition is moderately concentrated, with global animal health and feed additive groups, aquaculture specialists and local fermenters competing on strain evidence, field results and distributor reach. Antibiotic restrictions in China, India and Vietnam, feed additive registration rules and export residue limits shape entry, and buyers audit strain identity, spore counts and viability before they approve products for hatcheries and feed mills. Farm trials decide reorders each season. Compliance cost favours larger suppliers.
Market Definition
The market covers global sales of live microbial products for aquaculture, including Bacillus, Lactobacillus, Pediococcus and other strains added to feed, pond and hatchery water for shrimp, finfish, molluscs and other farmed species, sold as ingredients, premixes and finished products. It excludes antibiotics, prebiotic fibres sold alone, feed enzymes, vaccines, disinfectants, and probiotics for terrestrial livestock and pets.
Base Year Value
$1.0B in 2025 (MMA Primary Research Dataset, September 2026)
Forecast Period
2026 to 2036, eleven discrete annual values
CAGR
8.5% base case. Bull 9.8%. Bear 7.2%.
Fastest Growth Segment
Shrimp and Prawn Probiotics: 11.9% CAGR
Fastest Growth Country
India: 12.5% CAGR
Fastest Growth Region
South Asia and Pacific: 10.6% CAGR
Largest Region
South Asia and Pacific: 34% of 2025 global value
Market Leaders
Novonesis, Kemin Industries, INVE Aquaculture, Evonik, Lallemand. Source: MMA Analysis, company annual reports.
Primary Survey
n=3,800 procurement and R&D decision-makers, Q4 2025, six countries
Methodology
Demand-side build-up, cross-validated against public data, 47 expert interviews

Aqua Probiotic Market Forecast Scenarios

aqua-probiotic-market-size-forecast-scenario-1789964221740
Between 2020 and 2025 the market grew at about 7.5% a year, helped by rising shrimp and tilapia output, tighter antibiotic rules in major producing countries and wider farmer awareness of pond microbiology. Growth slowed in 2023 when shrimp prices fell and many farmers cut input spending. Feed additive and water treatment products both gained users.
The base case rests on three commercial mechanisms. First, regulators and export buyers restrict antibiotics and residues, pushing farmers toward probiotics and other alternatives. Second, intensive shrimp and finfish farming expands in Asia, Latin America and Africa, raising disease pressure and input use. Third, better strain selection and encapsulation improve field results and farmer trust. Producers plan fermentation capacity, field trials and distributor networks around these drivers, and buyers reward consistent spore counts.
The bull case reaches 9.8% if disease outbreaks intensify, export markets enforce tougher residue rules and large feed groups add probiotics to standard diets. The bear case falls to 7.2% if shrimp prices stay low, farmers revert to cheaper chemicals and field results disappoint. Both cases assume stable feed supply and no new tariffs, and neither assumes a major new disease outbreak.

Field-Proven Strains, Distributor Reach and Antibiotic Limits Set Aqua Probiotic Returns

Aquaculture now supplies about half of the aquatic animal food people eat, with global output near 130 million tonnes, and disease is the largest single threat to farm profit. Probiotics enter through feed, pond water and hatchery tanks. They compete with harmful bacteria, improve gut health and break down waste, and they have become a standard tool where antibiotic use is being cut.
MARKET CONCENTRATION38% CR5Top five suppliers hold over a third of category sales
SHRIMP SHARE41%Portion of aqua probiotic sales used in shrimp farming
TYPICAL SPORE COUNT1-10 billion CFU/gCommon viable cell density found in Bacillus-based aquaculture products
FEED ROUTE SHARE46%Portion of sales delivered through feed additives and premixes
FERMENTATION COST SHARE36% of COGSSubstrates, energy and drying within total production cost
REORDER CYCLE3-4 monthsTypical time between farm purchases across crop cycles
Value pools sit in three places. Shrimp farms carry the largest and fastest pool, since early mortality and white spot outbreaks can wipe out a crop and farmers pay for anything that improves survival. Freshwater finfish such as tilapia, carp and pangasius add volume at lower prices per tonne of output. Salmon, seabass and shellfish hatcheries add smaller pools with tighter quality demands and stronger technical support requirements.
Supply is concentrated in a handful of strain owners and a long tail of local fermenters. Bacillus spores tolerate heat and storage well, so they suit tropical logistics, while lactic acid bacteria need more careful handling. Fermentation, drying and formulation decide cost, and distributors decide reach, since most farmers buy through local dealers who bundle feed, chemicals and advice. Registration rules differ widely by country.
"Aqua probiotics are sold to farmers who are one bad pond away from ruin, and they judge a product by the next harvest, not the brochure. The winners will be the suppliers who can show survival numbers in real ponds, and who have a dealer network to make that story travel."
Senior Analyst, Aquaculture Health and Feed Additives Practice · MMA Aqua Probiotics Practice · September 2026

Market Trends

Shrimp Disease Pressure Drives Farmers Toward Water and Gut Probiotics

Early mortality syndrome caused by Vibrio parahaemolyticus, white spot syndrome virus and hepatopancreatic microsporidiosis keep shrimp survival low in intensive ponds, and farmers add Bacillus and lactic acid bacteria to feed and water to suppress pathogens and stabilise ammonia and nitrite. Shrimp and Prawn Probiotics grow about 11.9% a year, and gross margins run 42% to 58%. The trend needs field data on survival, feed conversion and harvest weight, and it rewards suppliers with technical teams that visit farms, run trials with distributors and adjust dosing across pond conditions. Farmers who see results reorder quickly.
Market Impact: world output reached 130 million tonnes
Antibiotic Restrictions and Residue Rules Push Alternatives Into Standard Practice

China, India, Vietnam and the European Union restrict antibiotic use in aquaculture, and importers reject shipments with residues, so farmers and feed mills look for probiotics, organic acids and immune stimulants to protect stock. Freshwater Finfish Probiotics grow about 10.2% a year, and gross margins run 38% to 52%. The trend needs products that work at low cost per tonne of fish, stable performance in extruded feed and clear registration in each country, and it favours suppliers with local approvals, feed mill partnerships and traceable strains, since buyers demand proof that products are safe for fish and consumers.
Market Impact: feed routes carry 46% of sales

Market Opportunities and Growth Drivers

Aquaculture Expansion Raises Stocking Density and Disease Risk Across Asia

World aquaculture output reached about 130 million tonnes in 2022 according to FAO, and intensive systems in Vietnam, India, Indonesia, China and Ecuador use higher stocking densities that raise disease and water quality risk. Farmers accept new inputs when losses are severe, and governments support alternatives to antibiotics. The driver sustains volume growth and rewards suppliers with local production, dealer networks and technical support, while integrated producers that own feed mills, hatcheries and processing plants add probiotics to standard programmes and buy in large volumes under annual contracts. Contracts renew each year.
Market Impact: multi-farm trials cost $0.5-2 million

Feed Mills Add Probiotics to Diets to Differentiate Premium Aquafeed

Large feed groups in Asia, Latin America and Europe add probiotics and other additives to premium diets to promote gut health, growth and survival, and to reduce reliance on antibiotics in medicated feed. About 46% of aqua probiotic sales pass through feed routes. The driver sustains steady volume and rewards suppliers with heat-stable spores, pelleting survival data and regulatory approvals for feed additives, while feed groups qualify two or three suppliers per product to protect supply and negotiate prices, and long relationships form once trials confirm consistent performance across production plants.
Market Impact: receivables stretch beyond 90 days

Market Restraints and Challenges

Variable Field Results Limit Farmer Trust and Pricing Power

Probiotic performance changes with pond pH, salinity, temperature, dose timing and pathogen load, and many farmers report inconsistent results, so trust in products is limited. The root cause is complex pond ecology and limited large-scale controlled trials. Farmers switch products often, discount pressure is strong and low-quality imitations damage the category. Suppliers respond with field trials, dosing programmes and digital pond monitoring, though multi-farm trials cost $0.5 million to $2 million and take a full crop cycle, which smaller suppliers cannot fund easily. Imitation products with low spore counts make farmers sceptical of every brand.
Market Impact: shrimp probiotics grow 11.9% yearly

Farmer Cash Limits and Low Shrimp Prices Reduce Input Spending

Most aquaculture farmers are smallholders with thin margins, and farmgate shrimp prices fell sharply in 2023, so farmers cut spending on additives and buy cheaper chemicals or none at all. The root cause is volatile output prices and limited credit. Suppliers see slower payments, dealer inventory build-up and price competition, and receivables can stretch to 90 days or more. Suppliers respond with dealer credit, smaller pack sizes and performance-based pricing, though these raise working capital needs and risk, and consolidation among distributors changes who controls farmer relationships. Credit insurance costs rise.
Market Impact: freshwater probiotics grow 10.2% yearly
3 additional market trends, 2 additional growth drivers, and 4 additional restraints and challenges are covered in the full report. Contact sales@marketmindsadvisory.com to access the complete intelligence.

Segment CAGR and Growth Architecture

The global aqua probiotic market is segmented by farmed species group, which shows where disease pressure, farm economics and distributor reach create pricing power. Five segments cover shrimp and prawns, freshwater finfish, marine finfish, salmonids, and molluscs and other species. Shrimp and freshwater finfish grow fastest, while shrimp also carries the largest share of value.
aqua-probiotic-market-market-share-analysis-1789964221920

Shrimp and Prawn Probiotics

Shrimp and Prawn Probiotics is the fastest-growing segment at 11.9% a year, about 1.40 times the overall market rate, from a large base. Disease pressure from early mortality syndrome, white spot and hepatopancreatic microsporidiosis makes survival the main purchase driver, and gross margins of 42% to 58% support technical teams and field trials. Farmers in Vietnam, India, Indonesia, Thailand, Ecuador and China buy through dealers and feed mills, and hatcheries add products to larval water. Suppliers with local strain trials, dosing programmes and pond monitoring win repeat orders, while generic Bacillus powders compete on price and lose share when results disappoint. Export buyers increasingly ask about antibiotic-free production. Hatchery demand grows alongside pond demand.
CAGR 11.9%

Freshwater Finfish Probiotics

Freshwater Finfish Probiotics grows at 10.2% a year, about 1.20 times the overall market rate, because tilapia, carp, catfish and pangasius farms in Asia, Africa and Latin America seek alternatives to antibiotics and accept gross margins of 38% to 52% for tested products. Volume is large, but price per tonne of fish is low, so cost per dose decides purchases. Feed route delivery dominates, and heat-stable spores that survive extrusion win contracts with large feed mills. Suppliers with local registrations, low-cost fermentation and distributor networks hold price better than importers of generic products. Egypt, Bangladesh and Vietnam add rapid growth in new intensive farms. Feed conversion gains strongly sway mill buyers.
CAGR 10.2%
Full segment breakdown across 5 segments available in the complete report.

Regional Architecture and Country Demand Map

South Asia and Pacific leads at 34% because Vietnam, India, Indonesia and Thailand run the world's largest shrimp and pangasius farms, with East Asia at 30% on Chinese production. Latin America grows on Ecuadorian shrimp. North America and Eastern Europe stay small on limited farming.

North America

North America holds 6% share, below its band, which is justified because the region farms little shrimp and finfish compared with Asia and imports most of its seafood, so probiotic demand is small. Growth runs at the global rate of 8.5%. The United States supports catfish, trout, tilapia and recirculating system farms that use probiotics for water quality and gut health, and Canada adds salmon farms in British Columbia and the Atlantic provinces. FDA rules on feed additives and Canadian registrations slow launches, and farmers buy through feed groups and specialist dealers. Hatcheries and research institutions use probiotics in trials, and land-based salmon projects add early demand for water treatment products.
Share: 6% | CAGR: 8.5% (2026 to 2036)

Western Europe

Western Europe holds 10% share, below its band, which is justified because the region's aquaculture is dominated by a few high-value species and a small number of large producers, so absolute volume is far below Asia. Growth trails the global rate at 6.9%. Norway, Scotland, Ireland and Denmark supply Atlantic salmon and trout, while Spain, Greece and Italy add sea bass and sea bream farms that use probiotics in hatcheries and feed. European Union rules on feed additives are strict, antibiotic use is already low, and buyers demand traceable strains and sustainability data. Suppliers such as Novonesis and Lallemand sell through feed groups, and recirculating systems in Denmark and the Netherlands add technical demand.
Share: 10% | CAGR: 6.9% (2026 to 2036)
Regional intelligence for 5 additional markets available in the complete report: East Asia, South Asia and Pacific, Latin America, Middle East and Africa, Eastern Europe. Contact sales@marketmindsadvisory.com.
aqua-probiotic-market-country-cagr-analysis-1789964222118

Four Margin Routes for Aqua Probiotic Suppliers

Margin in aqua probiotics comes from field-proven strains, dealer and feed mill partnerships, hatchery programmes and dosing services rather than commodity Bacillus powder. The routes below apply to strain owners, fermenters and distributors, and each can start inside one planning cycle, with clear measures in gross margin points, reorder rate and survival gains. Payback runs two to three years.

Running Multi-Farm Trials That Prove Survival and Feed Conversion Gains

Farmers judge products by survival and feed conversion in their own ponds, so suppliers that run multi-farm trials with distributors, publish results and share dosing protocols raise reorder rates by 10 to 18 points and support price premiums of 8% to 15%. Trials cost $0.5 million to $2 million per species programme. Suppliers should begin with the two largest farming regions, use independent laboratories for pathogen counts and share simple summaries in local languages, since farmers trust neighbours more than brochures and reward suppliers whose trial results match their own experience.
Market Impact: multi-farm trials lift reorder rates by 10-18 points

Building Feed Mill Partnerships With Heat-Stable Spores and Pelleting Data

Feed mills add probiotics to premium diets, so suppliers that offer heat-stable Bacillus spores, pelleting survival data and registrations in each country win contracts that carry 12% to 20% of sales and earn margins two to four points above dealer sales. Programmes cost $1 million to $4 million. Suppliers should begin with the three largest mills, run on-site trials at production temperatures and hold stable stock of validated lots, since mills prefer one qualified supplier per product and rarely switch after approval. Renewals follow each trial year. Mills value validated lots.
Market Impact: heat-stable feed mill contracts carry 12-20% of sales

Expanding Local Fermentation and Dealer Networks in Shrimp Producing Countries

Imported products face duties, currency swings and slow delivery, so suppliers that build local fermentation or toll manufacturing in Vietnam, India, Indonesia or Ecuador and train dealers cut landed cost by 15% to 25% and win share in price-sensitive channels. Programmes cost $3 million to $10 million. Suppliers should start in one country, secure registrations early and offer dealer credit with clear limits, since local fermenters compete on price and only technical service and consistent spore counts justify a premium. Dealer training builds loyalty and speeds new product adoption. Local support cuts delays.
Market Impact: local fermentation cuts landed cost per tonne by 15-25%

Selling Hatchery Programmes With Dosing Guidance and Pond Monitoring

Hatcheries and intensive farms pay for bundled programmes that combine strains, dosing schedules and water quality checks, so suppliers that offer subscription programmes with pond monitoring lift revenue per farm by 20% to 35% and cut churn. Programmes cost $0.8 million to $3 million. Suppliers should pilot with 20 to 40 farms, use simple sensors and mobile reports and price on outcomes such as survival gains, since farmers value predictable results and will pay for services that reduce risk across every crop cycle and every disease season. Outcome pricing builds trust.
Market Impact: bundled monitoring programmes lift revenue per farm by 20-35%

Who Controls the Margin Pool

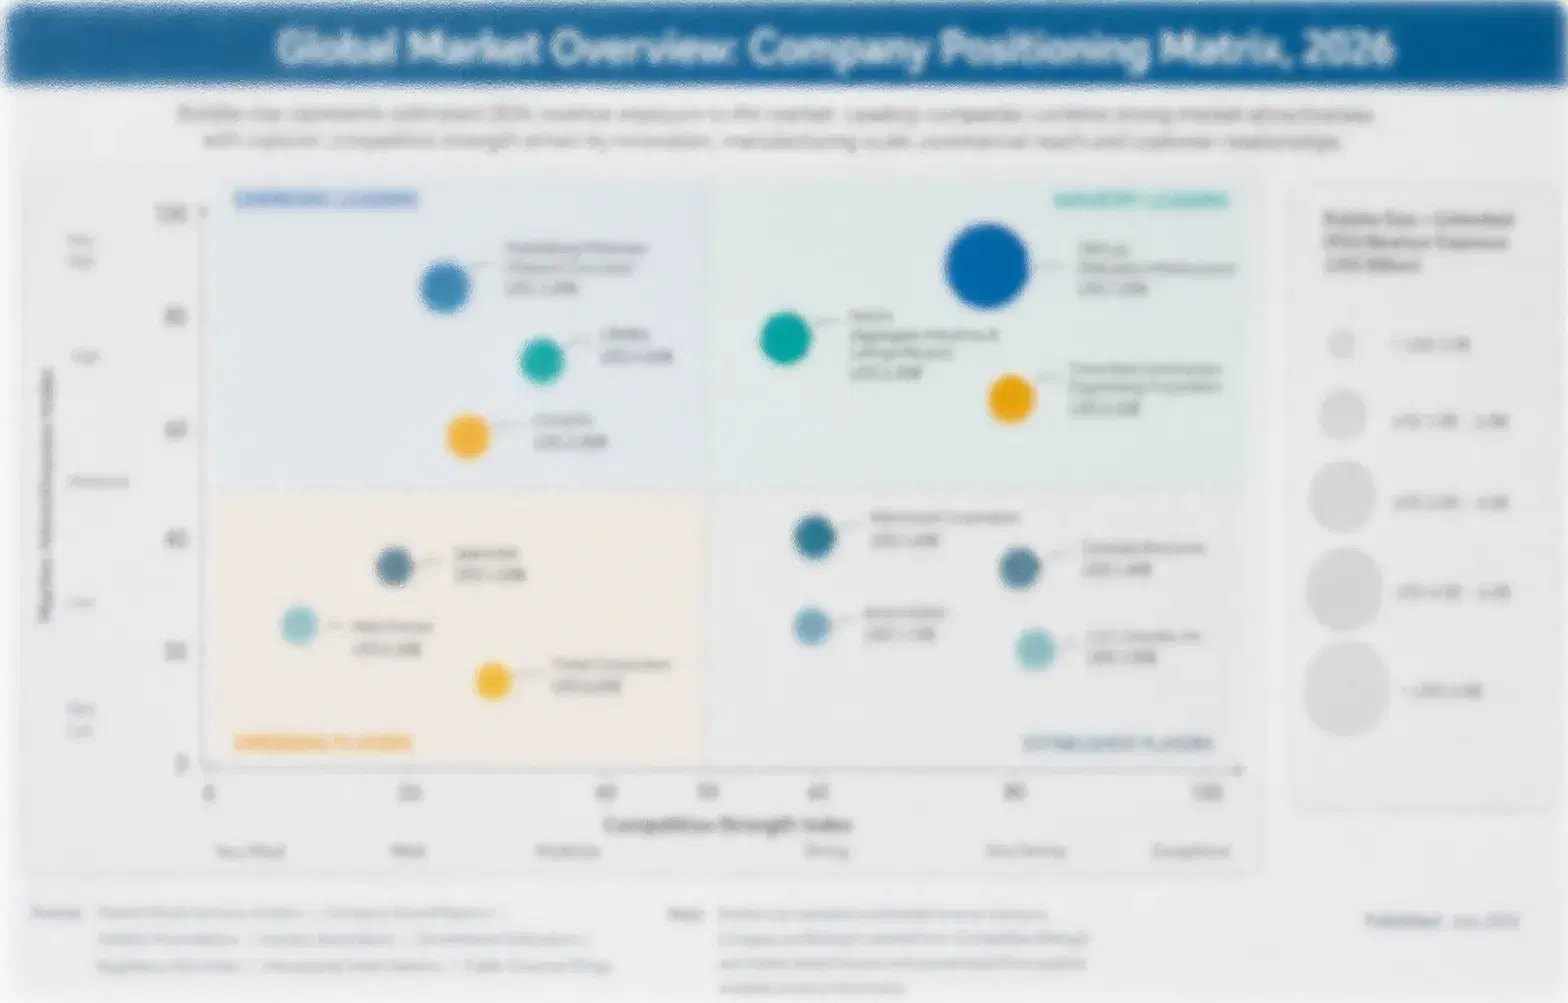
The global aqua probiotic market is moderately concentrated, with a CR5 of 38%, because strain libraries, field data and distributor networks take years to build. This assessment measures participants on estimated aqua probiotic sales value, held constant across all players. Novonesis and Kemin Industries lead through strain evidence and technical service, while INVE Aquaculture, Evonik and Lallemand follow, and the gap between the leader and the fifth player is moderate.
Competition runs on four dimensions today: field-proven results, spore quality and stability, distributor reach and registration coverage. Global groups win on strain evidence and feed mill relationships, aquaculture specialists win on hatchery programmes and shrimp expertise, and local fermenters win on price. Buyers compare cost per tonne of feed or hectare of pond, and farm trials decide reorders each season.

Emerging pressure comes from Chinese and Indian fermenters offering low-cost Bacillus products, from integrated feed groups making their own probiotics and from alternatives such as phage products and immune stimulants. Rankings shift where a supplier wins a large feed mill contract, publishes strong field data or registers in a new country, and consolidation among distributors changes who controls farmer access.
aqua-probiotic-market-company-positioning-matrix-1789964222300

Competitive Moat and Risk Dimensions

NOVONESIS

Moat: Strain Library and Evidence

Novonesis, the Danish biosolutions group formed from the merger of Novozymes and Chr. Hansen, holds large strain libraries and fermentation capacity and supplies microbial products for animal health and aquaculture. Its strain evidence, regulatory teams and global feed customer base give it an advantage with large feed mills and integrators, and it supports launches with trial data and technical service.
NOVONESIS

Risk: Premium Pricing Versus Local Rivals

Novonesis prices products above local fermenters, so price-sensitive farmers in Asia may choose cheaper Bacillus powders. Aquaculture is a small part of a large portfolio, so investment may compete with other priorities, and dealer relationships in shrimp markets are less deep than those of regional specialists.
KEMIN INDUSTRIES

Moat: Aquaculture Technical Reach

Kemin Industries, a privately held American ingredient group, sells probiotics, organic acids and other feed additives for aquaculture through regional teams in Asia and Latin America. Its technical staff, local registrations and long feed mill relationships give it an advantage in farm trials and reorders, and its position supports bundled programmes that combine gut health and water quality products.
KEMIN INDUSTRIES

Risk: Private Scale and Local Competition

Kemin Industries competes against local fermenters on price in bulk products, and its private status limits capital for large fermentation investments. Disease events or shrimp price drops reduce farmer spending quickly, and registration changes in China, India and Vietnam can delay launches in key markets.

Players Tracked

Prominent Players

Novonesis
Kemin Industries
INVE Aquaculture
Evonik
Lallemand

Other Key Players

DSM-Firmenich
Alltech
ADM
Cargill
Nutreco
Biomin
Adisseo
BiOWiSH Technologies
CJ CheilJedang
Novus International
Phileo by Lesaffre
Aller Aqua
Ecolab
Probiotics International
Guangdong Haid Group

Recent Developments

JANUARY 2026

INVE Aquaculture Launches Bacillus Blend for Shrimp Hatcheries and Nursery Ponds in Southeast Asia

INVE Aquaculture launched a Bacillus blend for shrimp hatcheries and nursery ponds in Southeast Asia, according to company communications. It is a product launch, not an acquisition, and it tests hatchery demand for survival products. Field trials covered several farms in Vietnam and Indonesia. Commercial terms were not disclosed.
Signal: Confirms specialist suppliers are targeting hatcheries because early survival gains carry through the whole crop and justify premium pricing.
FEBRUARY 2026

Novonesis Signs Supply Agreement With Asian Feed Group for Heat-Stable Aquaculture Probiotic Spores

Novonesis signed a supply agreement with an Asian feed group for heat-stable aquaculture probiotic spores, according to company communications. It is a supply agreement, not an acquisition, and it tests feed route demand. The agreement covers annual volumes, pelleting validation and quality audits. Financial terms were not disclosed.
Signal: Shows global strain owners are winning feed mill contracts because pelleting survival and audit records matter more than price alone.
MARCH 2026

Kemin Industries Opens Aquaculture Technical Centre in Vietnam to Support Shrimp Farm Trials

Kemin Industries opened an aquaculture technical centre in Vietnam to support shrimp farm trials, according to company communications. It is an organic capacity expansion, not an acquisition, and it tests local service demand. The centre offers pathogen testing, dosing advice and training for dealers. Investment terms were not disclosed.
Signal: Indicates leading suppliers are investing in local technical capacity because farmers trust results and service more than brand claims.

What Drives Aqua Probiotic Costs

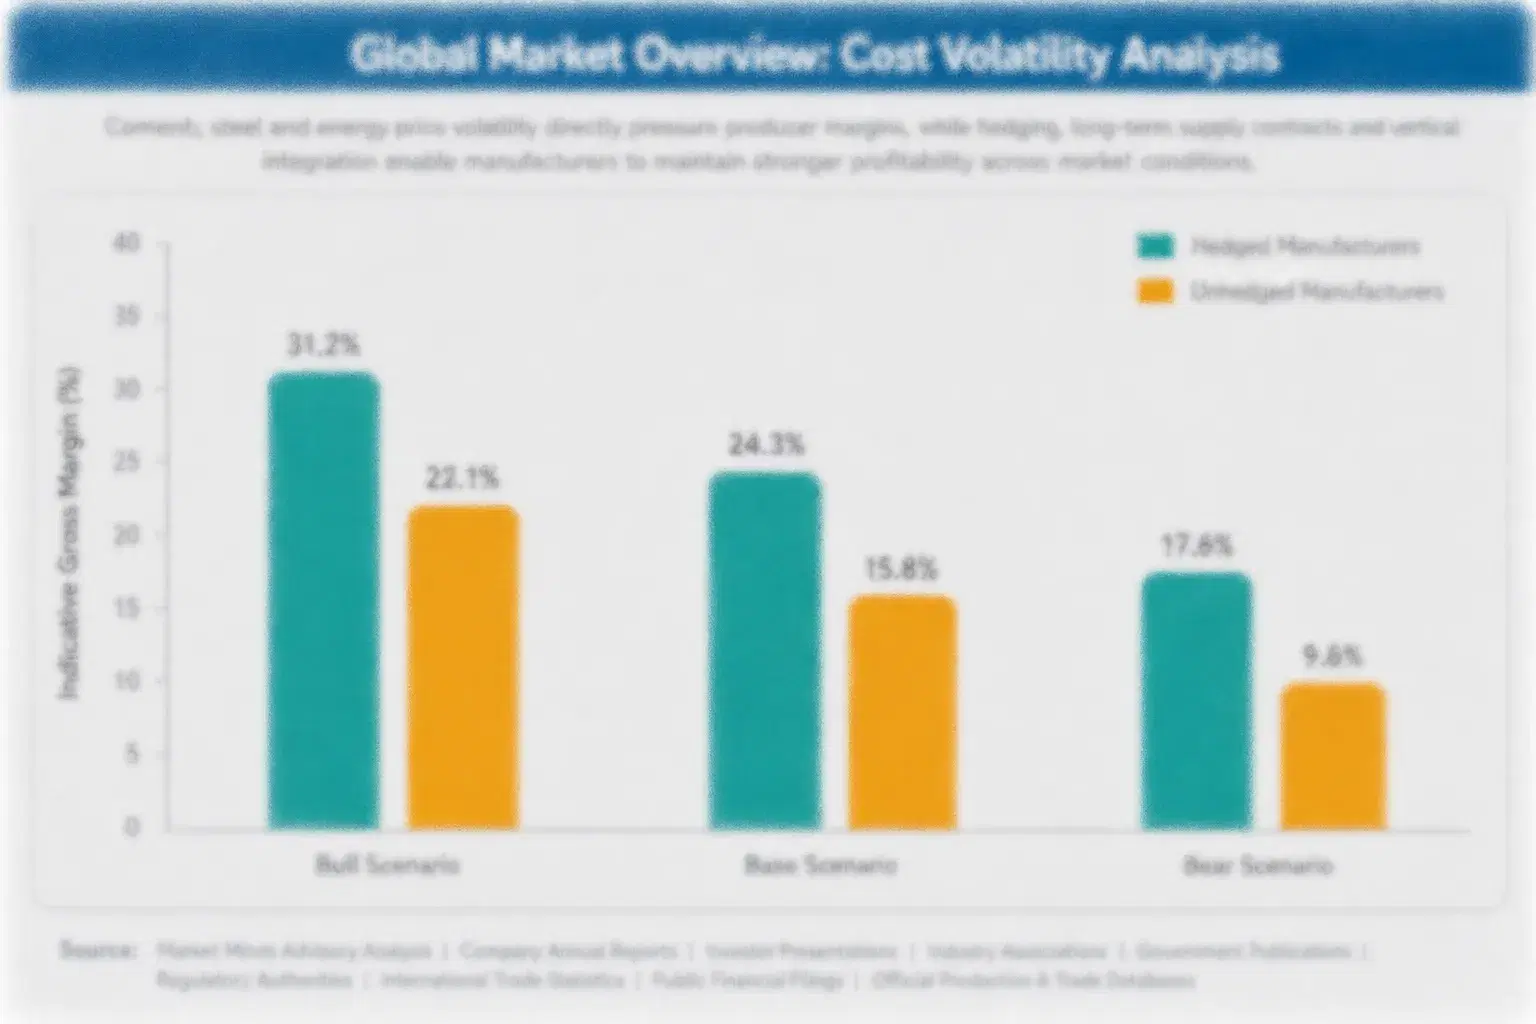
Fermentation substrates such as molasses, wheat bran, soy and glucose account for roughly 22% of production cost, energy for fermentation and drying about 14%, quality control and testing about 8%, packaging and freight about 10%, and overheads, research, distribution and marketing about 46%. Substrates come from local agricultural markets in Asia, Europe and the Americas, and fermentation plants sit mainly in China, India, Denmark and the United States.
The clearest recent shock came in 2022. The FAO Food Price Index reached record highs in March 2022 as cereal and vegetable oil prices rose after the war in Ukraine, and MMA Estimate from expert interviews indicates that fermentation carriers and substrates rose 15% to 30% while energy and freight also rose. Producers absorbed part of the increase, some shifted substrates and dealers accepted price rises only after farm demand recovered.

The disadvantage falls on suppliers without local fermentation, substrate contracts or dealer credit strength, because farmers cannot absorb price rises when shrimp prices are low. Large groups negotiate substrates and run several plants. Exposure also varies by geography: Asian fermenters face substrate and energy swings, while importers face duties, freight and currency risk that hit landed cost.
aqua-probiotic-market-cost-volatility-analysis-1789964222487

Local Substrate Contracts and Flexible Formulations

Suppliers sign contracts with regional mills and molasses producers and design fermentation media that accept alternative substrates. These measures cut exposure to substrate spikes of 15% to 30%. The main challenge is validation, since media changes need strain and spore checks, so larger suppliers lead, while smaller suppliers buy from spot markets and accept more volatility.

Local Fermentation and Toll Manufacturing

Suppliers build or contract fermentation in Vietnam, India, Indonesia or Ecuador to cut freight, duties and lead times. Local production reduces landed cost by 15% to 25%. The main challenge is quality control and registration, so suppliers audit toll plants, transfer strains carefully and keep reference samples in central laboratories for every batch. Audits repeat every year.

Heat Recovery and Efficient Drying

Suppliers install heat recovery, efficient spray dryers and renewable power contracts to lower energy cost per kilogram by 10% to 20%. The main challenge is capital cost and downtime during installation, so producers phase projects across quiet demand periods, while smaller plants lease equipment and share energy services to protect cash flow. Payback usually arrives within four years.

Portfolio Architecture for Margin Defence

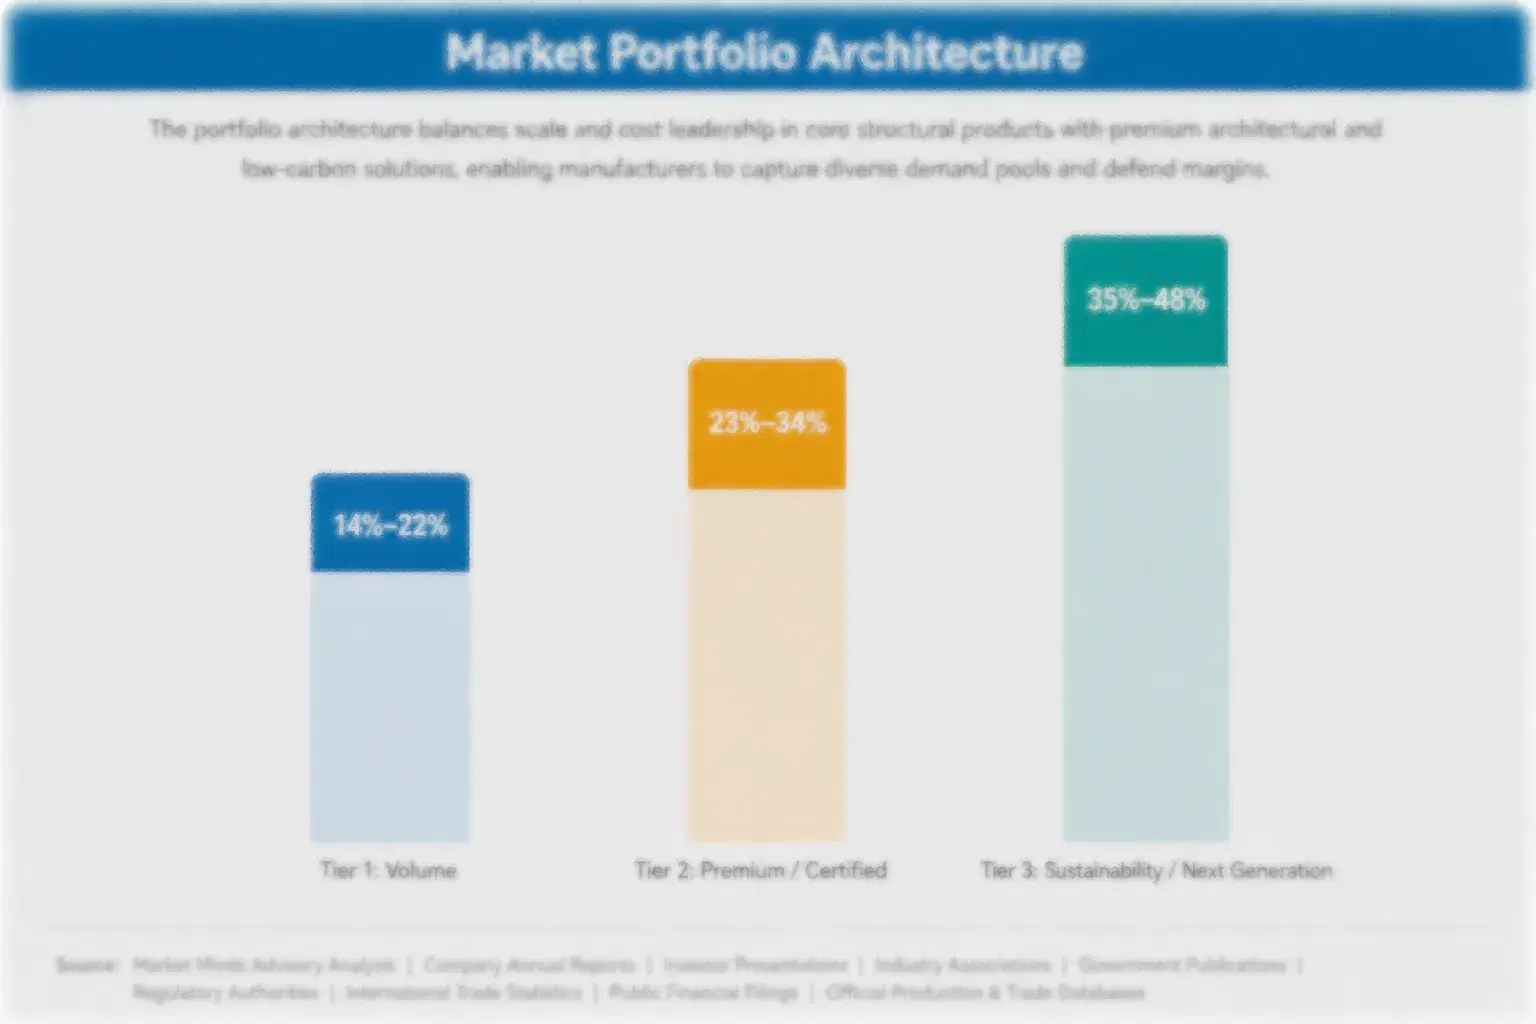
Margins run from moderate returns on generic Bacillus powders sold in volume through dealers to strong returns on strain-specific, field-proven products and bundled programmes sold with dosing guidance. Three tiers separate volume products, premium certified lines and next-generation solutions, and each tier draws on different strain rights, fermentation skills and dealer relationships in a moderately concentrated market with limited price transparency below the leading suppliers.
The tension between volume and premium is sharp. Generic powders fill dealer shelves and feed premixes at low prices but face constant local competition, while strain-specific products and programmes earn higher margins on smaller volumes and depend on trials, registrations and technical service. Suppliers that run only volume struggle when farm prices fall, while premium-only suppliers lose reach among smallholders. Mix management decides which risk dominates each year.

High-value pools concentrate in shrimp hatchery and pond programmes sold with survival data and in heat-stable feed additive products supplied to large mills. They gather where buyers pay for field proof, spore quality and technical service, not for the strain name. Salmonid and marine finfish hatcheries add smaller pools, and strong suppliers hold all three, though each needs different sales skills and technical support.

Volume / Commodity-Adjacent

Generic Bacillus powders and liquid products sold in volume through local dealers and feed premixes to price-sensitive farms. Buyers focus on price per dose, contracts renew each season, and technical service is limited.
Gross Margin: 28%-40%

Premium / Certified

Strain-specific probiotics with certified spore counts, third-party testing and registrations, sold through feed mills, dealers and hatcheries. Buyers value consistency, pelleting survival data and audit records, and contracts run for one to two years.
Gross Margin: 38%-52%

Sustainability / Regulatory / Next-Generation

Field-proven shrimp and hatchery programmes with dosing schedules, pond monitoring and outcome-based pricing, sold to large farms, integrators and hatcheries. Contracts run for several years and depend on results, technical service and regulatory files.
Gross Margin: 45%-60%
aqua-probiotic-market-portfolio-architecture-1789964222680

High-value Sub-segments and Strategic Watch-out

Shrimp and Prawn Probiotics

Shrimp and prawn probiotics combine the fastest growth with strong pricing, since farmers pay gross margins of 42% to 58% for products that improve survival in disease-prone ponds. Field data, dealer networks and hatchery access limit competition, and suppliers with local trials win the largest feed mill and integrator contracts.
Gross Margin: 42%-58%

Freshwater Finfish Probiotics

Freshwater finfish probiotics deliver firm growth and pricing, since tilapia, carp and pangasius farms seek alternatives to antibiotics and accept gross margins of 38% to 52% for tested products. Heat-stable spores, local registrations and feed mill approvals form the entry barrier, and low-cost fermentation decides who stays competitive.
Gross Margin: 38%-52%

Marine Finfish Probiotics

Marine finfish probiotics are the volume core for hatcheries and cage farms producing seabass, seabream and grouper. Value grows about 8.0% a year, and strain evidence, hatchery service and delivery reliability decide profit. Suppliers anchor sales on long relationships with hatcheries and feed groups, and customers renew yearly.
Gross Margin: 34%-48%

Salmonid Probiotics

Salmonid probiotics are the strategic watch-out, since growth of about 6.5% a year trails the leaders, antibiotic use is already low and producers are few and demanding. Suppliers should manage these lines selectively and steer investment toward shrimp and freshwater finfish products with faster growth.
Gross Margin: 30%-44%

Why Farmers Keep Buying Proven Probiotics

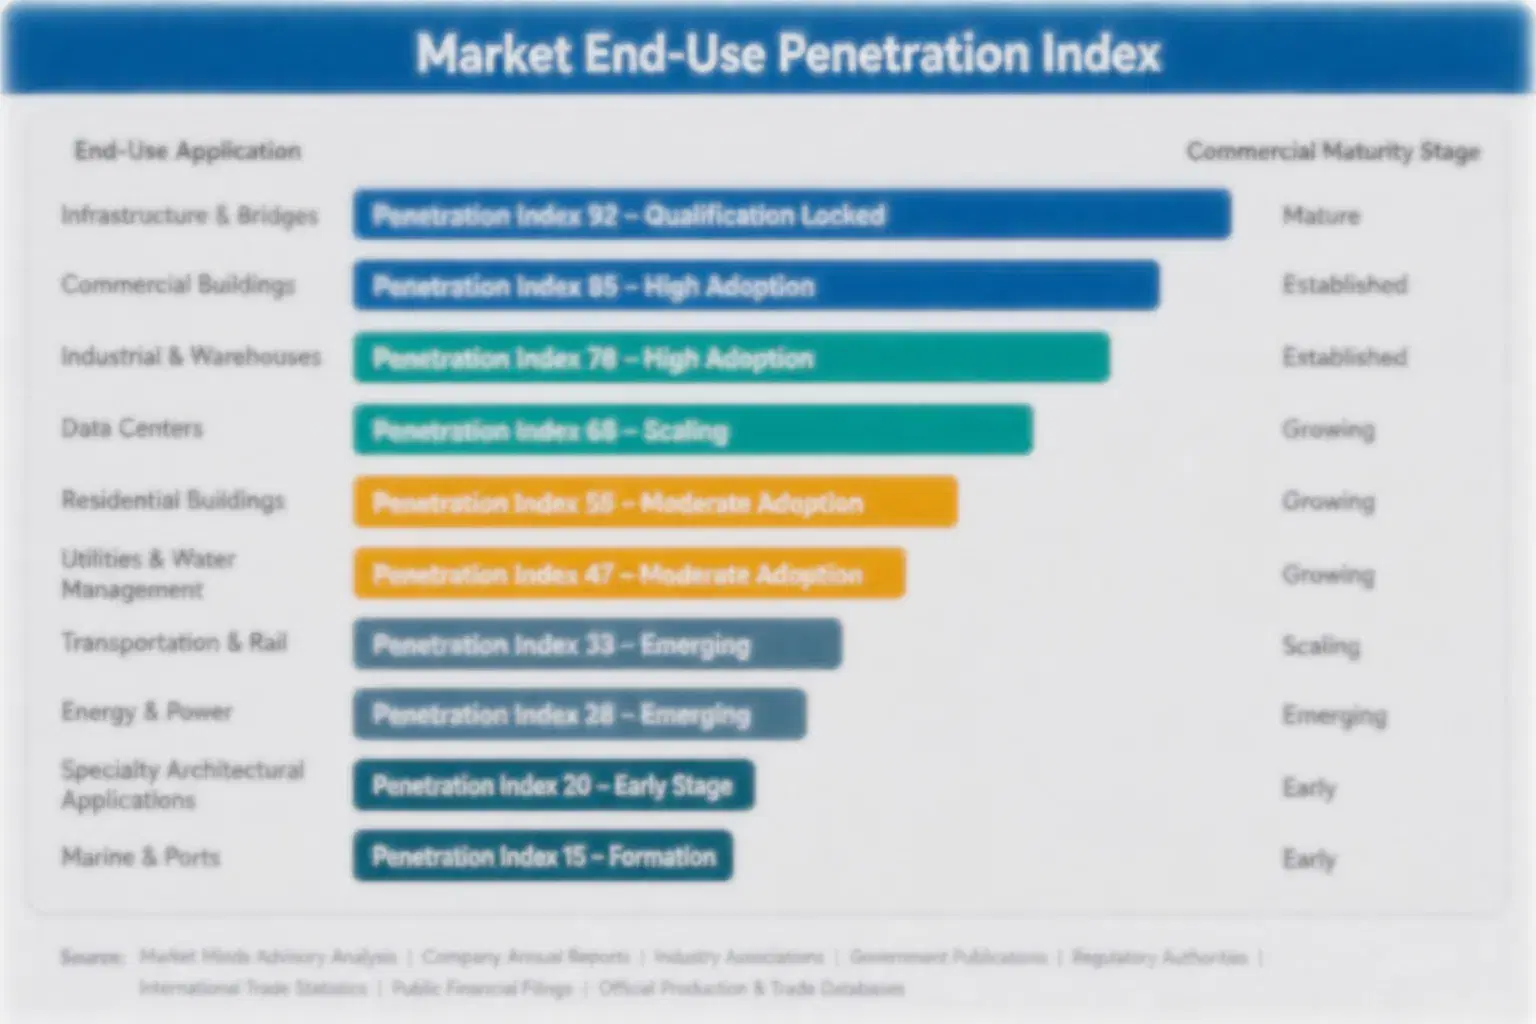
Aqua probiotic demand behaves like an annuity attached to crop cycles, feed programmes and dealer relationships. Once a farm or hatchery sees better survival with a product, reorders follow every crop, and switching means new trial risk, a lost season and dealer retraining. Buyers set annual plans around stocking calendars, so suppliers with reliable lots and quick delivery earn steady volume and priority allocation. Trust, once earned, is slow to lose.
Adoption stickiness differs by end-use vertical. Hatcheries and integrated producers are the deepest, since probiotics are written into protocols and survival data drive every decision. Feed mills are moderately sticky, driven by approvals and formulation costs. Smallholder farmers are more fluid, changing products when price or a neighbour's advice changes, though products with visible results hold customers for several crop cycles.

Buyer profiles are shifting between generations. Older farmers bought on dealer advice and price, while younger farmers and managers ask for trial data, pond monitoring and digital records. Importers and regulators add a third group that sets residue and traceability expectations. Suppliers that publish field data and provide traceable batches win newer buyers.
aqua-probiotic-market-end-use-penetration-index-1789964222865

MMA Verdict on Aqua Probiotic Strategy

These are among the four positions where our research anticipates prominent divergence between winners and laggards over the coming forecast period. Each is grounded in the demand model, the regulatory perimeter, and the announced capacity pipeline.
01 / FIELD PROOF STRATEGY

Run Multi-Farm Trials Before Farmers Discount Probiotics as Unreliable Inputs

Shrimp and Prawn Probiotics grows at 11.9% a year, about 1.40 times the overall market rate, and farmers judge products by survival in their own ponds. Suppliers should invest $0.5 million to $2 million per species programme in multi-farm trials, independent pathogen counts and local summaries, and lift reorder rates by 10 to 18 points. Those that delay will lose dealer trust and price to better documented rivals over the next two years, while prepared suppliers hold reorders, pricing and farmer confidence.
02 / FEED MILL PARTNERSHIP STRATEGY

Win Feed Mill Contracts With Heat-Stable Spores Before Integrated Groups Compete

Freshwater Finfish Probiotics grows at 10.2% a year, about 1.20 times the overall market rate, and feed routes carry about 46% of sales. Suppliers should invest $1 million to $4 million in pelleting validation, registrations and on-site trials with the three largest mills, and win contracts worth 12% to 20% of sales. Those that delay will lose mills to local rivals and in-house programmes over the next two years, while early movers hold volume, customer trust, pricing power and margin across every feed cycle.
03 / LOCAL PRODUCTION STRATEGY

Build Local Fermentation and Dealer Networks Before Regional Rivals Lock Up Channels

Imported products face duties, currency swings and slow delivery, and local fermenters compete on price in every shrimp producing country. Suppliers should invest $3 million to $10 million in local fermentation or toll manufacturing, secure registrations early and train dealers, and cut landed cost by 15% to 25%. Those that delay will lose price-sensitive channels over the next two years, while prepared suppliers hold cost, service and dealer loyalty across every crop cycle, disease season and price downturn that farmers face.
04 / FARM PROGRAMME STRATEGY

Sell Bundled Hatchery and Pond Programmes Before Farmers Treat Probiotics as Commodities

Farmers pay for predictable results, and bundled programmes with dosing, water quality checks and pond monitoring lift revenue per farm by 20% to 35% and cut churn. Suppliers should invest $0.8 million to $3 million, pilot with 20 to 40 farms and price on outcomes such as survival gains. Those that delay will see products commoditised and margins squeezed over the next two years, while prepared suppliers hold farmer relationships, data and pricing across every disease season, crop cycle and price downturn.

Engagement Snapshot From the Field

A live engagement with an industry participant carrying material or product regulatory and market exposure ahead of a defining policy shift, showing how our research translates into a defensible multi-year portfolio strategy.
MARKET MINDS ADVISORY · CLIENT ENGAGEMENT SUMMARY
Aqua Probiotic Producer Strategic Portfolio Review and Transition Roadmap 2026·Investment Scenario on Aqua Probiotic Exposure Evaluation 2025-26
CLIENT PROFILE
The client is a mid-sized Asian aquaculture additive company with annual sales near $55 million (client-reported, unverified by MMA), selling Bacillus powders and liquid probiotics through dealers to shrimp and tilapia farms in four countries. About 80% of sales were generic products, farmers questioned results and switched often, and two large feed mills had asked for heat-stable spore products with trial data. Management wanted a plan to raise margin.
STRATEGIC CHALLENGE
Gross margin on generic powders sat near 32% (client-reported, unverified by MMA), receivables had stretched to 85 days, and competitors offered branded shrimp programmes to the same dealers. Management had to decide whether to fund farm trials, build feed mill products or expand local fermentation, with limited capital and one main plant. Key feed mills wanted validated products within 12 months.
MMA APPROACH
MMA analysed sales, dealer and cost data across 40 products, interviewed 15 farmers, dealers and feed mill technicians, and ran a farm survey on results, price and service across three countries. It modelled margin by product and scenario, compared trial, feed mill and fermentation options by payback and execution risk, and tested each against price and credit scenarios.
KEY FINDINGS
  1. A multi-farm trial programme across three countries would cost about $1.2 million and lift reorder rates by about 14 points (client-reported, unverified by MMA).
  2. A heat-stable spore product with pelleting validation would cost about $2.5 million and open feed mill contracts worth about 15% of sales (client-reported, unverified by MMA).
  3. Local toll manufacturing in one shrimp country would cost about $3 million and cut landed cost by about 18% (client-reported, unverified by MMA).
  4. A dealer credit and sachet programme would cost about $0.7 million and cut receivables to about 60 days (client-reported, unverified by MMA).
CLIENT PROFILE
The client is a mid-sized Asian aquaculture additive company with annual sales near $55 million (client-reported, unverified by MMA), selling Bacillus powders and liquid probiotics through dealers to shrimp and tilapia farms in four countries. About 80% of sales were generic products, farmers questioned results and switched often, and two large feed mills had asked for heat-stable spore products with trial data. Management wanted a plan to raise margin.
STRATEGIC CHALLENGE
Gross margin on generic powders sat near 32% (client-reported, unverified by MMA), receivables had stretched to 85 days, and competitors offered branded shrimp programmes to the same dealers. Management had to decide whether to fund farm trials, build feed mill products or expand local fermentation, with limited capital and one main plant. Key feed mills wanted validated products within 12 months.
MMA APPROACH
MMA analysed sales, dealer and cost data across 40 products, interviewed 15 farmers, dealers and feed mill technicians, and ran a farm survey on results, price and service across three countries. It modelled margin by product and scenario, compared trial, feed mill and fermentation options by payback and execution risk, and tested each against price and credit scenarios.
KEY FINDINGS
  1. A multi-farm trial programme across three countries would cost about $1.2 million and lift reorder rates by about 14 points (client-reported, unverified by MMA).
  2. A heat-stable spore product with pelleting validation would cost about $2.5 million and open feed mill contracts worth about 15% of sales (client-reported, unverified by MMA).
  3. Local toll manufacturing in one shrimp country would cost about $3 million and cut landed cost by about 18% (client-reported, unverified by MMA).
  4. A dealer credit and sachet programme would cost about $0.7 million and cut receivables to about 60 days (client-reported, unverified by MMA).
RECOMMENDED STRATEGY
Phase 1: Phase 1 (Months 1-9): Launch multi-farm trials, develop the heat-stable spore product and design the dealer credit programme with credit insurance. Phase 2: Phase 2 (Months 10-24): Validate pelleting survival with two feed mills, start toll manufacturing and roll out sachet packs and dealer training. Phase 3: Phase 3 (Months 25-42): Scale feed mill contracts, publish trial results and review dealer credit and substrate terms yearly as price data develop.
OUTCOME
Within 42 months, branded programmes and feed mill products reached 34% of sales, blended gross margin rose from about 32% to about 42%, and receivables fell to about 60 days (client-reported, unverified by MMA). Reorder rates rose by about 14 points, landed cost fell by about 18% in the toll manufacturing country, and two feed mills signed multi-year supply agreements.

Frequently Asked Questions

Foundational context covering the market sizes, CAGR, scope, country, region and competition that inform every finding below. This section is provided to cover basics and most often pre-purchase conversations, answered from the MMA Primary Research Dataset.

What is the current size of the Aqua Probiotic Market?

The global aqua probiotic market was valued at $1.00 billion in 2025 on an ingredient and finished-product sales basis. Growth reflects disease pressure and antibiotic limits, offset by variable field results and farmer cash limits.

How large will the Aqua Probiotic Market be by 2036?

The market is projected to reach $2.45 billion by 2036, up from $1.08 billion in 2026. The increase of $1.37 billion reflects shrimp programmes, feed mill adoption and Asian growth.

What is the CAGR for the Aqua Probiotic Market 2026 to 2036?

The market is forecast to grow at an 8.5% CAGR from 2026 to 2036. The bull case reaches 9.8% and the bear case 7.2%, depending on disease pressure, shrimp prices and antibiotic rules.

Which segment is growing fastest?

Shrimp and Prawn Probiotics is the fastest-growing segment at 11.9% CAGR, roughly 1.40 times the overall market rate. Freshwater Finfish Probiotics follows at 10.2% CAGR each year.

Who are the major companies in the Aqua Probiotic Market?

Major companies include Novonesis, Kemin Industries, INVE Aquaculture, Evonik and Lallemand. DSM-Firmenich, Alltech, ADM, Cargill and Nutreco also hold positions in aquaculture health and feed additive markets.

Which country is growing fastest?

India is growing fastest at about 12.5% CAGR, because shrimp expansion, antibiotic restrictions and export residue rules support new volumes. Vietnam and Bangladesh follow as intensive farming grows.

Report Segmentation Architecture

The full report scope spans multiple orthogonal segmentation dimensions, with cross-tabulated demand data provided for each dimension pair. Coverage extends further to regional breakdowns, trend trajectories, and the competitive detail needed to support segment-level decision-making.

By Primary Market Dimension

  • Shrimp and Prawn Probiotics
  • Freshwater Finfish Probiotics
  • Marine Finfish Probiotics
  • Salmonid Probiotics
  • Mollusc and Other Species Probiotics

By End-Use Industry

  • Grow-Out Farms
  • Hatcheries and Nurseries
  • Feed Mills and Premix Makers
  • Integrated Aquaculture Producers

By Commercial Dimension

  • Feed Additive and Premix Sales
  • Pond and Water Treatment Sales
  • Dealer and Distributor Networks
  • Direct Supply to Integrators
  • Programme and Service Contracts

By Region

  • North America
  • Western Europe
  • East Asia
  • South Asia and Pacific
  • Latin America
  • Middle East and Africa
  • Eastern Europe

Scope, Methodology, and Coverage

Every figure in this report is reproducible from documented input assumptions. The scope below maps the historical period, the forecast horizon, the segmentation dimensions, and the countries covered, alongside the underlying primary and qualitative methodology.
Historical Period
2020 to 2025
Forecast Period
2026 to 2036
Base Year
2025 (USD billions; MMA Primary Research Dataset, September 2026)
Market Definition
The market covers global sales of live microbial products for aquaculture, including Bacillus, Lactobacillus, Pediococcus and other strains added to feed, pond and hatchery water for shrimp, finfish, molluscs and other farmed species, sold as ingredients, premixes and finished products. It excludes antibiotics, prebiotic fibres sold alone, feed enzymes, vaccines, disinfectants, and probiotics for terrestrial livestock and pets.
Quantitative Units
USD billions (ingredient and finished-product revenue); tonnes of product for volume references
Segmentation Dimensions
By Farmed Species Group; By End-Use Industry; By Commercial Dimension; By Region
Regions Covered
North America, Western Europe, East Asia, South Asia and Pacific, Latin America, Middle East and Africa, Eastern Europe
Countries Covered
United States, Canada, Norway, Denmark, Spain, Greece, China, Japan, South Korea, India, Vietnam, Indonesia, Thailand, Bangladesh, Ecuador, Chile, Brazil, Egypt, Saudi Arabia, Poland, and additional markets relevant to this sector
Key Companies Profiled
Novonesis, Kemin Industries, INVE Aquaculture, Evonik, Lallemand, DSM-Firmenich, Alltech, ADM, Cargill, Nutreco, Biomin, Adisseo, BiOWiSH Technologies, CJ CheilJedang, Novus International, Phileo by Lesaffre, Aller Aqua, Ecolab, Probiotics International, Guangdong Haid Group
Quantitative Methodology
Primary survey, n=3,800 respondents, Q4 2025, six countries; demand-side model with trade association cross-validation
Qualitative Methodology
47 expert interviews, Q4 2025; applied to validate demand model assumptions, identify emerging dynamics, and assess competitive positioning
Report Format
PDF and XLSX data workbook (Word format preview document)
Publisher
Market Minds Advisory
Report Code
MMA-2026-AGR-177
Published
September 2026
Contact
sales@marketmindsadvisory.com | www.marketmindsadvisory.com

Purchase the full Aqua Probiotic Market Report (2026 to 2036).

The full report delivers a detailed assessment of the aqua probiotic market through 2036, covering farmed species group, end-use and regional forecasts, competitive benchmarking of leading strain owners and additive suppliers, and input cost analysis. It combines MMA primary research, including a six-country survey of 3,800 respondents and 47 expert interviews, with public statistical and company data. Analysts also model disease outbreak scenarios, antibiotic rule timelines and shrimp price paths. Clients receive species margin ranges, channel maps and a case study on growth strategy. Supplier programme and contract frameworks are also included for planning.
Ten-year farmed species demand forecasts by region
Substrate, energy, and freight cost tracking
Competitive benchmarking of leading aqua probiotic suppliers
Antibiotic restriction and feed additive rule tracker
Regional market comparative analysis and forecasts included
Quarterly primary survey data update access

Built For The People Who Decide

From boardroom strategy to bench-side execution, this report is read cover-to-cover by leaders shaping the next decade of their industry, turning demand scenarios, market dynamics and valuation benchmarks into decisions.
CXOs/ Presidents/ VPs/ Managers
M&A and Corporate Development
Strategy Teams and R&D Heads
Procurement and Product Directors
Regulatory and Compliance Leaders
Investor Relations and Equity Analysts