Market Minds Advisory
Application Delivery Network Market

Application Delivery Network Market: Application Delivery Network Market: Appliance Sunk Cost, Cloud Displacement and Configurations Nobody Understands 2026 to 2036

These appliances are full of rules written by people who left the company years ago, and nobody will touch them. That is the moat, and it is also the ceiling.

Lead Analyst

Published

September 2026

Make Smarter Decisions with Customized Research Insights

Request a free sample report and evaluate market opportunities, growth trends, and competitive dynamics relevant to your business needs.

2025 MARKET VALUE$6.7BMarket Size 2025
2036 FORECAST VALUE$15.7BBase Case , 2026 to 2036
CAGR 2026 TO 20368.1 %Bull 9.3% / Bear 6.9%
INCREMENTAL OPPORTUNITY$8.5BNet 10- year value creation
EXPANSION MULTIPLE2.18x2036 value over 2026 base
Strategic Levers
M&A Pipeline
Regional Outlook
Country Rankings
Competitive Intelligence
Segmental Deep-dive
Call-Us : 91 93563 13602

Executive Snapshot and Market Trajectory.

These appliances are full of rules written by people who left the company years ago, and nobody will touch them. That is the moat holding this category together, and it is also why the category cannot grow the way vendors keep forecasting it will.
The market reaches USD 7.2 billion in 2026 and USD 15.7 billion by 2036, a 2.18 times expansion at 8.1% annually. Cloud native delivery and ingress control grows at 12.2%, half again the market rate of 8.1%, because applications built in the past five years never touched an appliance at all. East Asia holds 29% of spending on infrastructure build. Configuration inertia rather than capability holds renewals together here.
Five vendors hold 63% of spending, high for infrastructure software, because migrating an application delivery configuration is a risk nobody volunteers for. F5, Citrix, Radware, Akamai Technologies and A10 Networks lead. Configuration inertia rather than product capability decides most renewal outcomes. Around 57% of configuration rules on a typical appliance have no recorded owner, and migrating a delivery configuration takes roughly sixteen months that nobody volunteers to lead. Nobody volunteers to lead that project.
Market Definition
This report covers application delivery networking: the hardware, software and services that place, secure and optimise traffic in front of applications. It spans cloud native delivery and ingress control, hardware and virtual load balancing appliances, web application firewall and application security modules, global server load balancing and traffic management, application performance optimisation and caching, and the professional services delivered around configuration and migration. It excludes content delivery network capacity services, wide area network optimisation, enterprise firewalls without application awareness, observability platforms, and the applications themselves.
Base Year Value
$6.7B in 2025 (MMA Primary Research Dataset, September 2026)
Forecast Period
2026 to 2036, eleven discrete annual values
CAGR
8.1% base case. Bull 9.3%. Bear 6.9%.
Fastest Growth Segment
Cloud Native Delivery And Ingress Control: 12.2% CAGR
Fastest Growth Country
India: 13.8% CAGR
Fastest Growth Region
South Asia and Pacific: 10.2% CAGR
Largest Region
East Asia: 29% of 2025 global value
Market Leaders
F5, Citrix, Radware, Akamai Technologies and A10 Networks lead on application delivery networking revenue. Source: MMA Analysis.
Primary Survey
n=3,800 procurement and R&D decision-makers, Q4 2025, six countries
Methodology
Demand-side build-up, cross-validated against public data, 47 expert interviews

Application Delivery Network Market Forecast Scenarios

application-delivery-network-market-size-forecast-scenario-1790002805344
Between 2020 and 2025 the category compounded at 6.9%, which flattered the installed base and understated the shift underneath it. Appliance revenue held up because nobody could safely remove the devices, while every application written in that period was delivered by something else entirely. The installed base was not growing so much as refusing to leave, which is a different commercial condition altogether.
The base case holds 8.1% on three mechanisms. Cloud native delivery keeps growing because new applications arrive with ingress control built into how they are deployed rather than in front of them. Application security modules keep attaching to existing appliances because that is where traffic still passes for legacy estate. And regulated industries keep buying appliances they can physically point to, which is an argument no amount of architecture discussion resolves.
The bull case at 9.3% assumes security attach rates rise as application-layer attacks push spending toward the traffic path, which favours whoever already sits there. The bear case at 6.9% is estate retirement, where organisations finally decommission legacy applications in volume and take the appliances with them faster than cloud native revenue replaces the lost maintenance.

Nobody Touches The Rules

The commercial position here is fear rather than function. Around 57% of configuration rules on a typical appliance have no recorded owner or business justification, and no operations team will remove a rule that might be load-bearing. Migrating a delivery configuration takes around 16 months and nobody volunteers for that project. Appliances stay in production about nine years because removing them is riskier than keeping them.
TOP FIVE CONCENTRATION63%High, reflecting migration risk rather than any product capability difference
UNDOCUMENTED RULE SHARE57%Configuration rules with no recorded owner or business justification
APPLIANCE SERVICE LIFE9 yearsTypical time an appliance remains in production before replacement
CLOUD NATIVE APPLICATION SHARE64%New applications delivered without any traditional appliance in path
MIGRATION PROJECT DURATION16 monthsTypical time to move delivery configuration off an incumbent platform
SECURITY MODULE ATTACH48%Deployments carrying application security modules alongside delivery functions
New applications never met an appliance. Around 64% of applications written in the past five years are delivered with ingress control built into how they deploy rather than sitting in front of them, which means the growth in this category is not happening where the installed base is. Cloud native delivery and ingress control grows at 12.2% against 8.1% for the market, and it competes against nothing incumbent.
Security is what keeps the appliance relevant. Around 48% of deployments now carry application security modules alongside delivery functions, because the traffic path is where inspection happens and that path already exists. Vendors attaching security to appliances are monetising position rather than capability, which is a reasonable thing to do and considerably more durable than defending load balancing on technical merit.
"Every one of these boxes has rules on it that nobody alive at the company can explain. The vendor knows it, the customer knows it, and the renewal happens anyway. That is not a technology moat, it is an archaeology problem, and it works better than any feature ever did."
Director, Application Infrastructure and Delivery Practice · MMA Technology Practice · September 2026

Market Trends

Undocumented Configuration Prevents Any Platform Change

Around 57% of configuration rules on a typical appliance have no recorded owner or business justification, and no operations team removes a rule that might turn out to be load-bearing. Migration takes around 16 months and nobody volunteers for it. Appliances stay in production about nine years for that reason rather than any technical one, which makes incumbency in this category unusually durable and almost entirely unrelated to product quality. Vendors benefit from a position they did nothing to create and cannot meaningfully strengthen through product development. Archaeology is the moat.
Market Impact: Security attaches to 48% of deployments

New Applications Never Pass Through An Appliance

Around 64% of applications written in the past five years are delivered with ingress control built into their deployment rather than sitting behind a separate appliance, which means growth is not occurring where the installed base is. Cloud native delivery and ingress control grows at 12.2% against 8.1% for the market and competes against nothing incumbent. Vendors defending appliance renewals are protecting a base that is stable rather than expanding at all. Those decisions are taken by platform engineering teams who have never met the network operations group that owns the appliance estate.
Market Impact: India compounds at 13.8% yearly

Market Opportunities and Growth Drivers

Security Attach Monetises The Traffic Path Position

Around 48% of deployments now carry application security modules alongside delivery functions, because inspection has to happen where traffic passes and that path already exists in front of legacy applications. Vendors attaching security are monetising position rather than capability, which is considerably more durable than defending load balancing on technical merit. Application-layer attack volumes keep pushing security spending toward the traffic path, which favours whoever already occupies it. Security requirements also survive an application being rebuilt more reliably than delivery configuration does, since inspection follows traffic wherever it goes. Position outlasts platforms.
Market Impact: Migration takes about 16 months

Asian Infrastructure Build Deploys Without Legacy Constraints

India compounds at 13.8%, ahead of every other market, because application infrastructure is being built rather than migrated and cloud native delivery is chosen from the outset without any appliance estate to work around. East Asia holds 29% of spending on the same mechanism at larger scale. Vendors whose commercial model depends on appliance renewal reach those buyers poorly, since there is nothing installed for them to renew. Regional cloud providers also supply delivery capability natively, which competes with independent vendors from a direction Western markets encounter far less often.
Market Impact: Appliances last about 9 years

Market Restraints and Challenges

Installed Base Is Stable Rather Than Growing

Appliance revenue holds because organisations cannot safely remove the devices, not because they are buying more of them. The root cause is that around 57% of rules are undocumented and migration takes roughly 16 months, which makes removal riskier than retention. Commercially this produces a durable base with no expansion in it. Mitigation runs through security module attach, through cloud native product lines sold to different buyers, and through migration services that monetise the problem directly. Vendors defending appliance renewals are protecting a base that is stable rather than expanding anywhere.
Market Impact: Some 57% of rules undocumented

Estate Retirement Removes Appliances Along With Applications

When an organisation finally decommissions a legacy application it removes the appliance in front of it at the same time, and that retirement is not replaced by anything from the same vendor. The root cause is that the replacement application arrives cloud native with delivery built in. Commercially this converts a stable base into a declining one. Mitigation runs through cloud native portfolios, through security positions that survive the application change, and through migration engagement. Security positions survive that replacement where delivery configuration reliably does not, which is the difference between participating and disappearing.
Market Impact: Around 64% bypass appliances
3 additional market trends, 4 additional growth drivers, and 2 additional restraints and challenges are covered in the full report. Contact sales@marketmindsadvisory.com to access the complete intelligence.

Segment CAGR and Growth Architecture

Segmentation follows delivery model and function, since each carries quite different buyer, competitive exposure and renewal behaviour. Six classes cover the market: cloud native delivery and ingress control, web application firewall and security modules, hardware and virtual load balancing appliances, global server load balancing and traffic management, application performance optimisation and caching, and configuration and migration services.
application-delivery-network-market-market-share-analysis-1790002806286

Cloud Native Delivery And Ingress Control

Cloud native delivery and ingress control grows at 12.2%, half again the market rate of 8.1%, because around 64% of applications written in the past five years arrive with ingress built into how they deploy rather than behind a separate appliance. This segment competes against nothing incumbent, which is unusual in infrastructure and explains the growth rate more than any capability does. It also reaches a different buyer entirely: platform engineering teams rather than the network operations groups who own appliance estates and their undocumented rules. Product, pricing and sales motion all differ from the appliance business, which most incumbents underestimate. Treating cloud native as a feature of the appliance line reaches nobody who takes those decisions.
CAGR 12.2%

Web Application Firewall And Security Modules

Web application firewall and security modules compound at 10.6% because inspection has to happen where traffic passes and around 48% of deployments now attach security to the delivery path that already exists in front of legacy applications. Vendors doing this are monetising position rather than capability, which is a considerably more durable argument than defending load balancing on technical merit. Security also survives an application replacement more often than delivery does, since the requirement moves with the traffic rather than with the platform. That durability is worth considerably more than any delivery capability argument a vendor can still make in this category. Attach rates keep climbing as application layer attack volumes rise.
CAGR 10.6%
Full segment breakdown across 6 segments available in the complete report.

Regional Architecture and Country Demand Map

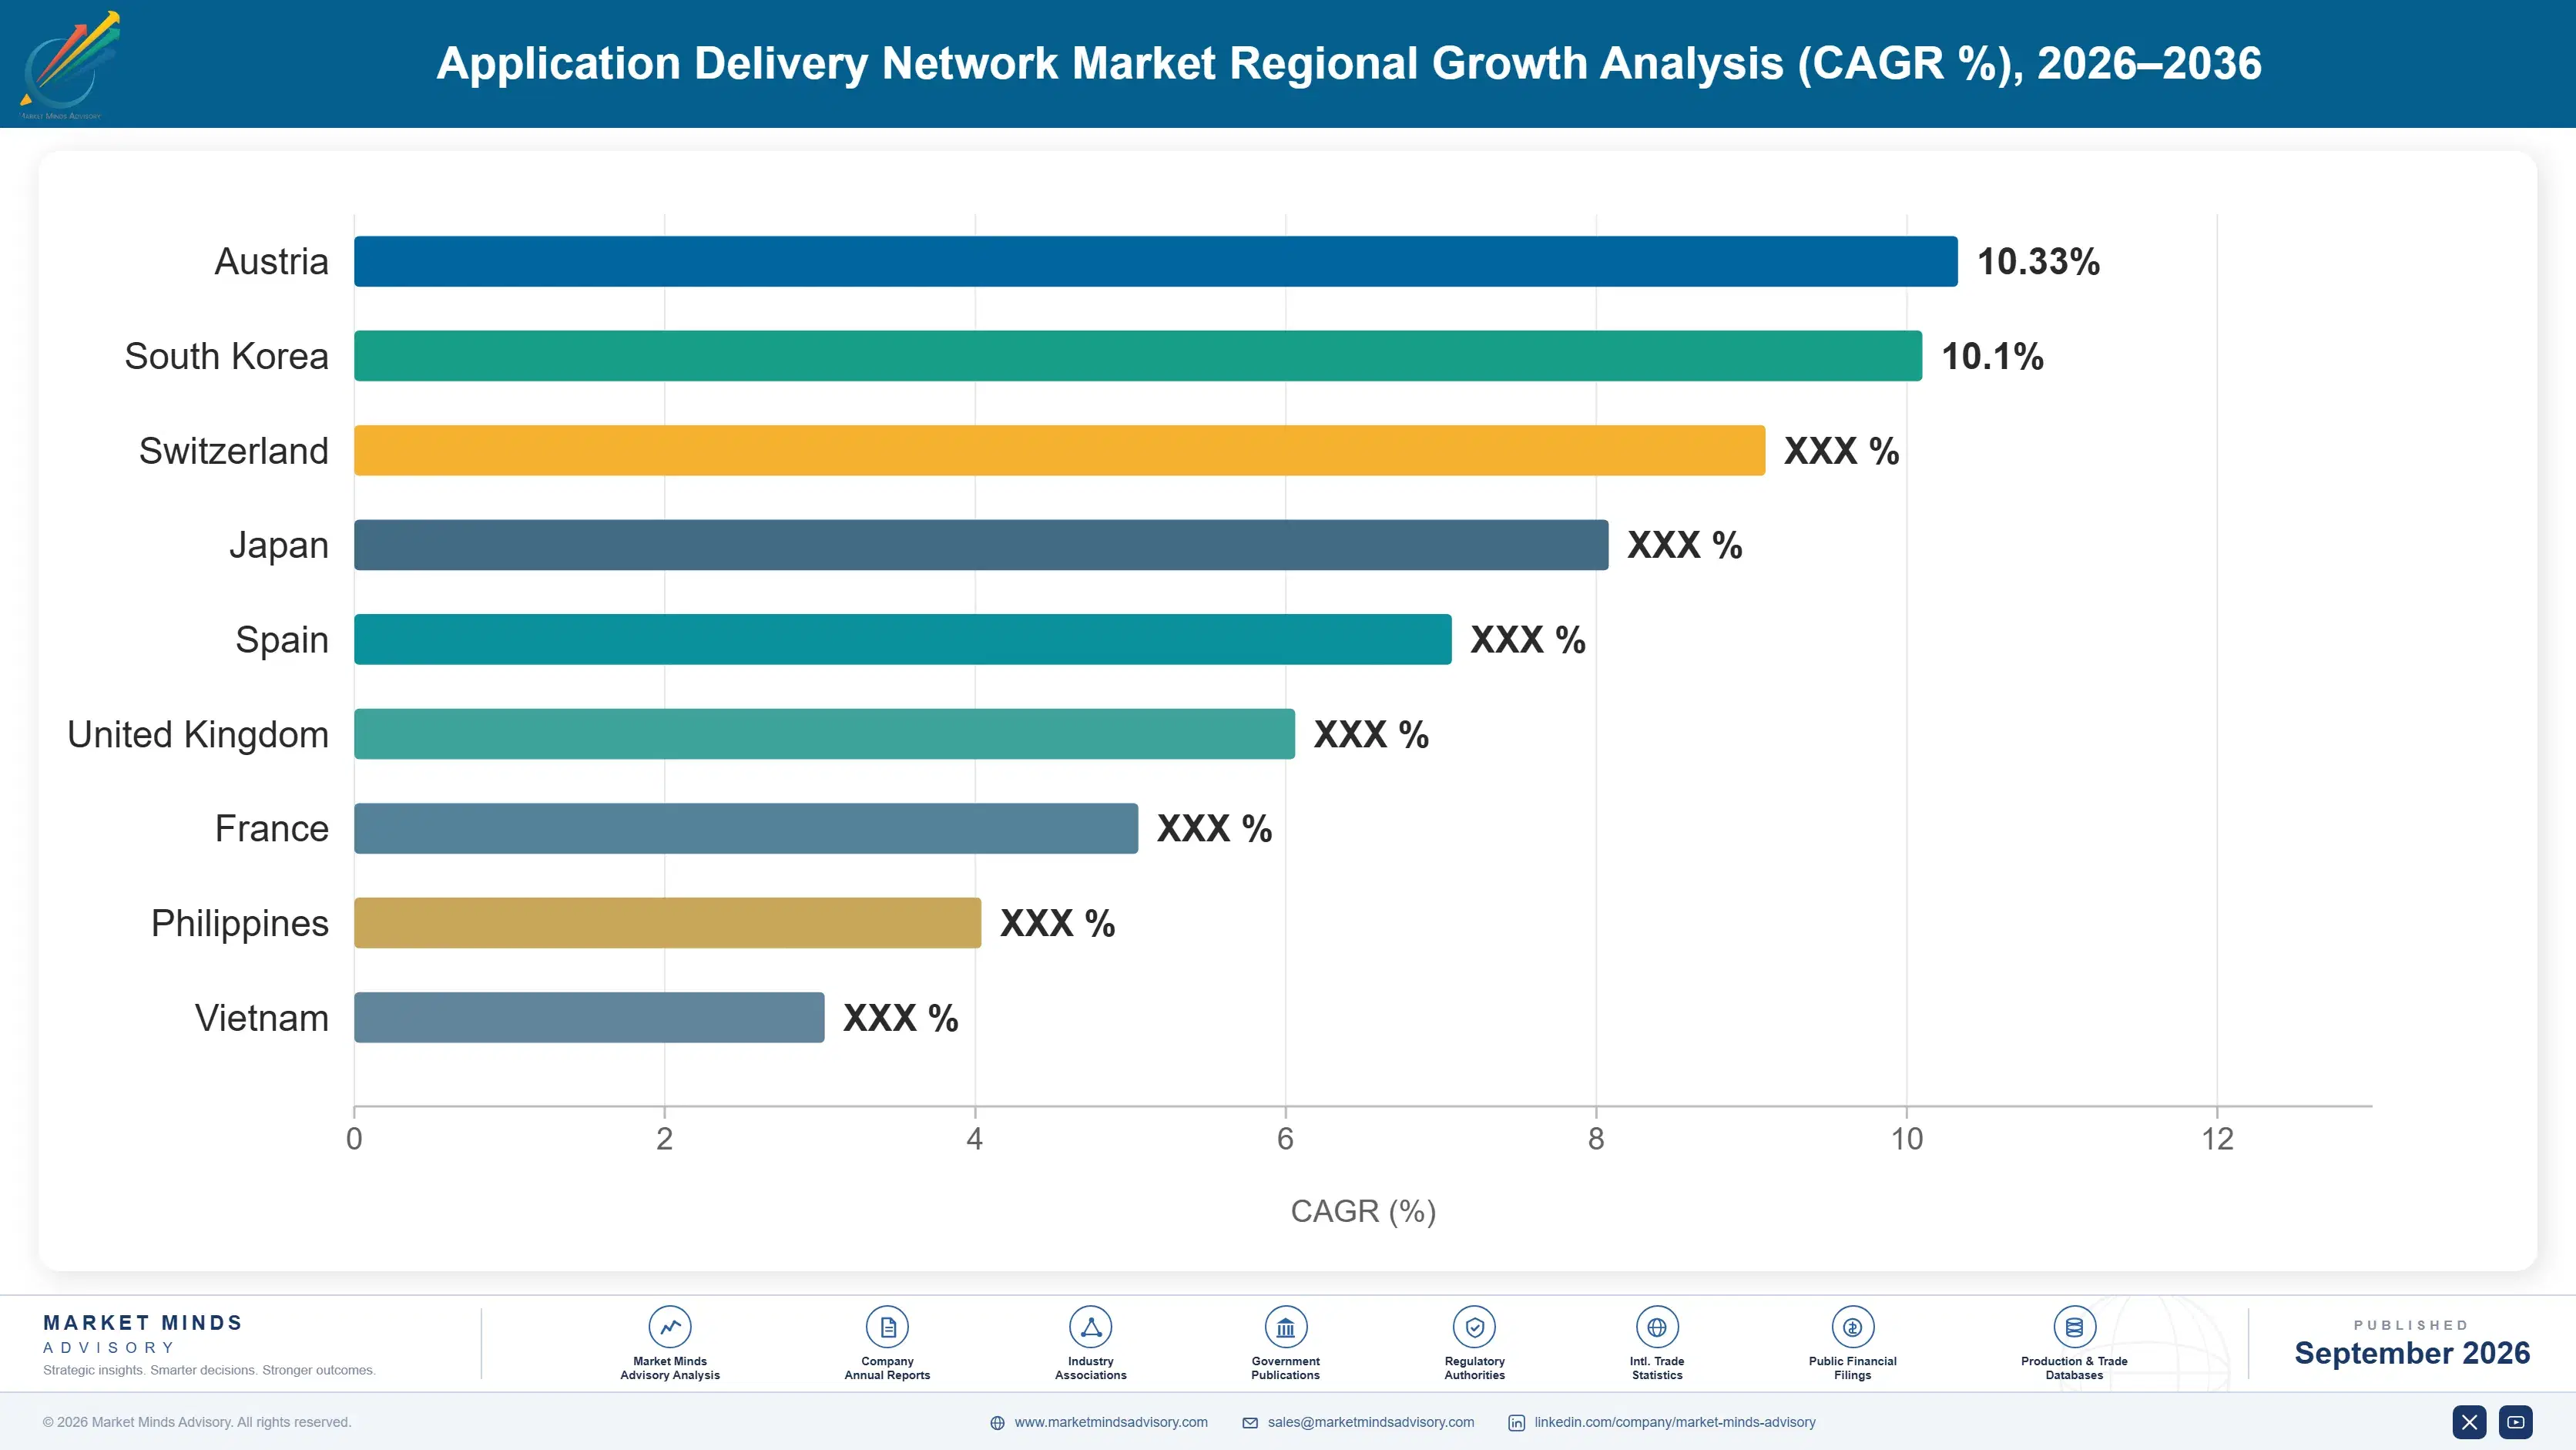
East Asia holds 29% of spending, the largest regional share, because application infrastructure is being built rather than migrated and cloud native delivery is chosen from the outset. North America follows at 27% on the largest installed appliance base. India compounds fastest at 13.8% on new infrastructure build.

East Asia

East Asia takes 29% of spending, the largest regional share, because application infrastructure across Chinese and Southeast Asian operators and enterprises is being built rather than migrated, and cloud native delivery gets chosen from the outset without any appliance estate to work around. Regional cloud providers also supply delivery capability natively, which competes with independent vendors from a direction Western markets encounter less. Growth at 9.0% runs above the global rate on infrastructure construction rather than on any appliance replacement. Vendors whose commercial model rests on appliance renewal reach those buyers poorly, since there is nothing installed for them to renew at all. Nothing installed means nothing to defend. Native supply competes hard.
Share: 29% | CAGR: 9.0% (2026 to 2036)

North America

North America accounts for 27% of spending, where the largest installed appliance base sits and where undocumented configuration is consequently most entrenched. F5, Akamai Technologies and A10 Networks all built positions here across enterprise and service provider estates. Migration services revenue is highest in this region for exactly that reason, since organisations eventually confront configurations nobody can explain. Growth at 8.5% sits above the global rate on security attach rather than on appliance expansion. Estate retirement is also furthest advanced here, which makes this the region where the installed base first stops being stable. Migration services revenue is highest here for exactly that reason, since organisations eventually confront configurations that nobody left can explain.
Share: 27% | CAGR: 8.5% (2026 to 2036)
Regional intelligence for 5 additional markets available in the complete report: Western Europe, South Asia and Pacific, Latin America, Middle East and Africa, Eastern Europe. Contact sales@marketmindsadvisory.com.
application-delivery-network-market-country-cagr-analysis-1790002807210

Where Delivery Revenue Now Sits

Undocumented configuration rather than product capability holds the installed base, new applications never encounter an appliance at all, and security attach monetises a position that load balancing no longer justifies. The four levers below follow those conditions rather than any argument about delivery performance. Each addresses a commercial condition instead. Performance stopped mattering. Capability converged.

Monetise The Traffic Path Through Security Attach

Around 48% of deployments now carry application security modules, because inspection happens where traffic passes and that path already exists in front of legacy applications. Vendors attaching security are monetising position rather than capability, which is considerably more durable than defending load balancing on merit. Security also survives an application replacement more often than delivery does, since the requirement follows the traffic rather than the platform underneath it. Position is more durable than capability. Inspection has to sit somewhere, and it sits where traffic already passes today. Legacy paths persist.
Market Impact: Security now attaches to fully 48% of deployments

Sell Migration Services To Solve The Archaeology

Around 57% of configuration rules have no recorded owner and migration takes roughly 16 months, which is exactly why nobody starts one. Vendors offering to do the archaeology convert their own moat into a services revenue line rather than waiting for a competitor to offer it first. That engagement also positions the vendor for whatever replaces the appliance, which is the only way an incumbent participates in the estate retirement it otherwise loses. Waiting hands that revenue to somebody else. Nobody else wants that work. Somebody will offer it. Better it be you.
Market Impact: Fully 57% of rules now lack any owner

Reach Platform Teams, Not Network Operations

Around 64% of applications written recently arrive with ingress built into deployment, and those decisions are taken by platform engineering teams who have never met the network operations group owning appliance estates. Vendors selling through established network relationships reach the wrong buyer entirely for the growing segment. The product, the pricing and the sales motion all differ, and treating cloud native as a feature of the appliance line reaches nobody who matters. Around 64% of new applications land there. Established network relationships reach the wrong person entirely. Two motions are required.
Market Impact: Around 64% of applications now bypass appliances entirely

Defend Regulated Estates On Physical Location

Regulated industries and sovereignty-conscious buyers purchase appliances they can physically point to, which is not a technical argument and does not respond to architecture discussion at all. Appliances stay in production around 9 years in those environments and refresh predictably. Vendors dismissing that preference as legacy thinking are conceding the most stable revenue in this category to competitors willing to sell what the buyer actually wants. Those estates refresh predictably every 9 years, which is the most forecastable revenue anywhere in this category. Dismissing it concedes stable revenue. Buyers want boxes.
Market Impact: Appliances now last around 9 full years each

Who Controls the Margin Pool

Five vendors hold 63% of application delivery networking spending, high for infrastructure software, and that position rests on migration risk rather than on any product capability difference between the participants. F5, Citrix, Radware, Akamai Technologies and A10 Networks lead. All participants are assessed on application delivery networking revenue rather than on broader security, content delivery or virtualisation businesses they also operate. Concentration has held for a decade because nobody wants to be the person who broke the traffic path.
Competition runs on installed configuration inertia and security attach far more than on delivery performance, which converged years ago. The second dimension is cloud native portfolio credibility, because that segment reaches platform engineering teams who have no relationship with the network operations groups incumbent vendors have sold to for two decades.

Pressure is emerging from cloud providers and open source ingress controllers supplying delivery capability natively at no separate cost. Rankings shift where infrastructure is built rather than migrated and where estate retirement accelerates, particularly across India, East Asia and North America. Vendors without a credible cloud native line carry the most exposure to that displacement.
application-delivery-network-market-company-positioning-matrix-1790002808122

Competitive Moat and Risk Dimensions

F5

Moat: Configuration Inertia Depth

F5 sits underneath application estates where around 57% of configuration rules have no recorded owner and migration takes roughly 16 months, which makes removal a project nobody volunteers to lead. That inertia holds renewals regardless of product comparison. Competitors demonstrating better capability still have to persuade an operations team to touch rules it has deliberately avoided for years.
F5

Risk: Estate Retirement Exposure

When an organisation decommissions a legacy application it removes the appliance at the same time, and the replacement arrives cloud native with delivery already built in. Inertia protects against migration and not against retirement. A base held by reluctance rather than preference declines as the applications behind it are finally replaced by something else.
AKAMAI TECHNOLOGIES

Moat: Traffic Path Security Position

Akamai holds security positions in the traffic path where application-layer inspection has to happen, and around 48% of deployments now attach security to delivery for exactly that reason. Security requirements follow the traffic rather than the platform, which means the position survives an application being rebuilt. That durability is considerably better than anything load balancing capability provides on its own.
AKAMAI TECHNOLOGIES

Risk: Appliance Estate Distance

Security attach revenue that rides on somebody else's appliance depends on that appliance staying in place, and estate retirement removes both together. A position built on the traffic path rather than the device is stronger in principle and still exposed when the path itself gets redrawn during an application replacement programme.

Players Tracked

Prominent Players

F5
Citrix
Radware
Akamai Technologies
A10 Networks

Other Key Players

Fortinet
Cloudflare
Imperva
Barracuda Networks
Kemp Technologies
HAProxy Technologies
NGINX
Traefik Labs
Array Networks
Snapt
Loadbalancer.org
Edgio
Fastly
Amazon Web Services
Google Cloud

Recent Developments

FEBRUARY 2025

Organisations Confront Undocumented Delivery Configuration During Migration

Enterprises attempting application delivery platform migration encountered configuration rules nobody could explain or safely remove, a project experience rather than any corporate transaction. Around 57% of rules typically have no recorded owner, and migration runs about sixteen months largely because that archaeology has to be completed before anything moves.
Signal: The moat here is archaeological rather than technical, and it works better than any product feature.
AUGUST 2024

Platform Teams Choose Ingress Control At Deployment

Platform engineering teams increasingly selected ingress control as part of application deployment rather than requesting delivery infrastructure from network operations, an organisational development rather than any acquisition. Around 64% of recently written applications now arrive this way, which bypasses the buyer relationship incumbent vendors spent two decades building.
Signal: The growing segment is bought by people who have never once met the incumbent vendor's contact.
JUNE 2025

Security Attach Rises As Application Layer Attacks Grow

Application security module attach to delivery deployments rose as application-layer attack volumes increased, a demand development rather than any corporate event. Around 48% of deployments now carry security alongside delivery, because inspection has to happen where traffic passes and that path already exists in front of legacy applications.
Signal: Security spending now follows the traffic path, which favours whoever already occupies that position right now.

What Delivery Products Cost

Product engineering absorbs roughly 29% of vendor cost, split awkwardly between maintaining appliance platforms that generate most revenue and building cloud native products that generate most growth. Sales and marketing take around 33%, reflecting long enterprise cycles and a second buyer that existing relationships do not reach. Support absorbs about 17%, with hardware manufacturing taking the remaining balance for appliance vendors.
Enterprise software sales costs rose through 2023 and 2024 as vendors funded separate motions for network operations and platform engineering buyers who share almost no purchasing process. F5 Annual Report 2024 and Akamai Technologies Annual Report 2024 both record sales investment and product portfolio transition among principal operating variables. Vendors running a single sales motion across both buyers reached the growing segment considerably less effectively than those funding two.

The competitive disadvantage mechanism is portfolio split rather than input cost. A vendor maintaining appliance platforms and cloud native products carries two engineering roadmaps against one revenue base, while a cloud native competitor carries only one. Exposure concentrates among incumbents, since abandoning the appliance line means abandoning the revenue that funds everything and keeping it means funding development the growing segment never uses.
application-delivery-network-market-cost-volatility-analysis-1790002808517

Fund Two Sales Motions For Two Distinct Buyers

Sales and marketing absorb around 33% of cost and the network operations buyer shares almost no purchasing process with the platform engineering buyer taking cloud native decisions. A single motion reaches one properly and the other barely at all. Funding two costs more and is the only route into a segment where most new applications now land.

Share Data Plane Engineering Across Both Product Lines

Product engineering absorbs roughly 29% of cost and maintaining separate appliance and cloud native roadmaps duplicates the traffic handling work at the centre of both. A shared data plane with different control and packaging above it spreads that expense considerably. The architectural decision has to be taken deliberately, since two teams left alone will build two of everything.

Convert Support Load Into Migration Services Revenue

Support absorbs about 17% of cost and much of it goes to configuration questions on estates nobody documented properly. Packaging that expertise as chargeable migration services converts a cost line into revenue. It also positions the vendor for whatever replaces the appliance, which is the only route into an estate retirement. Cost becomes revenue.

Portfolio Architecture for Margin Defence

Margin architecture separates on renewal durability rather than on technical difficulty. Application performance optimisation and caching earn least, since cloud providers and content delivery networks supply equivalent capability as a feature. Hardware appliances and traffic management sit above on installed position. Cloud native delivery, security modules and migration services earn most, because each attaches to either growth or the archaeology that nobody else will do.
The volume versus premium tension runs between appliance renewal and cloud native adoption, which reward opposite investments entirely. Appliance revenue rewards platform maintenance and relationship management with network operations at high margin and no growth. Cloud native rewards product development and a sales motion aimed at platform teams at lower margin and real growth. Funding both from one revenue base is what makes this category commercially difficult.

High-value pools concentrate in security modules and in migration services, and neither is reached through delivery capability. Security requires inspection depth and threat intelligence that load balancing vendors had to acquire. Migration requires willingness to do configuration archaeology customers dread. Both explain why five vendors hold 63% while the growth in this category increasingly arrives from participants who never sold an appliance at all.

Volume / Commodity-Adjacent

Application performance optimisation and caching, where cloud providers and content delivery networks supply equivalent capability as an included feature rather than a purchase. The thirteen point spread separates vendors bundling it with delivery from those selling it standalone against free alternatives.
Gross Margin: 41% to 54%

Premium / Certified

Hardware and virtual load balancing appliances and global server load balancing and traffic management, where installed configuration inertia rather than capability determines renewal outcomes. The thirteen point spread tracks how much appliance platform engineering each vendor carries against shared data plane development.
Gross Margin: 59% to 72%

Sustainability / Regulatory / Next-Generation

Cloud native delivery and ingress control, web application firewall and security modules and configuration and migration services, each attached to growth or to archaeology nobody else attempts. The thirteen point spread reflects security inspection depth and willingness to carry migration risk.
Gross Margin: 76% to 89%
application-delivery-network-market-portfolio-architecture-1790002809523

High-value Sub-segments and Strategic Watch-out

Cloud Native Delivery And Ingress Control

Grows at 12.2% because around 64% of recent applications arrive with ingress built into deployment rather than behind appliances. The thirteen point spread reflects platform team reach. This segment competes against nothing incumbent, which is unusual in enterprise infrastructure. Platform teams decide it entirely. Nothing incumbent competes.
Gross Margin: 76% to 89%

Web Application Firewall And Security Modules

Grows at 10.6% because inspection happens where traffic passes and around 48% of deployments now attach security. The thirteen point spread reflects threat intelligence depth. Security requirements survive application replacement more reliably than delivery ones do. Position beats capability here. Requirements follow the traffic. Attach keeps rising.
Gross Margin: 76% to 89%

Hardware And Virtual Load Balancing Appliances

Grows at 5.4% on a base held by migration risk rather than by preference or expansion. The thirteen point spread reflects platform engineering load. Estate retirement removes these devices along with the applications they sit in front of. Renewals happen through reluctance. Retirement removes both together.
Gross Margin: 59% to 72%

Application Performance Optimisation And Caching

Grows at 3.9%, slowest of the six classes, as cloud providers and content delivery networks include equivalent capability at no separate cost. The thirteen point spread reflects bundling position. Standalone products here compete directly against something already paid for. Free alternatives are already paid for.
Gross Margin: 41% to 54%

Why Rules Hold Renewals

The annuity here is undocumented configuration rather than customer preference. Around 57% of rules on a typical appliance have no recorded owner, and an operations team will not remove something that might be load-bearing for a business process nobody can name. Migration takes roughly 16 months for that reason. Renewals happen because the alternative is a project nobody will sponsor, which is a durable position built on nothing the vendor did.
Depth varies by whether security rode along. A deployment carrying application security modules holds a requirement that survives the application being rebuilt, because inspection follows the traffic wherever it goes. A pure delivery deployment disappears with the application it fronted. Around 48% of deployments carry that attach today.

The buyer has split into two who do not speak. A network operations team evaluated appliance capability, throughput and support against an estate it owns and fears touching. A platform engineering team evaluates ingress control as part of how an application deploys and has never met the network group. Vendors selling through one relationship reach half this market, and it is the half that is not growing.
application-delivery-network-market-end-use-penetration-index-1790002810283

What Wins Delivery Renewals

These are among the four positions where our research anticipates prominent divergence between winners and laggards over the coming forecast period. Each is grounded in the demand model, the regulatory perimeter, and the announced capacity pipeline.
01 / TRAFFIC PATH MONETISATION

Sell Inspection, Not Load Balancing

Around 48% of deployments now carry application security modules because inspection has to happen where traffic passes and that path already exists in front of legacy applications anyway. Vendors attaching security are monetising a position rather than defending a capability that converged years ago across every serious participant. Security also survives an application being rebuilt more often than delivery does, since the requirement follows the traffic rather than the platform beneath it during a replacement programme or an estate rationalisation.
02 / ARCHAEOLOGY SERVICE OFFER

Charge For The Migration Nobody Starts

Around 57% of configuration rules have no recorded owner and migration takes roughly sixteen months, which is precisely why organisations keep deferring the project year after year. Vendors offering to do that archaeology convert their own moat into a services line rather than waiting for a competitor to offer it instead. The engagement also positions them for whatever replaces the appliance, which is the only route into an estate retirement it otherwise loses entirely to a competitor instead and monetises it first.
03 / SECOND BUYER COVERAGE

Reach Platform Teams Who Never Called

Around 64% of applications written recently arrive with ingress built into deployment, and platform engineering teams take those decisions without ever contacting the network operations group that owns appliance estates. Vendors selling through established network relationships reach entirely the wrong buyer for the only growing segment. The product, pricing and sales motion all differ, and treating cloud native as an appliance feature reaches nobody who actually makes the decision in the growing half of this market for that particular segment.
04 / REGULATED ESTATE DEFENCE

Sell Boxes Where Boxes Are Wanted

Regulated industries and sovereignty-conscious buyers purchase appliances they can physically point to, which is not a technical argument and does not respond to any architecture discussion a vendor might attempt. Appliances stay in production around nine years in those environments and refresh predictably on that cycle. Vendors dismissing the preference as legacy thinking concede the most stable revenue in this category to whoever sells what the buyer wants without any argument at all and refreshes on schedule year after year.

Engagement Snapshot From the Field

A live engagement with an industry participant carrying material or product regulatory and market exposure ahead of a defining policy shift, showing how our research translates into a defensible multi-year portfolio strategy.
MARKET MINDS ADVISORY · CLIENT ENGAGEMENT SUMMARY
Application Delivery Network Producer Strategic Portfolio Review and Transition Roadmap 2026·Investment Scenario on Application Delivery Network Exposure Evaluation 2025-26
CLIENT PROFILE
A financial services group running a large appliance estate it had tried and failed twice to migrate, while its own new applications were being deployed with ingress control the network team knew nothing about. Management had approved a third migration attempt, without establishing why the previous two had stalled at the same point. Nobody had asked why the first two stalled.
STRATEGIC CHALLENGE
Network operations wanted appliance refresh to keep the estate supported. Platform engineering wanted the appliance estate gone entirely. Nobody had reconciled those positions or examined why two previous migrations had failed, and the vendor renewal was due within two quarters alongside the migration proposal. Neither function had examined what the earlier attempts actually encountered before stopping.
MMA APPROACH
MMA audited the appliance configuration to establish how many rules had identifiable owners and traced why the earlier migrations stalled. We mapped which applications were already delivered without appliances and modelled retirement against refresh across the estate. Work drew on 47 expert interviews conducted in Q4 2025 with enterprises, delivery vendors and platform engineering teams.
KEY FINDINGS
  1. Around 61% of appliance rules had no identifiable owner, and both previous migrations had stalled at exactly that discovery rather than on any technical obstacle.
  2. Roughly half the group's active applications were already delivered without any appliance, and the network team had no visibility of them at all.
  3. Retiring applications rather than migrating their configurations removed 2 appliances entirely within the year at no migration cost (client-reported, unverified by MMA).
  4. Security inspection requirements survived every single application replacement the review examined, while delivery configuration did not survive any of them at all.
CLIENT PROFILE
A financial services group running a large appliance estate it had tried and failed twice to migrate, while its own new applications were being deployed with ingress control the network team knew nothing about. Management had approved a third migration attempt, without establishing why the previous two had stalled at the same point. Nobody had asked why the first two stalled.
STRATEGIC CHALLENGE
Network operations wanted appliance refresh to keep the estate supported. Platform engineering wanted the appliance estate gone entirely. Nobody had reconciled those positions or examined why two previous migrations had failed, and the vendor renewal was due within two quarters alongside the migration proposal. Neither function had examined what the earlier attempts actually encountered before stopping.
MMA APPROACH
MMA audited the appliance configuration to establish how many rules had identifiable owners and traced why the earlier migrations stalled. We mapped which applications were already delivered without appliances and modelled retirement against refresh across the estate. Work drew on 47 expert interviews conducted in Q4 2025 with enterprises, delivery vendors and platform engineering teams.
KEY FINDINGS
  1. Around 61% of appliance rules had no identifiable owner, and both previous migrations had stalled at exactly that discovery rather than on any technical obstacle.
  2. Roughly half the group's active applications were already delivered without any appliance, and the network team had no visibility of them at all.
  3. Retiring applications rather than migrating their configurations removed 2 appliances entirely within the year at no migration cost (client-reported, unverified by MMA).
  4. Security inspection requirements survived every single application replacement the review examined, while delivery configuration did not survive any of them at all.
RECOMMENDED STRATEGY
Phase 1: Phase one: stop attempting configuration migration, since both previous attempts stalled on rules with no identifiable owner and the third would too. Phase 2: Phase two: retire applications and their appliances together on the existing decommissioning schedule rather than migrating configurations that nobody understands. Phase 3: Phase three: move security inspection requirements onto a platform that survives an application replacement, since delivery configuration demonstrably does not.
OUTCOME
The group abandoned configuration migration and retired appliances alongside the applications they fronted (client-reported, unverified by MMA). Estate size fell without any migration project, and security inspection moved to a platform that survived the application changes. Appliance retirement now follows the application decommissioning schedule, which outlasted the engagement.

Frequently Asked Questions

Foundational context covering the market sizes, CAGR, scope, country, region and competition that inform every finding below. This section is provided to cover basics and most often pre-purchase conversations, answered from the MMA Primary Research Dataset.

What is the current size of the Application Delivery Network Market?

Global value reaches USD 7.2 billion in 2026, measured as application delivery networking revenue across six classes. The 2025 base was USD 6.7 billion on the same basis.

How large will the Application Delivery Network Market be by 2036?

The market reaches USD 15.7 billion by 2036, an increase of USD 8.5 billion across the forecast period. That represents 2.18 times expansion from the 2026 base.

What is the CAGR for the Application Delivery Network Market 2026 to 2036?

The base case runs at 8.1% annually, with a bull case at 9.3% if security attach rates rise further and a bear case at 6.9% if legacy estate retirement accelerates sharply.

Which segment is growing fastest?

Cloud native delivery and ingress control grows at 12.2%, half again the market rate of 8.1%. Recent applications arrive with ingress built into how they deploy.

Who are the major companies in the Application Delivery Network Market?

F5, Citrix, Radware, Akamai Technologies and A10 Networks lead on delivery networking revenue, holding 63% between them. Fortinet and Cloudflare hold smaller positions in the category.

Which country is growing fastest?

India leads at 13.8%, because application infrastructure is being built rather than migrated and cloud native delivery is chosen from the outset. Indonesia and Vietnam follow.

Report Segmentation Architecture

The full report scope spans multiple orthogonal segmentation dimensions, with cross-tabulated demand data provided for each dimension pair. Coverage extends further to regional breakdowns, trend trajectories, and the competitive detail needed to support segment-level decision-making.

By Delivery Model And Function

  • Cloud Native Delivery And Ingress Control
  • Web Application Firewall And Security Modules
  • Configuration And Migration Services
  • Hardware And Virtual Load Balancing Appliances
  • Global Server Load Balancing And Traffic Management
  • Application Performance Optimisation And Caching

By End-Use Industry

  • Financial Services And Insurance
  • Telecommunications Service Providers
  • Public Sector And Government
  • Retail And Commerce Platforms
  • Healthcare And Life Sciences
  • Technology And Software Companies

By Commercial Dimension

  • Perpetual Appliance Purchase
  • Subscription And Consumption Licensing
  • Cloud Marketplace Procurement
  • Managed Service Provider Delivery
  • Channel Partner Resale
  • Professional Services Engagement

By Region

  • North America
  • Western Europe
  • East Asia
  • South Asia and Pacific
  • Latin America
  • Middle East and Africa
  • Eastern Europe

Scope, Methodology, and Coverage

Every figure in this report is reproducible from documented input assumptions. The scope below maps the historical period, the forecast horizon, the segmentation dimensions, and the countries covered, alongside the underlying primary and qualitative methodology.
Historical Period
2020 to 2025
Forecast Period
2026 to 2036
Base Year
2025 (USD billions; MMA Primary Research Dataset, September 2026)
Market Definition
This report covers application delivery networking: the hardware, software and services placing, securing and optimising traffic in front of applications, spanning cloud native delivery and ingress control, hardware and virtual load balancing appliances, web application firewall and security modules, global server load balancing and traffic management, application performance optimisation and caching, and configuration and migration services. It excludes content delivery capacity services, wide area network optimisation, enterprise firewalls without application awareness, observability platforms, and applications themselves.
Quantitative Units
USD millions, application delivery networking revenue basis; deployments and appliance units; undocumented configuration rule share as a percentage; appliance service life in years; cloud native application share; migration project duration in months; security module attach rates.
Segmentation Dimensions
Delivery model and function; end-use industry; commercial licensing route; geography across seven regions.
Regions Covered
North America, Western Europe, East Asia, South Asia and Pacific, Latin America, Middle East and Africa, Eastern Europe
Countries Covered
United States, Canada, United Kingdom, Germany, France, Netherlands, Switzerland, Spain, Poland, Czechia, China, Japan, South Korea, India, Australia, Singapore, Indonesia, Brazil, Mexico, United Arab Emirates.
Key Companies Profiled
F5, Citrix, Radware, Akamai Technologies, A10 Networks, Fortinet, Cloudflare, Imperva, Barracuda Networks, Kemp Technologies, HAProxy Technologies, NGINX, Array Networks, Fastly, Edgio.
Quantitative Methodology
Primary survey, n=3,800 respondents, Q4 2025, six countries; demand-side model with trade association cross-validation
Qualitative Methodology
47 expert interviews, Q4 2025; applied to validate demand model assumptions, identify emerging dynamics, and assess competitive positioning
Report Format
PDF and XLSX data workbook (Word format preview document)
Publisher
Market Minds Advisory
Report Code
MMA-2026-TEC-241
Published
September 2026
Contact
sales@marketmindsadvisory.com | www.marketmindsadvisory.com

Purchase the full Application Delivery Network Market Report (2026 to 2036).

This report sizes the global application delivery network market from 2026 to 2036 across six delivery models, six industries and seven regions. It explains why around 57% of appliance configuration rules having no recorded owner makes migration risk rather than product capability the thing holding renewals together. Around 64% of recent applications arriving with ingress built into deployment is analysed as growth occurring entirely outside the installed base. Security attach reaching 48% of deployments is examined as the position that survives application replacement. Regional analysis explains why East Asia holds 29% of spending.
Six delivery models sized through to 2036
Undocumented configuration quantified against migration project duration
Cloud native application share analysed against installed appliance base
Twenty named vendors assessed on delivery networking revenue
Four revenue levers with quantified commercial impact
Anonymised financial services platform engagement documented in full

Built For The People Who Decide

From boardroom strategy to bench-side execution, this report is read cover-to-cover by leaders shaping the next decade of their industry, turning demand scenarios, market dynamics and valuation benchmarks into decisions.
CXOs/ Presidents/ VPs/ Managers
M&A and Corporate Development
Strategy Teams and R&D Heads
Procurement and Product Directors
Regulatory and Compliance Leaders
Investor Relations and Equity Analysts