Market Minds Advisory
Apparel Re-commerce Market

Apparel Re-commerce Market: Apparel Re-commerce Market: Per-Item Cost, Authentication and Who Actually Earns

Every unit is unique, which breaks every assumption in retail systems built for case packs, and the per-item handling cost is what decides who makes money here rather than any sustainability argument.

Lead Analyst

Published

September 2026

Make Smarter Decisions with Customized Research Insights

Request a free sample report and evaluate market opportunities, growth trends, and competitive dynamics relevant to your business needs.

2025 MARKET VALUE$48.0BMarket Size 2025
2036 FORECAST VALUE$163.7BBase Case , 2026 to 2036
CAGR 2026 TO 203611.8 %Bull 13.0% / Bear 10.6%
INCREMENTAL OPPORTUNITY$110.0BNet 10- year value creation
EXPANSION MULTIPLE3.05x2036 value over 2026 base
Strategic Levers
M&A Pipeline
Regional Outlook
Country Rankings
Competitive Intelligence
Segmental Deep-dive
Call-Us : 91 93563 13602

Executive Snapshot and Market Trajectory.

Re-commerce is a logistics business wearing a sustainability costume. Every item is a single unit with no replacement, which means somebody has to photograph it, describe it, price it, store it and ship it individually, and that cost is roughly 9.40 dollars against an average sale under 25.
Brand-operated resale programmes grow at 17.7%, half again the market rate of 11.8%, and almost none of that is about resale revenue. A brand runs resale to keep its secondary market inside its own environment, protect price integrity and generate trade-in credit that funds a primary purchase. East Asia holds 29% of transacted value on platform scale and the deepest authentication infrastructure anywhere in the world. Very few Western operators appreciate that properly.
Concentration is low at 21% and it stays low because a marketplace is easy to launch and impossible to make profitable at small scale. Sell-through runs at 43%, which means most of what gets listed never sells and somebody paid to process it anyway. The commercial question in this category is not growth. It is whether per-item cost falls faster than average selling prices do. Nobody has answered that.
Market Definition
The apparel re-commerce market covers the resale of previously owned clothing, footwear and fashion accessories through organised commercial channels, spanning peer-to-peer listing platforms, managed consignment marketplaces, brand-operated resale programmes, charity and thrift retail, off-price liquidation resale and cross-border used clothing wholesale. Scope is measured as gross merchandise value transacted. Excluded are rental and subscription wardrobe services, repair and alteration services, textile recycling into fibre, unsold new inventory sold as new, and private sales between individuals outside any platform.
Base Year Value
$48.0B in 2025 (MMA Primary Research Dataset, August 2026)
Forecast Period
2026 to 2036, eleven discrete annual values
CAGR
11.8% base case. Bull 13.0%. Bear 10.6%.
Fastest Growth Segment
Brand-Operated Resale Programmes: 17.7% CAGR
Fastest Growth Country
India: 13.8% CAGR
Fastest Growth Region
South Asia and Pacific: 13.8% CAGR
Largest Region
East Asia: 29% of 2025 global value
Market Leaders
Vinted, Mercari, Alibaba Group, ThredUp and The RealReal. Source: MMA Analysis, July 2026.
Primary Survey
n=3,800 procurement and R&D decision-makers, Q4 2025, six countries
Methodology
Demand-side build-up, cross-validated against public data, 47 expert interviews

Apparel Re-commerce Market Forecast Scenarios

apparel-re-commerce-market-size-forecast-scenario-1788171135670
Between 2020 and 2025 the category compounded at 10.4%, and the growth came from supply rather than from demand. Households cleared wardrobes during lockdowns, platforms made listing trivial, and the volume of available garments rose faster than the number of buyers. Sell-through fell across most platforms as a result, which is a growth number and an operational warning at the very same time.
The 11.8% base case rests on three mechanisms. Brand-operated programmes are pulling transacted value into channels with better economics, because a brand does not need the resale margin to justify the operation. Authentication capability keeps moving the luxury and premium tiers into organised platforms and away from private sale. And European separate textile collection obligations are pushing enormous supply into the system whether anybody wants it or not. Only the first two are commercially good news at all.
The bull case at 13.0% turns on automated intake and machine grading cutting per-item processing cost materially, which would change the arithmetic for every operator at once. The bear case at 10.6% is oversupply: mandatory textile collection across Europe combined with import restrictions in several African markets leaves collected volume with nowhere commercially viable to go at all.

One Item, One Unit, One Photograph

Conventional retail systems assume a SKU with many units behind it. Re-commerce has neither: every garment is its own SKU with a quantity of one, so forecasting is impossible, replenishment does not exist, and every item needs individual photography, description and measurement before it can be sold. Processing costs around 9.40 dollars per item and the average sale is under 25. That gap is the business model.
TOP FIVE CONCENTRATION21%Share of transacted value held by the five largest platforms
AVERAGE SELLING PRICEUSD 24.60Mean transaction value per item across all resale channels
PER-ITEM PROCESSING COSTUSD 9.40Cost to intake, photograph, list and ship each item
SELL-THROUGH RATE43%Portion of listed items that find a buyer eventually
BRAND PROGRAMME SHARE8%Portion of transacted value flowing through brand operated channels
AUTHENTICATION COST SHARE14% of take rateVerification expense as proportion of platform commission earned
Sell-through at 43% is the number that should govern every decision and rarely does. More than half of what gets listed never finds a buyer, and the processing cost was incurred regardless, which means the successful items are carrying the failures. Platforms that price intake selectively earn considerably more than platforms that accept everything, and the ones accepting everything usually describe it as inventory growth.
Authentication is where the money concentrates and where the cost sits. Verifying a luxury item consumes around 14% of the commission earned on it, which is enormous for a service the buyer treats as table stakes. It is also the only genuine barrier in this category: a marketplace is easy to build, a database of counterfeits and a trained authentication team is not, and neither accumulates quickly.
"Every deck in this category opens with a landfill statistic and closes with a growth curve, and the operating cost per item appears on neither slide. That number is the business, and the operators who put it on the first slide are the ones still trading in five years."
Director, Retail Platforms and Circular Commerce Practice · MMA Technology Practice · August 2026

Market Trends

Brands run resale for control rather than revenue

Brand-operated resale programmes grow at 17.7% against a market rate of 11.8%, and the resale margin is close to irrelevant to the brands running them. What the programme actually buys is control: the secondary market stays inside the brand's own environment rather than on a platform it cannot see, price integrity holds because the brand sets the resale floor, and trade-in credit converts a disposal decision into a primary purchase. Only 8% of transacted value currently flows through these channels, which is why the growth rate matters more than the share does.
Market Impact: Costs 14% of commission earned

Mandatory textile collection is flooding the supply side

European separate collection obligations for textiles took effect from the start of 2025, requiring member states to collect used clothing apart from general waste. That produces an enormous increase in collected volume without any corresponding increase in buyers, and the traditional outlet for low-grade material has been narrowing as several African markets restrict used clothing imports. The commercial consequence is a growing quantity of garments that cost money to collect, sort and grade and have almost no resale value at all. Sorting operators are absorbing that squeeze first of all.
Market Impact: Converts 8% into primary sales

Market Opportunities and Growth Drivers

Authentication capability moved luxury onto platforms

Secondhand luxury used to trade privately or through specialist dealers because nobody could verify a bag at a distance. Trained authentication teams, counterfeit databases and increasingly image-based verification have moved that trade onto organised platforms, which take a commission on transactions that previously happened invisibly. The capability costs around 14% of the commission earned to run, which is heavy, and it is also the only genuine barrier to entry anybody has built in this category. Japanese and Korean operators hold the deepest capability by a considerably wider margin than anybody expected.
Market Impact: Costs 9.40 dollars per item

Trade-in credit converts disposal into a purchase

The commercially interesting mechanism inside brand resale is not the resale itself but the credit issued for a trade-in. A household clearing a wardrobe receives store credit rather than cash, which converts what would have been a charity donation into a primary purchase at full margin. Brands running the arithmetic properly find that the credit costs less than the customer acquisition it replaces, which is why programmes keep launching despite generating almost no resale profit. Very few brands describe the mechanism in quite that particular way in public at all.
Market Impact: Closes 3 major export destinations

Market Restraints and Challenges

Per-item processing cost caps the addressable inventory

Intake, authentication, photography, description, storage and shipping cost around 9.40 dollars per item, which means any garment worth less than roughly twenty dollars cannot be handled profitably by a managed operator. The root cause is that each item is unique and none of the work amortises across a case pack the way conventional retail handling does. Commercial impact is enormous: the majority of donated and collected clothing falls below that threshold and simply cannot enter the managed system. Participants are responding with automated measurement, image-based grading, seller-side listing tools and selective intake that rejects low-value items at the door.
Market Impact: Grows brand channels 17.7%

Import restrictions are closing the low-grade outlet

Several African markets have moved to restrict or tariff used clothing imports on the grounds that they suppress domestic textile manufacturing, and the Ghanaian and East African trade has been the destination for low-grade material that no organised platform can sell. The root cause is industrial policy rather than any objection to the garments themselves. Commercial impact falls on sorting and grading operators who bought collected volume assuming an export route existed. Mitigation runs through fibre recycling offtake agreements, domestic downcycling into wiping cloth and insulation, and intake selection that stops the material entering the chain at all.
Market Impact: Adds collection across 27 states
3 additional market trends, 4 additional growth drivers, and 2 additional restraints and challenges are covered in the full report. Contact sales@marketmindsadvisory.com to access the complete intelligence.

Segment CAGR and Growth Architecture

Segmentation follows resale channel, the dimension on which per-item economics, authentication requirement and take rate all operate together. Charity retail and cross-border wholesale carry enormous volume at almost no value per item. Brand programmes and managed consignment carry the growth and the margin, because both handle items worth enough to justify the cost of processing them properly.
apparel-re-commerce-market-market-share-analysis-1788171136261

Brand-Operated Resale Programmes

Brand-operated resale programmes grow at 17.7%, half again the market rate of 11.8%, and they are the only channel where the operator does not need the transaction to be profitable. A brand runs resale to keep the secondary market visible and inside its own environment, to hold a resale floor that protects primary pricing, and to issue trade-in credit that converts a wardrobe clear-out into a full-margin purchase. That means the programme can absorb a per-item processing cost that would close a standalone marketplace. Only 8% of transacted value flows this way today, which is precisely why the growth rate deserves more attention than the headline share currently does anywhere.
CAGR 17.7%

Managed Consignment Marketplaces

Managed consignment marketplaces at 14.4% take the item off the seller entirely, handling photography, description, pricing, storage and fulfilment in exchange for a considerably larger commission than a peer-to-peer listing platform charges. That model only works above a value threshold, because processing costs around 9.40 dollars per item regardless of what it sells for. The operators making money here are the ones who reject aggressively at intake, and the operators struggling are the ones who accepted everything and called the result inventory growth. Authentication capability is what separates the two, and it takes years rather than funding rounds to build. That distinction has closed more platforms than any competitor ever did.
CAGR 14.4%
Full segment breakdown across 6 segments available in the complete report.

Regional Architecture and Country Demand Map

East Asia takes 29% of transacted value on platform scale and the deepest authentication capability anywhere. Western Europe holds the highest per-household participation. North America holds the most brand-operated programmes. Those are three quite different businesses sharing one single category name between all of them.

East Asia

Platform scale and authentication depth together explain this position, and Western operators consistently underestimate both. Chinese secondhand platforms carry user bases larger than the entire population of most Western markets, Japanese secondhand retail has been a mainstream and respectable channel for decades rather than a recent sustainability development, and Korean platforms convert neighbourhood proximity into transactions at volumes no Western equivalent reaches. Japanese secondhand luxury operators hold the deepest authentication capability in the world, built over decades of domestic demand for verified pre-owned goods. That capability is now being exported as a service to Western platforms that cannot build it. Very few people outside the region have noticed that trade at all.
Share: 29% | CAGR: 12.8% (2026 to 2036)

North America

Brand-operated resale started here and the region holds more programmes than everywhere else combined. American brands adopted trade-in and branded resale earliest, partly because the platform economics were visible to them and partly because the alternative was watching their product trade on marketplaces they could not see. The managed consignment operators that built the category are meanwhile finding the per-item arithmetic unforgiving, and several have narrowed intake sharply or exited categories entirely. Authentication remains the strongest position anybody holds. Growth at 11.2% is respectable and considerably less exciting than the funding of a few years ago implied. The correction in this region is largely finished and it was entirely necessary.
Share: 26% | CAGR: 11.2% (2026 to 2036)
Regional intelligence for 5 additional markets available in the complete report: Western Europe, South Asia and Pacific, Latin America, Middle East and Africa, Eastern Europe. Contact sales@marketmindsadvisory.com.
apparel-re-commerce-market-country-cagr-analysis-1788171136806

Four Moves On Per-Item Cost

None of these four is a demand problem, because supply and demand both arrive without much help in this category. Each attacks the cost of handling a unique item or the value of the item being handled, which together decide whether a transaction earns anything at all after the processing has actually been paid for.

Reject aggressively at the intake door

Processing costs around 9.40 dollars per item whether or not it sells, and sell-through runs at 43%, which means the successful items are carrying the majority that never move. Every rejected low-value garment saves the full processing cost immediately. Operators applying strict intake criteria report materially better contribution per item than operators accepting everything, and the difference is not close. The instinct to maximise inventory is the single most expensive habit in this category, and it usually gets described in a board pack as perfectly healthy inventory growth figures instead.
Market Impact: Saves the 9.40 dollars on every rejected item

Sell authentication as a service to others

Authentication costs around 14% of the commission earned to operate, and it is the only genuine barrier anybody has built in this category. An operator with a trained team and a counterfeit database can verify items for brands, retailers and smaller platforms who cannot build either, at margins the resale transaction itself rarely reaches. Japanese operators have already begun exporting exactly that service to Western platforms. It converts a heavy cost centre into a revenue line without adding one single extra item of inventory into the warehouse at any point.
Market Impact: Monetises the 14% authentication cost base as revenue

Run the brand programme for the credit

Brand-operated resale grows at 17.7% and generates almost no resale profit, which confuses anybody modelling it as a revenue line. The value is the trade-in credit: a household clearing a wardrobe takes store credit rather than cash and spends it at full primary margin, which costs the brand less than the customer acquisition it replaces. Only 8% of transacted value currently runs this way. A brand that measures the programme on primary sales rather than on resale revenue reaches a completely different investment decision about the whole thing altogether entirely.
Market Impact: Converts 8% of transacted value into primary sales

Contract fibre recycling offtake before the valve closes

European separate textile collection obligations from 2025 are adding enormous volume to a system whose traditional outlet for low-grade material is narrowing as African markets restrict imports. A sorting operator without a downstream route for the unsellable fraction is holding a cost, not an asset. Offtake agreements with fibre recyclers, insulation manufacturers and wiping cloth converters cost margin and remove that exposure entirely. The operators signing those agreements now are doing it at prices that will not be available once the export route closes properly on everybody all at once.
Market Impact: Secures offtake ahead of the 2025 collection obligations

Who Controls the Margin Pool

CR5 stands at 21%, measured on gross merchandise value transacted, since most participants report differently and several report nothing. That is low even for a marketplace category, and the reason is that launching a resale platform requires no inventory and very little capital. The gap between the largest platforms and the field below them is wide, and almost entirely a function of accumulated supply liquidity.
Competition runs on liquidity, authentication and per-item cost. Liquidity decides everything on a peer-to-peer platform, because a seller lists where buyers already are and a buyer searches where listings already are. Authentication decides who can trade the premium tiers where the money is. Per-item cost decides whether a managed operator earns anything at all. Marketing spend buys liquidity temporarily and rarely holds it once the spending stops.

Rankings will move where brands take control. A brand-operated programme removes inventory from the open platforms and puts it inside an environment the brand governs, and the 17.7% growth rate says that is happening faster than platform operators acknowledge. The technology suppliers powering those programmes are quietly becoming the more interesting businesses. The pressure comes from the brands rather than from competing platforms, which nobody planned for.
apparel-re-commerce-market-company-positioning-matrix-1788171137337

Competitive Moat and Risk Dimensions

VINTED

Moat: Liquidity across European markets

The platform holds the largest apparel resale user base anywhere, and marketplace liquidity compounds: sellers list where buyers are and buyers search where listings are, so the leader gets further ahead without doing anything. Charging the buyer rather than the seller removed the listing hesitation every competitor fought. Rebuilding that base would take a competitor years and enormous spend.
VINTED

Risk: Low average selling price

The model works on high transaction volume at low individual values, which leaves very little commission on each item to absorb payment costs, dispute handling and fraud losses. Moving upmarket into premium tiers requires authentication capability the platform has not historically needed. Brand-operated programmes are meanwhile pulling exactly the higher-value inventory out of open marketplaces and into their own environments.
MERCARI

Moat: Secondhand as mainstream retail

Japanese secondhand buying is a mainstream and respectable channel rather than a sustainability decision, which gives the platform a customer base that behaves differently from Western equivalents. Repeat purchase and listing behaviour both run higher as a result. That cultural position took decades to establish and no amount of marketing reproduces it in a market where secondhand still carries connotations.
MERCARI

Risk: Domestic market largely saturated

Penetration in the home market is high enough that growth now depends on transaction value rather than on new users, and the Japanese population is contracting. International expansion has proved harder than expected, because the cultural position that makes the domestic business work does not travel. Competing on liquidity in markets where an incumbent holds it is an expensive contest.

Players Tracked

Prominent Players

Vinted
Mercari
Alibaba Group
ThredUp
The RealReal

Other Key Players

Poshmark
Naver Corporation
eBay
Etsy
Vestiaire Collective
Rebag
Grailed
Komehyo
Daikokuya
Bunjang
Danggeun Market
Trove
Archive Resale
Goodwill Industries
Winmark Corporation

Recent Developments

JANUARY 2025

European separate textile collection obligations took effect

Separate collection requirements for used textiles came into force across European Union member states, obliging municipalities to collect clothing apart from general household waste. Collected volume rose sharply while resale demand did not, leaving sorting operators holding material with no profitable outlet and prices for low-grade fractions falling accordingly.
Signal: Regulation increased supply into a system that had no capacity to absorb any more of it.
JUNE 2025

Mercari expanded authentication capacity for premium categories

Mercari brought expanded authentication and inspection capacity into operation in Japan, an organic capacity expansion rather than any acquisition or joint venture. The investment targets premium apparel and accessories, where verification is what allows a platform to take commission on transactions that would otherwise happen privately between individuals.
Signal: Authentication capacity is the constraint on moving a resale platform into the genuinely profitable tiers anywhere.
SEPTEMBER 2025

African markets tightened restrictions on used clothing imports

Further East African trade measures restricted or tariffed imported used clothing on the grounds that the trade suppresses domestic textile manufacturing. European sorting operators who had relied on the export route for low-grade material found volumes rejected at port, and grading prices in the collection chain adjusted within one quarter.
Signal: The release valve for unsellable clothing is closing, and European collection economics depend entirely on it.

The Cost Of Handling One

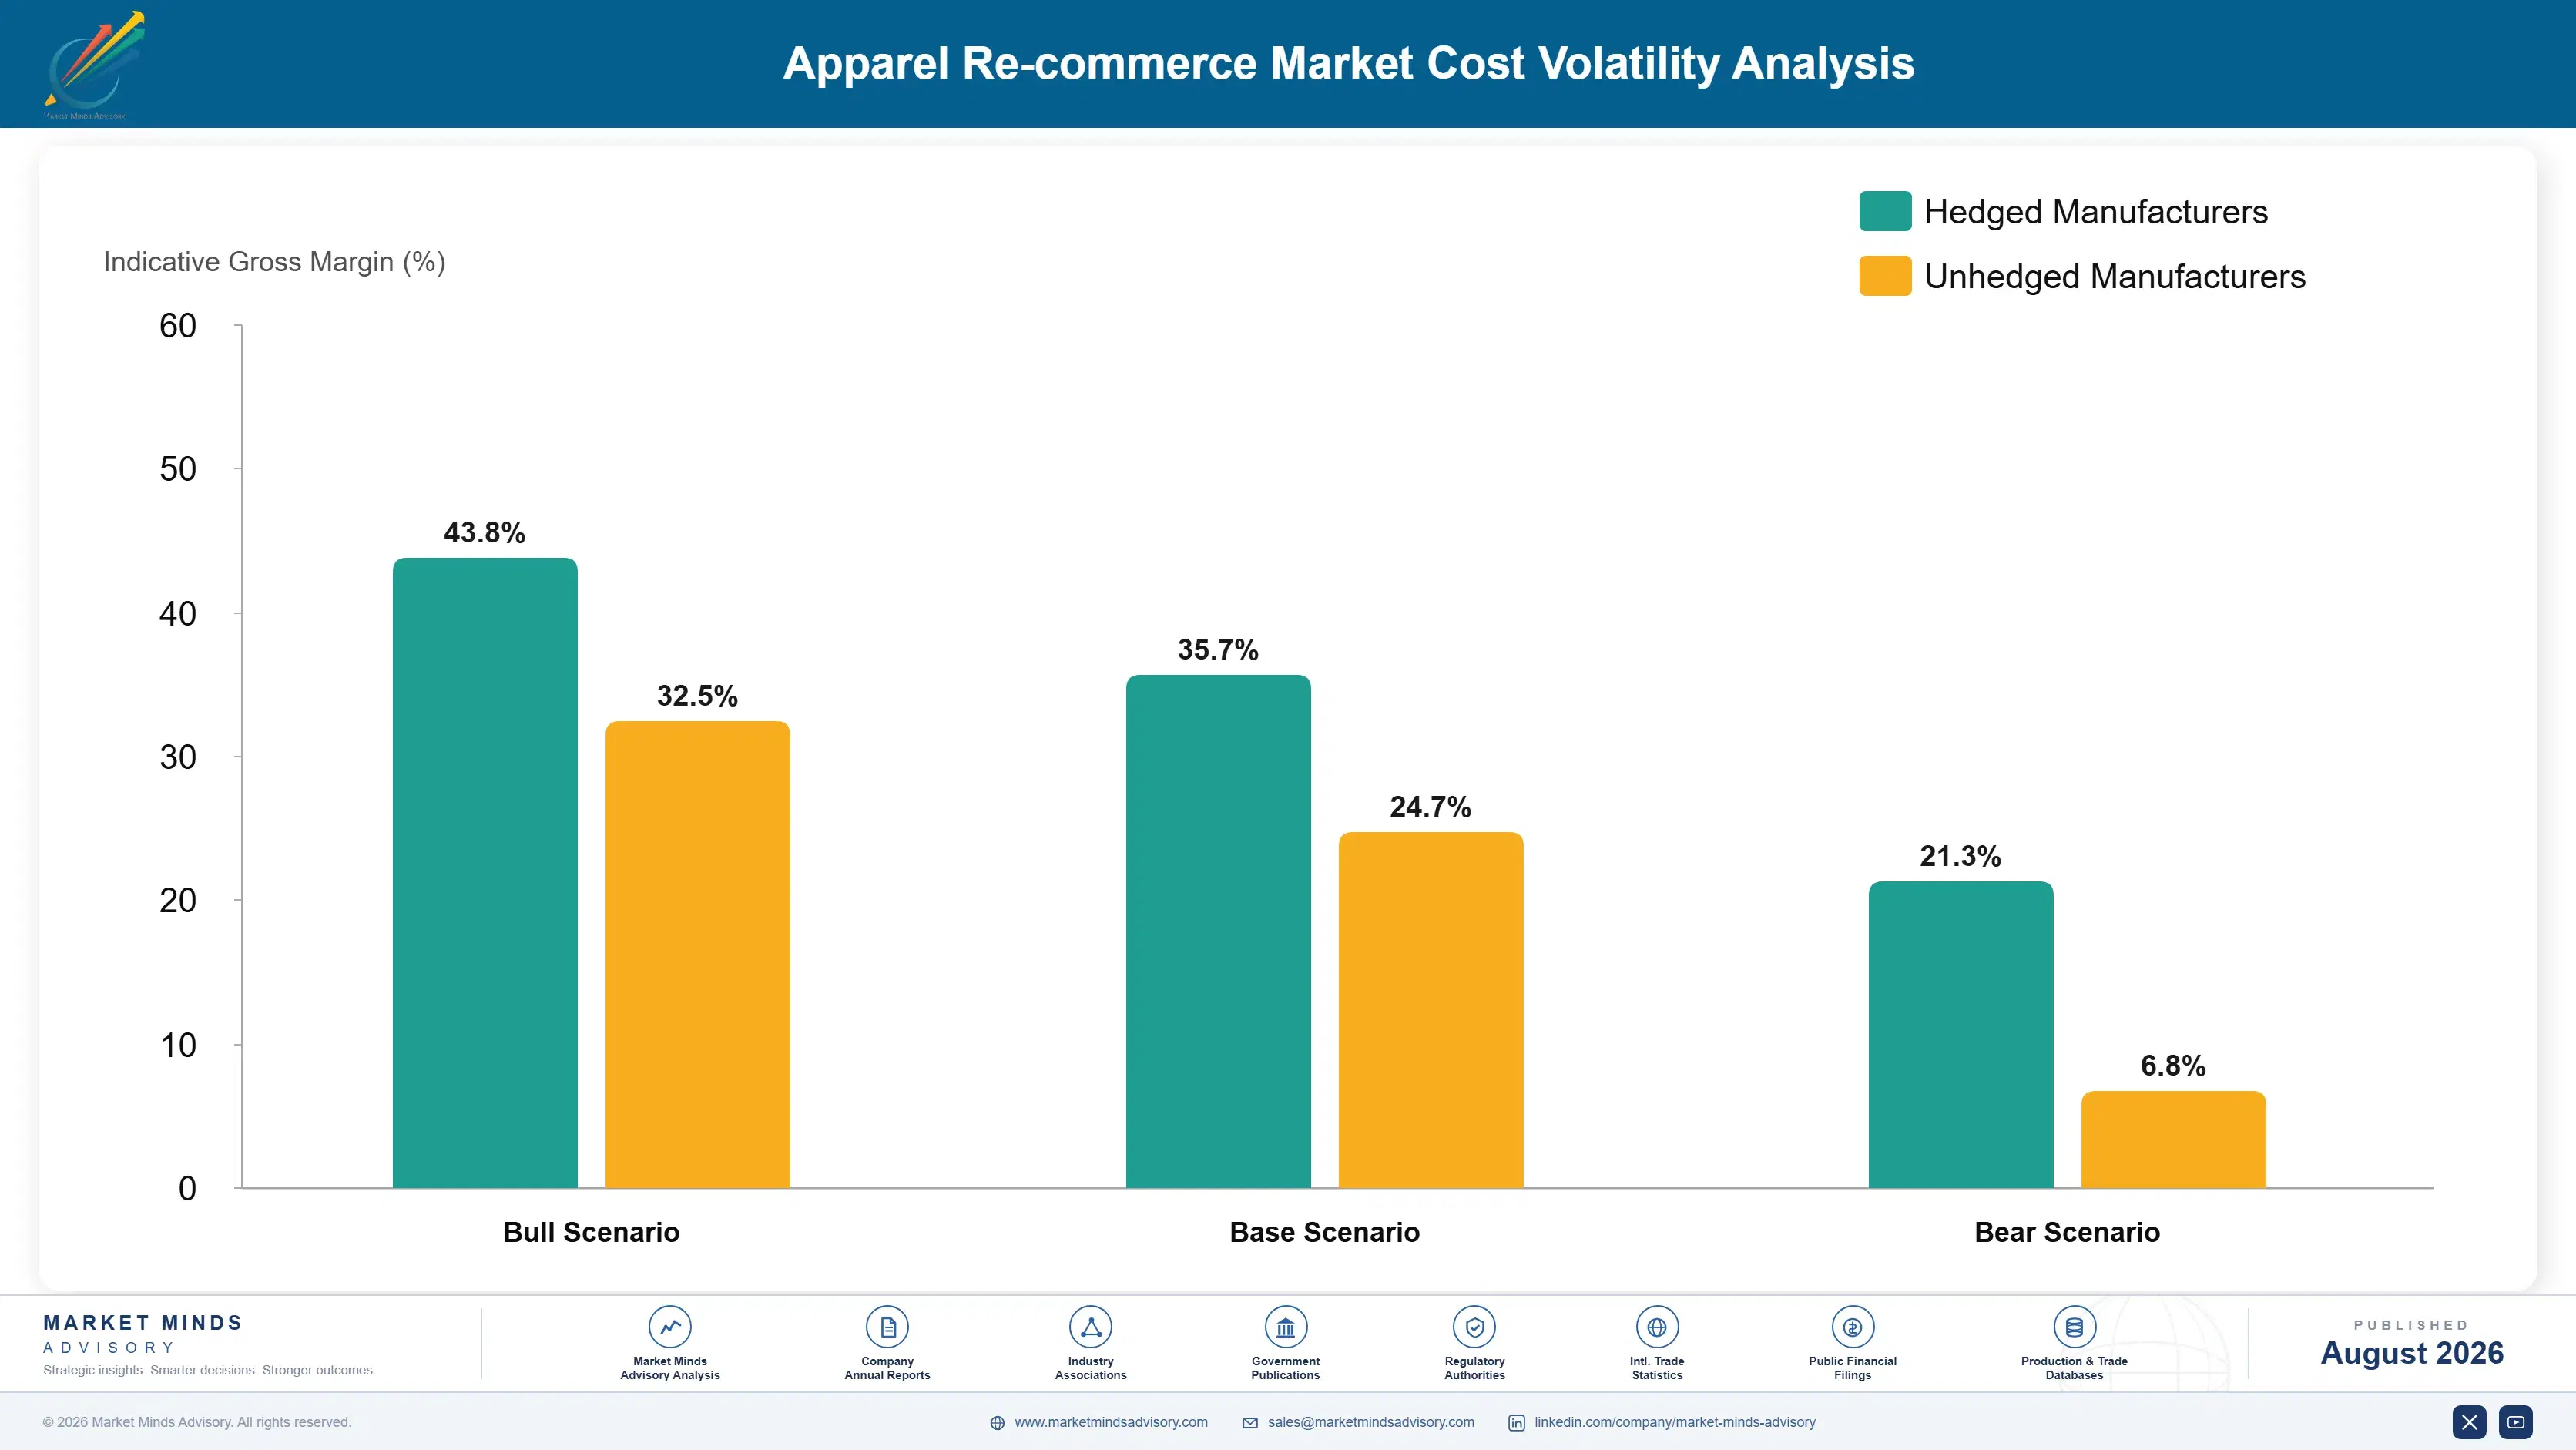
Labour accounts for roughly 46% of operating cost in a managed resale operation, warehousing a further 18%, and outbound shipping around 21%. All of it is incurred per item rather than per case, because every garment is unique. The labour comes from the same warehouse and fulfilment pool that conventional retail draws on, at wages that have risen faster than resale prices have.
Warehouse wage movement gave this category its clearest lesson. United States Bureau of Labor Statistics data showed warehousing and transportation earnings rising sharply through the recovery period, and resale operators compete for exactly that labour pool while selling items at an average price under 25 dollars. Several managed consignment operators narrowed intake criteria or exited lower-value categories entirely rather than continue processing items that could not cover their own handling cost at all.

The disadvantage falls on the managed model rather than on geography. A peer-to-peer platform pushes photography, description and shipping onto the seller and carries almost no per-item cost. A managed operator carries every step and has to recover it inside a commission on a low-value item. The two models are converging as a result, with each borrowing steadily from the other.
apparel-re-commerce-market-cost-volatility-analysis-1788171137535

Apply strict value thresholds at intake

Processing costs the same on a garment worth ten dollars as on one worth two hundred, and sell-through at 43% means most listed items never recover it. A minimum value threshold at intake removes the loss-making tail immediately and costs nothing to implement. Operators who apply one report contribution per item that operators accepting everything cannot approach at all.

Push routine listing work back to sellers

Photography, measurement and description are the largest component of per-item cost and the seller can perform all three at no cost to the operator. Structured listing tools, guided photography and automated measurement prompts produce acceptable consistency without a warehouse touching the garment. Reserve full managed handling for items above a value threshold where the commission actually covers the work involved.

Contract downstream offtake for unsellable fractions

Collection obligations are adding volume while export routes narrow, which leaves sorting operators holding material that costs money to hold. Offtake agreements with fibre recyclers, insulation manufacturers and wiping cloth converters convert that liability into a low but positive value. The agreements cost margin and they are considerably cheaper signed now than they will be once everybody needs them.

Portfolio Architecture for Margin Defence

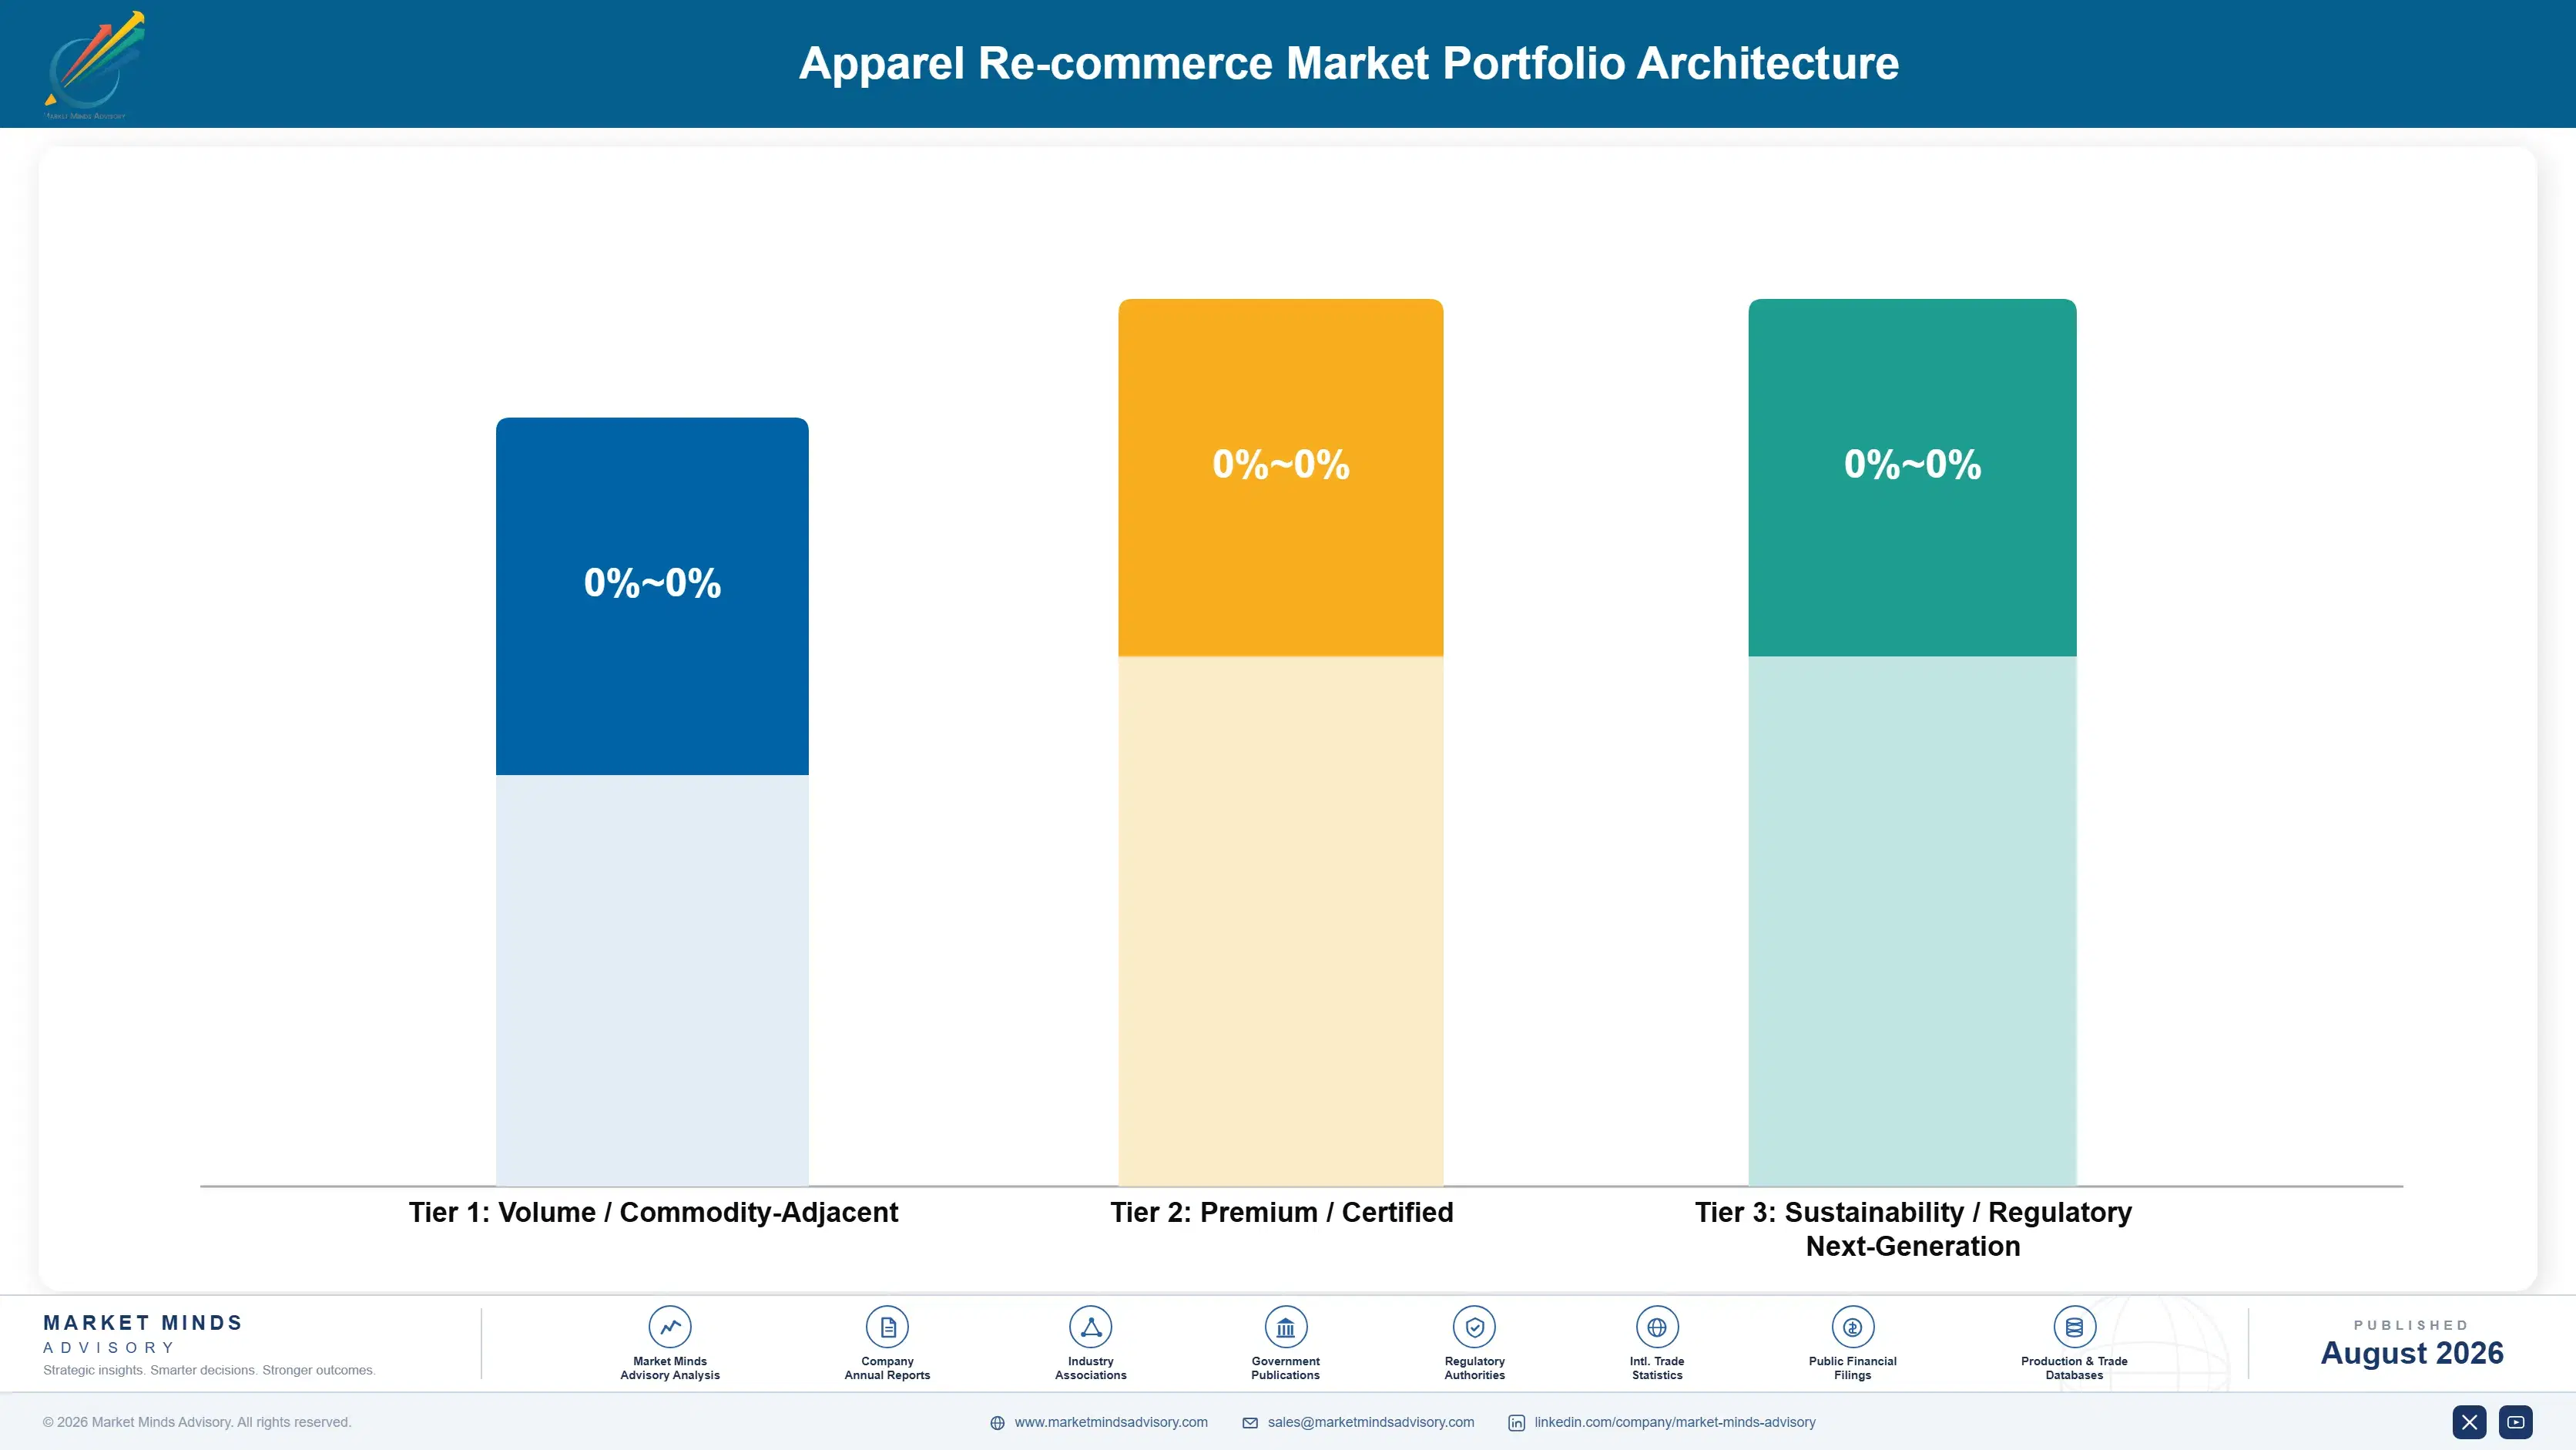
Margin here follows item value rather than channel, which is not how the category describes itself. A managed operator handling items above a hundred dollars earns a margin a peer-to-peer platform cannot reach, and the same operator handling items below twenty loses money on every one. Operators costing on contribution per item after processing run a completely different portfolio from those measuring gross merchandise value.
Volume and premium pull against each other through liquidity rather than cost. The low-value tier generates the listing volume that makes a platform worth searching, and a buyer arriving for a ten dollar item may transact on a two hundred dollar one. Cutting the tail improves contribution per item and thins the catalogue that brought the buyer in. The answer runs low-value listings seller-managed and reserves handling for premium.

High-value pools sit in authenticated premium resale, in brand programme technology and in authentication as a service. The second is the least obvious: the suppliers building and running branded resale programmes earn recurring software and operations fees regardless of whether the resale itself is profitable, which is a considerably better business than the one their clients are in. Almost nobody outside the sector has noticed them.

Volume / Commodity-Adjacent

Charity retail, off-price liquidation and cross-border wholesale handling low-value garments at enormous volume. Competes on collection cost and sorting efficiency rather than on anything a buyer sees. The 9 point spread reflects whether the operator owns collection infrastructure or buys graded bales.
Gross Margin: 14 to 23%

Premium / Certified

Managed consignment and authenticated premium resale where the operator handles every step and takes a large commission. Authentication and presentation support the take rate rather than price. The 9 point spread reflects average item value, which varies enormously between operators.
Gross Margin: 32 to 41%

Sustainability / Regulatory / Next-Generation

Brand programme technology, authentication supplied as a service and resale infrastructure licensed to third parties. Margins are high because capability is scarce and no inventory is carried at all. The 14 point spread separates software fees from operations contracts.
Gross Margin: 48 to 62%
apparel-re-commerce-market-portfolio-architecture-1788171138035

High-value Sub-segments and Strategic Watch-out

Brand-Operated Resale Programmes

High value and high growth at 17.7%. The operator does not need the transaction profitable, because trade-in credit converts a wardrobe clear-out into a full-margin primary purchase instead. The 8 point spread reflects whether the programme runs on licensed technology or on internally built infrastructure.
Gross Margin: 52 to 60%

Managed Consignment Marketplaces

High value with strong growth at 14.4%. The operator takes a large commission for handling every step, which only works above a value threshold given per-item processing cost. The 8 point spread reflects intake discipline, which separates the profitable operators from the rest of them entirely.
Gross Margin: 34 to 42%

Peer-to-Peer Listing Platforms

The volume core. Commission per item is small, but seller-managed listings carry almost no processing cost and the catalogue depth is what makes the platform worth searching at all. The 8 point spread reflects whether payment and fraud costs sit with the buyer or the platform.
Gross Margin: 22 to 30%

Cross-Border Used Clothing Wholesale

The strategic watch-out. African import restrictions are closing the destination for low-grade material at exactly the moment European collection obligations increase supply of it. The 20 point spread reflects how much of the volume still reaches an open export market of any kind at all.
Gross Margin: 6 to 26%

Why Sellers Keep Listing

The annuity runs on the seller rather than the buyer, which is the opposite of conventional retail. A household that lists once and gets paid lists again, and platform revenue depends more on retaining sellers than on retaining buyers. That is why the platforms charging the buyer rather than the seller grew fastest: they removed friction from the side of the transaction that compounds.
Stickiness varies by what somebody is selling. A seller clearing a wardrobe once a year has no attachment and goes wherever the process is easiest. A seller running a resale business on a platform is a merchant, transacts constantly and will not move once their ratings sit somewhere. Buyers are the least loyal and search by item rather than by platform, which is why liquidity beats brand.

Seller profiles have shifted from clearing out toward trading. The first wave listed occasionally to recover money on things they no longer wanted. A substantial share of current listing volume comes from sellers who buy in order to resell, operating as merchants with pricing knowledge. Platforms designed around the occasional household seller are now serving a professional one, and most have not adjusted their tools.
apparel-re-commerce-market-end-use-penetration-index-1788171138533

What Decides Profit Here

These are among the four positions where our research anticipates prominent divergence between winners and laggards over the coming forecast period. Each is grounded in the demand model, the regulatory perimeter, and the announced capacity pipeline.
01 / INTAKE SELECTION DISCIPLINE

Reject more than you accept at intake

Processing an item costs around 9.40 dollars whether or not it ever sells, and sell-through runs at 43%, which means the items that do sell are quietly carrying the majority that never move at all. Every low-value garment rejected at intake saves the entire processing cost immediately and costs nothing. The instinct to maximise catalogue depth is the most expensive habit in this category, and it usually appears in a board pack described as perfectly healthy inventory growth figures instead.
02 / AUTHENTICATION AS REVENUE

Sell the capability nobody else can build

Authentication consumes around 14% of the commission earned on a premium transaction and it is the only genuine barrier to entry anybody in this category has managed to build. An operator holding a trained team and a counterfeit database can verify items for brands, retailers and smaller platforms that cannot build either, at margins the underlying resale transaction never reaches. Japanese operators have already begun exporting exactly that service, and Western platforms are already busy buying it in from them.
03 / BRAND CREDIT ECONOMICS

Measure the programme on primary sales

Brand-operated resale grows at 17.7% and generates almost no resale profit, which makes it look like a bad business to anybody modelling it as a revenue line rather than as a retention one. The trade-in credit is the mechanism: a household clearing a wardrobe takes store credit instead of cash and spends it at full primary margin, for less than the customer acquisition it replaces. Only 8% of transacted value currently runs that way, which is really the whole opportunity.
04 / DOWNSTREAM OFFTAKE SECURITY

Contract the recycler before the export route closes

European separate collection obligations from 2025 are adding enormous volume to a system whose outlet for low-grade material is narrowing as African markets restrict used clothing imports on industrial policy grounds. A sorting operator holding unsellable fractions without a downstream route is carrying a cost rather than an asset. Offtake agreements with fibre recyclers and insulation manufacturers cost margin now and will cost considerably more once everybody in the chain needs them all at the very same moment as each other.

Engagement Snapshot From the Field

A live engagement with an industry participant carrying material or product regulatory and market exposure ahead of a defining policy shift, showing how our research translates into a defensible multi-year portfolio strategy.
MARKET MINDS ADVISORY · CLIENT ENGAGEMENT SUMMARY
Apparel Re-commerce Producer Strategic Portfolio Review and Transition Roadmap 2026·Investment Scenario on Apparel Re-commerce Exposure Evaluation 2025-26
CLIENT PROFILE
A managed apparel resale marketplace operating two processing centres and serving customers across four markets, with gross merchandise value in the mid hundreds of millions of dollars and revenue considerably below that (client-reported, unverified by MMA). The business accepted almost all inbound inventory on the principle that catalogue depth attracted buyers, and had never measured contribution per item.
STRATEGIC CHALLENGE
Gross merchandise value had grown for four consecutive years while losses widened, and the board had concluded that scale would eventually solve the problem. Management wanted to know whether that was true, and specifically whether processing cost per item fell with volume or stayed fixed regardless of how many items moved through the centres.
MMA APPROACH
MMA rebuilt two years of unit economics item by item, allocating intake, photography, storage, shipping and returns cost to each individual garment rather than spreading them across the catalogue. Forty-seven expert interviews with warehouse operators, competing platforms, brand programme suppliers and authentication specialists established where the cost floor actually sat and what intake discipline others applied.
KEY FINDINGS
  1. Items selling below 22 dollars produced a negative contribution after processing, and they accounted for 61% of everything the business had accepted.
  2. Processing cost per item had not fallen with volume across two years, because none of the work amortises when every unit is unique.
  3. Buyers arriving for low-value items converted onto higher-value purchases at a rate far lower than the catalogue depth argument had assumed internally.
  4. Two competing platforms had introduced intake thresholds eighteen months earlier and both reported materially better contribution per item without losing buyer traffic.
CLIENT PROFILE
A managed apparel resale marketplace operating two processing centres and serving customers across four markets, with gross merchandise value in the mid hundreds of millions of dollars and revenue considerably below that (client-reported, unverified by MMA). The business accepted almost all inbound inventory on the principle that catalogue depth attracted buyers, and had never measured contribution per item.
STRATEGIC CHALLENGE
Gross merchandise value had grown for four consecutive years while losses widened, and the board had concluded that scale would eventually solve the problem. Management wanted to know whether that was true, and specifically whether processing cost per item fell with volume or stayed fixed regardless of how many items moved through the centres.
MMA APPROACH
MMA rebuilt two years of unit economics item by item, allocating intake, photography, storage, shipping and returns cost to each individual garment rather than spreading them across the catalogue. Forty-seven expert interviews with warehouse operators, competing platforms, brand programme suppliers and authentication specialists established where the cost floor actually sat and what intake discipline others applied.
KEY FINDINGS
  1. Items selling below 22 dollars produced a negative contribution after processing, and they accounted for 61% of everything the business had accepted.
  2. Processing cost per item had not fallen with volume across two years, because none of the work amortises when every unit is unique.
  3. Buyers arriving for low-value items converted onto higher-value purchases at a rate far lower than the catalogue depth argument had assumed internally.
  4. Two competing platforms had introduced intake thresholds eighteen months earlier and both reported materially better contribution per item without losing buyer traffic.
RECOMMENDED STRATEGY
Phase 1: Phase one: introduce a hard intake value threshold and reject the loss-making tail entirely rather than continuing to process it. Phase 2: Phase two: offer seller-managed listing tools for items below the threshold, keeping the catalogue depth without carrying any handling cost. Phase 3: Phase three: redirect the released processing capacity toward authenticated premium inventory, where commission comfortably covers the cost of handling each item.
OUTCOME
Within three quarters gross merchandise value fell while revenue and contribution both rose, which required a difficult conversation with the board about which number the business was actually run on (client-reported, unverified by MMA). Buyer traffic held, seller-managed listings replaced most of the rejected volume, and the processing centres ran at higher value density.

Frequently Asked Questions

Foundational context covering the market sizes, CAGR, scope, country, region and competition that inform every finding below. This section is provided to cover basics and most often pre-purchase conversations, answered from the MMA Primary Research Dataset.

What is the current size of the Apparel Re-commerce Market?

The global apparel re-commerce market transacted USD 48.0 billion of gross merchandise value in 2025, across all organised resale channels. The 2026 figure reaches USD 53.66 billion.

How large will the Apparel Re-commerce Market be by 2036?

MMA forecasts USD 163.69 billion by 2036, an increase of USD 110.03 billion over the 2026 base. That represents an expansion multiple of 3.05 times across the forecast period.

What is the CAGR for the Apparel Re-commerce Market 2026 to 2036?

The base case compound annual growth rate is 11.8%, with a bull case at 13.0% and a bear case at 10.6%. Historical growth between 2020 and 2025 ran at 10.4%.

Which segment is growing fastest?

Brand-operated resale programmes grow at 17.7%, half again the market rate of 11.8%, because a brand runs resale for control and trade-in credit rather than margin. Managed consignment follows at 14.4%.

Who are the major companies in the Apparel Re-commerce Market?

Vinted, Mercari, Alibaba Group, ThredUp and The RealReal lead on gross merchandise value transacted, with combined CR5 of 21%. The field below them is extremely fragmented.

Which country is growing fastest?

India grows fastest at 13.8%, where the commercial opportunity is formalising informal secondhand trade rather than creating demand from nothing. South Asia and Pacific leads regionally at 13.8%.

Report Segmentation Architecture

The full report scope spans multiple orthogonal segmentation dimensions, with cross-tabulated demand data provided for each dimension pair. Coverage extends further to regional breakdowns, trend trajectories, and the competitive detail needed to support segment-level decision-making.

By Resale Channel

  • Peer-to-Peer Listing Platforms
  • Managed Consignment Marketplaces
  • Brand-Operated Resale Programmes
  • Charity and Thrift Retail
  • Off-Price and Liquidation Resale
  • Cross-Border Used Clothing Wholesale

By End-Use Industry

  • Consumer Apparel Resale
  • Luxury and Accessories Resale
  • Childrenswear Resale
  • Workwear and Uniform Resale
  • Sportswear and Outdoor Resale
  • Textile Sorting and Grading

By Commercial Dimension

  • Platform Commission Models
  • Consignment Fee Models
  • Outright Purchase Models
  • Brand Trade-In Programmes
  • Wholesale Bale Trading
  • Technology Licensing Supply

By Region

  • North America
  • Western Europe
  • East Asia
  • South Asia and Pacific
  • Latin America
  • Middle East and Africa
  • Eastern Europe

Scope, Methodology, and Coverage

Every figure in this report is reproducible from documented input assumptions. The scope below maps the historical period, the forecast horizon, the segmentation dimensions, and the countries covered, alongside the underlying primary and qualitative methodology.
Historical Period
2020 to 2025
Forecast Period
2026 to 2036
Base Year
2025 (USD billions; MMA Primary Research Dataset, August 2026)
Market Definition
The apparel re-commerce market covers the resale of previously owned clothing, footwear and fashion accessories through organised commercial channels, spanning peer-to-peer listing platforms, managed consignment marketplaces, brand-operated resale programmes, charity and thrift retail, off-price liquidation resale and cross-border used clothing wholesale. Scope is measured as gross merchandise value transacted. Excluded are rental and subscription wardrobe services, repair and alteration services, textile recycling into fibre, unsold new inventory sold as new, and private sales between individuals outside any platform.
Quantitative Units
USD billion of gross merchandise value, 2025 base year, 2026 to 2036 forecast period
Segmentation Dimensions
Resale channel, end-use category, commercial model, region
Regions Covered
North America, Western Europe, East Asia, South Asia and Pacific, Latin America, Middle East and Africa, Eastern Europe
Countries Covered
United States, Canada, Germany, France, United Kingdom, Lithuania, Netherlands, Poland, China, Japan, South Korea, India, Australia, Brazil, Mexico, Saudi Arabia, United Arab Emirates, South Africa
Key Companies Profiled
20 companies across marketplace platforms, managed operators and resale technology suppliers
Quantitative Methodology
Primary survey, n=3,800 respondents, Q4 2025, six countries; demand-side model with trade association cross-validation
Qualitative Methodology
47 expert interviews, Q4 2025; applied to validate demand model assumptions, identify emerging dynamics, and assess competitive positioning
Report Format
PDF and XLSX data workbook (Word format preview document)
Publisher
Market Minds Advisory
Report Code
MMA-2026-TEC-531
Published
August 2026
Contact
sales@marketmindsadvisory.com | www.marketmindsadvisory.com

Purchase the full Apparel Re-commerce Market Report (2026 to 2036).

The full MMA report on the apparel re-commerce market runs to detailed channel and regional models across the 2026 to 2036 forecast period, with per-item processing cost benchmarks built by operating model. It profiles 20 companies on a consistent gross merchandise value basis, covering marketplace platforms, managed operators and the technology suppliers powering brand programmes. Collection obligation and import restriction exposure is mapped by jurisdiction. Regional chapters cover the seven MMA regions with country-level detail on the eighteen markets surveyed. Primary research draws on a quantitative survey of 3,800 respondents across six countries and 47 expert interviews conducted in Q4 2025.
Per-item processing cost benchmarks by operating model
Sell-through analysis by channel and item value band
Authentication cost and capability mapped across operators
Twenty company profiles on consistent transacted value basis
Collection obligation exposure mapped by jurisdiction
Seven regional chapters with eighteen country detail tables

Built For The People Who Decide

From boardroom strategy to bench-side execution, this report is read cover-to-cover by leaders shaping the next decade of their industry, turning demand scenarios, market dynamics and valuation benchmarks into decisions.
CXOs/ Presidents/ VPs/ Managers
M&A and Corporate Development
Strategy Teams and R&D Heads
Procurement and Product Directors
Regulatory and Compliance Leaders
Investor Relations and Equity Analysts