Market Minds Advisory
Apocarotenal Market

Apocarotenal Market: Apocarotenal Market. Vitamin A Fortification Programs Anchor a Mature Carotenoid Colorant Category

Government vitamin A fortification mandates are pulling apocarotenal into emerging market beverage and dairy programs, even as clean-label scrutiny on its synthetic production routes pressures pricing relative to purely plant-extracted colorant alternatives worldwide.

Lead Analyst

Published

September 2026

Make Smarter Decisions with Customized Research Insights

Request a free sample report and evaluate market opportunities, growth trends, and competitive dynamics relevant to your business needs.

2025 MARKET VALUE$0.4BMarket Size 2025
2036 FORECAST VALUE$0.8BBase Case , 2026 to 2036
CAGR 2026 TO 20365.4 %Bull 6.4% / Bear 4.2%
INCREMENTAL OPPORTUNITY$0.3BNet 10- year value creation
EXPANSION MULTIPLE1.69x2036 value over 2026 base
Strategic Levers
M&A Pipeline
Regional Outlook
Country Rankings
Competitive Intelligence
Segmental Deep-dive
Call-Us : 91 93563 13602

Executive Snapshot and Market Trajectory.

Apocarotenal remains a mature carotenoid colorant category, yet government vitamin A fortification mandates across emerging markets are pulling demand toward premium fortification-grade material carrying meaningfully higher value than standard beverage coloring applications sold for decades. Manufacturers increasingly cite this shift in premium marketing materials.
Dietary supplement and vitamin A fortification applications now post the fastest segment growth, with beverage applications close behind on nature-identical positioning demand. East Asia commands the largest regional share, reflecting China's substantial carotenoid production capacity across most major consumption markets tracked in this report. This dual growth pattern is reshaping producer capital allocation priorities. North America follows closely on strong beverage and supplement reformulation demand across most retail channels.
Five producers hold roughly fifty-two percent of global production capacity, a concentration built on decades of carotenoid synthesis expertise and fermentation investment that smaller regional players struggle to match. Clean-label scrutiny on synthetic production routes remains the defining commercial risk shaping producer positioning strategy across the industry this year. Few competitors can assemble a comparable combination of synthesis scale and fermentation depth quickly. This exposure keeps planning difficult across the broader supplier base industry-wide.
Market Definition
This report defines the apocarotenal market as beta-apo-8'-carotenal, a nature-identical carotenoid colorant, processed and sold for use in beverage, dairy, dietary supplement, and processed food applications requiring orange-yellow coloring and provitamin A activity. It excludes natural annatto and standalone beta-carotene sold outside this report's defined apocarotenal-specific scope.
Base Year Value
$0.4B in 2025 (MMA Primary Research Dataset, September 2026)
Forecast Period
2026 to 2036, eleven discrete annual values
CAGR
5.4% base case. Bull 6.4%. Bear 4.2%.
Fastest Growth Segment
Dietary Supplement and Vitamin A Fortification Applications: 7.6% CAGR
Fastest Growth Country
India: 6.9% CAGR
Fastest Growth Region
South Asia and Pacific: 7.4% CAGR
Largest Region
East Asia: 29% of 2025 global value
Market Leaders
DSM-Firmenich AG, BASF SE, Allied Biotech Corporation, Divi's Laboratories Limited, Zhejiang NHU Company Ltd. Source: MMA Analysis, July 2026.
Primary Survey
n=3,800 procurement and R&D decision-makers, Q4 2025, six countries
Methodology
Demand-side build-up, cross-validated against public data, 47 expert interviews

Apocarotenal Market Forecast Scenarios

apocarotenal-market-size-forecast-scenario-1789947833729
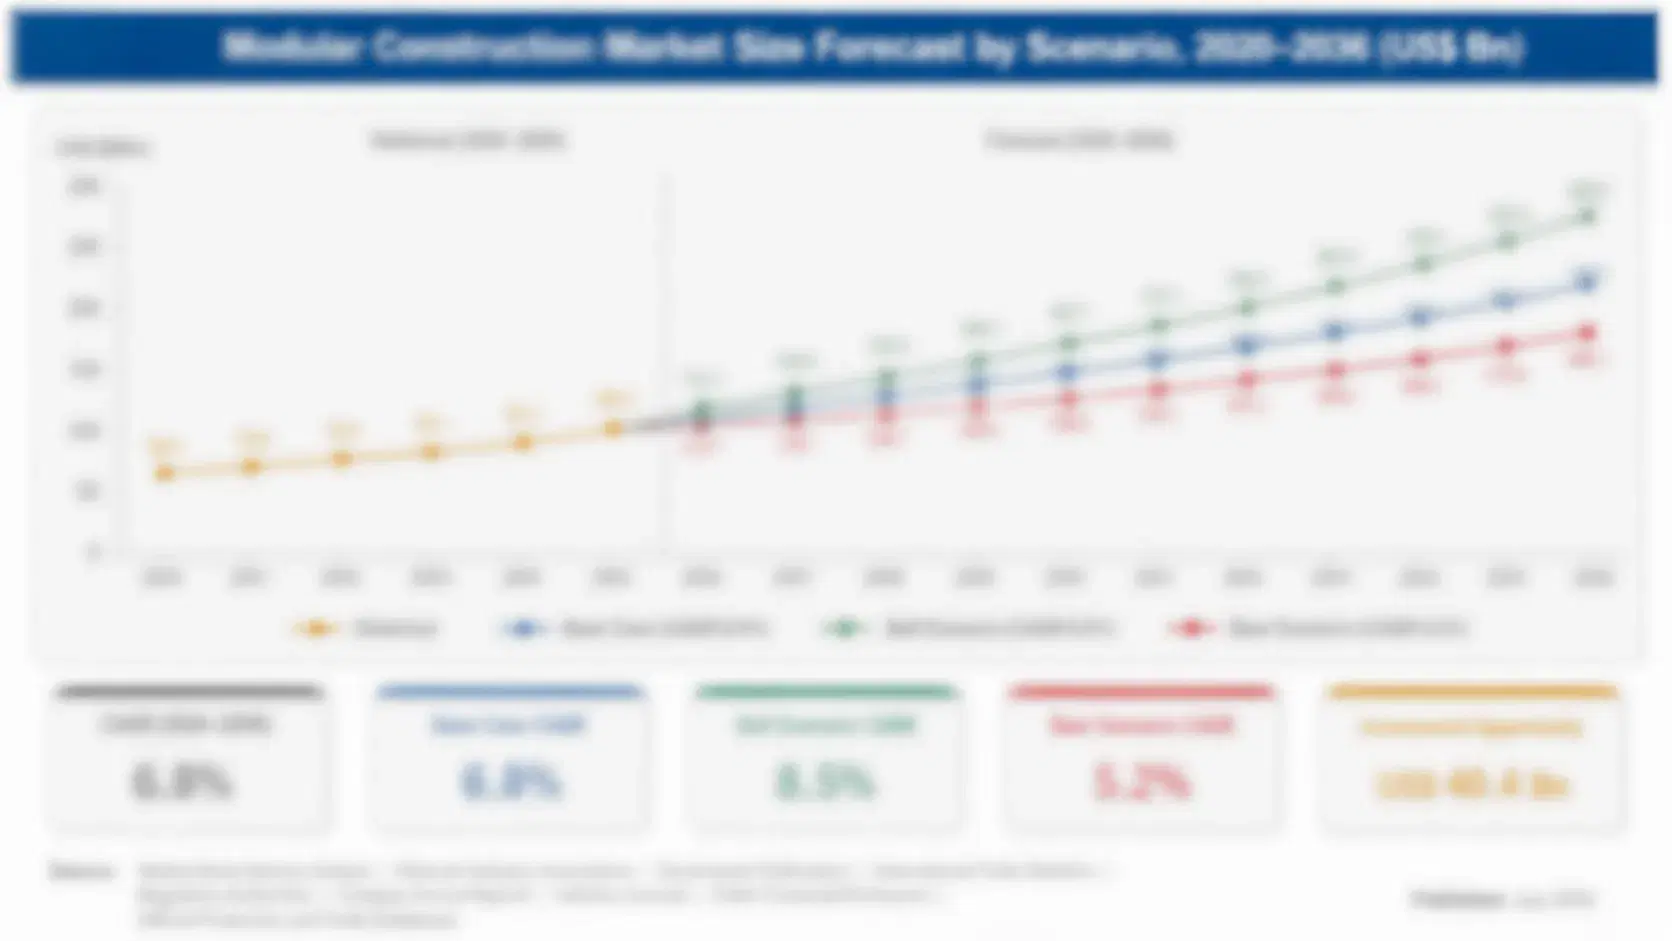
Between 2020 and 2025, apocarotenal grew steadily alongside global beverage and dairy consumption, even as government vitamin A fortification programs began accelerating demand for documented provitamin A activity across emerging consumption markets tracked closely in this report over that period. This shift reflects a genuine credibility gain from the ingredient's earlier commodity positioning overall. Formulators increasingly reference this trend directly.
The base case assumes steady 5.4% annual expansion through 2036, anchored in three commercial mechanisms: continued government vitamin A fortification mandates across developing markets, beverage and dairy reformulation toward nature-identical colorants, and fermentation-derived natural production investment addressing clean-label scrutiny across manufacturer purchasing decisions worldwide. Each mechanism reinforces the others as manufacturer familiarity with fortification-grade material compounds steadily. This dynamic is expected to strengthen further as fortification mandate adoption broadens across additional developing markets.
A bull scenario near 6.4% follows faster-than-expected fortification mandate adoption across additional developing markets. A bear scenario near 4.2% follows persistent clean-label scrutiny on synthetic production routes, which would push formulators toward purely natural alternatives across most affected product categories industry-wide this cycle. Producers are watching both scenarios closely given the stakes for smaller regional players in the field.

Vitamin A Fortification Anchors a Mature Colorant Category

Apocarotenal occupies a genuinely dual-purpose position among functional colorants: valued both for its orange-yellow coloring capability and its documented provitamin A activity, a combination few competing colorants can offer simultaneously. That dual functionality is exactly what keeps fortification program buyers specifying apocarotenal over colorants lacking equivalent nutritional value. This dual reality makes the category more resilient than its mature reputation suggests.
PRODUCTION CONCENTRATION52% CR5top five producers hold over half of capacity
AVERAGE SELLING PRICEUSD 14.20/kgfortification-grade material commands a substantial and consistent premium
LEADING PRODUCING COUNTRYChina, 26% sharesubstantial carotenoid production capacity anchors this country's leadership
CAPACITY UTILIZATION74%producers run synthesis facilities near full operating ceilings
FEEDSTOCK COST SHARE36% of COGScarotenoid precursor sourcing dominates total production cost overall
REPLACEMENT CYCLE18 to 30 monthsformulation requalification pace across manufacturer product reformulation cycles
Production concentrates among established carotenoid synthesis companies with existing vitamin manufacturing infrastructure built originally for other fat-soluble vitamin production. Newer entrants face a genuine technical barrier, since achieving consistent carotenoid purity and provitamin A activity at commercial scale requires synthesis expertise that takes years to develop internally rather than something easily purchased from equipment vendors or contract manufacturers. Newer entrants face a steep learning curve building comparable synthesis capability from scratch.
Pricing power currently favors producers holding both fermentation-derived natural production capability and documented fortification program certification simultaneously, a combination that keeps the realistic competitive set fairly narrow despite steady demand. Manufacturers increasingly request natural sourcing verification given growing clean-label scrutiny on synthetic carotenoid claims. Manufacturers report willingness to pay a genuine premium for producers demonstrating consistent quality and transparent sourcing across their supply chains.
"Apocarotenal gets overlooked because it lacks annatto's clean natural story, but it does something annatto cannot: deliver real provitamin A activity alongside color. That dual function is exactly why fortification program buyers keep specifying it despite the clean-label headwind."
Senior Analyst, Food Ingredients and Nutrition Practice · MMA Agriculture and Food Practice · September 2026

Market Trends

Vitamin A Fortification Programs Expand Demand in Emerging Markets

Government-mandated vitamin A fortification programs across a growing list of developing countries have specified apocarotenal for staple food and beverage fortification, citing its documented provitamin A activity alongside functional coloring properties that single-purpose vitamin additives cannot deliver simultaneously. This positioning has proven particularly effective in public health programs targeting childhood vitamin A deficiency, where formulators can point to specific nutritional data supporting program design rather than relying on general fortification marketing claims. Several national fortification programs have adopted apocarotenal-based formulations over the past two years, reporting measurably improved program compliance following the switch across their broader public health initiatives.
Market Impact: expands mandates to 8 additional countries

Fermentation-Derived Natural Production Addresses Clean-Label Pressure

Producers have increasingly invested in fermentation-derived natural apocarotenal production routes specifically to address growing clean-label scrutiny on synthetic carotenoid synthesis, recognizing that purely natural production could meaningfully expand addressable market among formulators currently avoiding the ingredient given its synthetic reputation. This shift has meaningfully expanded commercial interest from manufacturers who previously excluded apocarotenal from clean-label product lines entirely, since fermentation-derived material carries genuinely different regulatory and labeling implications. Several major producers have announced dedicated fermentation production lines over the past two years, signaling growing recognition of this natural production opportunity across the broader industry.
Market Impact: covers 38% of new reformulation launches

Market Opportunities and Growth Drivers

Government Fortification Mandates Expand Baseline Demand

Government vitamin A fortification mandates continue expanding across developing markets facing documented childhood vitamin A deficiency challenges, and apocarotenal remains a preferred fortification ingredient given its dual coloring and nutritional functionality that single-purpose additives cannot replicate. Public health program administrators report that apocarotenal-based fortification programs achieve stronger compliance than colorless alternatives, since the visible color change helps verify product authenticity and fortification status to program beneficiaries and distribution partners across the supply chain reaching underserved rural and urban populations targeted by these public health efforts. Program administrators report this visible verification advantage justifies apocarotenal's modest premium over colorless additives.
Market Impact: affects positioning in 6 major markets

Beverage and Dairy Reformulation Toward Nature-Identical Colorants

Beverage and dairy manufacturers reformulating away from purely synthetic dyes increasingly specify apocarotenal given its nature-identical classification, which carries more favorable regulatory and consumer perception than fully synthetic alternatives even though production can still involve chemical synthesis routes. This reformulation trend has accelerated meaningfully across margarine, cheese, and beverage categories, where apocarotenal has served as a reliable coloring choice for decades. Manufacturers report that products carrying nature-identical labeling claims test favorably with consumers relative to fully synthetic dye alternatives. Retailers report increasingly dedicated shelf space for products carrying this recognizable nature-identical positioning.
Market Impact: caps gains at 2% to 4%

Market Restraints and Challenges

Clean-Label Scrutiny on Synthetic Production Routes Limits Positioning

Apocarotenal's traditional synthetic production route carries genuine clean-label disadvantages relative to purely plant-extracted colorants like annatto, since consumers and some regulatory frameworks increasingly favor ingredients with straightforward natural sourcing narratives over chemically synthesized alternatives regardless of nature-identical classification. The root cause traces to broader consumer skepticism toward synthetic food additives generally, a trend that predates any specific safety concern about apocarotenal itself but nonetheless affects manufacturer purchasing decisions across most major consumption markets. This dynamic disadvantages producers without fermentation-derived natural production capability, forcing many to invest in alternative production routes to remain competitive.
Market Impact: reaches 12 million fortified beneficiaries

Competition From Established Natural Colorants Limits Share Gains

Apocarotenal competes directly with annatto and standalone beta-carotene across many overlapping application categories, and both competing colorants carry stronger natural sourcing narratives that increasingly resonate with clean-label-focused manufacturers making ingredient selection decisions. The root cause lies in functional overlap across these three colorant categories, meaning manufacturers can often substitute between them based primarily on sourcing narrative rather than genuine functional necessity in most standard applications. This dynamic limits apocarotenal's ability to gain share from competing natural colorants except in applications specifically requiring its documented provitamin A activity advantage. Producers increasingly emphasize this nutritional distinction directly in customer-facing technical materials.
Market Impact: adds 4 new fermentation production lines
3 additional market trends, 2 additional growth drivers, and 4 additional restraints and challenges are covered in the full report. Contact sales@marketmindsadvisory.com to access the complete intelligence.

Segment CAGR and Growth Architecture

The apocarotenal market splits into six application-based segments reflecting where dual coloring and provitamin A functionality delivers the clearest commercial return, spanning beverage through pharmaceutical applications entirely. Dietary supplement and vitamin A fortification applications lead current growth momentum by a meaningful margin over every other segment tracked this cycle. with real staying power across most categories tracked.
apocarotenal-market-market-share-analysis-1789947834037

Dietary Supplement and Vitamin A Fortification Applications

Dietary supplement and vitamin A fortification applications are growing fastest as government fortification programs and supplement manufacturers increasingly specify apocarotenal for its documented provitamin A activity alongside functional coloring properties. DSM-Firmenich and BASF lead formulation support here, drawing on decades of vitamin synthesis expertise adapted specifically for fortification program specifications and regulatory documentation requirements. Growth concentrates among public health programs targeting documented childhood vitamin A deficiency across developing consumption markets tracked closely in this report. This segment commands meaningfully higher per-unit pricing than standard beverage-grade material, reflecting both genuine nutritional documentation complexity and premium fortification program positioning. Few competing colorants match this dual functional and nutritional value. Few competitors can assemble comparable documentation depth quickly across the field.
CAGR 7.6%

Beverage Applications

Beverage applications form the second-fastest growing segment, benefiting from manufacturers reformulating away from purely synthetic dyes toward apocarotenal's nature-identical classification and reliable orange-yellow coloring performance across different beverage formulation conditions. Specialist colorant producers have developed proprietary apocarotenal blends specifically tuned for beverage applications, often working closely with individual manufacturers to optimize color stability across different pH and processing conditions encountered during production and distribution. Growth here tracks closely with broader nature-identical colorant reformulation momentum, and manufacturers report apocarotenal ranks among their more frequently requested reformulation inputs for legacy synthetic dye product lines. Few competing colorants match this nature-identical positioning as reliably across such varied beverage formulations and processing conditions encountered today.
CAGR 6.8%
Full segment breakdown across 6 segments available in the complete report.

Regional Architecture and Country Demand Map

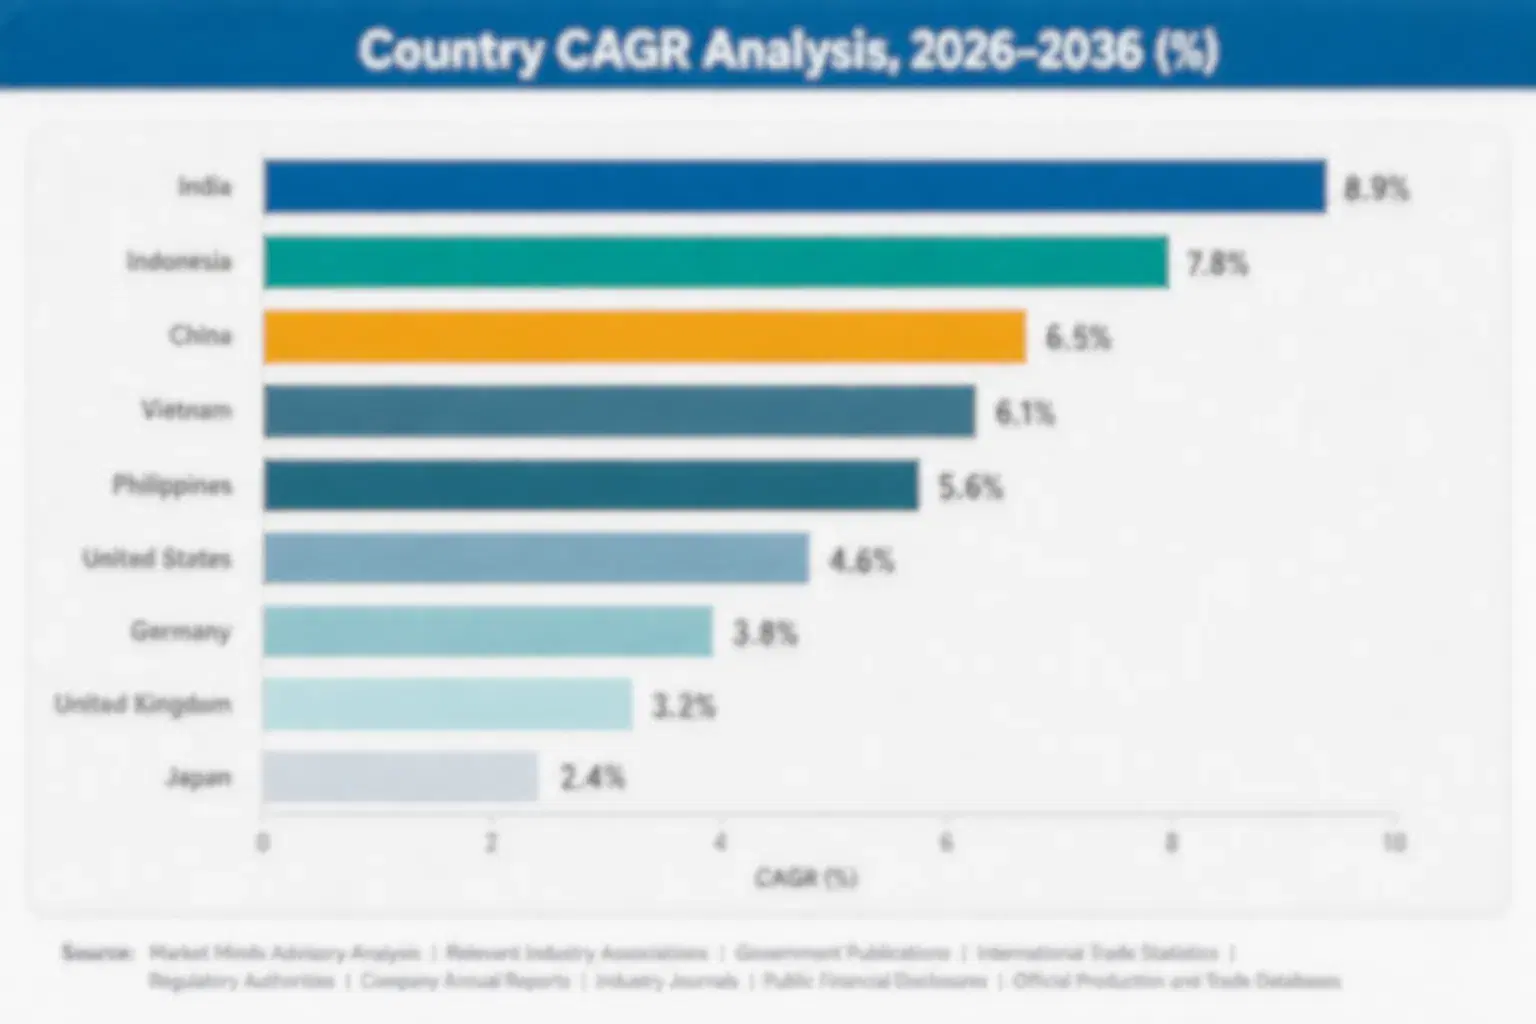
East Asia commands the largest regional share within default bands, reflecting China's substantial carotenoid production capacity, while North America follows closely on strong beverage and supplement reformulation demand across most major consumption markets tracked in this report. Growth remains healthy across every region tracked closely in this report.

North America

United States beverage and dairy manufacturers continue specifying apocarotenal for nature-identical coloring applications, supported by strong consumer demand for recognizable ingredient labeling across grocery and specialty retail channels reaching health-conscious shoppers nationwide. Major supplement brands headquartered domestically have driven meaningful vitamin A fortification category growth, adopting documented provitamin A positioning ahead of most international competitors operating in comparable categories. Canadian manufacturers have followed a similar adoption path at smaller scale, concentrated mostly within dairy and beverage applications supplied through established North American distribution relationships built over years. Retail demand for nature-identical colored beverages continues to grow steadily across most specialty grocery channels tracked closely. Consumer trust in documented nutritional and coloring claims continues to shape purchasing decisions across the market.
Share: 24% | CAGR: 5.0% (2026 to 2036)

Western Europe

Western Europe hosts several established carotenoid synthesis producers, benefiting from decades of accumulated vitamin manufacturing expertise built around the region's long pharmaceutical and food ingredient production traditions predating most modern clean-label trends elsewhere. Germany and the Netherlands concentrate meaningful European carotenoid production capacity, reflecting existing infrastructure originally built for other fat-soluble vitamins now increasingly applied toward apocarotenal production meeting global formulator specifications. Demand growth here trails faster-growing markets somewhat, reflecting an already mature colorant category where reformulation activity has slowed relative to newer, faster-developing consumption markets. Several European producers are also exploring capacity expansion to serve growing export demand from Asian and North American markets currently. Domestic biotechnology funding programs continue supporting incremental fermentation capacity growth.
Share: 23% | CAGR: 3.8% (2026 to 2036)
Regional intelligence for 5 additional markets available in the complete report: East Asia, South Asia and Pacific, Latin America, Middle East and Africa, Eastern Europe. Contact sales@marketmindsadvisory.com.
apocarotenal-market-country-cagr-analysis-1789947834357

Where Apocarotenal Producers Can Capture More Margin

Producers who diversify beyond synthetic production into fermentation-derived natural grades hold the clearest path to margin expansion. Three levers stand out clearly: fermentation-derived natural production investment, documented fortification program certification, and direct manufacturer co-development partnerships that lock in volume well ahead of competitor qualification attempts. across the field for the full duration of any single cycle.

Fermentation-Derived Natural Production Investment Program Development

Producers who invest in fermentation-derived natural apocarotenal production can escape the clean-label limitations that currently confine synthetic material to a narrow set of less-discerning applications, opening demand from clean-label-focused formulators who otherwise avoid the ingredient entirely. This production route typically commands pricing premiums of 45% to 65% over standard synthetic material, reflecting both the research investment and genuine natural sourcing differentiation few competitors can currently match. Producers that fall behind on this investment risk ceding premium volume to faster-moving rivals across the category. This gap will not close without dedicated production investment.
Market Impact: adds 45% to 65% pricing premium on natural grades

Documented Fortification Program Certification Program Overall

Government fortification program administrators will pay meaningfully more for producers who can document verified provitamin A activity and quality consistency across roughly 55% of qualified supply volume end to end, supporting the specific nutritional claims fortification programs increasingly build entire public health initiatives around. Producers offering this documentation as a standard service, rather than a special request, report winning preferential allocation during periods of tight supply across the broader competitive field. Producers that skip this documentation risk losing preferred allocation status to more forthcoming competitors during periods of tight supply.
Market Impact: adds 10% to 16% margin on documented volume

Direct Manufacturer Co-Development Partnership Investment Program

Producers who commit technical formulation support directly to manufacturer product development teams, rather than simply selling raw colorant volume, capture a meaningfully larger share of the eventual product's value chain and typically secure multi-year exclusive supply commitments running roughly 30% above standard spot market volume as a direct result of that closer involvement. This approach requires dedicated technical staff and genuine formulation expertise, resources smaller producers often lack, but it effectively locks out competitor qualification attempts for the full duration of the partnership relationship involved. This dynamic increasingly separates category leaders from smaller, less differentiated competitors.
Market Impact: secures 3 to 5 year exclusive supply commitments

Who Controls the Margin Pool

Market concentration sits at a moderate 52% on a production capacity basis across the top five producers, reflecting the specialized carotenoid synthesis technology required to compete credibly at commercial scale. DSM-Firmenich and BASF sit a tier above the rest of the field, combining diversified vitamin manufacturing infrastructure with carotenoid synthesis investment few smaller competitors can match at comparable scale. Few smaller competitors can assemble a comparable combination of scale and technical depth quickly.
Current competitive activity centers on fermentation-derived natural production and fortification program certification rather than price competition, since the category's stable demand base leaves meaningful room for differentiation through natural sourcing credibility. Several producers have announced dedicated fermentation production lines specifically targeting clean-label-focused formulators, betting that natural sourcing will matter increasingly as synthetic scrutiny intensifies.

Rankings look most likely to shift where fermentation-derived natural production succeeds at meaningful commercial scale, since that route offers genuine differentiation advantages over synthetic material regardless of underlying feedstock cost trends. Watch for Chinese producers closing the technical gap over the coming several years as domestic fermentation investment matures into differentiated commercial capability across the broader competitive field. Watch closely for further consolidation among mid-sized regional players over this period.
apocarotenal-market-company-positioning-matrix-1789947834653

Competitive Moat and Risk Dimensions

DSM-FIRMENICH AG

Moat: Diversified Vitamin Manufacturing Base

DSM-Firmenich's existing vitamin manufacturing infrastructure, built originally for other fat-soluble vitamins, gives it cost and scale advantages competitors building apocarotenal capacity from scratch cannot easily replicate. This integration also supports the documented quality verification increasingly demanded by fortification program administrators worldwide. This cross-selling advantage compounds with each new customer relationship established over time.
DSM-FIRMENICH AG

Risk: Secondary Priority Versus Core Vitamins

DSM-Firmenich's much larger core vitamin manufacturing business means apocarotenal receives comparatively modest internal investment priority relative to its overall scale, potentially ceding ground to smaller, more focused carotenoid-specific competitors willing to commit disproportionate resources toward capturing this smaller specialty colorant segment. This vulnerability grows more relevant as fortification accounts increase in strategic importance.
BASF SE

Moat: Established Carotenoid Synthesis Expertise

BASF's decades of carotenoid synthesis expertise transfers readily across multiple product categories, giving it a technical head start in helping manufacturers navigate reformulation challenges that newer, less experienced apocarotenal-focused competitors take considerably longer to resolve given their comparatively limited overall synthesis track record and depth.
BASF SE

Risk: Synthetic Reputation Limits Clean-Label Appeal

BASF's strong association with synthetic chemical production creates a clean-label perception disadvantage relative to competitors positioning fermentation-derived natural alternatives, potentially ceding share among clean-label-focused manufacturers unless BASF accelerates its own natural production investment meaningfully across the category soon. Competitors positioning natural alternatives increasingly highlight this reputational gap directly.

Players Tracked

Prominent Players

DSM-Firmenich AG
BASF SE
Allied Biotech Corporation
Divi's Laboratories Limited
Zhejiang NHU Company Ltd

Other Key Players

Novonesis A/S
Sensient Technologies Corporation
Kalsec Inc
GNT Group BV
San-Ei Gen F.F.I. Inc
Zhejiang Medicine Co Ltd
Chenguang Biotech Group Co Ltd
Vitablend Nederland BV
Fenchem Biotek Ltd
Deretil SA
Lycored Ltd
FBC Industries Inc
Roha Dyechem Pvt Ltd
Chromatech Incorporated
AIDP Inc

Recent Developments

APRIL 2026

DSM-Firmenich Expands Fermentation Production Capacity in Switzerland

DSM-Firmenich AG commissioned an additional fermentation line at its existing Swiss facility, raising annual natural apocarotenal output to meet growing clean-label manufacturer demand. The expansion represents organic capacity growth rather than a joint venture or acquisition, funded through internal capital allocation across the company's existing operational budget.
Signal: Established leaders are prioritizing organic natural production capacity growth over acquisition-led expansion. across the broader industry going forward.
OCTOBER 2025

BASF Signs Long-Term Supply Agreement With National Fortification Program

BASF SE entered a multi-year supply agreement with a national government fortification program, securing dedicated apocarotenal allocation in exchange for guaranteed volume commitments extending several years forward. The arrangement is a supply agreement, not an equity stake, reflecting a sector preference for contractual commitment over ownership.
Signal: Long-term supply agreements are increasingly becoming the preferred mechanism for securing fortification program capacity. industry-wide overall.
JANUARY 2026

Zhejiang NHU Acquires Regional Processing Facility in Eastern China

Zhejiang NHU Company Ltd completed an acquisition of a smaller regional processing facility in eastern China, expanding its carotenoid production footprint to serve growing domestic demand. This transaction was structured as an acquisition, not a joint venture, giving Zhejiang NHU full operational control over the acquired facility immediately upon closing.
Signal: Chinese producers are consolidating regional capacity to strengthen domestic supply chain resilience. across the region today.

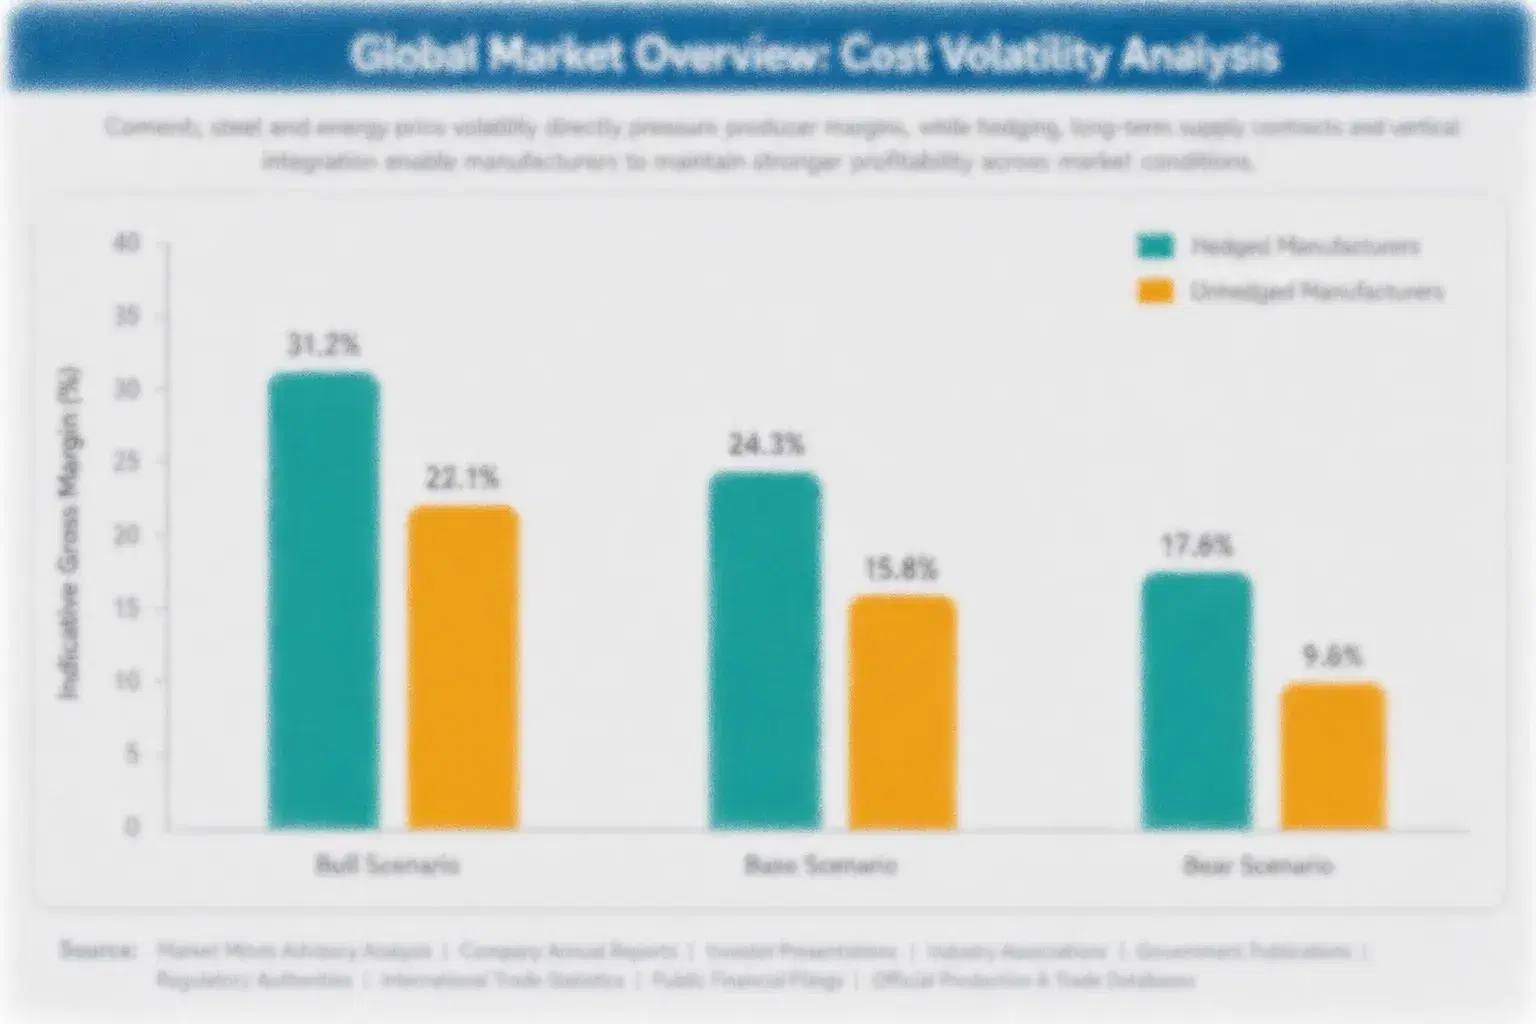
Carotenoid Precursor Costs Shape Producer Margins

Carotenoid precursor and fermentation media inputs together represent roughly 36% of total cost of goods sold for apocarotenal production, sourced through petrochemical and agricultural fermentation supply chains subject to their own independent pricing cycles largely unrelated to colorant demand fundamentals. This exposure gives producers with flexible feedstock sourcing meaningful cost advantages over those locked into single-source supply contracts during periods of commodity volatility.
Petrochemical feedstock prices spiked meaningfully during the 2022 to 2023 period due to broader energy market disruption, based on EIA energy market data, pushing synthetic production costs up sharply within a matter of months across most affected processing facilities. Producers relying heavily on synthetic petrochemical routes faced immediate margin compression, while producers with fermentation-derived natural production capability absorbed the shock with comparatively modest cost increases given their different underlying feedstock base and sourcing arrangements currently in place.

This exposure creates a genuine competitive disadvantage for producers dependent solely on synthetic petrochemical routes, since they cannot easily shift toward fermentation-derived alternatives during periods of feedstock cost volatility without substantial process investment. Larger diversified producers with both production routes available weather these cycles considerably better than smaller, single-route-dependent competitors operating without comparable production flexibility currently.
apocarotenal-market-cost-volatility-analysis-1789947834961

Fermentation Route Diversification Investment

Producers increasingly invest in fermentation-derived production capability alongside existing synthetic routes, trading some near-term investment cost for genuine long-term feedstock flexibility and reduced petrochemical exposure. This approach has become standard practice among the largest producers and is spreading gradually to mid-sized players seeking comparable protection against single-route production risk over the medium term horizon.

Long-Term Feedstock Supply Contracts With Suppliers

Directly contracting with feedstock suppliers at guaranteed volumes and pre-agreed pricing reduces exposure to spot-market volatility during periods of commodity price disruption affecting either petrochemical or agricultural fermentation feedstock supply chains. Several producers have expanded these contracted relationships significantly over the past several years, finding that guaranteed offtake commitments also improve feedstock quality consistency.

Portfolio Architecture for Margin Defence

The market splits cleanly into three commercial tiers running from standard synthetic-grade material through certified fortification-program grades and into next-generation fermentation-derived natural supply. Margin economics differ sharply across these tiers, with the volume-driven synthetic segment competing largely on price while certified and next-generation tiers command meaningfully higher pricing across the board. Producers who understand where value concentrates allocate capital more efficiently than volume chasers.
The tension between volume and premium positioning defines most producer strategy decisions currently. Producers chasing volume growth in standard synthetic material accept thinner margins in exchange for predictable, high-volume offtake, while those investing in fermentation-derived natural production and fortification certification sacrifice some near-term volume growth for meaningfully better unit economics over the medium term. Producers that misjudge this balance risk stranding capital.

High-value margin pools concentrate overwhelmingly in fermentation-derived natural and documented fortification program supply, where manufacturer willingness to pay reflects genuine clean-label and nutritional differentiation rather than simple coloring functionality. Producers positioned to serve these tiers simultaneously capture the clearest path toward sustained margin expansion as the broader category continues its current trajectory forward into new applications worldwide currently. Producers already serving certified customers hold a natural head start in this expanding margin pool.

Volume / Commodity-Adjacent Tier

Standard synthetic-grade apocarotenal sold primarily on price for mainstream beverage and dairy coloring applications. Margins stay thin but volume remains dependable across established manufacturer relationships renewed on relatively short cycles year after year.
Gross Margin: 14%-22%

Premium / Certified Tier

Certified fortification-program grade material meeting documented provitamin A activity standards required by government fortification and supplement manufacturers. This tier attracts the bulk of current producer capital investment across leading firms today.
Gross Margin: 26%-36%

Sustainability / Regulatory / Next-Generation Tier

Fermentation-derived natural material meeting the most demanding manufacturer clean-label verification requirements available in the category. Volume stays comparatively small but per-contract value runs highest across the entire apocarotenal market by a wide margin overall.
Gross Margin: 36%-46%
apocarotenal-market-portfolio-architecture-1789947835283

High-value Sub-segments and Strategic Watch-out

Fermentation-Derived Natural Material

This segment combines the highest per-unit pricing in the entire category with genuinely strong growth as clean-label verification demands expand steadily, making it the clearest priority for producer capital allocation over the coming several years ahead. Manufacturers sign long-duration contracts once a supplier clears full natural production requirements.
Gross Margin: 38%-46%

Certified Fortification-Program Grade

High per-unit value paired with strong steady growth as government programs standardize documented provitamin A verification across core fortification initiatives industry-wide, a pattern spreading quickly across markets. This segment offers meaningfully better economics than standard synthetic-grade material without the extended production timelines the top tier demands.
Gross Margin: 27%-35%

Standard Synthetic-Grade Supply

The volume core of the market, supplying mainstream beverage and dairy reformulation at commodity-adjacent pricing across most established long-running manufacturer relationships worldwide. Margins stay genuinely thin, but this segment anchors producer capacity utilization and funds investment in the higher-margin tiers positioned directly above it. Watch closely for developments.
Gross Margin: 14%-20%

Natural Colorant Substitution Risk

A strategic watch-out for synthetic-focused producers, since continued clean-label reformulation toward annatto and standalone beta-carotene could meaningfully erode apocarotenal's addressable market over time if substitution accelerates faster than currently projected across major consumption categories worldwide tracked in this report. Watch closely for further competitive dynamics.
Gross Margin: 10%-18%

Fortification Certification Anchors Recurring Demand

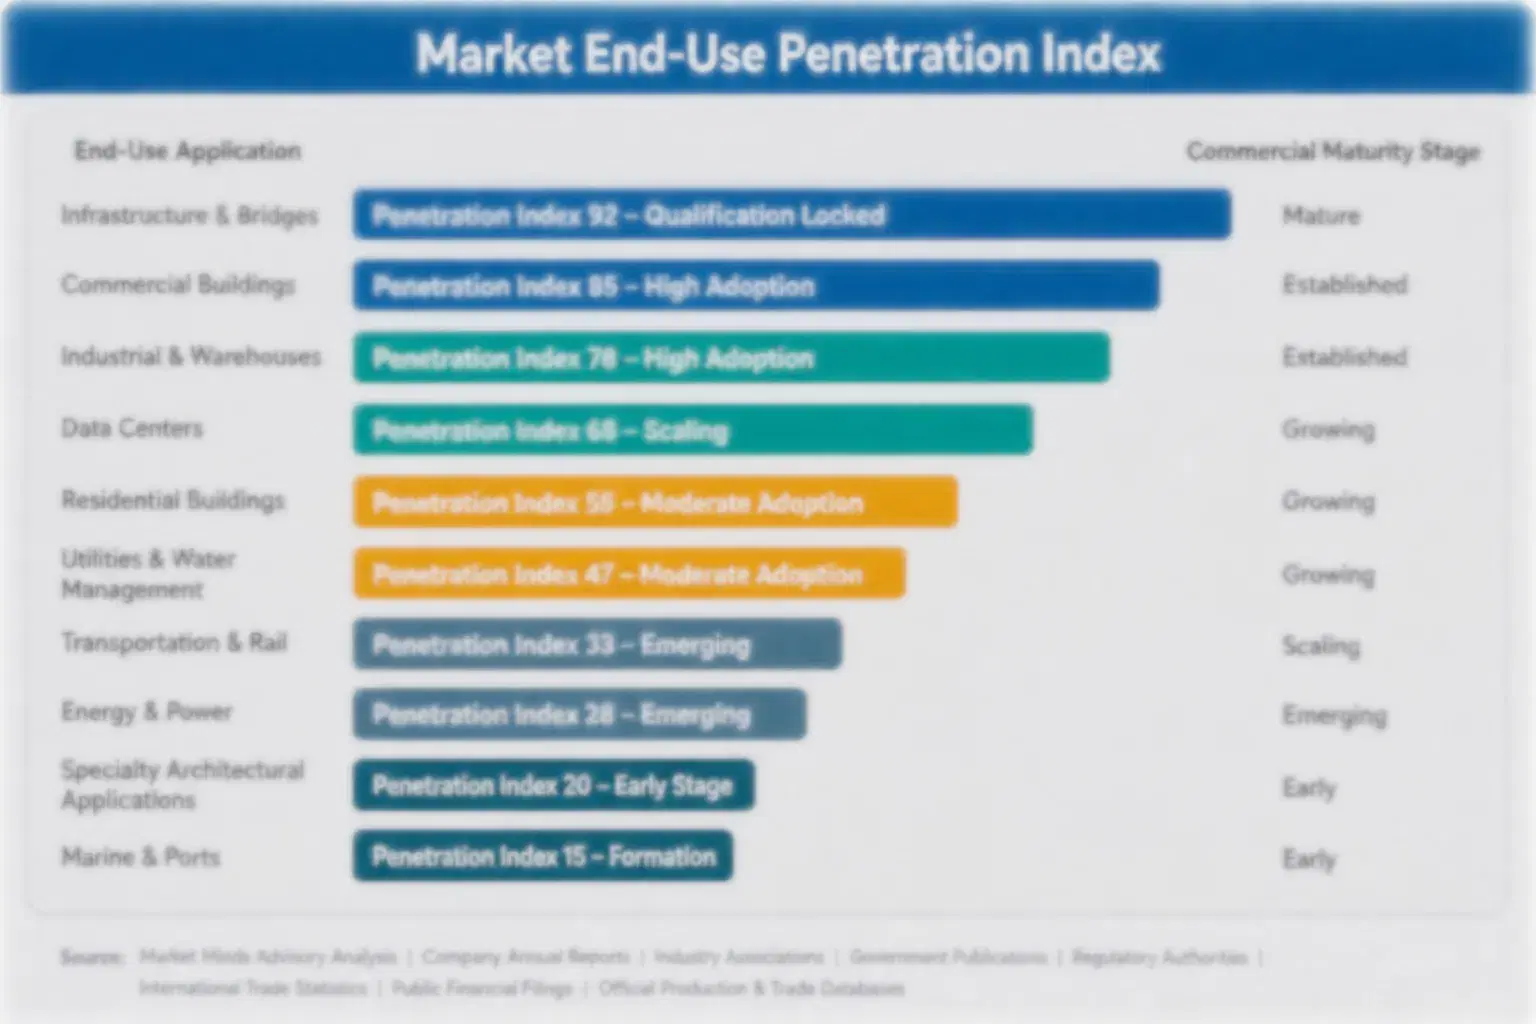
Apocarotenal generates genuine multi-year demand once a manufacturer or government program completes formulation qualification and locks in a specific producer within finished beverage, dairy, or fortification products, since switching producers requires requalifying provitamin A activity and sourcing documentation across an entire program, a costly process manufacturers avoid without strong reason. This lock-in strengthens meaningfully once a producer earns preferred fortification program certification status from a government or manufacturer's own internal quality team.
Adoption depth varies sharply by end-use vertical. Government fortification programs adopt deepest, forming close technical partnerships with producers offering certified, documented provitamin A activity meeting elevated public health standards, while mainstream beverage manufacturers adopt more selectively, often testing multiple producers before committing to a specific formulation. Manufacturers serving both segments simultaneously often maintain dual-sourcing relationships balancing cost discipline against consistency needs across their broader supplier base.

A generational shift is underway among manufacturer formulation buyers, as younger procurement and product development managers increasingly research natural production sourcing proactively for genuine clean-label differentiation, unlike prior generations who more commonly treated apocarotenal as a purely functional commodity decision rather than a mainstream marketing consideration. This shift is gradually reshaping supplier evaluation criteria across newly launching product lines industry-wide.
apocarotenal-market-end-use-penetration-index-1789947835621

Where Producers Should Focus Next

These are among the four positions where our research anticipates prominent divergence between winners and laggards over the coming forecast period. Each is grounded in the demand model, the regulatory perimeter, and the announced capacity pipeline.
01 / NATURAL PRODUCTION PRIORITY

Prioritize fermentation-derived production over defending synthetic volume

Producers weighing where to deploy limited capital should prioritize fermentation-derived natural production ahead of defending synthetic volume, since natural material commands a pricing premium few competitors can currently match given the clean-label credibility involved. The multi-year production development timeline creates a genuine moat once achieved, locking in manufacturer relationships that later entrants find difficult to dislodge quickly. Capacity added without this differentiation risks losing ground to competing natural colorants regardless of underlying cost trends across the category, since few competitors currently match this level of production sophistication.
02 / FORTIFICATION PROGRAM FOCUS

Deepen certification ties with government fortification programs

Government fortification programs represent a uniquely stable, long-duration demand source that private commercial customers cannot always match, and producers who invest in dedicated certification and documentation capability position themselves to capture this reliable revenue stream ahead of less prepared competitors. Building these relationships takes genuine regulatory and public health sector navigation expertise, but it meaningfully diversifies revenue away from more volatile private commercial demand cycles. Firms that move early will likely hold durable government relationships few competitors can easily replicate.
03 / FEEDSTOCK FLEXIBILITY INVESTMENT

Build dual synthetic and fermentation production routes

Producers dependent solely on synthetic petrochemical routes face recurring cost shocks that diversified competitors increasingly avoid through fermentation-derived production capability spanning different feedstock bases entirely. Building this flexibility takes real investment and time, but it meaningfully reduces exposure to the feedstock volatility that has repeatedly compressed margins across the category in recent years. Firms that move early on this diversification will likely hold a durable cost advantage over rigid rivals overall, since few competitors currently match this level of feedstock flexibility.
04 / DIFFERENTIATION INVESTMENT STRATEGY

Emphasize provitamin A activity to differentiate from pure colorants

Producers competing against purely natural colorants lacking nutritional functionality should emphasize apocarotenal's documented provitamin A activity as a genuine point of differentiation, since this dual functionality represents a durable advantage competing colorants cannot easily replicate regardless of their natural sourcing credentials. This positioning requires sustained investment in clinical and nutritional documentation, but it protects market share in applications where nutritional functionality genuinely matters most to buyers. This positioning requires sustained investment, but it protects market share where nutritional functionality genuinely matters most.

Engagement Snapshot From the Field

A live engagement with an industry participant carrying material or product regulatory and market exposure ahead of a defining policy shift, showing how our research translates into a defensible multi-year portfolio strategy.
MARKET MINDS ADVISORY · CLIENT ENGAGEMENT SUMMARY
Apocarotenal Producer Strategic Portfolio Review and Transition Roadmap 2026·Investment Scenario on Apocarotenal Exposure Evaluation 2025-26
CLIENT PROFILE
The client is a national health ministry operating a government-mandated vitamin A fortification program targeting staple beverage products, seeking to evaluate whether transitioning to a fermentation-derived natural apocarotenal supplier would strengthen its program's public credibility relative to its existing synthetic-grade supplier arrangement currently in place across its network. The ministry operates fortification programs across multiple provincial health districts.
STRATEGIC CHALLENGE
The ministry needed to determine whether the higher cost of fermentation-derived natural apocarotenal justified the investment, given budget constraints typical of public health programs and genuine concern about disrupting an already functioning fortification supply chain serving millions of program beneficiaries across the country's rural and urban distribution networks currently in place.
MMA APPROACH
MMA conducted a comparative cost-benefit and public perception assessment benchmarking natural apocarotenal sourcing against the ministry's existing synthetic-grade supply arrangement, supplemented by structured public health messaging research measuring program trust and compliance under different ingredient sourcing transparency scenarios across the program's target beneficiary population. Findings were benchmarked against comparable programs other national health ministries had recently implemented.
KEY FINDINGS
  1. Cost analysis confirmed natural apocarotenal would increase program ingredient costs by roughly 40%, a meaningful but manageable increase given the program's overall public health budget allocation.
  2. Public perception research indicated that transparent communication about natural sourcing meaningfully increased program trust and compliance among target beneficiary populations surveyed. across the surveyed regional population.
  3. Supply chain analysis identified two qualified natural producers capable of meeting the program's volume requirements, reducing single-supplier dependency risk compared with the existing arrangement.
  4. Transition costs were projected to be offset within roughly two years given the improved compliance and reduced program dropout rates natural sourcing transparency was expected to generate over time.
CLIENT PROFILE
The client is a national health ministry operating a government-mandated vitamin A fortification program targeting staple beverage products, seeking to evaluate whether transitioning to a fermentation-derived natural apocarotenal supplier would strengthen its program's public credibility relative to its existing synthetic-grade supplier arrangement currently in place across its network. The ministry operates fortification programs across multiple provincial health districts.
STRATEGIC CHALLENGE
The ministry needed to determine whether the higher cost of fermentation-derived natural apocarotenal justified the investment, given budget constraints typical of public health programs and genuine concern about disrupting an already functioning fortification supply chain serving millions of program beneficiaries across the country's rural and urban distribution networks currently in place.
MMA APPROACH
MMA conducted a comparative cost-benefit and public perception assessment benchmarking natural apocarotenal sourcing against the ministry's existing synthetic-grade supply arrangement, supplemented by structured public health messaging research measuring program trust and compliance under different ingredient sourcing transparency scenarios across the program's target beneficiary population. Findings were benchmarked against comparable programs other national health ministries had recently implemented.
KEY FINDINGS
  1. Cost analysis confirmed natural apocarotenal would increase program ingredient costs by roughly 40%, a meaningful but manageable increase given the program's overall public health budget allocation.
  2. Public perception research indicated that transparent communication about natural sourcing meaningfully increased program trust and compliance among target beneficiary populations surveyed. across the surveyed regional population.
  3. Supply chain analysis identified two qualified natural producers capable of meeting the program's volume requirements, reducing single-supplier dependency risk compared with the existing arrangement.
  4. Transition costs were projected to be offset within roughly two years given the improved compliance and reduced program dropout rates natural sourcing transparency was expected to generate over time.
RECOMMENDED STRATEGY
Phase 1: Phase one: pilot the natural apocarotenal supplier in a limited regional program area, testing compliance and cost outcomes before committing to a full national program transition across regions. Phase 2: Phase two: launch public health messaging emphasizing natural sourcing transparency, using research findings to guide specific communication strategies for the program's target beneficiary populations. Phase 3: Phase three: expand the natural supplier transition across the remainder of the national program only after confirming positive compliance and cost outcomes from the initial regional pilot phase.
OUTCOME
The ministry proceeded with the phased approach, launching its regional pilot and reporting improved program compliance within the first year of implementation (client-reported, unverified by MMA). Budget impact remained within projected ranges, and the ministry has since begun planning a broader national program transition (client-reported, unverified by MMA).

Frequently Asked Questions

Foundational context covering the market sizes, CAGR, scope, country, region and competition that inform every finding below. This section is provided to cover basics and most often pre-purchase conversations, answered from the MMA Primary Research Dataset.

What is the current size of the Apocarotenal Market?

The market reached USD 0.42 billion in 2025 across all application segments tracked in this report. It is projected to reach USD 0.44 billion in 2026 as fortification demand accelerates.

How large will the Apocarotenal Market be by 2036?

The market is projected to reach USD 0.75 billion by 2036 across all major regions covered. That represents a 1.69 times expansion from 2026 levels over the full forecast period.

What is the CAGR for the Apocarotenal Market 2026 to 2036?

The base case CAGR is 5.4% annually through 2036 across the full forecast period. Bull and bear scenarios range from 4.2% to 6.4% depending on fortification mandate adoption rates.

Which segment is growing fastest?

Dietary supplement and vitamin A fortification applications lead at a 7.6% CAGR, roughly 1.41 times the overall market rate. Beverage applications follow as the second-fastest segment.

Who are the major companies in the Apocarotenal Market?

Leading producers include DSM-Firmenich AG, BASF SE, Allied Biotech Corporation, Divi's Laboratories Limited, and Zhejiang NHU Company Ltd. Together they hold over half of global capacity.

Which country is growing fastest?

India leads country-level growth at a 6.9% CAGR among all countries tracked in this report. Large-scale government vitamin A fortification programs drive this acceleration steadily forward.

Report Segmentation Architecture

The full report scope spans multiple orthogonal segmentation dimensions, with cross-tabulated demand data provided for each dimension pair. Coverage extends further to regional breakdowns, trend trajectories, and the competitive detail needed to support segment-level decision-making.

By Application

  • Beverage Applications
  • Dairy and Margarine Applications
  • Dietary Supplement and Vitamin A Fortification Applications
  • Bakery and Confectionery Applications
  • Processed Food Applications
  • Pharmaceutical and Nutraceutical Applications

By End-Use Industry

  • Beverage Manufacturing
  • Dairy and Margarine Manufacturing
  • Dietary Supplement Manufacturing
  • Bakery and Confectionery Manufacturing
  • Pharmaceutical Manufacturing

By Commercial Dimension

  • Direct Manufacturer Supply Contracts
  • Government Fortification Program Agreements
  • Certified Natural Sourcing Supply Programs
  • Technical Co-Development Partnerships

By Region

  • North America
  • Western Europe
  • East Asia
  • South Asia and Pacific
  • Latin America
  • Middle East and Africa
  • Eastern Europe

Scope, Methodology, and Coverage

Every figure in this report is reproducible from documented input assumptions. The scope below maps the historical period, the forecast horizon, the segmentation dimensions, and the countries covered, alongside the underlying primary and qualitative methodology.
Historical Period
2020 to 2025
Forecast Period
2026 to 2036
Base Year
2025 (USD billions; MMA Primary Research Dataset, September 2026)
Market Definition
This report defines the apocarotenal market as beta-apo-8'-carotenal, a nature-identical carotenoid colorant, sold across beverage, dairy, dietary supplement, and processed food applications requiring orange-yellow coloring and provitamin A activity globally. It excludes natural annatto and standalone beta-carotene sold outside this report's defined apocarotenal-specific scope.
Quantitative Units
USD billions (current prices); metric tons for volume-referenced analysis where applicable
Segmentation Dimensions
By Application; By End-Use Industry; By Commercial Dimension; By Region
Regions Covered
North America, Western Europe, East Asia, South Asia and Pacific, Latin America, Middle East and Africa, Eastern Europe
Countries Covered
China, Japan, South Korea, USA, Canada, Germany, Netherlands, UK, India, Australia, Brazil, Mexico, UAE, Saudi Arabia, South Africa, Nigeria, Poland, Czech Republic, and additional markets relevant to this sector
Key Companies Profiled
DSM-Firmenich AG, BASF SE, Allied Biotech Corporation, Divi's Laboratories Limited, Zhejiang NHU Company Ltd, Novonesis A/S, Sensient Technologies Corporation, Kalsec Inc, GNT Group BV, San-Ei Gen F.F.I. Inc, Zhejiang Medicine Co Ltd, Chenguang Biotech Group Co Ltd, Vitablend Nederland BV, Fenchem Biotek Ltd, Deretil SA, Lycored Ltd, FBC Industries Inc, Roha Dyechem Pvt Ltd, Chromatech Incorporated, AIDP Inc
Quantitative Methodology
Primary survey, n=3,800 respondents, Q4 2025, six countries; demand-side model with trade association cross-validation
Qualitative Methodology
47 expert interviews, Q4 2025; applied to validate demand model assumptions, identify emerging dynamics, and assess competitive positioning
Report Format
PDF and XLSX data workbook (Word format preview document)
Publisher
Market Minds Advisory
Report Code
MMA-2026-AGR-108
Published
September 2026
Contact
sales@marketmindsadvisory.com | www.marketmindsadvisory.com

Purchase the full Apocarotenal Market Report (2026 to 2036).

This report delivers a complete commercial assessment of the apocarotenal market, covering sizing, segmentation, and regional demand through 2036. It profiles twenty producers across synthetic and fermentation-derived production operations, detailing competitive positioning, capacity investment, and natural production strategy in depth. Analysis extends to carotenoid precursor cost exposure and mitigation pathways, portfolio margin economics across three commercial tiers, and demand architecture driving manufacturer and government program formulation lock-in over time. Bull and bear forecast scenarios are modeled explicitly against named commercial catalysts and clearly identified downside risks.
Twenty producer competitive profiles and moat analysis
Seven-region demand and pricing breakdown analysis
Six-segment application growth forecast projection models
Carotenoid precursor cost exposure and mitigation pathways
Three-tier portfolio margin benchmarking analysis framework
Bull and bear scenario forecast modeling

Built For The People Who Decide

From boardroom strategy to bench-side execution, this report is read cover-to-cover by leaders shaping the next decade of their industry, turning demand scenarios, market dynamics and valuation benchmarks into decisions.
CXOs/ Presidents/ VPs/ Managers
M&A and Corporate Development
Strategy Teams and R&D Heads
Procurement and Product Directors
Regulatory and Compliance Leaders
Investor Relations and Equity Analysts