Market Minds Advisory
APAC Commercial Glazing Market

APAC Commercial Glazing Market: Energy Codes and Smart Glass Adoption

Tightening building energy codes across Asia-Pacific are pulling developers toward high-performance and electrochromic glazing, while curtain-wall fabricators race to localise coating capacity as China and India's construction pipelines outgrow other regions combined.

Lead Analyst

Bilal Shaikh

Published

September 2026

Make Smarter Decisions with Customized Research Insights

Request a free sample report and evaluate market opportunities, growth trends, and competitive dynamics relevant to your business needs.

2025 MARKET VALUE$34.0BMarket Size 2025
2036 FORECAST VALUE$73.0BBase Case , 2026 to 2036
CAGR 2026 TO 20367.2 %Bull 8.4% / Bear 6.0%
INCREMENTAL OPPORTUNITY$36.6BNet 10- year value creation
EXPANSION MULTIPLE2.00x2036 value over 2026 base
Strategic Levers
M&A Pipeline
Regional Outlook
Country Rankings
Competitive Intelligence
Segmental Deep-dive
Call-Us : 91 93563 13602

Executive Snapshot and Market Trajectory

Commercial developers across Asia-Pacific are specifying high-performance glazing earlier in design cycles than before, as revised energy codes in China, India, and Australia push thermal performance requirements well past what standard double-glazed units alone can now reliably deliver on flagship projects across nearly every major metropolitan market this year.
China and India's office, retail, and mixed-use construction pipelines are absorbing a disproportionate share of new glazing capacity, with electrochromic and vacuum-insulated systems moving from showcase towers into mainstream mid-rise specification faster than manufacturers had planned for only two years ago, reshaping capacity investment decisions across the supply base and pulling regional fabricators into premium categories once dominated entirely by global leaders across the wider industry.
Five manufacturers hold just over four in ten dollars of category revenue, a moderate concentration that still leaves considerable room for regional fabricators competing on local coating capacity and faster delivery windows across secondary markets throughout the region. Curtain-wall system integrators are consolidating around fewer certified glass suppliers as building codes tighten enforcement across nearly every major economy across the wider Asia-Pacific region this year, reshaping how developers select partners early.
Market Definition
The commercial glazing market covers architectural glass units, curtain-wall glazing systems, and window assemblies engineered for office, retail, institutional, and mixed-use commercial buildings, including single, double, triple, vacuum-insulated, electrochromic, and switchable-privacy configurations. It excludes residential window glazing, automotive glass, and interior partition glass not part of a building's exterior envelope.
Base Year Value
$34.0B in 2025 (MMA Primary Research Dataset, August 2026)
Forecast Period
2026 to 2036, eleven discrete annual values
CAGR
7.2% base case. Bull 8.4%. Bear 6.0%.
Fastest Growth Segment
Electrochromic (Smart) Glazing: 13.4% CAGR
Fastest Growth Country
India: 10.5% CAGR
Fastest Growth Region
South Asia and Pacific: 9.3% CAGR
Largest Region
East Asia: 30% of 2025 global value
Market Leaders
Saint-Gobain, AGC, NSG Group (Pilkington), Guardian Glass, and Vitro Architectural Glass. Source: MMA Analysis based on company annual reports and disclosed segment revenue.
Primary Survey
n=3,800 procurement and R&D decision-makers, Q4 2025, six countries
Methodology
Demand-side build-up, cross-validated against public data, 47 expert interviews

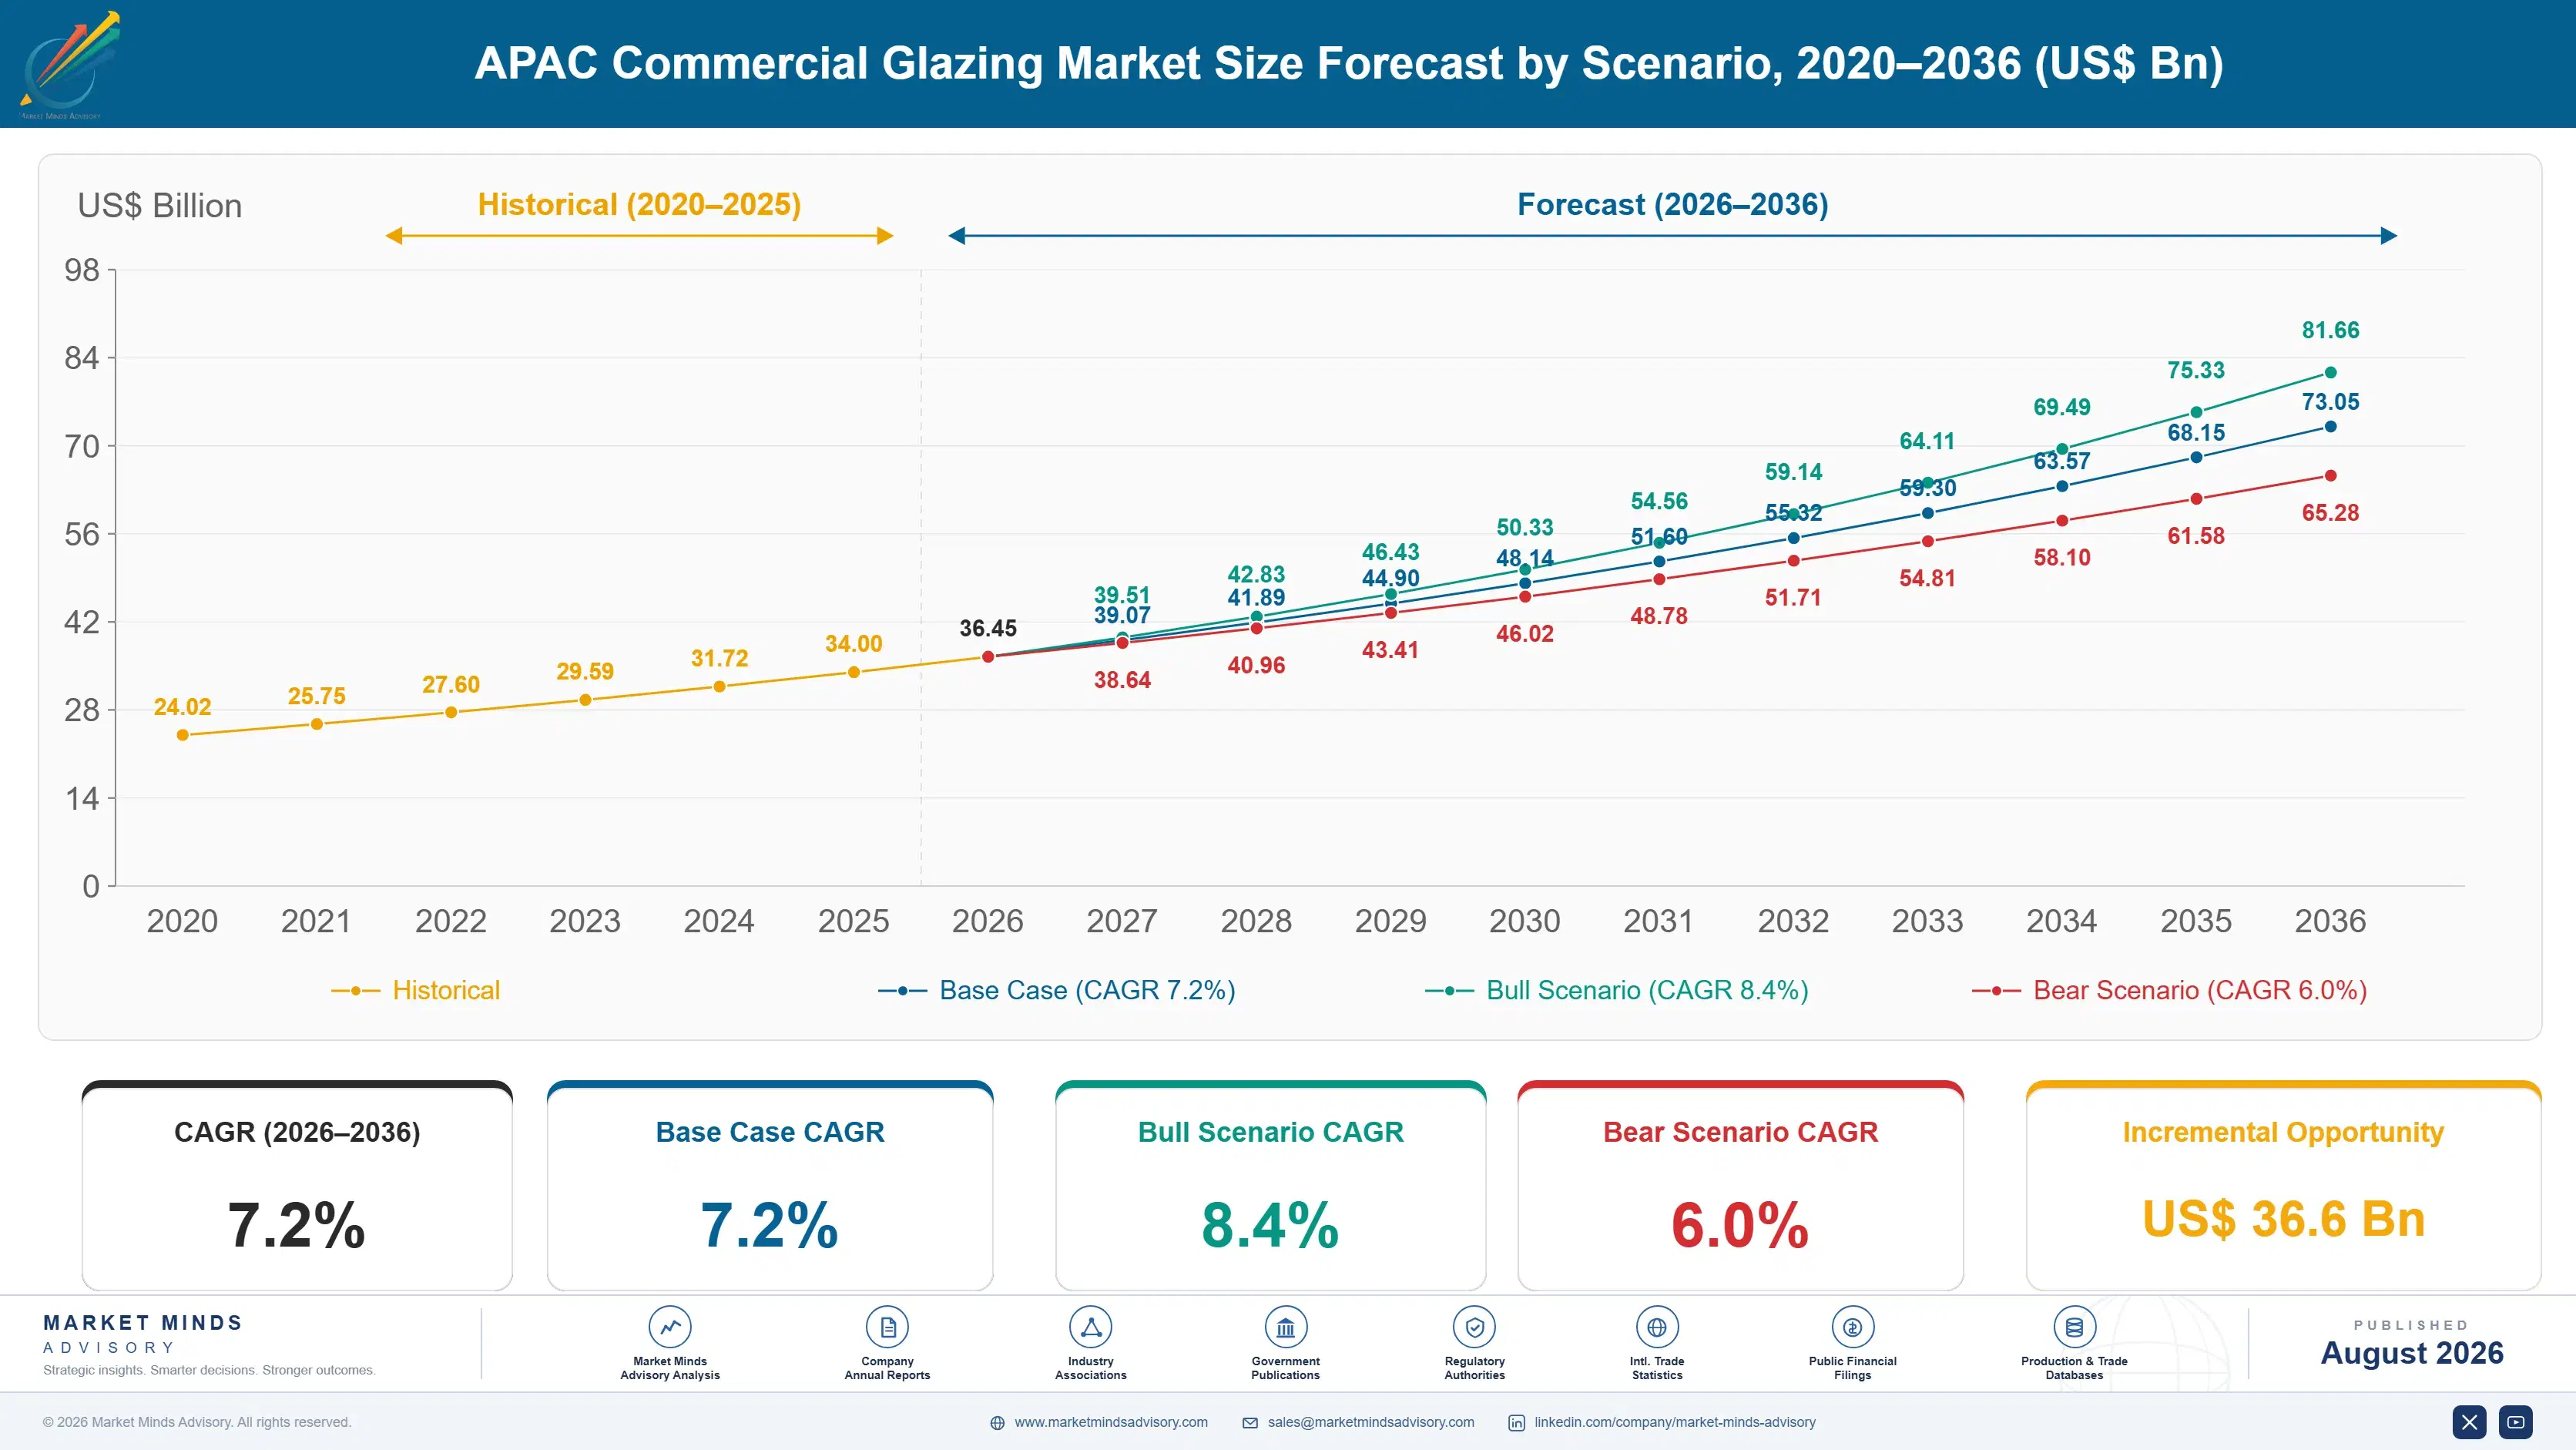
APAC Commercial Glazing Market Forecast Scenarios

apac-commercial-glazing-market-size-forecast-scenario-1787302851112
Between 2020 and 2025 the market grew at roughly 6.2% a year, a pace slowed early on by pandemic-era construction delays before accelerating sharply as deferred commercial projects across China, India, and Southeast Asia resumed construction alongside newly enforced building energy codes taking effect in several major regional economies during the broader post-pandemic recovery period across the region.
The base case assumes 7.2% annual growth through 2036, driven by three commercial mechanisms operating together across the region: mandatory energy-performance glazing requirements now spreading through national and municipal building codes across nearly every major economy, rapid electrochromic and vacuum-insulated glazing adoption in premium office towers moving faster than manufacturers anticipated, and curtain-wall retrofit demand at aging commercial stock nearing the end of its original glazing service life across dozens of metropolitan markets.
A bull case near 8.5% follows if China's revised national building energy standard forces accelerated retrofit demand across its existing commercial office stock ahead of the current compliance timeline set by regulators. A bear case near 5.9% follows instead if construction financing tightens across the region and developers defer glazing upgrades on stalled or delayed commercial projects currently in the pipeline.

Building Codes and the Premiumisation of Glazing

Three forces converge on commercial glazing specification this decade: tightening national building energy codes across nearly every major Asia-Pacific economy, premiumisation as developers chase green building certification for leasing advantage, and a widening performance gap between standard double-glazed units and the electrochromic and vacuum-insulated systems now entering mainstream specification well ahead of earlier industry timelines set only a few years ago by manufacturers themselves.
MARKET CONCENTRATIONCR5 42%share held by top five suppliers by disclosed revenue
AVERAGE SELLING PRICE$45-$210 per sqmrange spans standard double-glazed to premium electrochromic units
TOP PRODUCING COUNTRYChina, 34% shareof regional glazing manufacturing output by shipment value
CAPACITY UTILISATION76%average rate across surveyed architectural glass processing plants
TRADE INTENSITY38%share of regional glazing volume moving across borders
REPLACEMENT CYCLE20-25 yearstypical service life before facade glazing needs replacement
Commercial character has shifted from commodity flat-glass supply toward integrated curtain-wall system contracts bundling glass, framing, coating, and installation warranty into a single fabricator relationship spanning the full project timeline. Developers increasingly select a glazing partner during design development rather than at tender, giving early movers on code compliance a durable specification advantage over late-entering competitors bidding purely on price alone across the region.
Over the next decade, energy code enforcement, embodied-carbon reporting requirements, and electrochromic cost declines will keep separating certified premium suppliers from commodity fabricators still selling uncoated float glass into markets where code enforcement is tightening fastest, particularly across China's tier-one and tier-two cities and increasingly across India's fastest-growing metropolitan office markets as well, where enforcement resources have expanded meaningfully in recent years.
"Facade glass used to be a line item architects fought over on price alone. Now it is the single component most likely to determine whether a tower clears its energy code review, and that has quietly rewritten who gets specified first."
Director, Building Materials Practice · MMA Construction and Industrial Equipmen

Market Trends

Electrochromic Glazing Moves Into Mainstream Mid-Rise Specification

Electrochromic and suspended-particle-device glazing, once reserved for flagship towers, is now appearing in mid-rise office and mixed-use specification across China, Japan, and Australia as unit costs have fallen and installers have gained enough project experience to quote with confidence. Developers value the reduced need for mechanical shading and the daylighting benefit tenants report in post-occupancy surveys conducted by regional green building councils. Three of the five largest manufacturers expanded electrochromic production lines between 2023 and 2025, and order data shows mainstream adoption arriving roughly two years earlier than manufacturers had originally planned for at the start of the decade.
Market Impact: Drives 4.8 percent yearly code-link
National Energy Codes Push Vacuum-Insulated Glazing Adoption

China's revised national building energy standard and India's Eco-Niwas Samhita code both raised minimum thermal performance requirements for commercial facades, pushing specifiers toward vacuum-insulated glazing where triple-pane units would otherwise add too much weight and framing cost to a curtain-wall system already near its structural limit. Japanese manufacturers hold an early technical lead in vacuum-insulated glazing production, having commercialised the technology years ahead of competitors elsewhere in the region. Adoption is concentrated in premium office and institutional projects first, with mid-market commercial construction expected to follow as manufacturing scale brings unit costs down over the coming several years.
Market Impact: Adds 3.6 percent premium-tier deman

Market Opportunities and Growth Drivers

Tightening National Building Energy Codes Across Major Economies

China's Ministry of Housing and Urban-Rural Development revised national building energy efficiency standards, raising minimum glazing thermal performance requirements for new commercial construction across every climate zone the country covers. India's Bureau of Energy Efficiency has extended similar requirements through its Eco-Niwas Samhita code, now mandatory in several major metropolitan jurisdictions for new commercial permits. Developers unable to meet the revised thermal performance thresholds with standard double-glazed units are shifting specification toward low-emissivity coated, triple-pane, and vacuum-insulated systems earlier in the design process, pulling forward glazing decisions that previously happened much later during construction documentation.
Market Impact: Limits mid-market share to 9 percen

Green Building Certification Demand From Institutional Tenants

Multinational tenants and institutional investors increasingly require LEED, Green Star, or IGBC certification as a leasing condition across major Asia-Pacific office markets, and glazing performance carries meaningful weight in each certification's energy modelling calculation. Developers pursuing certification specify higher-performance glazing even where local code would otherwise allow a cheaper standard unit, since certification directly affects achievable rental rates and tenant retention in competitive submarkets. Australia and Singapore show the deepest certification penetration currently, with China and India's certified commercial stock expanding rapidly as institutional capital increasingly favours certified assets across the region.
Market Impact: Costs certified suppliers 8 percent

Market Restraints and Challenges

Electrochromic Cost Premium Limits Mid-Market Penetration

Electrochromic glazing still carries a substantial per-square-metre cost premium over standard low-emissivity double glazing, and that premium remains the single largest barrier to adoption outside flagship and premium office projects across the region. The root cause is the specialised coating and control-system manufacturing process, which has not yet reached the production scale needed to close the cost gap meaningfully with conventional glazing. Developers on tighter budgets are mitigating this by specifying electrochromic glazing only on street-facing facade sections while using standard coated glazing elsewhere on the same building, capturing marketing value without the full building-wide cost premium.
Market Impact: Adds 13.4 percent segment growth ye

Fragmented Code Enforcement Across Secondary Cities

While tier-one cities across China and India enforce revised energy codes closely, secondary and tertiary cities often lack the inspection capacity to verify glazing specification against approved drawings before occupancy, allowing some developers to substitute cheaper uncertified glazing after code approval. The root cause is inspection staffing that has not scaled at the same pace as new commercial construction permits issued in fast-growing secondary markets. The commercial impact falls hardest on certified manufacturers competing against substituted glazing on price in these fast-growing but under-inspected secondary markets where verification capacity remains limited.
Market Impact: Lifts vacuum-insulated share by 11
3 additional market trends, 3 additional growth drivers, and 2 additional restraints and challenges are covered in the full report. Contact sales@marketmindsadvisory.com to access the complete intelligence.

Segment CAGR and Growth Architecture

Segmentation follows glazing configuration and technology, the dimension that determines thermal performance, cost tier, and which building code thresholds a given unit can satisfy without additional mechanical shading or framing modification across most commercial applications built across the region today, since technology choice increasingly drives certification outcome more than any other single design factor considered.
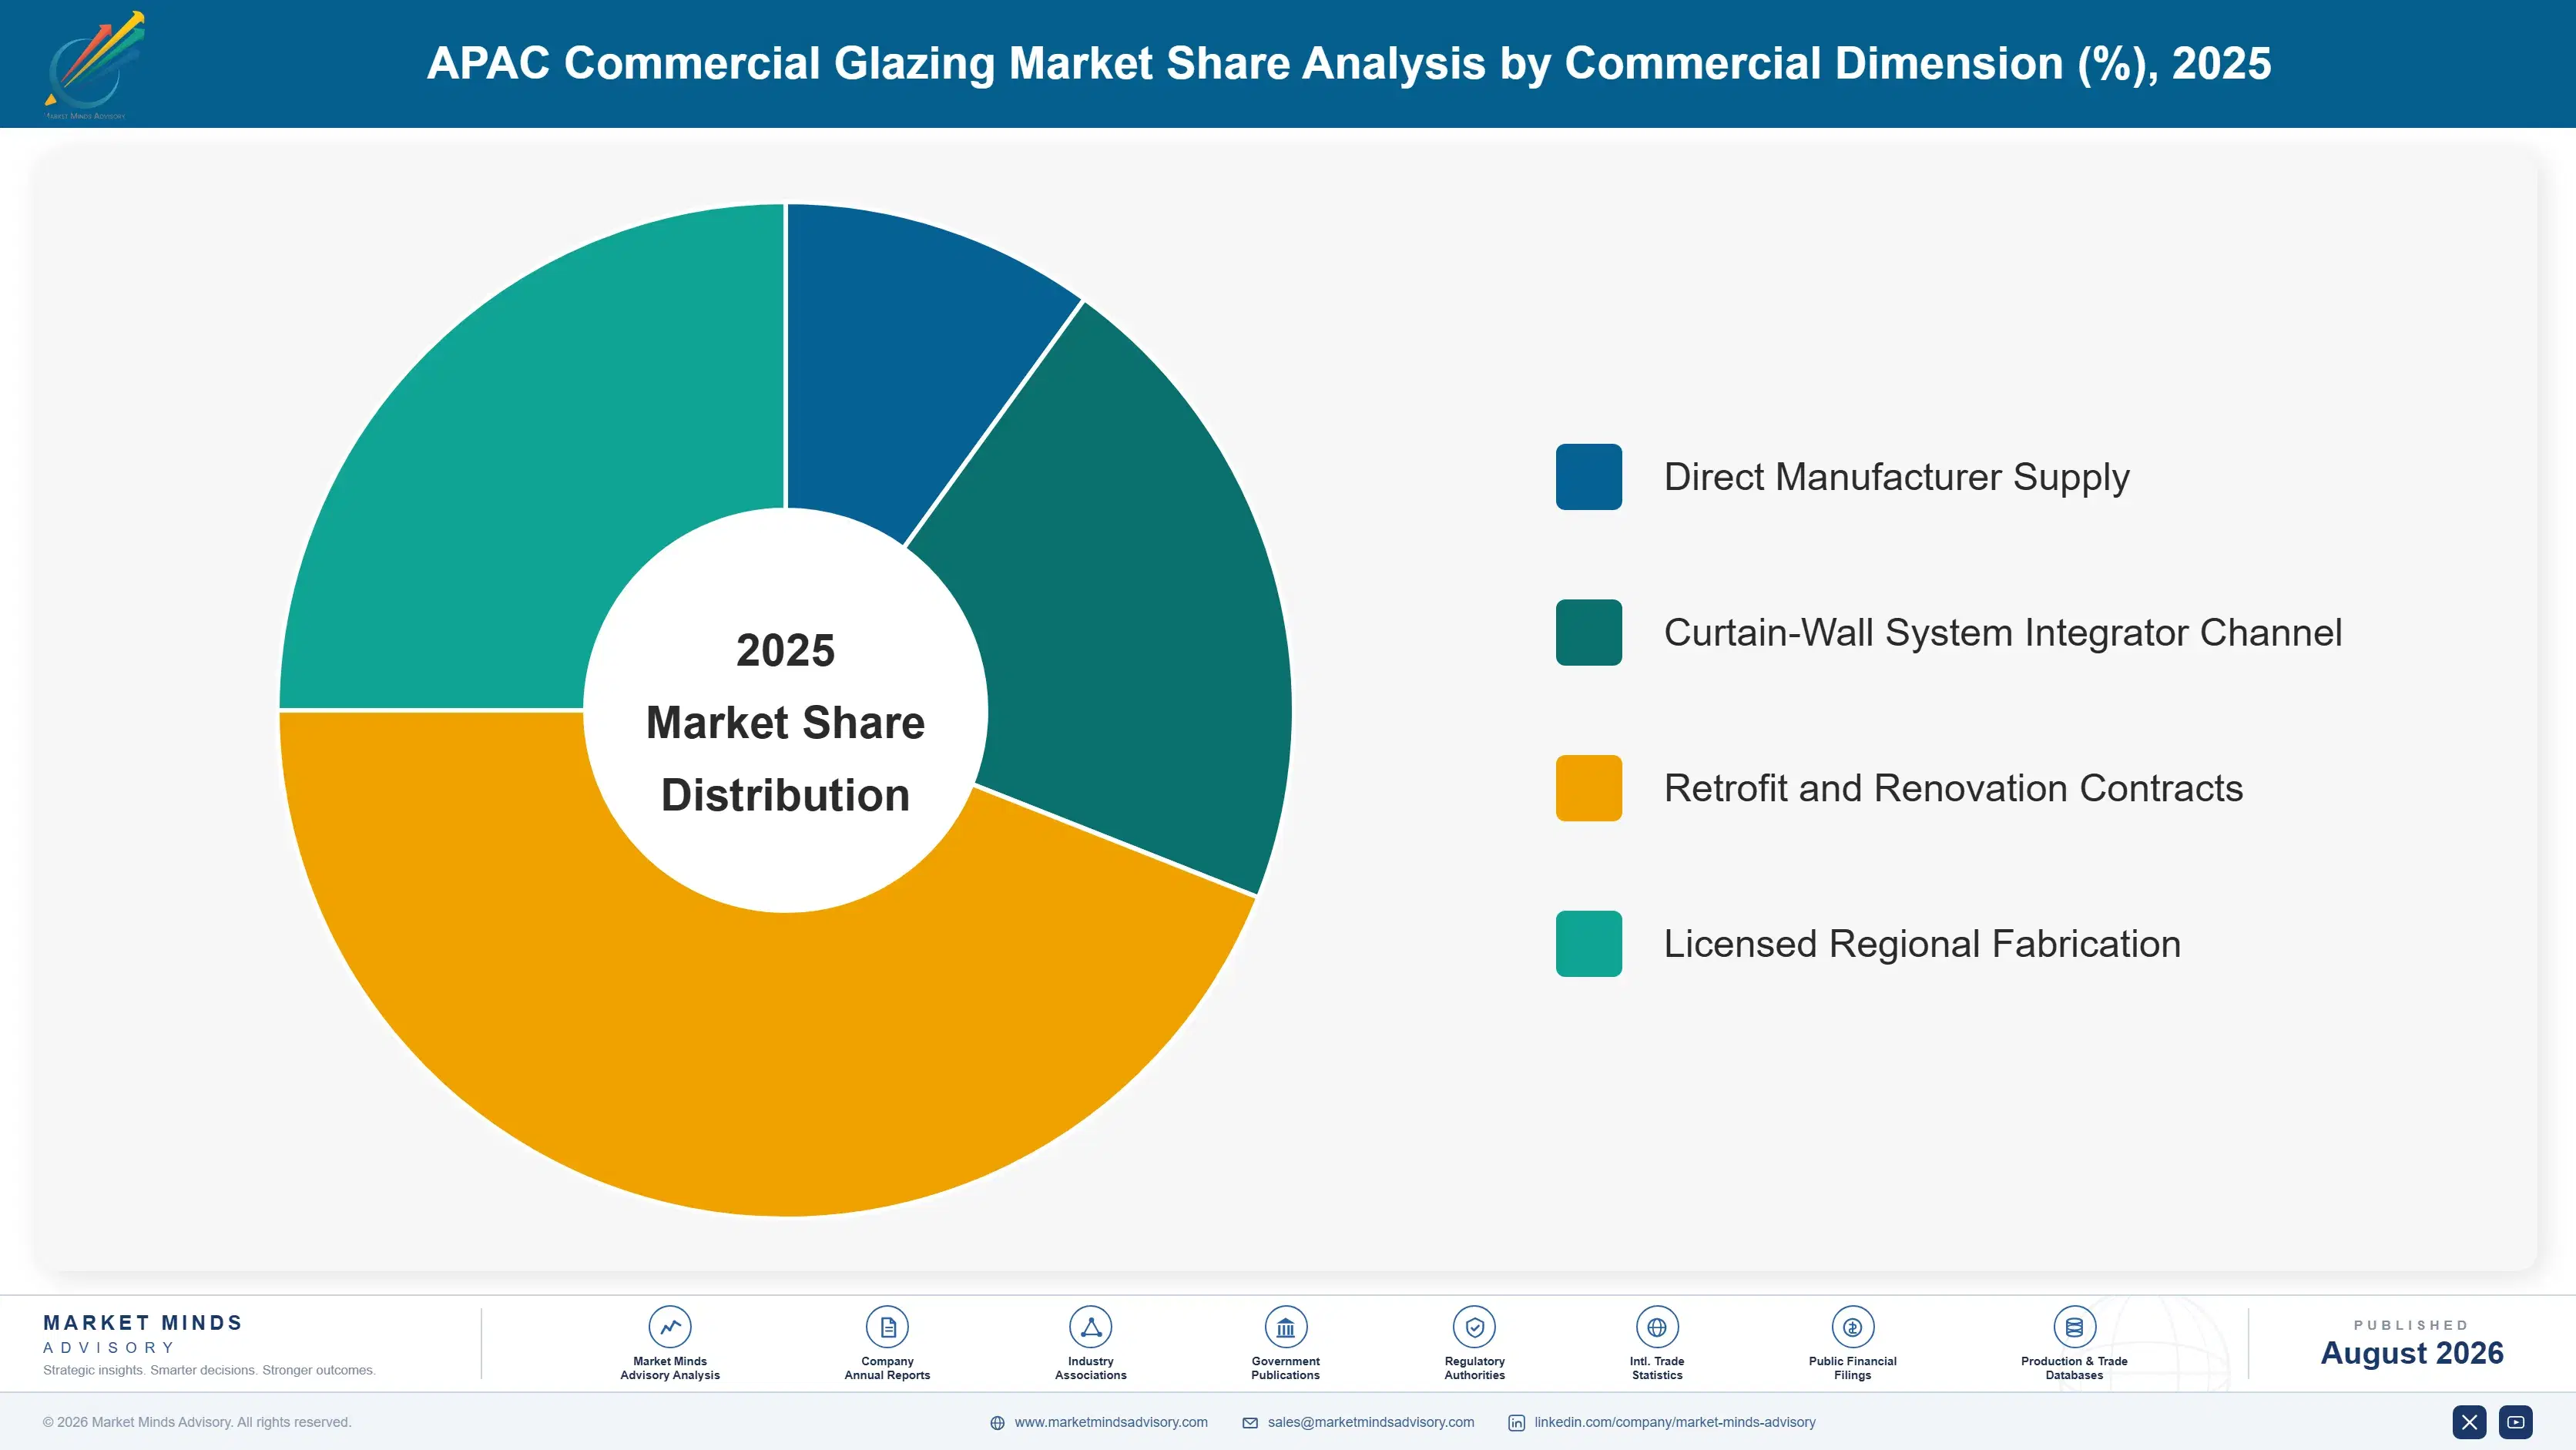
apac-commercial-glazing-market-market-share-analysis-1787302851651

Electrochromic (Smart) Glazing

Electrochromic glazing is pulling ahead as unit costs decline and control-system reliability improves, letting developers use tintable glass to manage solar heat gain without the mechanical shading that adds cost and maintenance burden to a facade over its service life. Premium office and hospitality developers across China, Japan, and Australia are the earliest adopters, valuing both the energy performance and the marketing differentiation tintable facades provide in competitive leasing markets. Growth concentrates in flagship and upper mid-market projects first, with unit costs still limiting penetration into cost-sensitive mid-market construction elsewhere. Manufacturers including Saint-Gobain and AGC have expanded electrochromic capacity to meet this fast-rising demand, and order data shows the segment's growth consistently outpacing every other glazing category tracked.
CAGR 13.4%

Vacuum-Insulated Glazing (VIG)

Vacuum-insulated glazing is the second-fastest category, favoured wherever a project needs triple-pane thermal performance without the added weight and frame depth a conventional triple-glazed unit requires on an already-constrained curtain-wall structure. Japanese manufacturers hold an early technical and manufacturing lead, having commercialised the technology years ahead of regional competitors now working to close the gap. Growth concentrates in premium office and institutional retrofit projects first, where structural load limits make VIG's thinner profile a genuine specification advantage over thicker triple-glazed alternatives. Unit costs remain the primary friction point limiting broader adoption, but manufacturers are scaling production specifically to bring vacuum-insulated glazing within reach of mainstream commercial specification over the next several years.
CAGR 11.2%
Full segment breakdown across 6 segments available in the complete report.

Regional Architecture and Country Demand Map

East Asia leads on both manufacturing scale and commercial construction volume, while South Asia and Pacific grows fastest as India and Australia's commercial pipelines expand rapidly across major metropolitan markets. North America and Western Europe compete mainly on retrofit and premium certification demand rather than new-build volume growth.

North America

Retrofit demand at aging commercial office stock built before modern energy codes took effect is the dominant demand mechanism here, particularly across US gateway cities where landlords face mounting pressure to certify buildings ahead of upcoming local emissions-performance mandates now taking effect. Canada's National Energy Code for Buildings has pushed similar retrofit and new-build specification upward in major metropolitan markets over recent code cycles. Guardian Glass and Vitro dominate domestic supply, giving North American developers shorter lead times than the imported alternatives more common elsewhere in the market. Growth trails East Asia because much of the region's premium office stock is already glazed to a relatively high standard, leaving retrofit rather than new construction as the primary driver going forward.
Share: 23% | CAGR: 7.6% (2026 to 2036)

Western Europe

The EU's Energy Performance of Buildings Directive continues to set some of the strictest thermal performance thresholds globally, and Germany, France, and the Nordic countries lead regional adoption of triple-glazed and vacuum-insulated systems as a result of sustained code pressure over the past decade. Saint-Gobain and AGC, both headquartered in the region, supply a large share of domestic demand directly from local production facilities. Growth trails the global average because the region's commercial building stock is already largely compliant with current thermal standards, leaving incremental retrofit and next-generation smart glazing adoption as the primary growth driver rather than new-build volume expansion across most Western European markets currently tracked by regional developers and asset managers alike.
Share: 19% | CAGR: 5.7% (2026 to 2036)
Regional intelligence for 5 additional markets available in the complete report: East Asia, South Asia and Pacific, Latin America, Middle East and Africa, Eastern Europe. Contact sales@marketmindsadvisory.com.
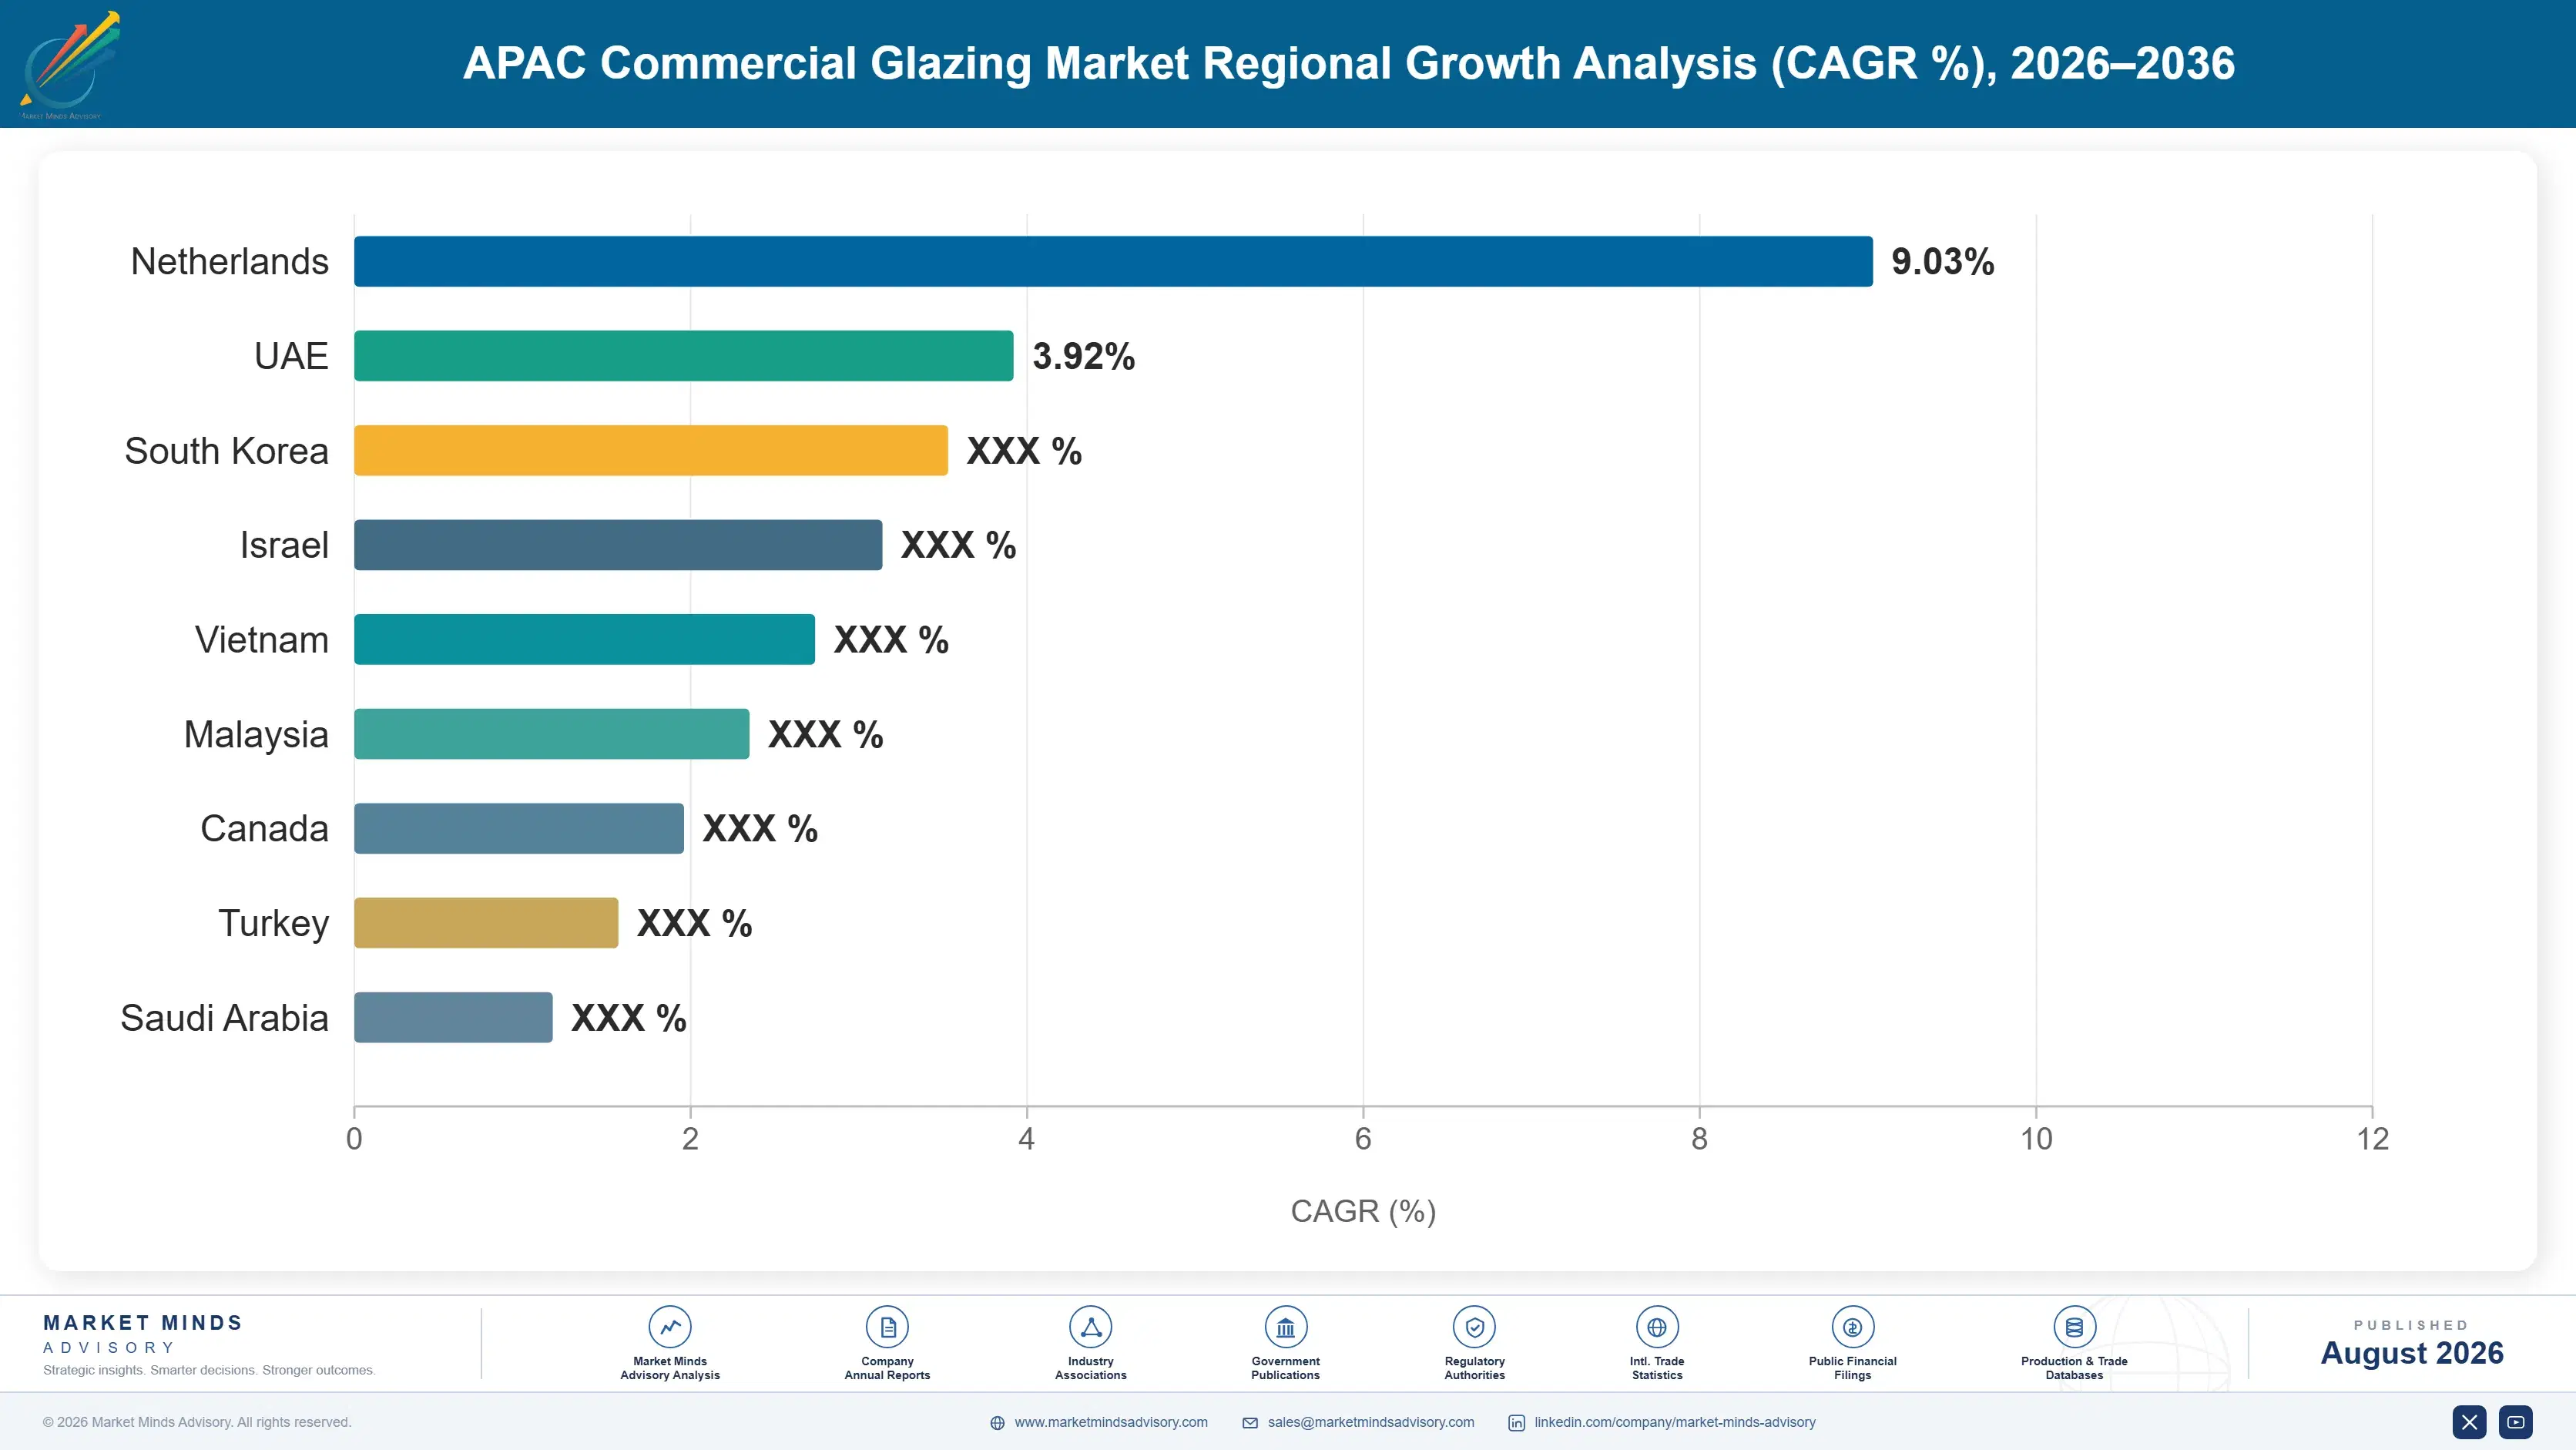
apac-commercial-glazing-market-country-cagr-analysis-1787302852168

Certification Services, Retrofit, and Smart Glass Upsell

Manufacturers are shifting revenue toward certification support services and premium glazing upsell, capturing more value per project as developers chase green building certification rather than competing purely on the price of standard flat glass sold by the square metre alone across most commercial projects today, reshaping margin structures industry-wide as a direct result of this shift.

Bundled Energy Modelling and Certification Support

Manufacturers including Saint-Gobain and AGC now bundle energy performance modelling and green building certification documentation support directly into curtain-wall supply contracts, helping developers demonstrate code and certification compliance without hiring a separate consultant for the analysis. This service captures value beyond the glass itself, with manufacturers reporting the bundled offering adds roughly 12% to average contract value on certified projects compared to glass-only supply agreements signed previously. Early adopters report the service also shortens design-development timelines meaningfully, since energy modelling happens concurrently with glazing specification rather than as a separate sequential step handled by outside consultants.
Market Impact: Adds 12 percent to average project

Electrochromic Retrofit Programmes for Existing Towers

Rather than requiring a full facade replacement, manufacturers are developing retrofit-compatible electrochromic film and panel systems that can be installed over existing glazing in older commercial towers seeking certification upgrades without a full curtain-wall replacement project. This addresses a genuine gap for landlords who need certification improvement but cannot justify the capital cost or tenant disruption of complete facade replacement. Retrofit programme pricing sits at roughly 40% of full facade replacement cost, making the economics considerably more attractive to landlords managing renovation budgets across an existing portfolio of aging commercial assets.
Market Impact: Captures roughly 40 percent of full

Extended Performance Warranties Tied to Certified Installation

Manufacturers are introducing extended thermal-performance warranty tiers available only when glazing is installed by a certified fabricator using manufacturer-approved sealants and framing components, closing a margin leak that previously went to lower-cost independent installers using substitute materials on large commercial contracts. Extended tiers typically add five to ten years of coverage beyond the standard warranty period, and developer feedback suggests this materially reduces perceived installation risk. Manufacturers report certified-installer programme revenue rising by roughly 22% among developers enrolled in extended warranty tiers compared to standard-warranty projects completed in prior years.
Market Impact: Grows certified-installer revenue b

Regional Coating Line Licensing for Local Fabricators

Rather than exporting finished coated glass across long distances, several manufacturers are licensing coating technology and equipment to regional fabricators in China, India, and Southeast Asia, capturing royalty and technical-support revenue while shortening delivery lead times for local developers who previously waited weeks for imported product to arrive on site. This lever extends manufacturer reach into markets where import costs and lead times were limiting competitiveness against lower-cost regional alternatives, adding roughly 9% margin per licensed line. Licensing revenue per facility remains modest individually but scales meaningfully as adoption grows.
Market Impact: Adds roughly 9 percent margin per l

Who Controls the Margin Pool

Five manufacturers hold a combined 42% of revenue on a consistent company-disclosed segment revenue basis, a moderate concentration level that leaves meaningful room for regional fabricators competing on local coating capacity and delivery speed rather than attempting to out-scale global leaders directly on manufacturing footprint alone across every market they serve, from tier-one metropolitan projects down to fast-growing secondary cities.
Current competitive activity centres on three fronts at once: electrochromic production capacity expansion racing to meet mainstream mid-rise demand across the region, certification and energy-modelling service bundling aimed at capturing more value per contract signed, and regional coating-line licensing extending manufacturer reach into fast-growing Asia-Pacific markets without the cost of new export capacity, a strategy several rivals are now evaluating closely as well.

Pressure is building steadily from Chinese fabricators including CSG Holding and Xinyi Glass moving up the value chain from commodity float glass toward certified coated and insulated glazing systems, a shift that could compress pricing meaningfully for mid-tier competitors across East Asia and South Asia fastest, where local manufacturing scale increasingly rivals established global suppliers on both cost and delivery lead time achieved on large multi-building contracts.
apac-commercial-glazing-market-company-positioning-matrix-1787302852693

Competitive Moat and Risk Dimensions

SAINT-GOBAIN S.A.

Moat: Global coating technology breadth

Saint-Gobain's coating research and manufacturing footprint spans more countries than most competitors, letting it supply consistent electrochromic and low-emissivity technology across multiple regional markets from local production. That breadth took decades of sustained investment to build and remains genuinely difficult for regional fabricators to replicate quickly.
SAINT-GOBAIN S.A.

Risk: Premium pricing under local pressure

Saint-Gobain prices toward the upper end of the market, which works well while certification and performance remain the deciding factor, but leaves exposure if Chinese fabricators achieve comparable coating quality at meaningfully lower price points across fast-growing secondary cities where price sensitivity runs highest among developers today.
AGC INC.

Moat: Vacuum-insulated glazing technical lead

AGC holds an early technical and manufacturing lead in vacuum-insulated glazing, a category still difficult for competitors to replicate at comparable cost and quality, giving it a genuine specification advantage on premium retrofit and new-build projects across Japan and the wider Asia-Pacific region overall, an advantage competitors have struggled to close.
AGC INC.

Risk: Narrower footprint outside East Asia

AGC's manufacturing and distribution footprint remains more concentrated in East Asia than global rivals like Saint-Gobain, creating an opening for competitors with broader regional coverage to win multinational developer accounts requiring consistent supply across several markets at once, particularly outside its core Japanese and broader East Asian home base.

Players Tracked

Prominent Players

Saint-Gobain S.A.
AGC Inc.
NSG Group (Pilkington)
Guardian Glass
Vitro Architectural Glass

Other Key Players

CSG Holding Co. Ltd.
Xinyi Glass Holdings Ltd.
Sisecam Group
Central Glass Co. Ltd.
Taiwan Glass Ind. Corp.
Euroglas GmbH
Schott AG
Sedak GmbH
Interpane Glas Industrie AG
Viracon (Apogee Enterprises)
Oldcastle BuildingEnvelope
YKK AP Inc.
Kawneer Company Inc.
Metaglas Inc.
China National Building Material Group

Recent Developments

FEBRUARY 2025

AGC expands vacuum-insulated glazing capacity in Japan

AGC announced a capacity expansion at its vacuum-insulated glazing production facility in Japan, aimed at meeting rising demand from premium office retrofit projects across the country and export orders from developers elsewhere in the Asia-Pacific region seeking early access to the technology before wider availability.
Signal: Signals manufacturers are betting vacuum-i
OCTOBER 2024

Saint-Gobain licenses coating technology to Indian fabricator

Saint-Gobain signed a technology licensing agreement with a major Indian glass fabricator, transferring low-emissivity coating capability to a domestic production line and shortening delivery lead times for developers previously dependent on imported coated glass from Europe or East Asia for every major commercial project across the country until recently.
Signal: Confirms global manufacturers now see loca
MAY 2025

CSG Holding acquires a regional curtain-wall fabricator

CSG Holding completed an acquisition of a mid-sized Southeast Asian curtain-wall fabrication company, expanding its direct project delivery capability beyond flat glass supply into full system integration and installation across several fast-growing Southeast Asian commercial construction markets currently under active development across the wider region.
Signal: Shows Chinese manufacturers moving deliber

Soda Ash, Coating Materials, and Energy

Soda ash and silica sand account for roughly 22% of unit cost of goods sold for base float glass, sourced primarily from Chinese, Turkish, and US suppliers, while specialty coating materials including silver, indium tin oxide, and electrochromic layer compounds add another 19% for premium glazing categories, sourced largely from specialty chemical suppliers concentrated in East Asia and Western Europe.
Natural gas price volatility tied to European energy market disruption in 2022 and 2023 pushed float glass furnace operating costs sharply higher across several European producers, and the IEA's energy market commentary noted glass manufacturing among the industrial sectors most exposed to sustained gas price volatility given the continuous, high-temperature nature of furnace operation that cannot easily pause during a sudden price spike without incurring real operational cost.

European manufacturers running gas-fired furnaces absorbed the energy cost spike directly into thinner margins during the disruption, while Asian competitors running coal or electricity-based furnace operations in China faced comparatively less volatility, giving them a temporary cost advantage over European rivals during that period. Smaller regional fabricators without long-term energy contracts remain the most exposed to any future volatility of this kind.
apac-commercial-glazing-market-cost-volatility-analysis-1787302852913

Multi-Year Energy Supply Contracts for Furnace Operations

Larger manufacturers are locking multi-year fixed-price energy supply agreements for their furnace operations, insulating margins from the kind of sudden gas price volatility that hit European producers hardest during the 2022 to 2023 disruption still referenced across the industry today by procurement and finance teams alike. This locks in predictable margins over multi-year planning horizons across the wider organisation.

Regional Coating Material Sourcing Diversification

Coating material buyers are qualifying suppliers across multiple regions rather than depending on a single source for silver and indium tin oxide compounds, reducing exposure to any single-country export restriction or price spike that could otherwise disrupt premium glazing production schedules across several major manufacturing facilities at once. This diversification effort spans production facilities across several countries and continents.

Furnace Fuel Flexibility Investment

Several manufacturers are investing in furnace technology capable of switching between natural gas and electricity depending on relative pricing, giving them flexibility to shift fuel sources during periods of elevated volatility rather than absorbing the full cost increase directly into margins, a capability increasingly valued by procurement teams. This flexibility paid off during a recent period of elevated pricing.

Portfolio Architecture for Margin Defence

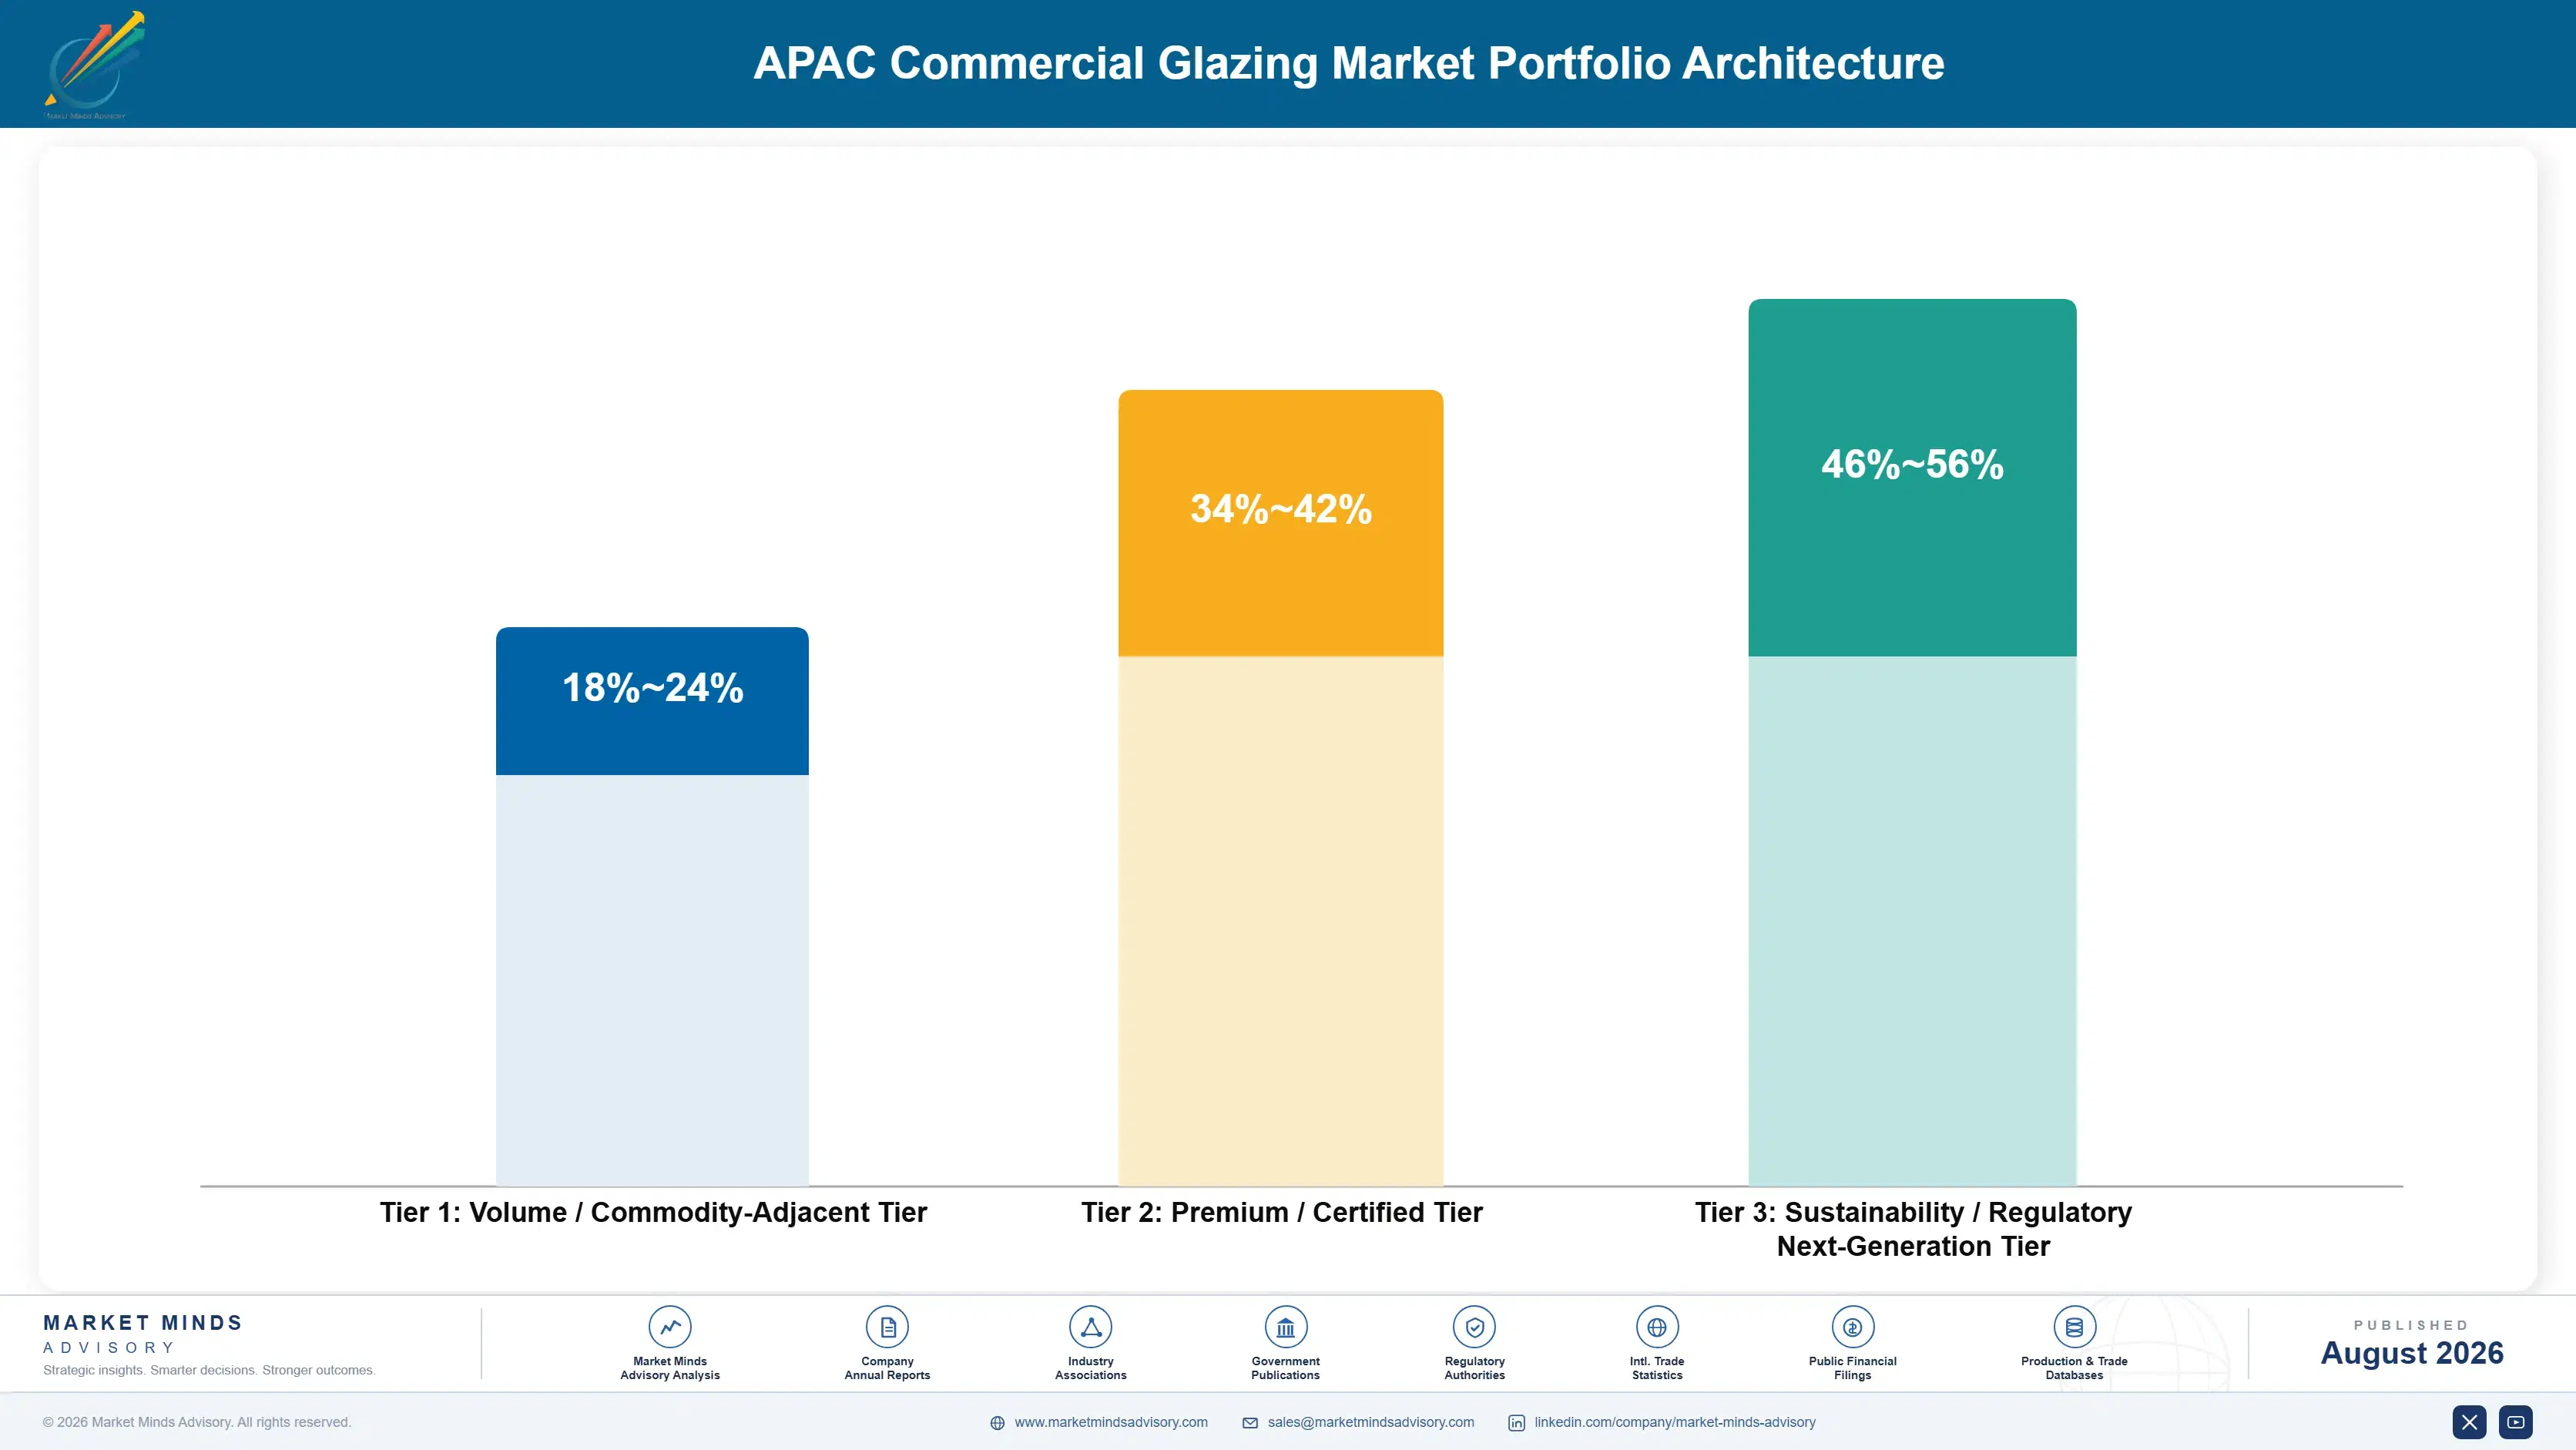
The portfolio splits into three tiers running from standard double-glazed float glass sold largely on price, through certified low-emissivity and triple-glazed units carrying energy code and green building certification credentials, up to next-generation electrochromic and vacuum-insulated systems aimed at flagship developments pursuing the highest available certification tiers across the region's most competitive leasing markets, with margin economics widening sharply as certification depth inc
Volume tier units still account for the largest unit shipment count overall but generate the thinnest margins of the three tiers by a wide margin, while certified premium units, though a smaller share of total square metres sold each year, generate a disproportionate share of category profit as developers pay up for certification credentials and warranty reliability on flagship projects across competitive submarkets where certification has become a genuine leasing differentiator.

The highest-value pools concentrate in premium office and hospitality development pursuing top-tier green building certification, where performance requirements run strictest and developers stay least price-sensitive of any segment, followed closely by institutional retrofit projects at aging commercial towers seeking certification upgrades ahead of tightening local emissions-performance mandates now taking effect.

Volume / Commodity-Adjacent Tier

Standard double-glazed float glass units sold largely on price into cost-sensitive commercial projects carrying minimal certification requirements attached to the contract, competing mainly on delivery speed and upfront cost. Margins stay thin here across nearly every regional market this year.
Gross Margin: 18-24%

Premium / Certified Tier

Low-emissivity coated and triple-glazed units carrying energy code and green building certification credentials, sold into developments pursuing leasing-grade certification status across competitive metropolitan office and retail submarkets. Margins improve meaningfully once certification credentials are attached to a project.
Gross Margin: 34-42%

Sustainability / Regulatory / Next-Generation Tier

Electrochromic and vacuum-insulated glazing systems sold into flagship developments pursuing top-tier certification and premium tenant differentiation ahead of most competing projects in the same submarket. Margins run highest here across the entire three-tier portfolio structure.
Gross Margin: 46-56%
apac-commercial-glazing-market-portfolio-architecture-1787302853418

Certification Renewal and Portfolio Upgrade Cycles

Demand behaves less like a one-time construction purchase and increasingly like a recurring portfolio upgrade cycle, since green building certification requires periodic recertification that pushes landlords toward glazing upgrades on a rolling schedule rather than a single decision made once at initial construction and never revisited again over a building's full multi-decade service life across a diversified commercial portfolio.
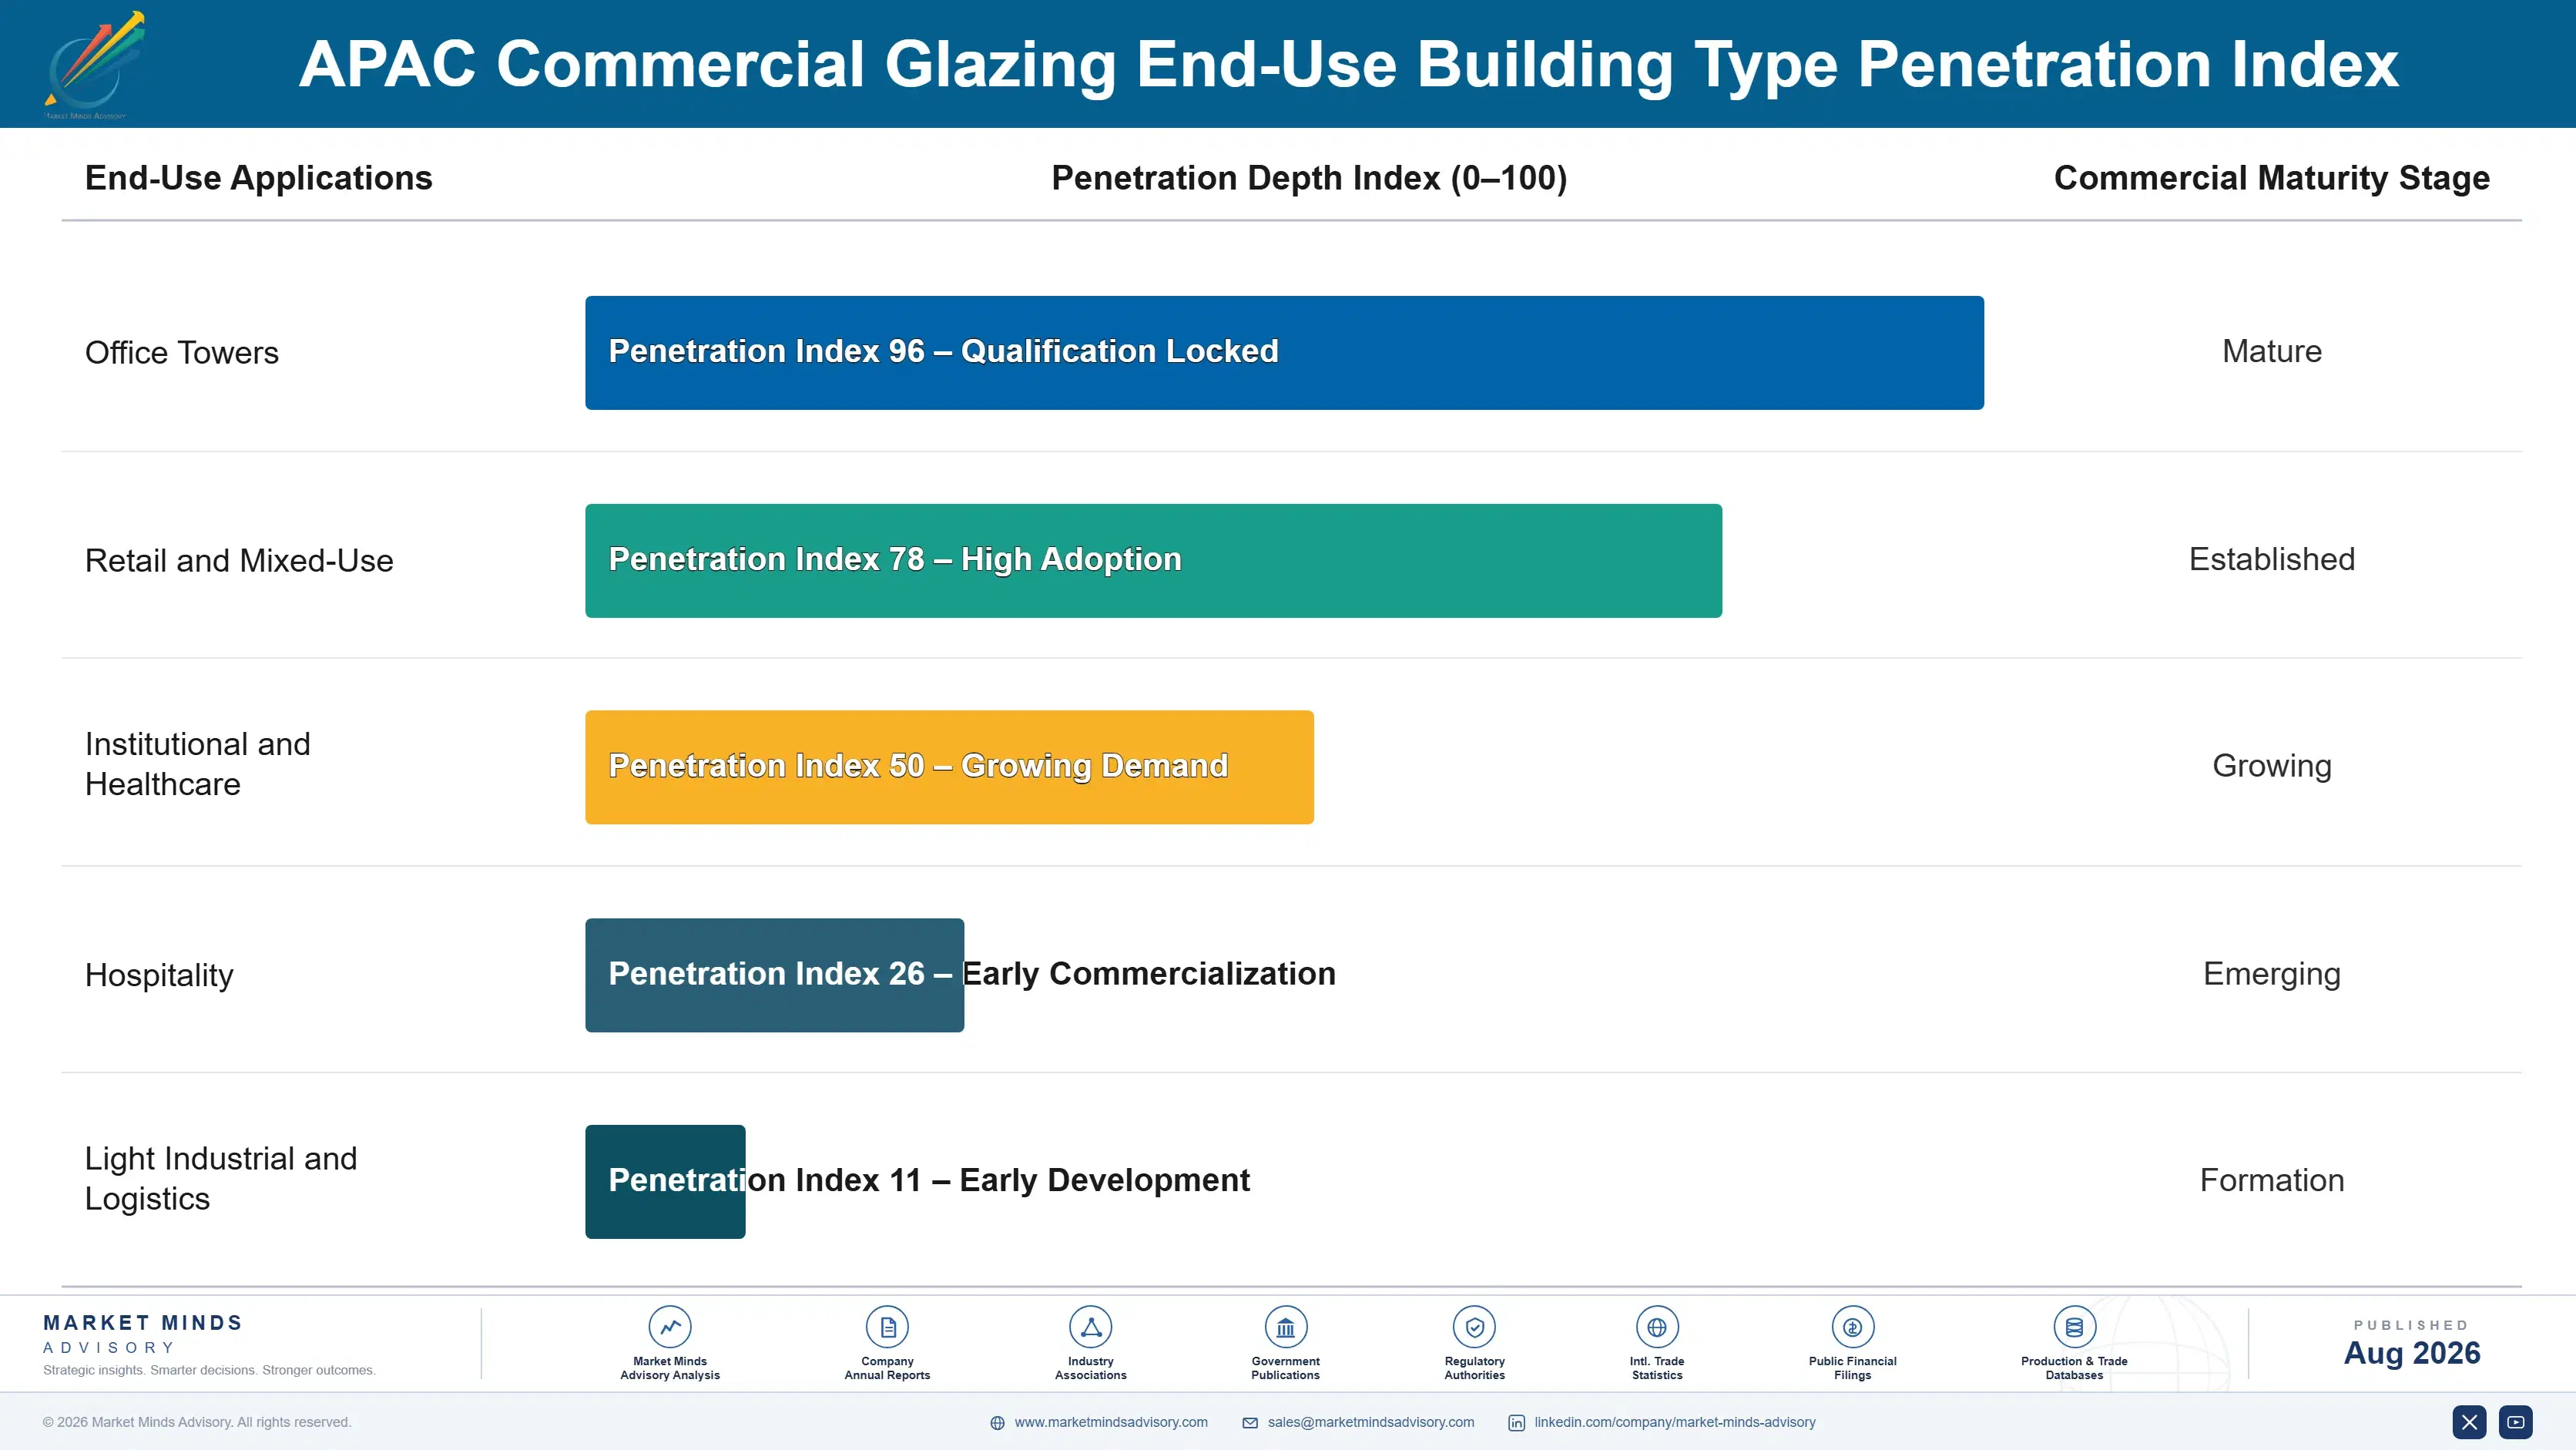
Adoption depth varies sharply by vertical: premium office and hospitality developers standardise on certified electrochromic and vacuum-insulated systems across an entire portfolio for consistent tenant marketing and certification renewal, while retail and light-industrial commercial buyers still specify standard glazing opportunistically based on project budget rather than pursuing portfolio-wide consistency deliberately across every asset they hold across a diversified regional portfolio today.

A generational shift is underway in the buyer profile itself, as sustainability officers and ESG-focused asset managers increasingly hold direct influence over glazing specification decisions previously left entirely to architects and construction cost estimators, reshaping which performance criteria matter most in the final purchasing decision made at each stage of a project from initial design through final tenant handover and every subsequent recertification cycle after that point.
apac-commercial-glazing-market-end-use-penetration-index-1787302853909

Where Specification Advantage Concentrates Next

These are among the four positions where our research anticipates prominent divergence between winners and laggards over the coming forecast period. Each is grounded in the demand model, the regulatory perimeter, and the announced capacity pipeline.
01 / CERTIFICATION BUNDLING STRATEGY

Energy modelling services beat glass price on flagship contracts

Developers pursuing green building certification increasingly select a glazing partner based on bundled energy modelling and certification documentation support rather than glass price alone, since certification directly affects achievable rental rates on flagship commercial projects across the region. Manufacturers that under-invested in certification support services are losing flagship contracts even where their base glass price runs lower than certified-service competitors. This dynamic will keep favouring Saint-Gobain, AGC, and other certification-first manufacturers over the next several forecast years across premium markets.
02 / ELECTROCHROMIC SCALING SPEED

Mid-market electrochromic adoption depends on continued cost declines

Electrochromic glazing's mainstream adoption curve is arriving faster than manufacturers originally planned, but further mid-market penetration depends on continued cost declines that only production scale can deliver across the wider industry over the next several years. Competitors without meaningful electrochromic capacity are ceding this fast-growing category entirely to the handful of manufacturers who invested early in production scale and control-system reliability. Expect electrochromic revenue to keep growing meaningfully faster than standard glazing sales through the back half of the forecast period ahead.
03 / REGIONAL LICENSING REACH

Coating technology licensing is reshaping who competes locally

Global manufacturers licensing coating technology to regional fabricators are effectively creating new certified local competitors while capturing royalty revenue themselves, a strategy that trades some direct market share for faster regional reach and shorter delivery lead times to customers across the region. This approach works well while licensees remain dependent on licensed technology, but it will gradually narrow the technical gap between global and regional suppliers over time. Expect licensing to keep expanding fastest across China, India, and Southeast Asia specifically over the coming several years.
04 / CODE ENFORCEMENT RISK

Secondary-city code enforcement gaps need faster verification tools

Uncertified glazing substitution after code approval in secondary cities represents a genuine performance and reputational risk that certified manufacturers cannot solve through pricing or marketing alone, since the root cause sits squarely in inspection capacity rather than manufacturer behaviour itself at the point of sale. Third-party post-installation verification pilots show real promise but need broader developer adoption to reach meaningful scale across the region. Manufacturers that support verification infrastructure now will be better positioned if a high-profile failure forces faster regulatory response later.

Engagement Snapshot From the Field

A live engagement with an industry participant carrying material or product regulatory and market exposure ahead of a defining policy shift, showing how our research translates into a defensible multi-year portfolio strategy.
MARKET MINDS ADVISORY · CLIENT ENGAGEMENT SUMMARY
APAC Commercial Glazing Producer Strategic Portfolio Review and Transition Roadmap 2026·Investment Scenario on APAC Commercial Glazing Exposure Evaluation 2025-26
CLIENT PROFILE
The client is a regional real estate investment trust operating fourteen commercial office towers across three Asia-Pacific markets, with a portfolio skewing toward buildings constructed between 2005 and 2015 before current energy codes took effect. Annual portfolio revenue of approximately $680 million (client-reported, unverified by MMA) makes it a mid-sized regional landlord facing mounting pressure from institutional tenants requiring certified building performance as a leasing condition.
STRATEGIC CHALLENGE
Several major tenants signalled they would not renew leases without meaningful progress toward green building certification, but the client's leadership was uncertain whether full facade replacement or a more targeted retrofit approach would deliver certification within their renovation budget and the tight timeline tenants were requesting for lease renewal decisions.
MMA APPROACH
MMA's team assessed each tower's existing glazing against current certification thresholds, then modelled electrochromic retrofit-film economics against full facade replacement costs building by building across the portfolio. The analysis incorporated tenant lease renewal timelines and certification body scoring weightings to prioritise which towers needed intervention first for maximum leasing impact.
KEY FINDINGS
  1. Four of fourteen towers could reach the certification threshold tenants required using retrofit film alone, avoiding a full facade replacement entirely at those specific properties.
  2. Retrofit programmes could be completed in under six months per tower, compared to eighteen months or more for full facade replacement projects across comparable buildings.
  3. Prioritising the three towers with the nearest lease renewal dates protected an estimated 60% of at-risk annual rental revenue within the first renovation phase alone.
  4. Certification upgrades increased achievable rental rates by a client-reported (unverified by MMA) margin sufficient to recover retrofit costs within a reasonable multi-year payback window.
CLIENT PROFILE
The client is a regional real estate investment trust operating fourteen commercial office towers across three Asia-Pacific markets, with a portfolio skewing toward buildings constructed between 2005 and 2015 before current energy codes took effect. Annual portfolio revenue of approximately $680 million (client-reported, unverified by MMA) makes it a mid-sized regional landlord facing mounting pressure from institutional tenants requiring certified building performance as a leasing condition.
STRATEGIC CHALLENGE
Several major tenants signalled they would not renew leases without meaningful progress toward green building certification, but the client's leadership was uncertain whether full facade replacement or a more targeted retrofit approach would deliver certification within their renovation budget and the tight timeline tenants were requesting for lease renewal decisions.
MMA APPROACH
MMA's team assessed each tower's existing glazing against current certification thresholds, then modelled electrochromic retrofit-film economics against full facade replacement costs building by building across the portfolio. The analysis incorporated tenant lease renewal timelines and certification body scoring weightings to prioritise which towers needed intervention first for maximum leasing impact.
KEY FINDINGS
  1. Four of fourteen towers could reach the certification threshold tenants required using retrofit film alone, avoiding a full facade replacement entirely at those specific properties.
  2. Retrofit programmes could be completed in under six months per tower, compared to eighteen months or more for full facade replacement projects across comparable buildings.
  3. Prioritising the three towers with the nearest lease renewal dates protected an estimated 60% of at-risk annual rental revenue within the first renovation phase alone.
  4. Certification upgrades increased achievable rental rates by a client-reported (unverified by MMA) margin sufficient to recover retrofit costs within a reasonable multi-year payback window.
RECOMMENDED STRATEGY
Phase 1: Phase 1 (Months 1-6): Complete retrofit film installation at the three towers with the nearest lease renewal deadlines to protect at-risk tenant revenue first. Phase 2: Phase 2 (Months 7-14): Extend retrofit programmes to the remaining eligible towers, sequencing by certification scoring impact and tenant renewal timing. Phase 3: Phase 3 (Months 15-24): Evaluate full facade replacement at the towers where retrofit alone could not reach the certification threshold tenants required.
OUTCOME
The client retained its three highest-priority tenants through lease renewal and reported (client-reported, unverified by MMA) a 15% increase in achievable rental rates across certified towers within the first year following the upgrade programme. Total capital outlay came in well under the full-portfolio replacement estimate by using retrofit film at ten of fourteen towers rather than complete facade replacement.

Frequently Asked Questions

Foundational context covering the market sizes, CAGR, scope, country, region and competition that inform every finding below. This section is provided to cover basics and most often pre-purchase conversations, answered from the MMA Primary Research Dataset.

What is the current size of the APAC Commercial Glazing Market?

The commercial glazing market reached an estimated $34.0 billion in 2025, based on MMA's primary research dataset and company-disclosed segment revenue across the five largest manufacturers tracked globally.

How large will the APAC Commercial Glazing Market be by 2036?

The market is projected to reach approximately $73.05 billion by 2036, roughly 2.0 times its 2026 value under MMA's base-case forecast scenario for the decade ahead.

What is the CAGR for the APAC Commercial Glazing Market 2026 to 2036?

The base-case compound annual growth rate is 7.2%, with a bull case near 8.4% and a bear case near 6.0% depending on construction financing and code enforcement timing.

Which segment is growing fastest?

Electrochromic (smart) glazing is the fastest-growing segment at a 13.4% CAGR, roughly 1.9 times the overall market rate, driven by falling unit costs and rapid mid-rise adoption.

Who are the major companies in the APAC Commercial Glazing Market?

Saint-Gobain, AGC, NSG Group (Pilkington), Guardian Glass, and Vitro Architectural Glass are the five largest suppliers by disclosed segment revenue, together holding a combined 42% share.

Which country is growing fastest?

India is the fastest-growing major market at an estimated 10.5% CAGR, driven primarily by commercial construction expansion and the Bureau of Energy Efficiency's Eco-Niwas Samhita building code.

Report Segmentation Architecture

The full report scope spans multiple orthogonal segmentation dimensions, with cross-tabulated demand data provided for each dimension pair. Coverage extends further to regional breakdowns, trend trajectories, and the competitive detail needed to support segment-level decision-making.

By Glazing Configuration and Technology

  • Single-Pane Glazing
  • Insulated (Double-Pane) Glazing
  • Triple-Pane Glazing
  • Vacuum-Insulated Glazing (VIG)
  • Electrochromic (Smart) Glazing
  • Switchable Privacy (SPD/PDLC) Glazing

By End-Use Building Type

  • Office Towers
  • Retail and Mixed-Use
  • Institutional and Healthcare
  • Hospitality
  • Light Industrial and Logistics

By Commercial Dimension

  • Direct Manufacturer Supply
  • Curtain-Wall System Integrator Channel
  • Retrofit and Renovation Contracts
  • Licensed Regional Fabrication

By Region

  • North America
  • Western Europe
  • East Asia
  • South Asia and Pacific
  • Latin America
  • Middle East and Africa
  • Eastern Europe

Scope, Methodology, and Coverage

Every figure in this report is reproducible from documented input assumptions. The scope below maps the historical period, the forecast horizon, the segmentation dimensions, and the countries covered, alongside the underlying primary and qualitative methodology.
Historical Period
2020 to 2025
Forecast Period
2026 to 2036
Base Year
2025 (USD billions; MMA Primary Research Dataset, August 2026)
Market Definition
The commercial glazing market covers architectural glass units, curtain-wall glazing systems, and window assemblies engineered for office, retail, institutional, and mixed-use commercial buildings, spanning single, double, triple, vacuum-insulated, electrochromic, and switchable-privacy configurations sold to developers, landlords, and system integrators. Residential window glazing, automotive glass, and interior partition glass are excluded from this scope.
Quantitative Units
USD billions (current prices); square metres shipped where disclosed
Segmentation Dimensions
By Glazing Configuration and Technology; By End-Use Building Type; By Commercial Dimension; By Region
Regions Covered
North America, Western Europe, East Asia, South Asia and Pacific, Latin America, Middle East and Africa, Eastern Europe
Countries Covered
USA, China, Germany, France, UK, Japan, South Korea, India, Australia, Canada, Brazil, Mexico, Indonesia, Vietnam, Thailand, Malaysia, UAE, Saudi Arabia, South Africa, Nigeria, Turkey, Poland, Netherlands, Italy, Spain, Sweden, Switzerland, Argentina, Colombia, Singapore, and additional markets relevant to this sector
Key Companies Profiled
Saint-Gobain S.A., AGC Inc., NSG Group (Pilkington), Guardian Glass, Vitro Architectural Glass, CSG Holding Co. Ltd., Xinyi Glass Holdings Ltd., Sisecam Group, Central Glass Co. Ltd., Taiwan Glass Ind. Corp., Euroglas GmbH, Schott AG, Sedak GmbH, Interpane Glas Industrie AG, Viracon (Apogee Enterprises), Oldcastle BuildingEnvelope, YKK AP Inc., Kawneer Company Inc., Metaglas Inc., China National Building Material Group
Quantitative Methodology
Primary survey, n=3,800 respondents, Q4 2025, six countries; demand-side model with trade association cross-validation
Qualitative Methodology
47 expert interviews, Q4 2025; applied to validate demand model assumptions, identify emerging dynamics, and assess competitive positioning
Report Format
PDF and XLSX data workbook (Word format preview document)
Publisher
Market Minds Advisory
Report Code
MMA-2026-CON-121
Published
August 2026
Contact
sales@marketmindsadvisory.com | www.marketmindsadvisory.com

Purchase the full APAC Commercial Glazing Market Report (2026 to 2036).

The full APAC Commercial Glazing Market report delivers detailed segmentation by glazing configuration, building type, and commercial channel across all seven world regions through 2036. It includes company-level competitive profiles for all twenty companies profiled, covering coating technology portfolios, capacity investments, and licensing activity underway. Regional chapters detail country-level code timelines, certification frameworks, and import dependence for each of the seven regions covered in the report. A dedicated input cost chapter tracks soda ash, coating material, and energy exposure alongside mitigation strategies used by leading manufacturers today.
Full seven-region data tables and CAGR breakdowns
Twenty-company competitive profiles and moat analysis
Building energy code and certification timeline tracker
Input cost exposure and mitigation playbook detailed
Segment-level growth and margin forecasts provided
Editable data appendix in spreadsheet format

Built For The People Who Decide

From boardroom strategy to bench-side execution, this report is read cover-to-cover by leaders shaping the next decade of their industry, turning demand scenarios, market dynamics and valuation benchmarks into decisions.
CXOs/ Presidents/ VPs/ Managers
M&A and Corporate Development
Strategy Teams and R&D Heads
Procurement and Product Directors
Regulatory and Compliance Leaders
Investor Relations and Equity Analysts