Market Minds Advisory
Anti-Drone Technology Market

Anti-Drone Technology Market: Anti-Drone Technology Market: Detection Systems, Cost Exchange and Legal Authority Limits, 2026 to 2036

Effectors cost roughly 84 times the craft they defeat, and about 62% of civil sites may detect but never interdict. Neither constraint is technical, and both of them decide procurement.

Lead Analyst

Published

September 2026

Make Smarter Decisions with Customized Research Insights

Request a free sample report and evaluate market opportunities, growth trends, and competitive dynamics relevant to your business needs.

2025 MARKET VALUE$3.8BMarket Size 2025
2036 FORECAST VALUE$17.2BBase Case , 2026 to 2036
CAGR 2026 TO 203614.6 %Bull 16.0% / Bear 13.2%
INCREMENTAL OPPORTUNITY$12.8BNet 10- year value creation
EXPANSION MULTIPLE3.91x2036 value over 2026 base
Strategic Levers
M&A Pipeline
Regional Outlook
Country Rankings
Competitive Intelligence
Segmental Deep-dive
Call-Us : 91 93563 13602

Executive Snapshot and Market Trajectory.

Two constraints govern this market and neither is technical. Effectors cost about 84 times the craft they defeat, which no defence budget sustains at volume. And in most jurisdictions only designated state agencies may interdict, so civil buyers purchase detection they cannot act on. Both facts predate any product.
Low-cost kinetic effectors grow at 21.9%, half again the market rate of 14.6%, entirely because the cost exchange became the binding problem rather than capability. Command and control integration grows at 18.4% on a related point: buyers already own sensors that do not talk to each other. North America holds 31% of system revenue on procurement scale rather than threat exposure, and India grows fastest at 19.6%.
Around 37% of incursions now involve craft carrying no radio control link, which degrades the radio frequency detection and mitigation that most installed systems were built around. Five suppliers hold 41% of system revenue, and procurement runs 17 months from requirement to award, which is slower than the threat changes. Specifications written around radio frequency threats reach award after the assumptions behind them have stopped holding. Buyers know the process is slower than the threat.
Market Definition
This market covers systems for detecting, identifying, and mitigating small uncrewed aircraft, including radar detection systems, radio frequency detection and direction finding, electro-optical and acoustic detection, low-cost kinetic and interceptor effectors, electronic and cyber mitigation systems, and command, control and integration software. It excludes air defence against crewed aircraft and larger missiles, uncrewed traffic management services, drone manufacturing, general perimeter security and video surveillance, and airspace regulatory services.
Base Year Value
$3.8B in 2025 (MMA Primary Research Dataset, September 2026)
Forecast Period
2026 to 2036, eleven discrete annual values
CAGR
14.6% base case. Bull 16.0%. Bear 13.2%.
Fastest Growth Segment
Low-Cost Kinetic And Interceptor Effectors: 21.9% CAGR
Fastest Growth Country
India: 19.6% CAGR
Fastest Growth Region
South Asia and Pacific: 16.6% CAGR
Largest Region
North America: 31% of 2025 global value
Market Leaders
DroneShield, Anduril, RTX, Leonardo, and Rafael Advanced Defense Systems lead the field. Source: MMA Primary Research Dataset, July 2026.
Primary Survey
n=3,800 procurement and R&D decision-makers, Q4 2025, six countries
Methodology
Demand-side build-up, cross-validated against public data, 47 expert interviews

Anti-Drone Technology Market Forecast Scenarios

antidrone-technology-market-size-forecast-scenario-1790010075444
Between 2020 and 2025 the threat outgrew the response and the market discovered its economics were wrong. Sustained conflict use demonstrated that inexpensive craft could be produced faster than any interceptor inventory could be replaced, and airports, prisons, and energy sites recorded incursions they could observe but not stop. Historical growth of 13.4% understates how much the requirement changed.
The base case at 14.6% rests on three mechanisms. Cost exchange is now the specification: buyers evaluate price per engagement rather than capability, which favours inexpensive effectors and drives the fastest growth here. Integration software sells because sites already own sensors that do not share a picture. And detection grows steadily in civil markets even where mitigation is legally unavailable, because the requirement to know is not conditional on the authority to act.
The bull case at 16.0% depends on civil interdiction authority widening beyond state agencies to airport and critical site operators, which would convert a large detection-only installed base into mitigation buyers. The bear case at 13.2% is procurement paralysis: cycles already run 17 months, autonomous threats keep invalidating radio frequency assumptions mid-process, and requirements are being rewritten more often than they are awarded.

Cost Exchange Decides Everything

The technical problem was largely solved years ago. Systems that detect, classify, and defeat small uncrewed aircraft exist and work. What remains unsolved is whether anybody can afford to use them repeatedly, and whether the organisation that owns the site is legally permitted to act at all. Both questions now shape procurement more than sensor performance does. Sensor performance settles fewer awards than it did five years ago.
TOP FIVE CONCENTRATION41%Share of system revenue held by the leading suppliers
COST EXCHANGE RATIO84xEffector cost measured against the craft it defeats
DETECTION ONLY DEPLOYMENTS62%Civil sites permitted to detect but never to interdict
AUTONOMOUS THREAT SHARE37%Incursions involving craft carrying no radio control link
AVERAGE SYSTEM PRICEUSD 1.4 millionDelivered price averaged across integrated detection and mitigation
PROCUREMENT CYCLE LENGTH17 monthsTypical interval from requirement definition to contract award
Cost exchange runs at roughly 84 to one. An adversary producing craft at low unit cost can exhaust an inventory of expensive effectors faster than it can be replenished, and defence planners worked that out watching sustained conflict rather than in a study. Buyers consequently specify price per engagement, which has made inexpensive effectors the fastest growing part of this market at 21.9%.
Legal authority is the quieter constraint and it caps a great deal of demand. In most jurisdictions only designated state agencies may interdict an aircraft, so airports, stadiums, and energy sites buy detection and then call somebody. Around 62% of civil deployments are detection only. Vendors selling mitigation into those accounts are selling something the customer cannot lawfully switch on.
"Site operators keep asking us which system is best and it is the wrong question. Most of them are not allowed to interdict anything, so the honest answer is that they are buying a very good witness. The interesting procurement conversations now are about who holds the authority and what an engagement costs, not about detection range."
Practice Director, Security Systems and Defence Technology · MMA Technology Practice · September 2026

Market Trends

Price Per Engagement Replaces Capability As Specification

An adversary producing craft cheaply can exhaust an expensive effector inventory faster than industry replenishes it, and the cost exchange runs at roughly 84 to one. Buyers responded by writing price per engagement into requirements rather than detection range or defeat probability alone. Low-cost effectors grow at 21.9% on that change. Suppliers whose products were designed around exquisite performance find themselves competing on a dimension they never optimised for, and adapting means accepting lower unit prices on purpose. Volume rather than margin per unit is the position worth holding, which is an uncomfortable conclusion for established defence engineering.
Market Impact: Country grows at 19.6%

Autonomous Craft Undermine Radio Frequency Approaches

Around 37% of incursions now involve craft with no radio control link to detect, direction find, or disrupt, which removes the assumption most installed systems were designed around. Radio frequency detection consequently grows at only 9.4%, the slowest segment here, while radar and electro-optical approaches take its place. Sites that invested heavily in radio frequency coverage face replacement rather than upgrade. That obsolescence is arriving faster than the 17 month procurement cycle can respond to it. Sites that invested heavily in radio frequency coverage face replacement rather than upgrade, and the budget for that has generally not been approved.
Market Impact: Segment grows at 18.4%

Market Opportunities and Growth Drivers

Border And Infrastructure Incursions Force State Procurement

Sustained incursions over borders, energy infrastructure, and military installations have moved counter-drone capability from a discretionary programme to a required one across several governments, and requirements written after an incident move faster than routine procurement. Indian growth of 19.6% leads every country covered, driven by persistent border incursions and a domestic industrialisation programme running alongside the procurement. Gulf energy infrastructure protection accounts for much of the demand in its own region. Requirements written immediately after an incident move considerably faster than routine defence procurement ever does, and suppliers positioned beforehand capture most of that spending.
Market Impact: Caps 62% of civil deployments

Sensor Fragmentation Creates An Integration Purchase

Sites that bought radar, radio frequency, and optical systems separately across several years own equipment that produces three pictures rather than one, and no operator can reconcile them under time pressure. Command and control integration grows at 18.4% as a distinct purchase on that basis. It also positions the integrating vendor to influence every subsequent sensor decision, which is worth considerably more than the software itself and is understood by everybody bidding. Operators reconciling three consoles under time pressure make errors nobody can defend afterwards, which is the argument that actually sells this layer.
Market Impact: Cycles run 17 months long

Market Restraints and Challenges

Interdiction Authority Sits With State Agencies Alone

Around 62% of civil deployments are detection only, and the root cause is legal rather than commercial: in most jurisdictions only designated state agencies may interfere with an aircraft in flight, whatever it is. Commercially this caps the addressable value at a site to detection and reporting, however capable the mitigation available. Suppliers respond by pricing detection as a standalone product, by building handover into state agency workflows, and by supporting authority extension where legislatures are considering it. Suppliers quoting defeat capability into those accounts are pricing something the customer cannot switch on.
Market Impact: Cost exchange runs 84 to one

Procurement Cycles Outlast The Threat They Specify

Requirements take about 17 months from definition to award, and the root cause is that counter-drone systems are procured through defence and security processes designed for capital equipment with decade-long lifecycles. Commercially this means specifications written around radio frequency threats are awarded after autonomous craft have made them partly obsolete. Suppliers respond with modular architectures that accept new sensors, software-defined capability that updates without recompeting, and framework agreements that avoid restarting the cycle. Buyers know the process is too slow and reward architectures that adapt without a recompetition. Nobody can afford to restart these.
Market Impact: Affects 37% of incursions
4 additional market trends, 3 additional growth drivers, and 2 additional restraints and challenges are covered in the full report. Contact sales@marketmindsadvisory.com to access the complete intelligence.

Segment CAGR and Growth Architecture

Segmentation follows system function. Six categories cover the market: radar detection systems, radio frequency detection and direction finding, electro-optical and acoustic detection, low-cost kinetic and interceptor effectors, electronic and cyber mitigation systems, and command, control and integration software. Installation, training, and sustainment are counted within the function they support. Consumable effector resupply sits within its own function.
antidrone-technology-market-market-share-analysis-1790010076007

Low-Cost Kinetic And Interceptor Effectors

Low-cost effectors grow at 21.9%, half again the market rate of 14.6%, because the cost exchange at roughly 84 to one made price per engagement the specification rather than a footnote in it. An adversary producing craft cheaply exhausts expensive inventory faster than industry replenishes it, and planners reached that conclusion by observation rather than analysis. Suppliers built around exquisite performance now compete on a dimension they never optimised for, and following the market means accepting lower unit prices deliberately. Volume rather than margin per unit is the position worth holding here. Anything expended recurs with use rather than with time, which is a revenue shape sensors never produce. Suppliers holding production capture that.
CAGR 21.9%

Command, Control And Integration Software

Integration software grows at 18.4% because sites bought radar, radio frequency, and optical sensors separately over several years and now own equipment producing three inconsistent pictures. No operator reconciles those under time pressure, so the integration layer became a purchase in its own right rather than something bundled with a sensor. Commercially it is the strongest position available here: the integrating vendor influences every subsequent sensor decision, is difficult to displace once operational procedures are built around it, and carries none of the effector cost exchange problem at all. Displacing an incumbent means retraining operators and rewriting procedures under scrutiny, which few sites will contemplate voluntarily. It also carries none of the effector cost exposure.
CAGR 18.4%
Full segment breakdown across 6 segments available in the complete report.

Regional Architecture and Country Demand Map

Regional shares follow threat exposure and defence procurement scale rather than economic weight, and the two rarely coincide. Four regions sit outside the standard bands, with the reason named in each paragraph below and summarised for operator review. Visibility of procurement varies enormously between them as well.

North America

Procurement scale rather than threat exposure explains the leading position, since defence and homeland security budgets fund programmes at a size no other region matches. Installation protection, border monitoring, and airport deployments account for most volume. Interdiction authority sits with a small number of federal agencies, so civil sites here buy detection and hand over, exactly as elsewhere. Growth of 14.0% is close to the world rate. Cost exchange has become an explicit requirement line in solicitations rather than an informal preference among evaluators. Homeland security and federal facility programmes account for a growing share, procured separately from military installation protection and through processes that move at a different pace entirely.
Share: 31% | CAGR: 14.0% (2026 to 2036)

Western Europe

Airport disruption incidents drove the first wave of civil procurement, and military installation protection has driven the second, with several national programmes running concurrently across France, Germany, and the United Kingdom. Interdiction authority is tightly held by police and military agencies, which caps what airports and stadiums can purchase. Growth of 13.1% is the slowest of the seven regions. European suppliers hold an unusually strong position here, and several national programmes favour domestic industrial participation as an explicit award criterion. Cost exchange has entered several national requirements as an explicit criterion, following operational experience shared across the region rather than any independent domestic analysis. Domestic industrial participation is an explicit award criterion in several national programmes.
Share: 22% | CAGR: 13.1% (2026 to 2036)
Regional intelligence for 5 additional markets available in the complete report: East Asia, South Asia and Pacific, Middle East and Africa, Eastern Europe, Latin America. Contact sales@marketmindsadvisory.com.
antidrone-technology-market-country-cagr-analysis-1790010076549

Where Suppliers Build Real Position

Four commercial moves separate suppliers growing with this market from those selling capability against requirements that changed underneath them. Each accepts that cost per engagement and legal authority now decide awards, and that neither is a problem better sensors will solve for anybody. Better sensors solve neither problem for anybody selling into this market.

Compete On Cost Per Engagement Deliberately

Cost exchange at roughly 84 to one made price per engagement an explicit requirement line rather than an evaluator preference, and suppliers optimised for exquisite performance are competing on ground they never chose. Those who built deliberately cheap effectors win 2.9 times more volume awards, at unit prices they would once have refused. It is a decision to accept lower margin per unit for volume that recurs, which is a different business from selling a system once. Anything expended recurs with use rather than with time, which sensor revenue never does.
Market Impact: Wins 2.9 times more awards for volume production

Sell Detection Where Interdiction Is Unlawful

Around 62% of civil deployments are detection only because the site operator has no authority to act, and suppliers who bundle mitigation into those proposals are quoting capability the customer cannot switch on. Packaging detection and state agency handover as a complete product raises civil win rates 34 to 47 points against suppliers leading with defeat capability. It also builds the relationship that converts if interdiction authority ever widens beyond designated agencies. It also holds the relationship if interdiction authority ever widens beyond designated agencies, which several legislatures are considering.
Market Impact: Raises civil win rates 34 to 47 points

Own The Integration Layer Above The Sensors

Sites owning radar, radio frequency, and optical systems bought years apart hold three pictures and no coherent one, and integration grew into a purchase of its own at 18.4%. The vendor holding that layer influences every subsequent sensor decision, is hard to displace once procedures are written around it, and carries none of the effector cost exchange exposure. It is the strongest commercial position available in this market and considerably cheaper to build than a sensor line. Displacing an incumbent means retraining operators and rewriting procedures under scrutiny, which sites avoid.
Market Impact: Integration software grows at 18.4% a year now

Build Modular Architectures Against Slow Procurement

Cycles run 17 months while roughly 37% of incursions now involve craft that invalidate radio frequency assumptions, so specifications are frequently obsolete before award. Suppliers offering modular sensor acceptance and software-defined capability updates avoid recompetition entirely and report contract extension rates 2.3 times those of fixed configuration competitors. Buyers know their process is too slow and reward architectures that let them adapt without restarting a procurement they cannot afford to repeat. Buyers know their own process is too slow and reward architectures that let them adapt without restarting anything. Nobody can afford that.
Market Impact: Contract extensions run 2.3 times more often overall

Who Controls the Margin Pool

Concentration is moderate. Five suppliers hold 41% of system revenue, measured consistently on that basis across all participants, and the field mixes large defence primes with specialists founded specifically for this problem. The specialists moved faster on cost exchange and integration, while primes hold the programme relationships and the qualification credentials that large awards require.
Competition currently turns on three things: demonstrated cost per engagement, which now appears as an explicit requirement line; integration across sensors a site already owns; and modular architectures that survive a 17 month procurement without arriving obsolete. Detection range and defeat probability alone decide considerably less than they did five years ago. Qualification credentials gate participation in the largest programmes regardless of any of that, and obtaining them takes years of documentation that specialists must fund from smaller revenue bases.

Pressure comes from two directions. Low-cost effector entrants, several with conflict-derived experience, compete at unit prices established suppliers find uncomfortable. Meanwhile radio frequency specialists face an installed base losing relevance as autonomous craft spread. Rankings will shift toward suppliers holding integration and cheap effectors, since those positions match how requirements are now written. Sensor-only suppliers hold the weakest position here.
antidrone-technology-market-company-positioning-matrix-1790010077079

Competitive Moat and Risk Dimensions

ANDURIL

Moat: Integration And Software Position

A command and control layer that accepts sensors from many suppliers puts the company above the hardware competition rather than inside it, and once operational procedures are written around that layer it is difficult to remove without retraining operators. Every subsequent sensor decision at the site is then influenced from a position competitors cannot reach.
ANDURIL

Risk: Programme Concentration And Scrutiny

Revenue concentrated in a small number of large government programmes rises and falls with decisions the company does not control, and the visibility that attracts those awards also attracts oversight attention that slower competitors avoid. A single programme restructuring removes more revenue than years of commercial deployment would replace.
DRONESHIELD

Moat: Deployed Base And Responsiveness

A wide deployed base across civil and military users generates operational feedback that shortens the loop between a new threat behaviour and a product response, which matters in a market where the threat changes faster than procurement cycles. Smaller competitors lack the exposure and larger primes lack the release cadence to match it.
DRONESHIELD

Risk: Radio Frequency Portfolio Exposure

Products built substantially around radio frequency detection and disruption face roughly 37% of incursions carrying no link to detect, and that proportion continues rising as autonomous craft spread. Rebuilding around radar and optical approaches means competing against suppliers whose entire engineering history sits in those disciplines.

Players Tracked

Prominent Players

DroneShield
Anduril
RTX
Leonardo
Rafael Advanced Defense Systems

Other Key Players

Dedrone
Fortem Technologies
Thales
Hensoldt
Elbit Systems
Aselsan
MARSS
D-Fend Solutions
Robin Radar Systems
Blighter Surveillance Systems
QinetiQ
SRC
Teledyne FLIR
Echodyne
Northrop Grumman

Recent Developments

JANUARY 2026

Anduril Receives Counter-Drone Award Across Military Installation Programme

Anduril received an award decision covering counter-drone capability across a military installation programme, with the command and control layer specified to accept sensors from other suppliers already deployed at several of the sites involved. Existing equipment was retained rather than replaced, lowering programme cost considerably.
Signal: Buyers are specifying integration above sensors, which places software vendors ahead of hardware suppliers commercially. Hardware follows software now.
SEPTEMBER 2025

DroneShield Expands Australian Manufacturing Capacity For Detection Systems

DroneShield completed an organic capacity expansion at its Australian manufacturing operations, funded internally with no partner or acquisition involved, after order volumes exceeded assembly throughput across several consecutive quarters. The company said order books had run ahead of reported revenue for some time. Capacity rather than demand was the constraint.
Signal: Assembly capacity rather than demand had limited deliveries, which indicates order books ran ahead of reported revenue.
MAY 2025

RTX Signs Supply Agreement For Low-Cost Interceptor Production Volume

RTX entered a supply agreement covering low-cost interceptor production at volume, addressing a cost exchange ratio that procurement officials had increasingly cited as the limiting factor on sustained counter-drone operations rather than capability. Unit pricing sits well below what the company would have quoted for comparable capability three years earlier.
Signal: Even established primes are now competing at unit prices they would previously have declined to quote.

What These Systems Cost To Build

Three input groups dominate system cost. Radar and radio frequency front-end components, including gallium nitride devices and signal processing semiconductors, run 28% to 36% of cost of goods sold, sourced from a small number of suppliers in the United States, Europe, and Taiwan. Effector hardware, propulsion, and airframes take 22% to 30%. Software, integration, and qualification add 20% to 28%, higher than most hardware categories because defence qualification is expensive.
Gallium nitride device supply tightened through 2024 and 2025 as defence and communications demand rose together, and several suppliers described extended lead times in their annual reports for those years. SEMI equipment data indicated capacity additions arriving behind requirement. Radar-heavy suppliers felt it most, and the shortage arrived precisely as buyers were shifting away from radio frequency approaches toward radar, which compounded the timing considerably.

The competitive disadvantage mechanism runs through qualification and programme access rather than component cost. A supplier without defence qualification credentials cannot bid large programmes at any price, and obtaining them takes years of documentation and demonstration. Exposure varies sharply by supplier type: primes hold qualification and struggle on unit cost, while specialists hold cost advantage and must fund qualification from smaller revenue bases.
antidrone-technology-market-cost-volatility-analysis-1790010077274

Design Effectors For Cost Rather Than Performance Margin

Cost exchange at roughly 84 to one made unit price the specification, and performance margin beyond what defeats the actual threat adds cost that loses awards. Designing deliberately toward a price point, then proving sufficiency, is the opposite of established defence engineering practice and is now what volume awards reward across most programmes. Volume awards reward it consistently.

Secure Long-Term Gallium Nitride Component Agreements

Radar front-end components come from a small supplier base serving defence and communications demand simultaneously, and allocation follows relationship and committed volume rather than order date. Suppliers holding long-term agreements maintain delivery through shortages that leave competitors quoting lead times buyers will not accept in a threat-driven procurement. Threat-driven procurement will not wait for lead times.

Share Qualification Evidence Across Product Families

Defence qualification is expensive, slow, and repeated needlessly whenever product families are engineered independently of one another. Common processing, power, and enclosure platforms across radar, optical, and effector lines let one qualification effort support several products, which matters most for specialists funding that work from smaller revenue bases. Primes carry that cost more comfortably than anybody else.

Portfolio Architecture for Margin Defence

Margin follows position relative to the cost exchange problem. Effectors are now specified on unit price, which compresses margin deliberately and rewards volume instead. Sensors earn better, particularly radar and optical lines gaining share as radio frequency assumptions weaken. Integration software earns most by a wide distance, since it carries no effector cost exposure and holds the site relationship. That hierarchy runs opposite to how defence hardware margin usually behaves.
The tension between volume and premium runs through who is allowed to act. Civil sites that may only detect buy sensors and reporting, generate substantial unit volume, and compare on price. State agencies with interdiction authority buy complete engagement chains, pay properly, and stay with qualified suppliers for programme lifetimes. Serving both requires qualification credentials that civil-only suppliers never obtain.

High-value pools concentrate where an incursion carries consequence: military installations, energy infrastructure under sustained threat, and border monitoring programmes. None of these buyers is price led on sensors, though all of them are on effectors. Where the requirement is a single civil site with no interdiction authority, the purchase is a sensor and gets priced as one by everybody bidding. Everybody bidding prices it that way.

Volume / Commodity-Adjacent

Low-cost effectors and basic detection sold on unit price, where cost exchange requirements compress margin deliberately and volume replaces it. The twelve-point range reflects manufacturing scale and component agreements rather than any capability difference between suppliers.
Gross Margin: 22% to 34%

Premium / Certified

Qualified radar and optical sensing for defence and critical infrastructure programmes where qualification credentials gate participation entirely. The twelve-point range separates suppliers holding current defence qualification from those bidding through partners who already hold it.
Gross Margin: 38% to 50%

Sustainability / Regulatory / Next-Generation

Command, control, and integration software carrying no effector cost exposure and holding the site relationship above every sensor decision. The sixteen-point range reflects how deeply operational procedures are built around each vendor's layer at the sites concerned.
Gross Margin: 58% to 74%
antidrone-technology-market-portfolio-architecture-1790010077778

High-value Sub-segments and Strategic Watch-out

Integration And Control Software

Highest value in the market, growing at 18.4% and holding the position above every subsequent sensor decision at a site. No cost exchange exposure attaches. The sixteen-point range reflects how deeply operational procedures are written around each vendor's layer. Displacement requires retraining operators entirely. Nothing holds a site as firmly.
Gross Margin: 60% to 76%

Radar And Optical Detection

Volume core gaining share as autonomous craft weaken radio frequency assumptions across roughly 37% of incursions. Qualification credentials gate participation in the largest programmes. The twelve-point range separates qualified defence suppliers from those bidding through partners. Radio frequency share is moving here permanently. Programme access decides most large awards.
Gross Margin: 40% to 52%

Low-Cost Effector Production

Fastest growth at 21.9% with margin deliberately compressed, since cost exchange made unit price the specification rather than performance. Volume replaces margin here. The twelve-point range reflects manufacturing scale and component supply agreements alone. Revenue recurs with use rather than time. Volume replaces margin. Production capacity is the binding constraint.
Gross Margin: 24% to 36%

Radio Frequency Detection Lines

The strategic watch-out. Roughly 37% of incursions carry no link to detect, the proportion keeps rising, and installed bases face replacement rather than upgrade. The twelve-point range reflects how far each supplier has already diversified away from the approach. Upgrade paths rarely exist for these installations.
Gross Margin: 26% to 38%

How This Revenue Repeats

Systems are bought once and sustained for years, which historically made this capital equipment revenue with a long tail. Effectors changed that, because anything expended recurs with use rather than with time, and a site under sustained threat consumes inventory continuously. Suppliers holding effector production have a consumable revenue shape that sensor-only competitors cannot manufacture, and it is worth accepting compressed unit margin to obtain.
Attachment depth follows the integration layer and the qualification, not the sensor. A site whose operating procedures, training, and handover arrangements are built around one control layer will not change it without retraining operators and rewriting procedures under scrutiny. A site running a standalone detector has no attachment at all and replaces it on price at the next refresh, which describes most civil deployments today.

The buyer has shifted from security management toward defence procurement and, in civil markets, toward legal and regulatory functions. Airport security managers once selected detection systems on performance. Interdiction authority questions now involve legal counsel before any purchase proceeds, and defence programmes specify cost per engagement through processes security managers never touched. Suppliers selling detection range are addressing a participant who no longer decides alone.
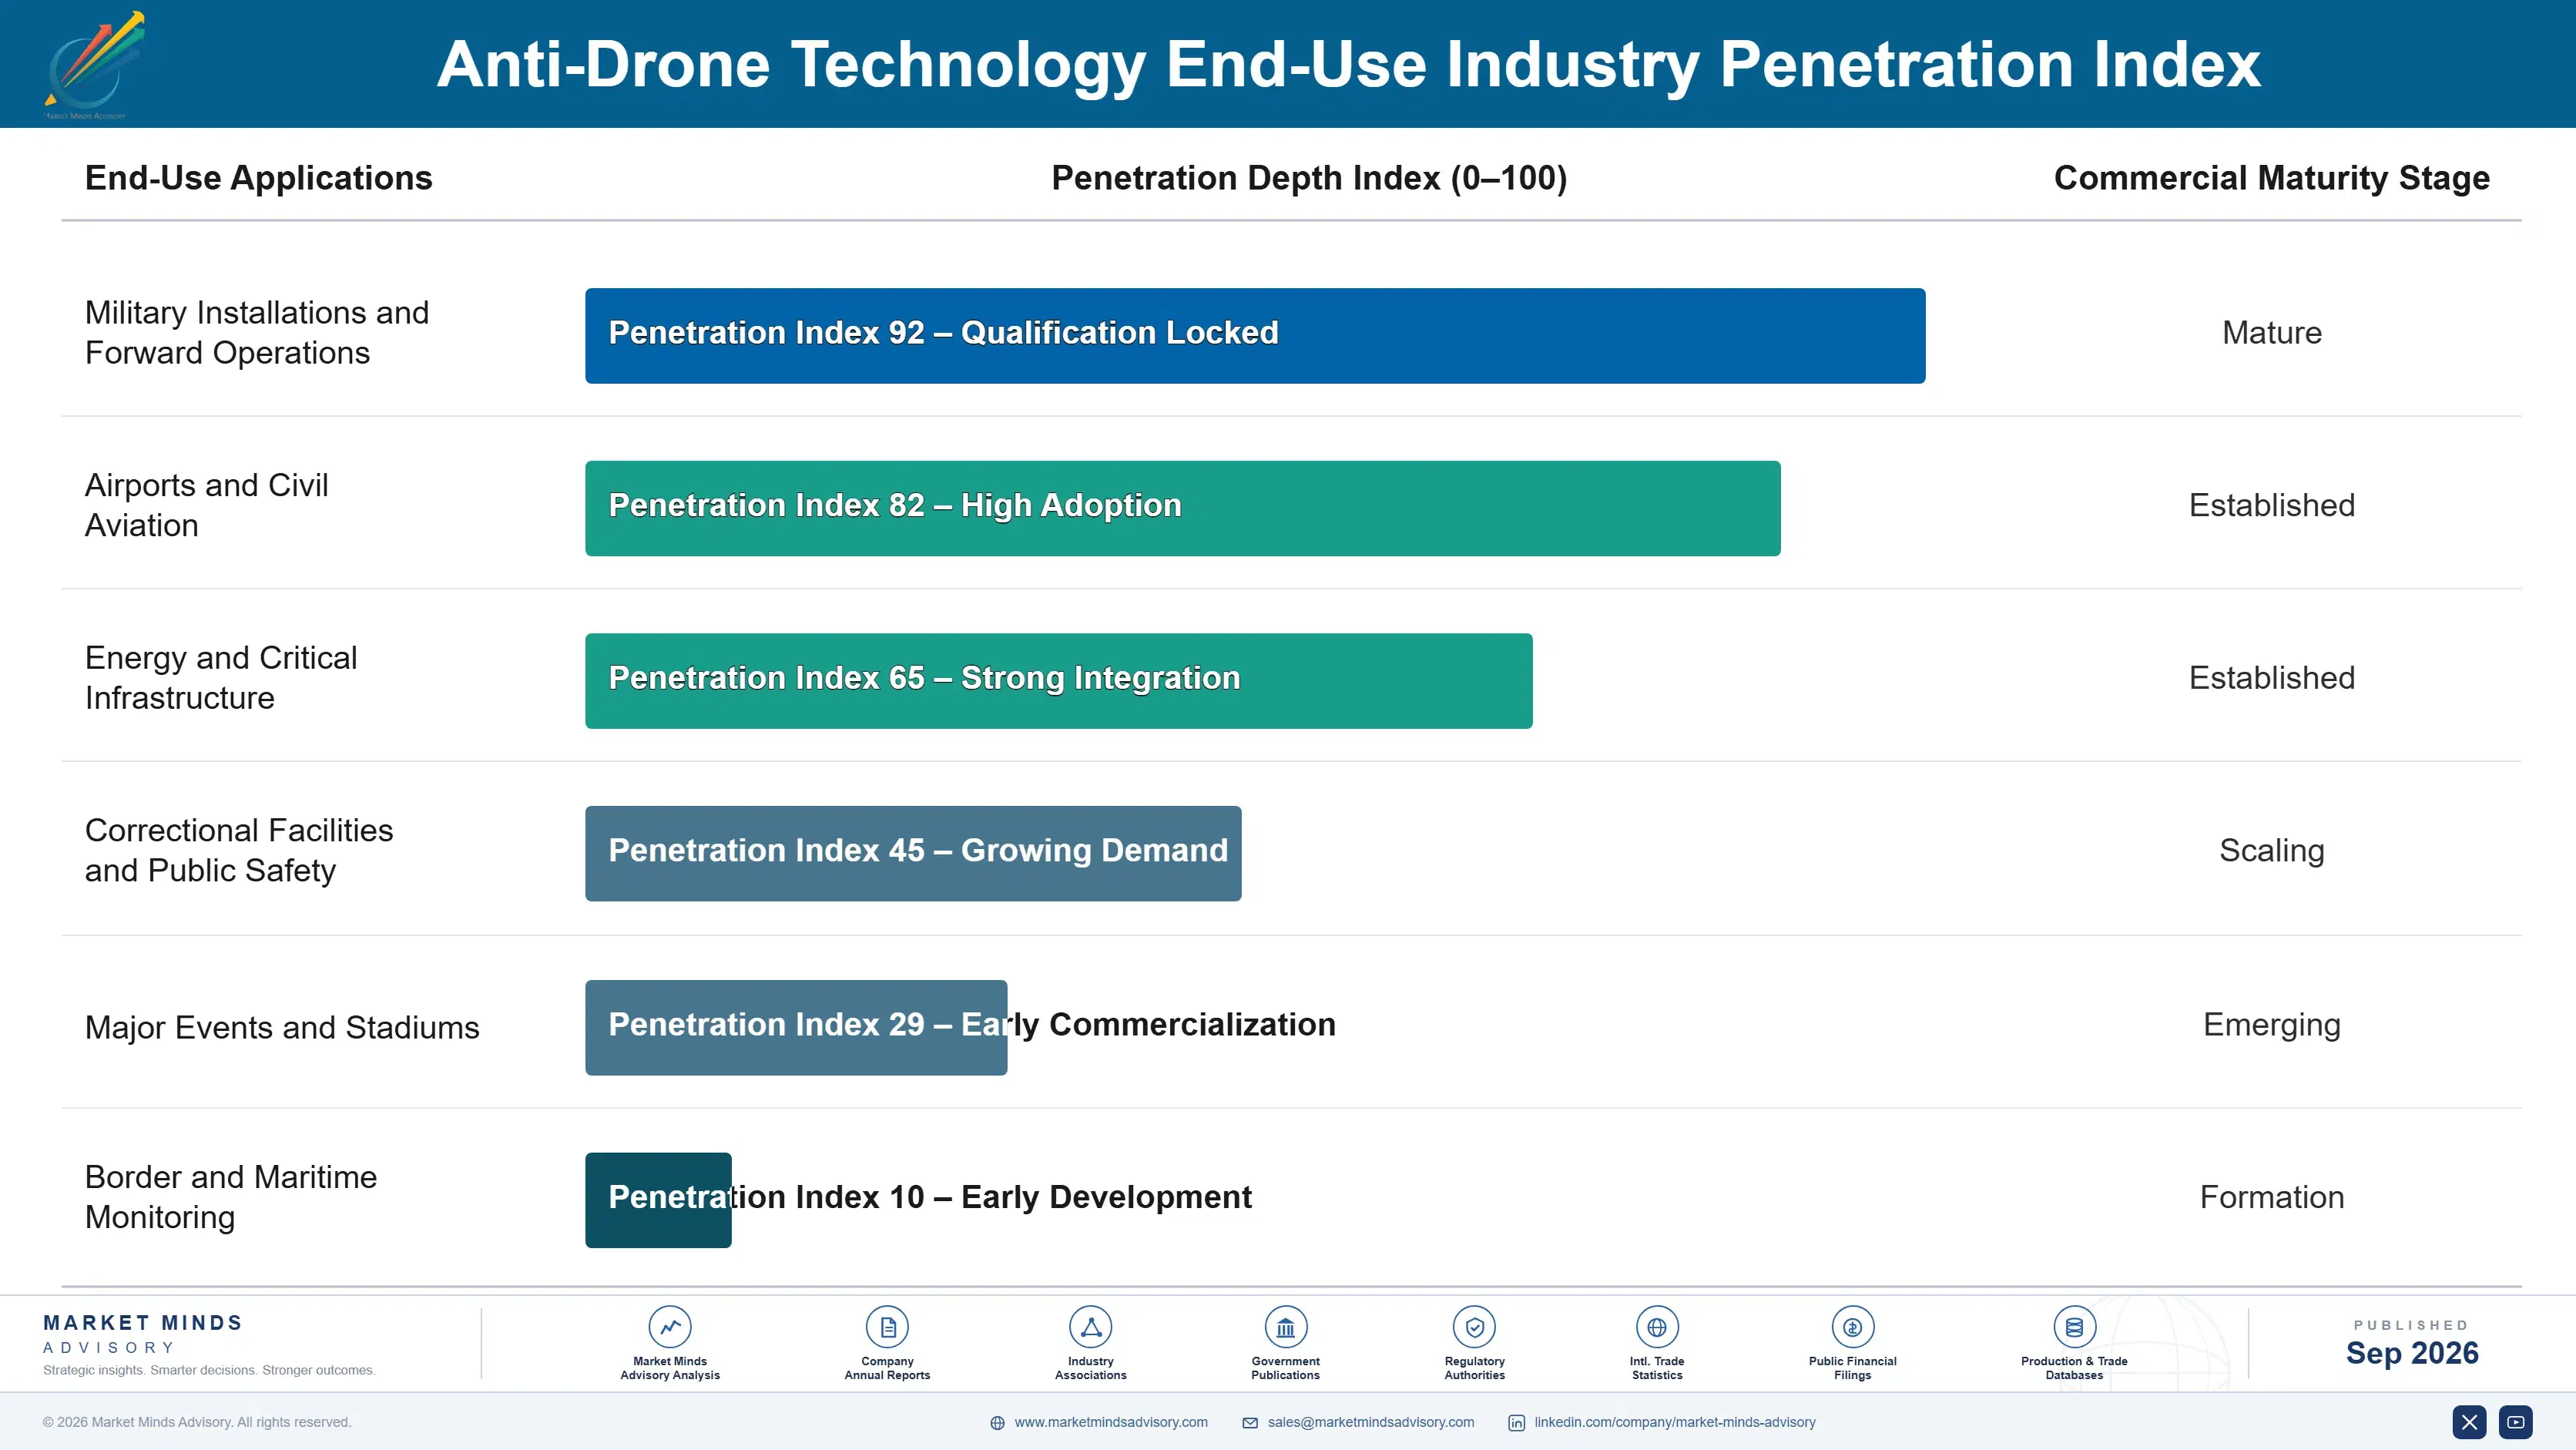
antidrone-technology-market-end-use-penetration-index-1790010078269

Where This Market Rewards

These are among the four positions where our research anticipates prominent divergence between winners and laggards over the coming forecast period. Each is grounded in the demand model, the regulatory perimeter, and the announced capacity pipeline.
01 / COST EXCHANGE POSITIONING

Cheap effectors beat excellent ones now

An adversary producing craft cheaply exhausts expensive inventory faster than industry replaces it, and the exchange runs at roughly 84 to one across most engagements observed. Suppliers building deliberately inexpensive effectors win 2.9 times more volume awards at unit prices established primes would once have declined outright. It trades margin per unit for revenue that recurs with use, which is a genuinely different business model, since anything expended recurs with use rather than with the calendar, and a site under sustained threat consumes inventory continuously.
02 / AUTHORITY AWARE SELLING

Most civil buyers cannot lawfully act

Around 62% of civil deployments are detection only, because in most jurisdictions only designated state agencies may interfere with an aircraft in flight whatever it is doing. Suppliers packaging detection and agency handover as a complete product raise civil win rates 34 to 47 points over those leading with defeat capability the customer cannot use. It also holds the relationship if interdiction authority ever widens, which several legislatures are now actively considering, and the detection relationship is what converts if they act.
03 / INTEGRATION LAYER OWNERSHIP

Sit above the sensors, not among them

Sites holding radar, radio frequency, and optical systems bought years apart own three pictures and no coherent one, and integration became a separate purchase growing at 18.4% because of it. The vendor holding that layer influences every later sensor decision and carries no effector cost exposure whatever. It is the strongest position in this market and considerably cheaper to build than any sensor line, and displacing an incumbent means rewriting operational procedure under scrutiny, which few sites will contemplate voluntarily at all.
04 / MODULARITY AGAINST PROCUREMENT

Specifications age faster than awards arrive

Procurement runs about 17 months while roughly 37% of incursions now involve craft that invalidate the radio frequency assumptions many specifications were written around. Suppliers offering modular sensor acceptance and software-defined updates report contract extension rates 2.3 times those of fixed configurations. Buyers know their own process is too slow and reward architectures that adapt without forcing a recompetition nobody can afford, which is the practical value of modularity here, and buyers reward it because they cannot fix the process itself.

Engagement Snapshot From the Field

A live engagement with an industry participant carrying material or product regulatory and market exposure ahead of a defining policy shift, showing how our research translates into a defensible multi-year portfolio strategy.
MARKET MINDS ADVISORY · CLIENT ENGAGEMENT SUMMARY
Anti-Drone Technology Producer Strategic Portfolio Review and Transition Roadmap 2026·Investment Scenario on Anti-Drone Technology Exposure Evaluation 2025-26
CLIENT PROFILE
An airport group operating four international airports handling roughly 74 million passengers annually, which had recorded 61 confirmed drone sightings across the previous two years including two that suspended runway operations. The group had budgeted approximately USD 12 million for counter-drone capability (client-reported, unverified by MMA). No legal review had preceded that approval, and the shortlist was already down to three suppliers.
STRATEGIC CHALLENGE
The board wanted the ability to stop an incursion and had approved budget on that basis. Nobody had established whether the airports were legally permitted to interdict anything, and three shortlisted suppliers had all proposed systems including mitigation the operator might have no authority to activate. Nobody had asked the question first.
MMA APPROACH
MMA established interdiction authority in each jurisdiction, mapped the handover process to the responsible state agencies, and re-specified the requirement around detection, classification, and evidence quality. Supplier proposals were re-evaluated against what the operator could lawfully do rather than against capability alone. Existing sensor holdings at each airport were inventoried and assessed for reuse.
KEY FINDINGS
  1. None of the four airports held authority to interdict; in all three jurisdictions that power sat with police or military agencies, and no exemption process existed for operators.
  2. Roughly 46% of the shortlisted proposal value covered mitigation capability the operator could not lawfully activate under any circumstances at any of the sites.
  3. Handover to state agencies averaged 19 minutes from detection, during which the only useful capability was classification and track quality good enough to justify a response.
  4. Two of the four airports already held radar and optical sensors from earlier projects that no system integrated, so three separate consoles ran during every incident.
CLIENT PROFILE
An airport group operating four international airports handling roughly 74 million passengers annually, which had recorded 61 confirmed drone sightings across the previous two years including two that suspended runway operations. The group had budgeted approximately USD 12 million for counter-drone capability (client-reported, unverified by MMA). No legal review had preceded that approval, and the shortlist was already down to three suppliers.
STRATEGIC CHALLENGE
The board wanted the ability to stop an incursion and had approved budget on that basis. Nobody had established whether the airports were legally permitted to interdict anything, and three shortlisted suppliers had all proposed systems including mitigation the operator might have no authority to activate. Nobody had asked the question first.
MMA APPROACH
MMA established interdiction authority in each jurisdiction, mapped the handover process to the responsible state agencies, and re-specified the requirement around detection, classification, and evidence quality. Supplier proposals were re-evaluated against what the operator could lawfully do rather than against capability alone. Existing sensor holdings at each airport were inventoried and assessed for reuse.
KEY FINDINGS
  1. None of the four airports held authority to interdict; in all three jurisdictions that power sat with police or military agencies, and no exemption process existed for operators.
  2. Roughly 46% of the shortlisted proposal value covered mitigation capability the operator could not lawfully activate under any circumstances at any of the sites.
  3. Handover to state agencies averaged 19 minutes from detection, during which the only useful capability was classification and track quality good enough to justify a response.
  4. Two of the four airports already held radar and optical sensors from earlier projects that no system integrated, so three separate consoles ran during every incident.
RECOMMENDED STRATEGY
Phase 1: Phase one: re-specify around detection, classification, and evidence quality sufficient to trigger a state agency response, removing mitigation from the immediate scope entirely. Phase 2: Phase two: procure an integration layer accepting the sensors already installed at two airports, rather than replacing equipment that still performs adequately. Phase 3: Phase three: agree formal handover protocols with each responsible agency, including what track quality justifies dispatch, before any further capability is purchased.
OUTCOME
Approved spend fell from USD 12 million to USD 6.6 million while coverage improved across all four sites (client-reported, unverified by MMA). Average handover time dropped from 19 minutes to under 7. Existing sensors were retained and integrated rather than replaced. Handover protocols were agreed with all three responsible agencies.

Frequently Asked Questions

Foundational context covering the market sizes, CAGR, scope, country, region and competition that inform every finding below. This section is provided to cover basics and most often pre-purchase conversations, answered from the MMA Primary Research Dataset.

What is the current size of the Anti-Drone Technology Market?

The market was worth USD 3.8 billion in 2025 and reaches USD 4.4 billion in 2026. Value covers detection, mitigation, and integration systems for small uncrewed aircraft.

How large will the Anti-Drone Technology Market be by 2036?

MMA forecasts USD 17.2 billion by 2036, an increase of USD 12.8 billion across the forecast period. That represents 3.91 times the 2026 base of USD 4.4 billion.

What is the CAGR for the Anti-Drone Technology Market 2026 to 2036?

The base case compound annual growth rate is 14.6%, with a bull case at 16.0% and a bear case at 13.2%. Historical growth from 2020 to 2025 ran at 13.4%.

Which segment is growing fastest?

Low-cost kinetic and interceptor effectors grow at 21.9%, half again the market rate of 14.6%. Cost exchange running near 84 to one made unit price the specification.

Who are the major companies in the Anti-Drone Technology Market?

DroneShield, Anduril, RTX, Leonardo, and Rafael Advanced Defense Systems lead, together holding 41% of system revenue. Specialists and defence primes compete on entirely different strengths here.

Which country is growing fastest?

India grows at 19.6%, driven by persistent border incursions and by a domestic industrialisation programme funding local suppliers alongside imported systems across several concurrent procurements.

Report Segmentation Architecture

The full report scope spans multiple orthogonal segmentation dimensions, with cross-tabulated demand data provided for each dimension pair. Coverage extends further to regional breakdowns, trend trajectories, and the competitive detail needed to support segment-level decision-making.

By System Function

  • Radar Detection Systems
  • Radio Frequency Detection and Direction Finding
  • Electro-Optical and Acoustic Detection
  • Low-Cost Kinetic and Interceptor Effectors
  • Electronic and Cyber Mitigation Systems
  • Command, Control and Integration Software

By End-Use Industry

  • Military Installations and Forward Operations
  • Airports and Civil Aviation
  • Energy and Critical Infrastructure
  • Correctional Facilities and Public Safety
  • Major Events and Stadiums
  • Border and Maritime Monitoring

By Commercial Dimension

  • Defence Programme Contract
  • Government Framework Agreement
  • Direct Commercial Site Purchase
  • Systems Integrator Channel
  • Managed Detection Service
  • Sustainment and Consumable Supply

By Region

  • North America
  • Western Europe
  • East Asia
  • South Asia and Pacific
  • Middle East and Africa
  • Eastern Europe
  • Latin America

Scope, Methodology, and Coverage

Every figure in this report is reproducible from documented input assumptions. The scope below maps the historical period, the forecast horizon, the segmentation dimensions, and the countries covered, alongside the underlying primary and qualitative methodology.
Historical Period
2020 to 2025
Forecast Period
2026 to 2036
Base Year
2025 (USD billions; MMA Primary Research Dataset, September 2026)
Market Definition
This market covers systems for detecting, identifying, and mitigating small uncrewed aircraft, including radar detection systems, radio frequency detection and direction finding, electro-optical and acoustic detection, low-cost kinetic and interceptor effectors, electronic and cyber mitigation systems, and command, control and integration software. It excludes air defence against crewed aircraft and larger missiles, uncrewed traffic management, drone manufacturing, general perimeter security, and airspace regulatory services.
Quantitative Units
USD billions, system, software, and consumable revenue
Segmentation Dimensions
System function, end-use industry, commercial dimension, region
Regions Covered
North America, Western Europe, East Asia, South Asia and Pacific, Middle East and Africa, Eastern Europe, Latin America
Countries Covered
United States, Canada, Mexico, United Kingdom, France, Germany, Italy, Netherlands, Sweden, Spain, Israel, Saudi Arabia, United Arab Emirates, Qatar, Egypt, South Africa, China, Japan, South Korea, Taiwan, India, Australia, Singapore, Indonesia, Brazil, Colombia, Chile, Poland, Ukraine, Romania
Key Companies Profiled
DroneShield, Anduril, RTX, Leonardo, Rafael Advanced Defense Systems, Dedrone, Fortem Technologies, Thales, Hensoldt, Elbit Systems, Aselsan, MARSS, D-Fend Solutions, Robin Radar Systems, Blighter Surveillance Systems, QinetiQ, SRC, Teledyne FLIR, Echodyne, Northrop Grumman
Quantitative Methodology
Primary survey, n=3,800 respondents, Q4 2025, six countries; demand-side model with trade association cross-validation
Qualitative Methodology
47 expert interviews, Q4 2025; applied to validate demand model assumptions, identify emerging dynamics, and assess competitive positioning
Report Format
PDF and XLSX data workbook (Word format preview document)
Publisher
Market Minds Advisory
Report Code
MMA-2026-TEC-731
Published
September 2026
Contact
sales@marketmindsadvisory.com | www.marketmindsadvisory.com

Purchase the full Anti-Drone Technology Market Report (2026 to 2036).

The full report sizes the anti-drone technology market across six system functions, seven regions, and thirty countries, with forecasts to 2036 under base, bull, and bear cases. It examines why cost per engagement replaced capability as the governing specification, how interdiction authority caps civil demand at detection, and what autonomous craft mean for the radio frequency installed base. Competitive analysis covers twenty participants evaluated consistently on system revenue, with detailed treatment of qualification credentials and integration position. Cost structure, margin architecture, and regional threat exposure are analysed throughout. Primary research includes 3,800 survey responses and 47 expert interviews.
Six system functions sized and forecast separately
Twenty participants evaluated on system and consumable revenue
Regional threat exposure mapped against procurement scale across geographies
Margin architecture by function and cost exchange exposure
Interdiction authority mapped across civil and state buyer categories
Procurement cycle analysis measured against threat evolution rates

Built For The People Who Decide

From boardroom strategy to bench-side execution, this report is read cover-to-cover by leaders shaping the next decade of their industry, turning demand scenarios, market dynamics and valuation benchmarks into decisions.
CXOs/ Presidents/ VPs/ Managers
M&A and Corporate Development
Strategy Teams and R&D Heads
Procurement and Product Directors
Regulatory and Compliance Leaders
Investor Relations and Equity Analysts