Market Minds Advisory
Antidiabetics Market

Antidiabetics Market: The GLP-1 Revenue Realignment

GLP-1 receptor agonists are reshaping the competitive order of an otherwise mature therapeutic category, as payers renegotiate formulary tiers around weight-loss efficacy data while insulin and older oral agents face accelerating price erosion worldwide.

Lead Analyst

Alice Ballenger

Published

September 2026

Make Smarter Decisions with Customized Research Insights

Request a free sample report and evaluate market opportunities, growth trends, and competitive dynamics relevant to your business needs.

2025 MARKET VALUE$58.0BMarket Size 2025
2036 FORECAST VALUE$155.9BBase Case , 2026 to 2036
CAGR 2026 TO 20369.4 %Bull 10.6% / Bear 8.1%
INCREMENTAL OPPORTUNITY$92.5BNet 10- year value creation
EXPANSION MULTIPLE2.46x2036 value over 2026 base
Strategic Levers
M&A Pipeline
Regional Outlook
Country Rankings
Competitive Intelligence
Segmental Deep-dive
Call-Us : 91 93563 13602

Executive Snapshot and Market Trajectory

GLP-1 receptor agonists have moved from a niche injectable therapy to the dominant growth engine of the entire diabetes category, as payers increasingly restructure formulary tiers around weight-loss efficacy data rather than glycemic control alone, particularly across employer-sponsored insurance markets facing sustained utilization pressure nationwide.
GLP-1 receptor agonists are growing at roughly 2.0x the market average as prescribing expands beyond type 2 diabetes into adjacent metabolic and cardiovascular risk indications. North America retains the largest revenue base on dense specialty pharmacy infrastructure and premium list pricing for branded GLP-1 therapies, while East Asia is compounding fastest as China's expanding diabetes prevalence and broadening biologics reimbursement access pull volume into the category at an accelerating pace nationwide.
Competitive intensity concentrates among five diversified pharmaceutical manufacturers that increasingly bundle GLP-1, SGLT2, and insulin franchises into a single metabolic disease portfolio, leaving smaller generic producers to compete on price for older oral agents facing biosimilar and generic erosion. Manufacturing scale and supply reliability, not molecule novelty alone, increasingly determine which suppliers meet surging GLP-1 demand across major developed markets today. Payers are beginning to standardize outcomes-based contracting terms across competing manufacturers nationwide.
Market Definition
The antidiabetics market covers pharmaceutical therapies used to manage type 1 and type 2 diabetes mellitus, including GLP-1 receptor agonists, SGLT2 inhibitors, insulin and insulin analogs, DPP-4 inhibitors, biguanides, and sulfonylureas. It includes both branded and generic formulations sold through retail, hospital, and specialty pharmacy channels. Obesity-only indications for GLP-1 therapies sold outside a diabetes label are excluded from market scope where separately reported.
Base Year Value
$58.0B in 2025 (MMA Primary Research Dataset, August 2026)
Forecast Period
2026 to 2036, eleven discrete annual values
CAGR
9.4% base case. Bull 10.6%. Bear 8.1%.
Fastest Growth Segment
GLP-1 Receptor Agonists: 18.8% CAGR
Fastest Growth Country
India: 13.8% CAGR
Fastest Growth Region
South Asia and Pacific: 11.5% CAGR
Largest Region
North America: 40% of 2025 global value
Market Leaders
Novo Nordisk, Eli Lilly, Sanofi, Merck & Co, AstraZeneca. Source: MMA Analysis based on company annual reports.
Primary Survey
n=3,800 procurement and R&D decision-makers, Q4 2025, six countries
Methodology
Demand-side build-up, cross-validated against public data, 47 expert interviews

Antidiabetics Market Forecast Scenarios

antidiabetics-market-2-size-forecast-scenario-1787303892340
Between 2020 and 2025 the market grew at an estimated 8.0% historical CAGR, accelerating sharply in the back half of the period as GLP-1 receptor agonist prescribing volume surged across both diabetes and adjacent weight-loss indications, outpacing manufacturing capacity for much of the historical period. Insulin and older oral agents faced accelerating price erosion throughout the same period as biosimilar competition intensified across major developed markets nationwide.
The base case assumes 9.4% CAGR through 2036, anchored in three mechanisms: continued GLP-1 receptor agonist prescribing expansion as manufacturing capacity catches up with persistent demand backlogs, rising global type 2 diabetes prevalence driving base volume growth across both developed and emerging markets, and SGLT2 inhibitor adoption broadening beyond diabetes into heart failure and chronic kidney disease indications. Biosimilar insulin expansion adds a modest offsetting drag as pricing continues compressing across the mature insulin franchise segment.
A bull scenario, near 10.6% CAGR, assumes faster GLP-1 manufacturing capacity expansion and continued label expansion into new indications pull prescribing volume forward across more patient populations. The bear case, near 8.1% CAGR, assumes payer pushback on GLP-1 pricing intensifies and manufacturing capacity constraints persist longer than expected, capping volume growth despite sustained underlying patient demand.

GLP-1 Demand Outpaces Manufacturing Capacity Industrywide

Three forces are converging on antidiabetic demand simultaneously: surging GLP-1 receptor agonist prescribing that continues to outpace manufacturer production capacity, rising global type 2 diabetes prevalence sustaining steady base volume growth across both developed and emerging markets, and accelerating biosimilar insulin penetration compressing pricing across the mature insulin franchise. Payers that once managed diabetes spending as a predictable cost line now treat GLP-1 utilization as a
MARKET CONCENTRATION68%Combined revenue share held by top five pharmaceutical manufacturers
GLP-1 MONTHLY THERAPY COST$950Blended average list price for a monthly branded incretin prescription
PATENT CLIFF EXPOSURE2028-2031Window when major branded incretin patent protections begin expiring
GLP-1 PRESCRIBING GROWTH42%Year over year prescription volume growth for branded incretin therapies
TOP CONSUMING COUNTRYUnited StatesLeading country for antidiabetic therapy spending volume today overall
INSULIN BIOSIMILAR PENETRATION24%Share of insulin prescriptions filled with biosimilar alternatives currently
Commercially, the category increasingly splits into two distinct economics: a high-growth, capacity-constrained GLP-1 franchise commanding premium pricing power, and a mature, price-competitive insulin and oral agent base facing continued generic and biosimilar erosion. Manufacturers with balanced portfolios spanning both segments are better positioned to weather formulary negotiation pressure than single-franchise competitors exposed to either extreme across the cycle.
Over the next decade, expect GLP-1 receptor agonists to keep gaining share within the broader antidiabetic budget as manufacturing capacity expands and indication breadth widens, continued consolidation among smaller generic insulin producers unable to compete on biosimilar pricing, and growing payer scrutiny of GLP-1 utilization management driving new prior authorization and step therapy requirements across major markets and emerging economies alike.
"Health plans used to budget for diabetes the way they budget for a stable, predictable cost center. Now a single GLP-1 utilization surge can blow through an entire quarter's pharmacy budget variance, because prescribing demand has consistently run ahead of every capacity forecast manufacturers have published."
Director, Metabolic Disease and Specialty Pharmaceuticals Practice · MMA Diabete

Market Trends

GLP-1 Manufacturing Capacity Expansion Races Against Demand

Leading manufacturers are investing heavily in expanded GLP-1 receptor agonist manufacturing capacity, adding new fill-finish lines and active ingredient production capability to address persistent supply shortages that have constrained prescribing volume across major markets for several consecutive years running. Each new capacity expansion announcement increasingly targets specific bottleneck steps in the complex peptide manufacturing process, a qualification and scale-up challenge that has proven more difficult than initially projected across the industry. Manufacturers completing major capacity expansions report meaningfully improved supply reliability, reinforcing continued capital investment as the primary competitive lever among GLP-1 franchise leaders today.
Market Impact: Adds 12 million new diagnoses annua

SGLT2 Inhibitors Expand Beyond Diabetes Into Cardiorenal Care

SGLT2 inhibitors are increasingly prescribed beyond their original type 2 diabetes indication into heart failure and chronic kidney disease management, broadening the addressable patient population well beyond the diabetes-only prescribing base that historically defined the category for decades. Each new cardiorenal indication approval increasingly requires manufacturers to build separate specialist prescriber relationships across cardiology and nephrology alongside traditional endocrinology channels serving existing patients. Manufacturers completing cardiorenal indication expansions report meaningfully broader prescriber adoption, reinforcing multi-indication labeling as the standard strategic approach across the SGLT2 inhibitor class today and into the foreseeable future.
Market Impact: Adds 22% to preferred formulary pla

Market Opportunities and Growth Drivers

Rising Global Type 2 Diabetes Prevalence Sustains Base Demand

Aging populations and rising obesity rates across both developed and emerging markets continue driving steady growth in type 2 diabetes prevalence, sustaining base volume demand across the entire antidiabetic category independent of any single therapeutic class trend or pricing cycle. Health systems report that diabetes prevalence continues rising fastest across middle-income emerging markets where dietary transition and urbanization are outpacing corresponding growth in preventive care infrastructure and screening capacity. This prevalence growth is expanding the addressable patient population well beyond the developed markets that historically drove most category revenue across the industry.
Market Impact: Delays prescriptions 4 to 10 weeks

Cardiovascular Outcomes Data Drives Formulary Preference Shifts

Accumulating cardiovascular outcomes trial data for both GLP-1 receptor agonists and SGLT2 inhibitors is increasingly driving payer formulary preference toward these classes over older oral agents lacking comparable cardiovascular risk reduction evidence across large patient populations. Payers report that cardiovascular outcomes data increasingly determines formulary tier placement decisions independent of glycemic control efficacy alone, a shift that has meaningfully reshaped competitive dynamics across the category over recent years. This evidence-driven formulary shift is pulling forward prescribing transitions that might otherwise have proceeded more gradually absent such compelling outcomes data across every major indication.
Market Impact: Compresses net pricing by 18%

Market Restraints and Challenges

Persistent Supply Shortages Limit GLP-1 Prescribing Volume

GLP-1 receptor agonist manufacturers continue struggling to meet surging prescribing demand, and the root cause is that peptide manufacturing requires complex, multi-step production processes that cannot scale as quickly as demand growth has proven capable of accelerating across major markets worldwide. The commercial impact falls hardest on patients and prescribers facing intermittent product unavailability, since pharmacy-level shortages can force treatment interruptions that compromise glycemic control continuity for affected patients. Manufacturers are mitigating this by prioritizing capacity allocation toward diabetes indications over adjacent weight-loss-only prescribing during the most acute shortage periods experienced to date.
Market Impact: Adds 35% to GLP-1 production capaci

Payer Pushback Intensifies Around GLP-1 Pricing Levels

Health plans and pharmacy benefit managers are increasingly pushing back against premium GLP-1 list pricing, and the root cause is that utilization growth has consistently exceeded actuarial projections, creating unplanned budget pressure that payers are attempting to manage through stricter utilization controls. The commercial impact falls hardest on manufacturers relying heavily on list price growth to offset volume-related rebate concessions, since payers increasingly demand deeper rebates in exchange for preferred formulary placement across competing GLP-1 products. Manufacturers are mitigating this by offering value-based contracting arrangements tied to demonstrated patient outcomes.
Market Impact: Expands eligible patients by 28%
4 additional market trends, 4 additional growth drivers, and 3 additional restraints and challenges are covered in the full report. Contact sales@marketmindsadvisory.com to access the complete intelligence.

Segment CAGR and Growth Architecture

Segmentation follows therapeutic drug class, the single dimension prescribers and payers specify against when structuring a diabetes treatment protocol or formulary tier. GLP-1 receptor agonists, SGLT2 inhibitors, insulin and insulin analogs, DPP-4 inhibitors, biguanides, and sulfonylureas each represent a distinct mechanism of action, keeping drug class and mechanism dimensions separate across every treatment line and payer channel served today.
antidiabetics-market-2-market-share-analysis-1787303892878

GLP-1 Receptor Agonists

GLP-1 receptor agonists stimulate insulin secretion and suppress appetite through incretin pathway activation, delivering both glycemic control and clinically significant weight loss that has driven prescribing well beyond the traditional diabetes-only patient population across most developed markets. Adoption is concentrated among endocrinologists and increasingly primary care prescribers managing patients with both diabetes and obesity comorbidities requiring dual therapeutic benefit across a single treatment plan. Growth outpaces the broader market by roughly 2.0x as manufacturing capacity gradually catches up with sustained prescribing demand across developed markets worldwide. Manufacturers with proven manufacturing scale and consistent supply reliability are capturing outsized share, since supply interruptions from a competing manufacturer routinely shift prescribing volume toward whichever supplier can reliably fulfill pharmacy orders at scale.
CAGR 18.8%

SGLT2 Inhibitors

SGLT2 inhibitors lower blood glucose by blocking renal glucose reabsorption, delivering glycemic control alongside demonstrated cardiovascular and renal protective benefits that have expanded prescribing well beyond the original diabetes indication into heart failure and chronic kidney disease management across a broader specialist base. Adoption is concentrated among cardiologists and nephrologists increasingly prescribing the class for its cardiorenal benefits independent of diabetes status entirely, reflecting a genuine shift in specialist prescribing behavior. Growth remains strong as accumulating outcomes data continues expanding the eligible patient population across multiple specialist channels and referral pathways. Manufacturers completing successful cardiorenal indication expansions report meaningfully broader prescriber adoption, reinforcing multi-indication positioning as the standard strategic approach across the SGLT2 inhibitor class today and going forward.
CAGR 12.5%
Full segment breakdown across 6 segments available in the complete report.

Regional Architecture and Country Demand Map

North America retains the largest revenue base on dense specialty pharmacy infrastructure and premium list pricing for branded GLP-1 therapies, while East Asia is compounding fastest as China's expanding diabetes prevalence and broadening biologics reimbursement access pull volume into the category nationwide and across provincial markets.

North America

United States specialty pharmacy channels and employer-sponsored insurance markets anchor the region's leading revenue base, as premium branded GLP-1 list pricing and rapidly expanding prescribing volume drive category revenue well ahead of underlying patient population growth. Canadian provincial health systems continue steady antidiabetic spending tied to centralized formulary management programmes covering both branded and generic therapeutic classes. Employer and payer utilization management programmes across major United States health plans continue evolving rapidly as GLP-1 spending growth outpaces most actuarial forecasting models built before the current prescribing surge began. This share sits above the standard regional band, reflecting genuine concentration of premium GLP-1 list pricing and specialty pharmacy infrastructure within United States payer markets rather than an estimation error.
Share: 40% | CAGR: 9.8% (2026 to 2036)

Western Europe

German and French national health systems, operating under centralized drug pricing negotiation frameworks, sustain steady demand for both GLP-1 and SGLT2 therapies tied to national reimbursement formularies covering the broader population. United Kingdom National Health Service procurement continues expanding GLP-1 access tied to national clinical guideline updates covering both diabetes and cardiometabolic risk management. Regional generic and biosimilar insulin producers, including several established European manufacturers, maintain meaningful domestic production capacity built on decades of insulin manufacturing expertise across the pharmaceutical sector. Regional growth trails East Asia and North America as centralized pricing negotiation frameworks limit the premium pricing upside GLP-1 manufacturers can capture relative to less regulated markets elsewhere in the forecast.
Share: 19% | CAGR: 7.9% (2026 to 2036)
Regional intelligence for 5 additional markets available in the complete report: East Asia, South Asia and Pacific, Latin America, Middle East and Africa, Eastern Europe. Contact sales@marketmindsadvisory.com.
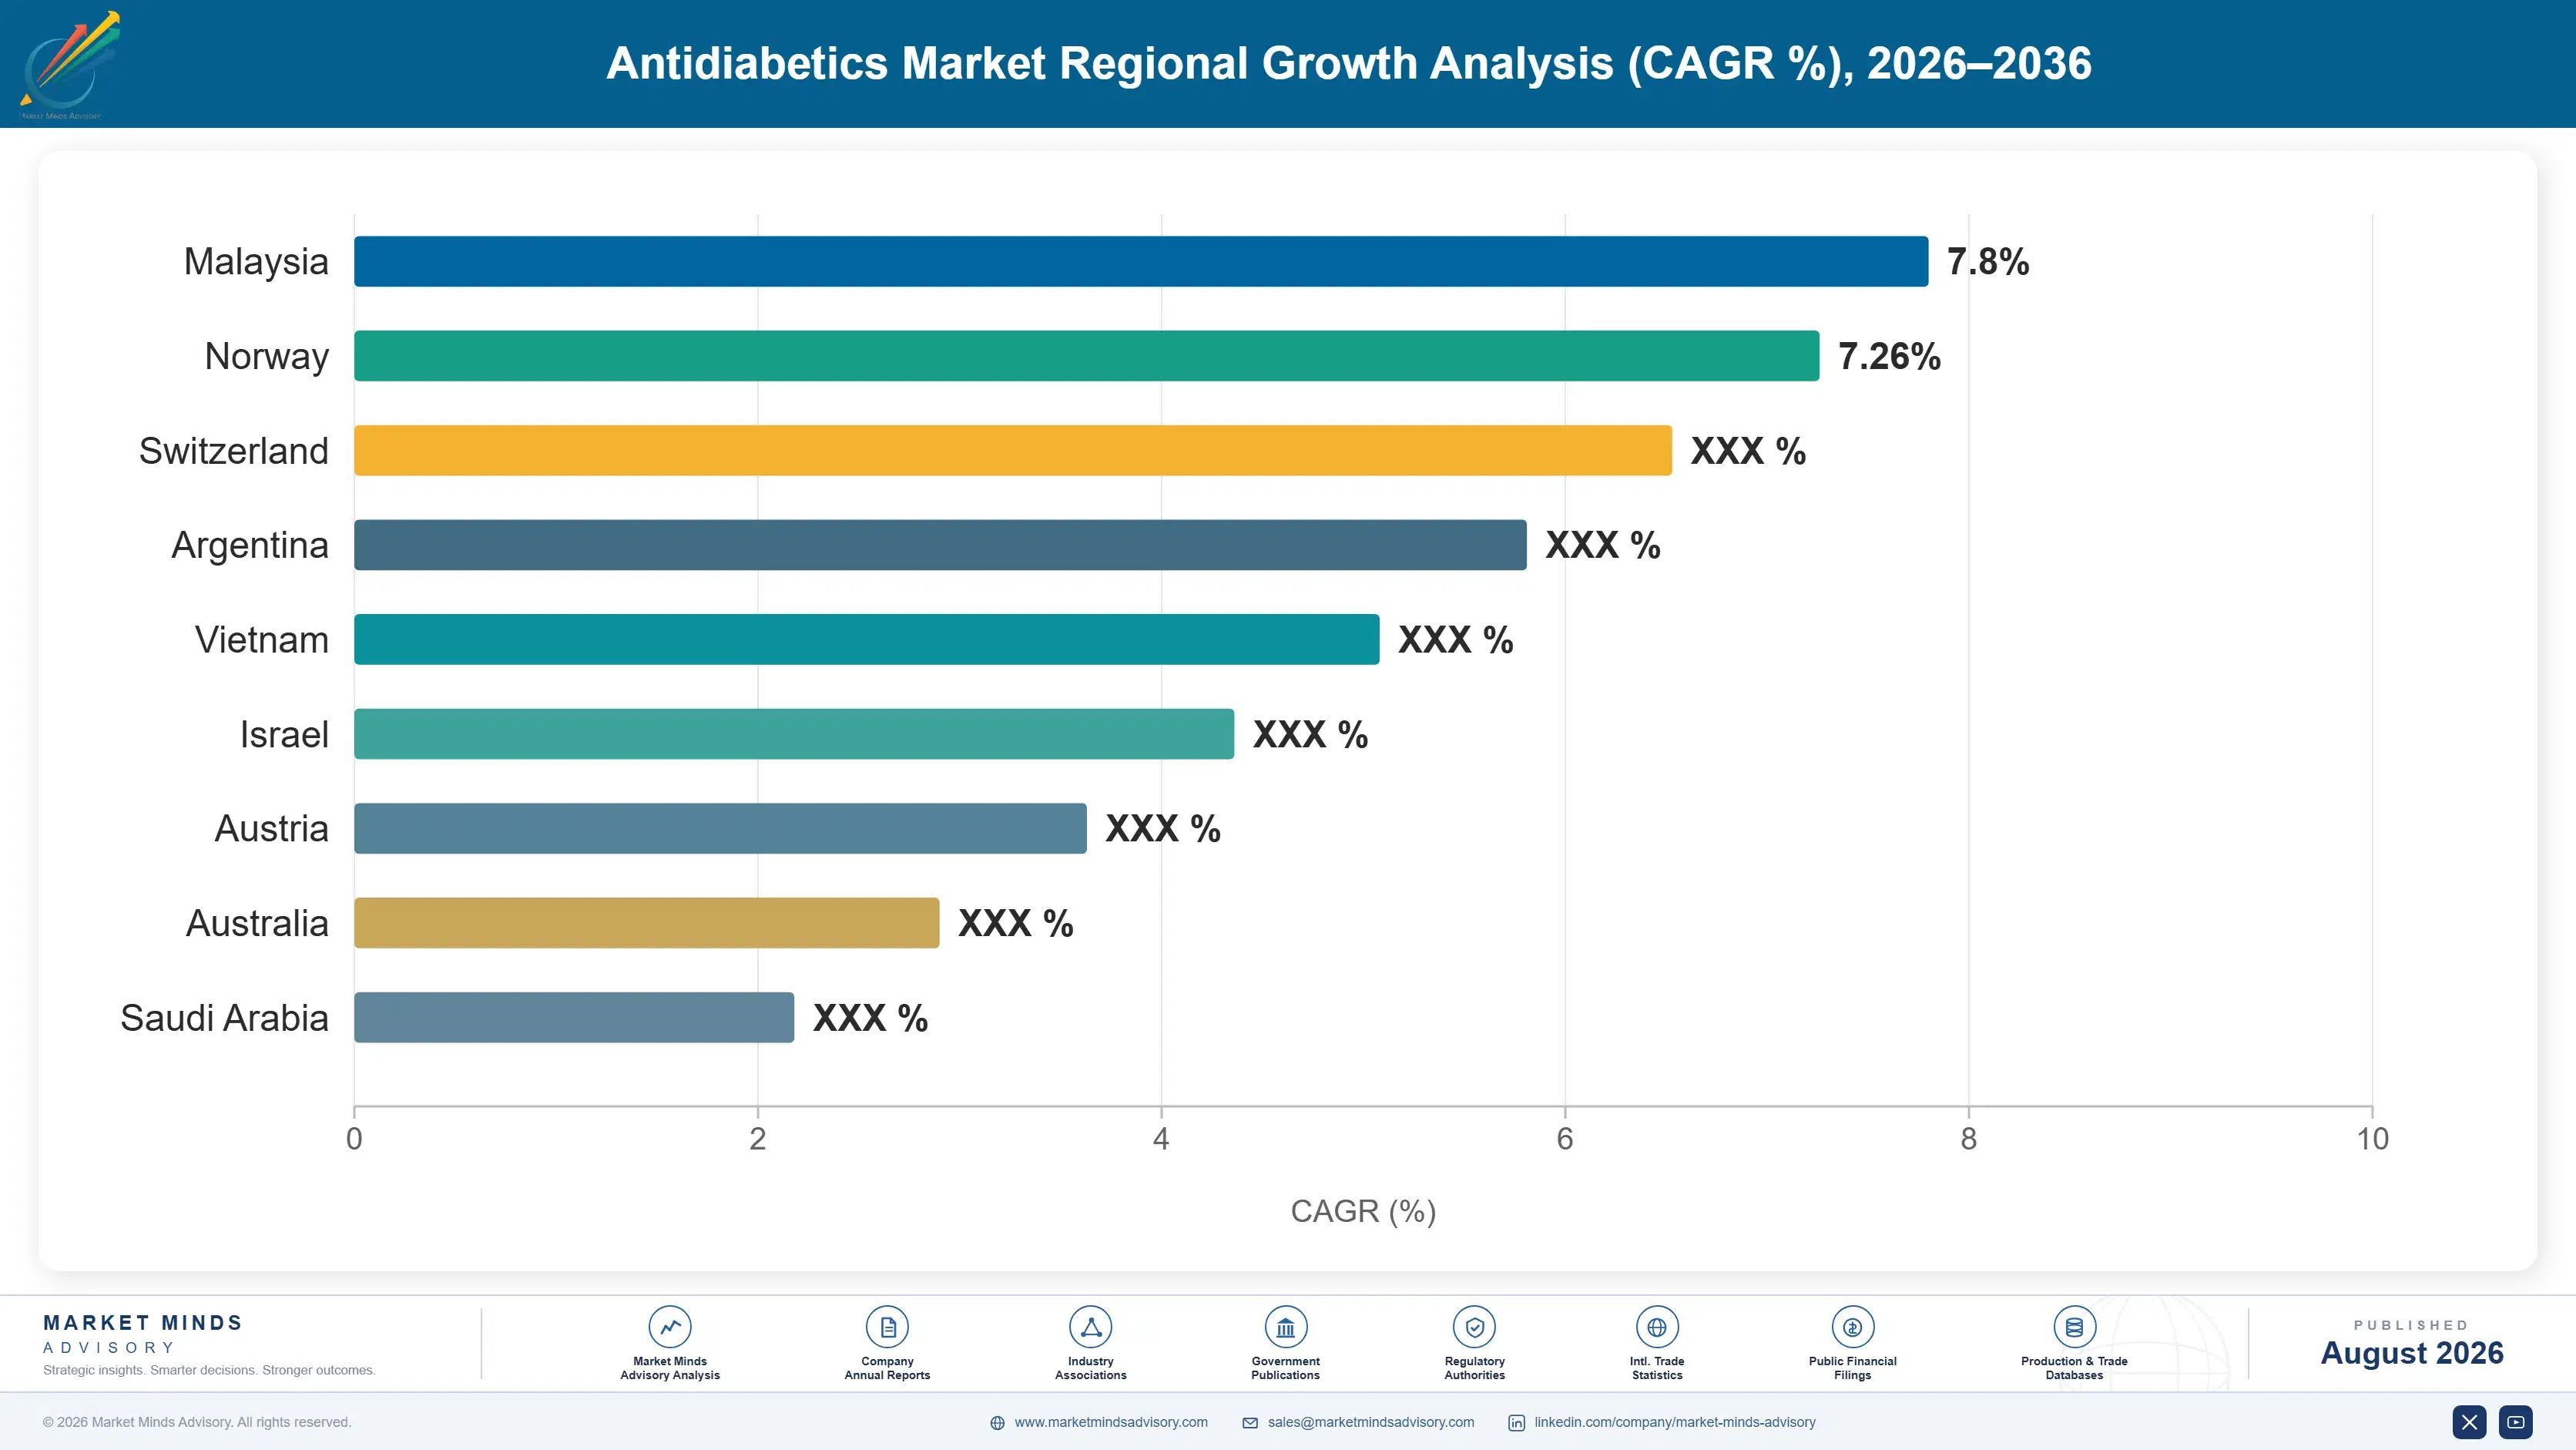
antidiabetics-market-2-country-cagr-analysis-1787303893389

Monetizing Capacity Assurance and Outcomes Contracting

Manufacturers are shifting commercial models toward supply continuity assurance programmes, value-based outcomes contracting, and multi-brand portfolio agreements rather than transactional list pricing alone, since payer demand for budget predictability now rivals molecule efficacy as a formulary negotiation criterion. This mirrors a broader shift across specialty pharmaceutical categories toward relationship-based commercial structures over transactional pricing.

Offering Payer Supply Continuity Assurance Programs

Manufacturers are increasingly offering supply continuity assurance programmes that guarantee priority allocation and predictable delivery volumes to payers committing to preferred formulary placement, converting what was historically an uncertain allocation process into a structured commercial relationship tied directly to formulary commitment depth. Manufacturers report continuity programme attach rates above 49% among large national payers managing the highest GLP-1 utilization volumes, with renewal rates exceeding 84% once a payer experiences a full contract cycle without a supply disruption. This continuity assurance increasingly determines formulary placement ahead of marginal rebate differences during large payer negotiations.
Market Impact: Lifts preferred formulary revenue b

Structuring Value-Based Outcomes Contracting Agreements Broadly

Manufacturers are increasingly structuring value-based outcomes contracts that tie a portion of GLP-1 and SGLT2 payment to demonstrated patient adherence and clinical outcomes, giving payers a lower financial risk path to broader formulary coverage of premium-priced therapies across enrolled populations. This outcomes-based path typically reduces payer budget risk meaningfully while preserving manufacturer revenue upside tied to real-world effectiveness data across enrolled patient populations nationwide. Manufacturers report outcomes-based attach rates rising fastest among payers facing the greatest budget pressure around GLP-1 utilization growth exceeding prior actuarial projections and planning assumptions.
Market Impact: Expands covered lives by roughly 22

Bundling Multi-Brand Metabolic Portfolio Agreements Together

Manufacturers with balanced GLP-1, SGLT2, and insulin portfolios are increasingly bundling multi-brand agreements that offer payers preferred pricing across an entire metabolic disease treatment pathway rather than negotiating each product independently across separate cycles. Bundled portfolio agreements typically deliver meaningfully better blended net pricing for payers than negotiating each therapeutic class separately, with bundled contracts now representing roughly 31% of total large payer agreements across the category. Manufacturers report bundled attach rates rising fastest among payers seeking to simplify formulary management across the full diabetes treatment continuum and care pathway.
Market Impact: Cuts payer formulary complexity by

Offering Direct-to-Patient Access and Savings Programs

Manufacturers are increasingly offering direct-to-patient savings and access programmes that reduce out-of-pocket costs for patients facing high formulary tier placement or coverage gaps, converting what was historically lost prescription volume into captured revenue through manufacturer-subsidized channels across every affected market. These programmes typically restore meaningful patient adherence among cost-sensitive populations who would otherwise abandon therapy entirely, with direct access programmes now supporting roughly 17% of total branded GLP-1 prescription volume nationwide. Manufacturers report access programme attach rates rising fastest among patients facing the highest formulary tier cost-sharing requirements today.
Market Impact: Recovers roughly 20 percent of at-r

Who Controls the Margin Pool

The top five manufacturers hold roughly 68% combined share, a high concentration reflecting both the biologics manufacturing barriers surrounding GLP-1 and insulin production and the clinical evidence depth required to compete credibly in cardiometabolic outcomes-driven formulary decisions. The gap between the leading GLP-1 franchise holders and smaller generic insulin producers is widening as payers increasingly restrict preferred formulary placement to manufacturers with proven supply reliabil
Current competitive activity centers on three fronts: GLP-1 manufacturing capacity expansion racing to meet persistent demand backlogs, cardiorenal indication expansion broadening SGLT2 inhibitor addressable populations, and value-based outcomes contracting development supporting payer budget predictability. Several smaller manufacturers are pursuing licensing partnerships with GLP-1 originators rather than developing proprietary peptide platforms independently, a faster but margin-diluting route to category participation.

Emerging pressure comes from Chinese and Indian generic manufacturers moving up the value chain from basic insulin and oral agents into biosimilar GLP-1 production sold initially to domestic markets but increasingly targeting export opportunities as patent cliffs approach across the category. Rankings among the top five could shift meaningfully once early GLP-1 patents begin expiring, since payers increasingly evaluate biosimilar readiness ahead of brand loyalty during large formulary contract decisions.
antidiabetics-market-2-company-positioning-matrix-1787303893918

Competitive Moat and Risk Dimensions

NOVO NORDISK

Moat: Deep GLP-1 manufacturing scale

Novo Nordisk's decades of accumulated peptide manufacturing expertise and early GLP-1 market entry give it durable credibility among payers who weigh proven supply reliability heavily, since qualifying an alternative GLP-1 supplier without comparable manufacturing history carries meaningful continuity risk. That credibility compounds with every additional manufacturing facility Novo Nordisk brings online.
NOVO NORDISK

Risk: Persistent capacity constraint exposure

Novo Nordisk's manufacturing capacity has repeatedly struggled to keep pace with surging GLP-1 demand, occasionally forcing it to cede prescribing volume to competitors during acute shortage periods when patients and pharmacies seek reliably available alternatives. That capacity gap is unlikely to close fully before the next major facility expansion completes.
ELI LILLY

Moat: Broad dual-agonist pipeline depth

Eli Lilly's dual GIP and GLP-1 receptor agonist platform delivers differentiated clinical efficacy data that gives it durable credibility among prescribers who weigh superior weight-loss and glycemic outcomes heavily, since switching patients away from a clinically superior therapy carries meaningful treatment continuity risk. That clinical differentiation compounds with every additional favorable trial readout Eli Lilly publishes.
ELI LILLY

Risk: Manufacturing scale-up execution risk

Eli Lilly's rapid demand growth has periodically outpaced its own manufacturing scale-up execution, occasionally requiring it to implement allocation restrictions that frustrate prescribers and patients seeking consistent access across pharmacy channels nationwide during the most acute demand surge periods experienced across the industry to date.

Players Tracked

Prominent Players

Novo Nordisk
Eli Lilly
Sanofi
Merck & Co
AstraZeneca

Other Key Players

Boehringer Ingelheim
Johnson & Johnson (Janssen)
Takeda Pharmaceutical
Bayer
Pfizer
Teva Pharmaceutical Industries
Viatris
Biocon
Julphar (Gulf Pharmaceutical Industries)
Zealand Pharma
Hanmi Pharmaceutical
Tonghua Dongbao Pharmaceutical
Wockhardt
Sun Pharmaceutical Industries
Civica Rx

Recent Developments

MAY 2025

Novo Nordisk Commissions New GLP-1 Fill-Finish Manufacturing Facility

Novo Nordisk commissioned a new large-scale fill-finish manufacturing facility dedicated to GLP-1 receptor agonist production, adding meaningful capacity to address persistent supply shortages affecting prescribing volume across major developed markets. The expansion targets both existing diabetes indications and adjacent weight-loss labeled products requiring separate production allocation.
Signal: Confirms manufacturing capacity expansion
SEPTEMBER 2025

Eli Lilly Signs Value-Based Outcomes Agreement With Major National Payer

Eli Lilly signed a multi-year value-based outcomes contract with a major national health insurer, tying a portion of GLP-1 payment to demonstrated patient adherence and clinical outcome benchmarks across the covered population. The agreement is a pricing arrangement rather than a joint venture or acquisition.
Signal: Highlights outcomes-based contracting as t
DECEMBER 2025

Sanofi Acquires Regional Biosimilar Insulin Manufacturing Specialist

Sanofi completed the acquisition of a regional biosimilar insulin manufacturing specialist, strengthening its position in the increasingly price-competitive insulin segment facing accelerating generic and biosimilar erosion across major developed markets worldwide. The deal reinforces Sanofi's manufacturing footprint across the broader mature antidiabetic therapeutic portfolio.
Signal: Signals continued consolidation of biosimi

Peptide Synthesis and Cold Chain Cost Exposure

Peptide active pharmaceutical ingredient synthesis, specialized fill-finish manufacturing, and cold chain distribution together represent an estimated 40 to 50% of GLP-1 receptor agonist cost of goods sold across most manufacturers. Peptide synthesis manufacturing capacity remains concentrated among a small number of qualified specialty producers, creating a narrower supply base than most broader biologics manufacturing categories rely upon for comparable production.
Contract manufacturing capacity constraints during 2022 and 2023 significantly limited GLP-1 production scale-up broadly, and several manufacturers flagged the disruption in annual reports as a persistent cost and timeline pressure affecting multiple peptide therapeutic categories simultaneously across the industry. Several manufacturers disclosed that qualifying additional contract manufacturing capacity took considerably longer than initially projected, forcing continued allocation restrictions and delaying full resolution of the ongoing supply shortage across major markets.

Smaller manufacturers carry disproportionate exposure to these input constraints since they lack the purchasing scale to secure priority access to limited peptide synthesis and fill-finish capacity that the top five manufacturers increasingly control through direct ownership. This gap is widest for manufacturers dependent entirely on third-party contract manufacturing, leaving them more vulnerable to capacity allocation decisions than vertically integrated competitors with internal production capability.
antidiabetics-market-2-cost-volatility-analysis-1787303894117

Vertical Integration Into Peptide Manufacturing Capacity

Leading manufacturers are increasingly acquiring or building internal peptide synthesis and fill-finish manufacturing capacity rather than relying entirely on third-party contract manufacturers, reducing exposure to capacity allocation constraints that limited production scale-up during the 2022 to 2023 shortage period and protecting long-term supply reliability across major markets worldwide throughout sustained periods of demand growth.

Long-Term Contract Manufacturing Capacity Agreements

Top five manufacturers increasingly lock multi-year capacity agreements directly with qualified contract manufacturers serving peptide synthesis and fill-finish production, smoothing production access and insulating supply from the allocation volatility smaller manufacturers remain exposed to directly, a practice that has become standard procurement policy since the shortage cycle began and continues expanding today.

Geographic Diversification of Manufacturing Sites

Leading manufacturers are increasingly diversifying peptide manufacturing across multiple geographic regions rather than concentrating production in a single facility, reducing exposure to any single site's regulatory, logistics, or capacity disruption risk and giving manufacturers greater flexibility to redirect production during periods of localized constraint across the network.

Portfolio Architecture for Margin Defence

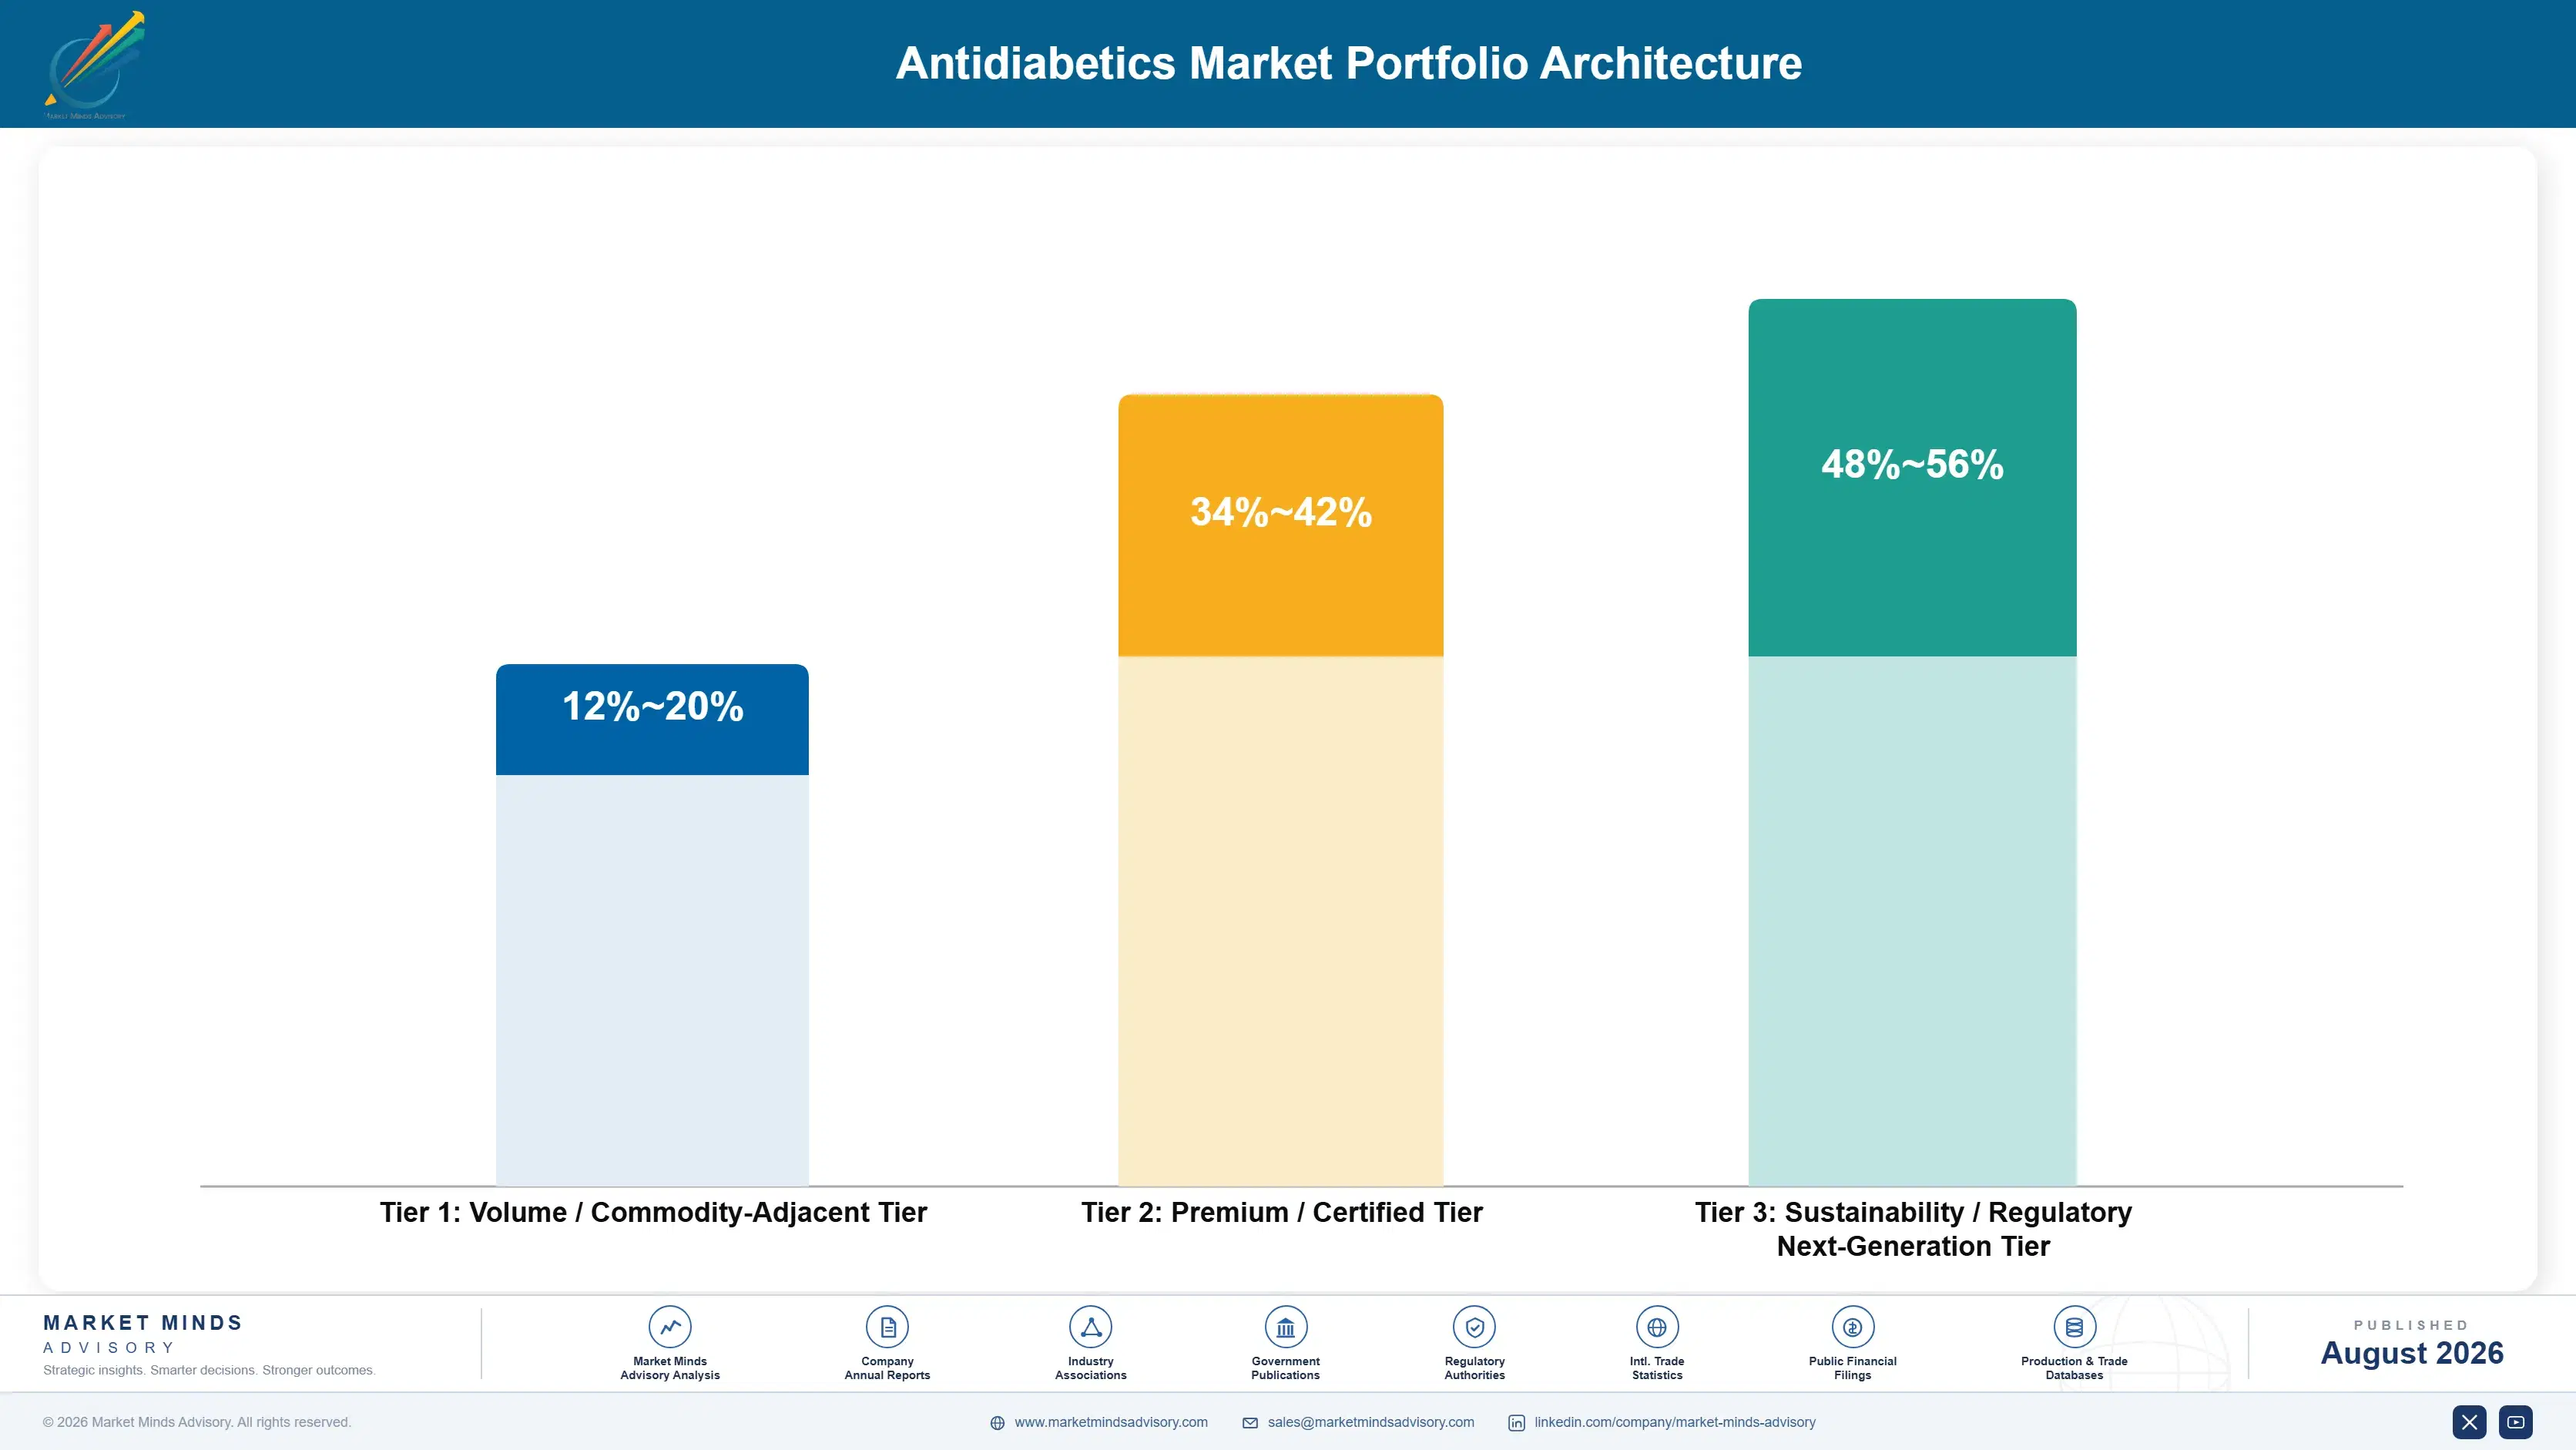
Portfolio architecture splits across three tiers: entry priced generic oral agents and biosimilar insulin competing largely on cost, certified branded SGLT2 and DPP-4 therapies carrying clinical evidence value that commands a durable price premium, and next generation GLP-1 receptor agonists bundled with supply continuity and outcomes contracting services. Gross margins widen meaningfully moving up this ladder as manufacturing scale and evidence barriers concentrate hardest at the entry tier.
The volume versus premium tension is sharpest in generic oral agents and biosimilar insulin, where price competition among smaller regional producers has compressed margins fastest, pushing established manufacturers to defend share through portfolio bundling rather than matching generic pricing directly. GLP-1 receptor agonists retain the strongest pricing power because manufacturing scarcity and outcomes-based contracting discourage payers from switching mid-contract, a dynamic strengthening as demand outpaces supply.

High value margin pools concentrate in GLP-1 receptor agonists paired with continuous supply continuity and outcomes contracts, where recurring revenue and high switching costs together support gross margins well above the portfolio average. Manufacturers are consequently prioritizing capital toward this tier even though it remains a minority of total unit volume shipped across the broader portfolio today, betting the mix shifts within the decade.

Volume / Commodity-Adjacent Tier

Generic oral agents and biosimilar insulin competing primarily on unit price against regional producers, with limited service attach and thin per-unit margins across most transactions, particularly among smaller emerging market health systems with constrained budgets.
Gross Margin: 12-20%

Premium / Certified Tier

Certified branded SGLT2 and DPP-4 inhibitor therapies serving formulary-preferred cardiometabolic applications, where clinical evidence depth and outcomes data support durable pricing across the industry, especially among payers managing large covered populations.
Gross Margin: 34-42%

Sustainability / Regulatory / Next-Generation Tier

GLP-1 receptor agonists bundled with supply continuity assurance, outcomes contracting, and patient access programme services, sold on recurring formulary value rather than unit pricing alone, increasingly the default specification for major national payer contracts.
Gross Margin: 48-56%
antidiabetics-market-2-portfolio-architecture-1787303894625

Formulary Contracts Anchor Recurring Payer Revenue

Antidiabetic manufacturer economics function increasingly like an annuity once a formulary relationship is established, since multi-year outcomes contracts, supply continuity agreements, and periodic rebate renewal generate recurring revenue for years after the initial formulary placement decision closes. This recurring layer now represents a growing share of total category revenue and is the primary reason manufacturers invest heavily in early payer relationships even at thin generic tier margi
Adoption depth varies sharply by end use vertical. Large national payers and integrated health systems run near saturated GLP-1 and SGLT2 formulary relationships and generate mostly renewal demand, while smaller regional payers and emerging market health systems are still building out first time access to newer therapeutic classes, generating a different mix of new coverage revenue layered on the maturing base.

Buyer profiles are shifting generationally as pharmacy benefit executives who trained primarily on value-based outcomes frameworks increasingly influence formulary decisions alongside veteran benefits managers who remember when diabetes spending was a predictable, low-volatility cost category. This is accelerating demand for manufacturers with strong outcomes data capability even among buyers who historically evaluated antidiabetic suppliers purely on unit cost and rebate depth alone.
antidiabetics-market-2-end-use-penetration-index-1787303895119

Where Antidiabetic Portfolio Strategy Should Focus

These are among the four positions where our research anticipates prominent divergence between winners and laggards over the coming forecast period. Each is grounded in the demand model, the regulatory perimeter, and the announced capacity pipeline.
01 / GLP-1 CAPACITY INVESTMENT

Prioritize manufacturing scale credentials over marginal efficacy claims

Molecule efficacy differences have become a secondary consideration across most large payer formulary decisions, no longer the primary differentiator given how similar leading GLP-1 products perform on core outcomes. Payers now evaluate manufacturing scale and supply reliability ahead of marginal efficacy gains that once justified a formulary preference on their own. Manufacturers that continue competing primarily on clinical trial data risk losing share to capacity focused rivals bundling manufacturing scale, outcomes contracting, and patient access programmes into a recurring relationship that is far harder to unwind once established.
02 / SERVICE MONETIZATION STRATEGY

Shift commercial models toward outcomes and continuity contract revenue

Generic tier margins will keep compressing as regional producers gain share at the entry tier of the category across most emerging health systems. Manufacturers that convert supply continuity, outcomes-based pricing, and patient access support into contracted recurring revenue will outperform peers still pricing primarily around list price negotiation alone. This shift also raises payer switching costs meaningfully, since replacing a qualified formulary partner requires displacing an entrenched, multi-year continuity and outcomes relationship built over years of accumulated actuarial trust across every covered population.
03 / REGIONAL GROWTH PRIORITIZATION

Weight investment toward South Asia and East Asia over mature markets

South Asia and East Asia are compounding faster than Western Europe on both share and CAGR, driven by rising diabetes prevalence, expanding biologics reimbursement access, and first time therapy adoption across previously underserved regional patient populations. Manufacturers weighting manufacturing and access investment toward these regions ahead of competitors will capture a disproportionate share of first time therapy access revenue. Mature markets, running mostly on formulary renewal demand, simply cannot replicate that category of growth at comparable scale or rate over the coming decade of forecast activity.
04 / PATENT CLIFF RESPONSE

Prepare biosimilar defense strategy ahead of GLP-1 patent expiration

The approaching GLP-1 patent cliff window between 2028 and 2031 represents a substantial competitive threat that most manufacturers are not yet fully prepared to counter given the complexity of defending a biologics franchise against biosimilar entry at scale. Manufacturers that invest early in next-generation formulations, combination therapies, and outcomes data depth will be better positioned to defend formulary preference once biosimilar competition intensifies across the category. Manufacturers ignoring this exposure risk ceding a growing share of GLP-1 volume to biosimilar entrants who have already solved the manufacturing cost problem.

Engagement Snapshot From the Field

A live engagement with an industry participant carrying material or product regulatory and market exposure ahead of a defining policy shift, showing how our research translates into a defensible multi-year portfolio strategy.
MARKET MINDS ADVISORY · CLIENT ENGAGEMENT SUMMARY
Antidiabetics Producer Strategic Portfolio Review and Transition Roadmap 2026·Investment Scenario on Antidiabetics Exposure Evaluation 2025-26
CLIENT PROFILE
The client is a national health insurer covering several million commercial and Medicare Advantage lives, reporting pharmacy benefit spending growth substantially above historical actuarial projections driven primarily by GLP-1 utilization (client-reported, unverified by MMA). Its existing formulary structure lacked differentiated utilization management tools capable of distinguishing diabetes from adjacent weight-loss-only prescribing across its covered population.
STRATEGIC CHALLENGE
Facing pharmacy benefit budget overruns tied to unprecedented GLP-1 utilization growth, corporate leadership sought to redesign formulary tiering and prior authorization criteria within nine months, while preserving access for members with legitimate diabetes and cardiometabolic risk indications across every covered plan segment nationwide and every regional market served.
MMA APPROACH
MMA benchmarked five candidate utilization management frameworks against clinical appropriateness criteria, administrative burden, and projected budget impact over a three year horizon, then modeled formulary redesign sequencing to minimize member disruption during the phased implementation programme currently under review by pharmacy and clinical leadership teams.
KEY FINDINGS
  1. Three of five utilization management frameworks evaluated could not adequately distinguish diabetes-indicated from weight-loss-only GLP-1 prescribing patterns at scale.
  2. Refined prior authorization criteria reduced projected annual pharmacy benefit spending growth by 24% versus continuing the existing unrestricted formulary approach, based on modeling completed during evaluation (client-reported, unverified by MMA).
  3. Value-based outcomes contracting with manufacturers was projected to offset roughly one third of remaining budget pressure, according to internal actuarial modeling completed by the client.
  4. Members with the highest clinical need carried the lowest risk of formulary disruption under the redesigned criteria, reprioritizing the client's original implementation sequence considerably ahead of launch.
CLIENT PROFILE
The client is a national health insurer covering several million commercial and Medicare Advantage lives, reporting pharmacy benefit spending growth substantially above historical actuarial projections driven primarily by GLP-1 utilization (client-reported, unverified by MMA). Its existing formulary structure lacked differentiated utilization management tools capable of distinguishing diabetes from adjacent weight-loss-only prescribing across its covered population.
STRATEGIC CHALLENGE
Facing pharmacy benefit budget overruns tied to unprecedented GLP-1 utilization growth, corporate leadership sought to redesign formulary tiering and prior authorization criteria within nine months, while preserving access for members with legitimate diabetes and cardiometabolic risk indications across every covered plan segment nationwide and every regional market served.
MMA APPROACH
MMA benchmarked five candidate utilization management frameworks against clinical appropriateness criteria, administrative burden, and projected budget impact over a three year horizon, then modeled formulary redesign sequencing to minimize member disruption during the phased implementation programme currently under review by pharmacy and clinical leadership teams.
KEY FINDINGS
  1. Three of five utilization management frameworks evaluated could not adequately distinguish diabetes-indicated from weight-loss-only GLP-1 prescribing patterns at scale.
  2. Refined prior authorization criteria reduced projected annual pharmacy benefit spending growth by 24% versus continuing the existing unrestricted formulary approach, based on modeling completed during evaluation (client-reported, unverified by MMA).
  3. Value-based outcomes contracting with manufacturers was projected to offset roughly one third of remaining budget pressure, according to internal actuarial modeling completed by the client.
  4. Members with the highest clinical need carried the lowest risk of formulary disruption under the redesigned criteria, reprioritizing the client's original implementation sequence considerably ahead of launch.
RECOMMENDED STRATEGY
Phase 1: Phase 1 (Months 1-3): Complete clinical criteria development and manufacturer outcomes contracting negotiations for the priority product list. Phase 2: Phase 2 (Months 4-6): Implement revised prior authorization criteria across commercial and Medicare Advantage plan segments in careful sequence. Phase 3: Phase 3 (Months 7-9): Monitor utilization impact and refine criteria based on early implementation data and member appeals volume trends.
OUTCOME
The insurer completed formulary redesign within the nine month window and reported meaningfully improved budget predictability during the subsequent plan year renewal cycle affecting every covered segment (client-reported, unverified by MMA). Pharmacy leadership gained clinical utilization visibility previously unavailable across its covered population segments.

Frequently Asked Questions

Foundational context covering the market sizes, CAGR, scope, country, region and competition that inform every finding below. This section is provided to cover basics and most often pre-purchase conversations, answered from the MMA Primary Research Dataset.

What is the current size of the Antidiabetics Market?

The global antidiabetics market reached an estimated $58.0 billion in 2025. Growth is driven by surging GLP-1 receptor agonist prescribing and rising global diabetes prevalence.

How large will the Antidiabetics Market be by 2036?

The market is projected to reach approximately $155.9 billion by 2036, roughly 2.46 times its 2026 value. GLP-1 receptor agonists drive most of the added value across the category.

What is the CAGR for the Antidiabetics Market 2026 to 2036?

The base case CAGR is 9.4% through 2036. Bull and bear scenarios range from roughly 8.1% to 10.6%, depending on manufacturing capacity expansion pace and payer pricing pressure.

Which segment is growing fastest?

GLP-1 receptor agonists lead at an 18.8% CAGR, about 2.0x the overall market rate. Growth is concentrated among prescribers expanding use beyond diabetes into adjacent metabolic indications.

Who are the major companies in the Antidiabetics Market?

Novo Nordisk, Eli Lilly, Sanofi, Merck & Co, and AstraZeneca lead the category. Combined, the top five manufacturers hold roughly 68% of global revenue on a consistent basis.

Which country is growing fastest?

India leads country level growth at an estimated 13.8% CAGR. An exceptionally large diabetic population and expanding healthcare access are driving first time therapy adoption across the region.

Report Segmentation Architecture

The full report scope spans multiple orthogonal segmentation dimensions, with cross-tabulated demand data provided for each dimension pair. Coverage extends further to regional breakdowns, trend trajectories, and the competitive detail needed to support segment-level decision-making.

By Therapeutic Drug Class

  • GLP-1 Receptor Agonists
  • SGLT2 Inhibitors
  • Insulin and Insulin Analogs
  • DPP-4 Inhibitors
  • Biguanides
  • Sulfonylureas and Other Oral Agents

By End-Use Care Setting

  • Retail and Community Pharmacy
  • Hospital and Institutional Pharmacy
  • Specialty Pharmacy Channels
  • Telehealth and Direct-to-Patient Channels

By Commercial Dimension

  • Branded Manufacturer Contracts
  • Generic and Biosimilar Distribution
  • Payer Formulary Agreements
  • Patient Assistance and Access Programs

By Region

  • North America
  • Western Europe
  • East Asia
  • South Asia and Pacific
  • Latin America
  • Middle East and Africa
  • Eastern Europe

Scope, Methodology, and Coverage

Every figure in this report is reproducible from documented input assumptions. The scope below maps the historical period, the forecast horizon, the segmentation dimensions, and the countries covered, alongside the underlying primary and qualitative methodology.
Historical Period
2020 to 2025
Forecast Period
2026 to 2036
Base Year
2025 (USD billions; MMA Primary Research Dataset, August 2026)
Market Definition
The antidiabetics market covers pharmaceutical therapies used to manage type 1 and type 2 diabetes mellitus, including GLP-1 receptor agonists, SGLT2 inhibitors, insulin and insulin analogs, DPP-4 inhibitors, biguanides, and sulfonylureas. It includes both branded and generic formulations sold through retail, hospital, and specialty pharmacy channels.
Quantitative Units
USD billions (current prices); prescription volume where disclosed
Segmentation Dimensions
By Therapeutic Drug Class; By End-Use Care Setting; By Commercial Dimension; By Region
Regions Covered
North America, Western Europe, East Asia, South Asia and Pacific, Latin America, Middle East and Africa, Eastern Europe
Countries Covered
USA, China, Germany, France, UK, Japan, South Korea, India, Australia, Canada, Brazil, Mexico, Indonesia, Vietnam, Thailand, Malaysia, UAE, Saudi Arabia, South Africa, Nigeria, Turkey, Poland, Netherlands, Italy, Spain, Sweden, Switzerland, Argentina, Colombia, Singapore, and additional markets relevant to this sector
Key Companies Profiled
Novo Nordisk, Eli Lilly, Sanofi, Merck & Co, AstraZeneca, Boehringer Ingelheim, Johnson & Johnson (Janssen), Takeda Pharmaceutical, Bayer, Pfizer, Teva Pharmaceutical Industries, Viatris, Biocon, Julphar (Gulf Pharmaceutical Industries), Zealand Pharma, Hanmi Pharmaceutical, Tonghua Dongbao Pharmaceutical, Wockhardt, Sun Pharmaceutical Industries, Civica Rx
Quantitative Methodology
Primary survey, n=3,800 respondents, Q4 2025, six countries; demand-side model with trade association cross-validation
Qualitative Methodology
47 expert interviews, Q4 2025; applied to validate demand model assumptions, identify emerging dynamics, and assess competitive positioning
Report Format
PDF and XLSX data workbook (Word format preview document)
Publisher
Market Minds Advisory
Report Code
MMA-2026-HLT-135
Published
August 2026
Contact
sales@marketmindsadvisory.com | www.marketmindsadvisory.com

Purchase the full Antidiabetics Market Report (2026 to 2036).

The full report delivers a complete quantitative and qualitative assessment of the global antidiabetics market through 2036. It includes detailed segmentation by therapeutic drug class, care setting, and commercial channel, alongside country level sizing across thirty markets covering every major treatment demand center. Competitive profiles cover twenty companies with manufacturing scale, clinical evidence, and payer contracting benchmarking assessed on a consistent revenue basis. Buyers also receive access to the underlying primary survey and expert interview datasets referenced throughout the analysis, along with editable data tables.
Segment level CAGR and sizing tables
Regional and country level market breakdowns
Twenty company competitive profiles and benchmarks
Detailed GLP-1 capacity benchmarking matrix
Input cost and supply chain risk analysis
Primary survey and expert interview datasets fully included

Built For The People Who Decide

From boardroom strategy to bench-side execution, this report is read cover-to-cover by leaders shaping the next decade of their industry, turning demand scenarios, market dynamics and valuation benchmarks into decisions.
CXOs/ Presidents/ VPs/ Managers
M&A and Corporate Development
Strategy Teams and R&D Heads
Procurement and Product Directors
Regulatory and Compliance Leaders
Investor Relations and Equity Analysts