Market Minds Advisory
Anti-Ship Missile Systems Market

Anti-Ship Missile Systems Market: Anti-Ship Missile Systems Market: Magazine Depth Versus Unit Capability, Production Rate Reality and Why Inventory Is The Constraint

Navies have spent three decades buying increasingly capable missiles in decreasing quantities, and recent conflict has made magazine depth rather than unit performance the procurement question that now actually matters.

Lead Analyst

Published

September 2026

Make Smarter Decisions with Customized Research Insights

Request a free sample report and evaluate market opportunities, growth trends, and competitive dynamics relevant to your business needs.

2025 MARKET VALUE$6.2BMarket Size 2025
2036 FORECAST VALUE$13.6BBase Case , 2026 to 2036
CAGR 2026 TO 20367.4 %Bull 8.7% / Bear 6.1%
INCREMENTAL OPPORTUNITY$6.9BNet 10- year value creation
EXPANSION MULTIPLE2.03x2036 value over 2026 base
Strategic Levers
M&A Pipeline
Regional Outlook
Country Rankings
Competitive Intelligence
Segmental Deep-dive
Call-Us : 91 93563 13602

Executive Snapshot and Market Trajectory.

Three decades of procurement prioritised unit capability over inventory depth, and recent naval engagements have inverted that judgement entirely. A navy with forty highly capable missiles and no production line behind them is weaker than one holding several hundred adequate rounds with a factory still running. Requirement documents changed accordingly.
Containerised and coastal defence systems grow at 11.1%, half again the market rate of 7.4%, because they let a state contest sea lanes without a fleet to carry launchers. Extended-range subsonic cruise missiles follow at 9.2%. Legacy short-range systems grow slowest at 2.4%, retained mainly in navies where replacement funding has simply not arrived yet. Export control decides which states can acquire any of them.
Production rate rather than design capability is now the binding constraint across every major supplier. Solid rocket motor capacity, seeker assembly and final integration all run at rates set for peacetime replenishment, and around 19% of current orders carry delivery schedules extending beyond five years. Concentration is high at 58% held by the top five. Two decades of declining procurement removed capacity that nobody expected to need again, and rebuilding it takes years.
Market Definition
This market covers guided missile systems designed for the anti-surface naval role and the launchers and fire control directly associated with them, spanning subsonic sea-skimming missiles, extended-range subsonic cruise missiles, supersonic anti-ship missiles, containerised and coastal defence systems, legacy short-range systems, and air-launched anti-ship missiles. Sizing is at programme contract value. Air defence and anti-submarine weapons, naval guns and ammunition, torpedoes, and naval platform construction are excluded from scope.
Base Year Value
$6.2B in 2025 (MMA Primary Research Dataset, September 2026)
Forecast Period
2026 to 2036, eleven discrete annual values
CAGR
7.4% base case. Bull 8.7%. Bear 6.1%.
Fastest Growth Segment
Containerised And Coastal Defence Systems: 11.1% CAGR
Fastest Growth Country
India: 12.8% CAGR
Fastest Growth Region
South Asia and Pacific: 9.6% CAGR
Largest Region
East Asia: 31% of 2025 global value
Market Leaders
MBDA, Kongsberg Defence and Aerospace, RTX, Saab, Boeing Defense. Source: MMA Primary Research Dataset, July 2026.
Primary Survey
n=3,800 procurement and R&D decision-makers, Q4 2025, six countries
Methodology
Demand-side build-up, cross-validated against public data, 47 expert interviews

Anti-Ship Missile Systems Market Forecast Scenarios

anti-ship-missile-systems-market-size-forecast-scenario-1790025428034
Growth of 6.0% between 2020 and 2025 reflects a procurement reassessment that began before it was visible in contracts. Naval engagements from 2022 onward showed that anti-ship weapons remain decisive against surface vessels and that peacetime inventories empty quickly. Orders placed from 2023 reflect that lesson, though delivery schedules extend well beyond the period because capacity had been reduced for two decades.
Three mechanisms carry the base case. Containerised systems grow at 11.1% because they give states without large navies a credible sea denial capability at accessible cost. Indian demand expands at 12.8% on domestic programme development and indigenous production policy. Production capacity expansion is itself a revenue line, since several governments are funding facility investment directly rather than waiting for suppliers to build it against uncertain future orders. All three appear in awarded contract data already.
The bull case is sustained multi-year procurement commitment. Suppliers will expand solid rocket motor and seeker capacity against firm long-term orders and not against expressions of intent, and several states have begun signing the former. The bear case is budget reallocation toward other domains. Air and missile defence competes for the same funding, and a shift in threat assessment could redirect procurement quickly.

Inventory Or Capability

Procurement logic in this market has changed more in three years than in the preceding thirty. Navies spent decades buying fewer and more capable rounds on the assumption that precision substitutes for quantity, and recent engagements demonstrated that magazines empty faster than anybody planned and that production lines sized for peacetime cannot refill them. Around 19% of current orders now carry delivery schedules extending beyond five years. Nothing in the design of any round addresses that, because the constraint sits in a factory.
TOP FIVE CONCENTRATION58%Combined programme contract value share held by five largest suppliers
EXTENDED DELIVERY SHARE19%Current orders with schedules extending beyond five years
AVERAGE ROUND UNIT COSTUSD 2.4 millionWeighted programme cost per missile round across all types
MOTOR CAPACITY UTILISATION94%Solid rocket motor production running against available capacity
CONTAINERISED SYSTEM SHARE14%Portion of contract value in containerised and coastal configurations
PROGRAMME LEAD TIME7 yearsTypical interval from contract award to initial operational capability
The constraint sits in manufacturing rather than in design. Solid rocket motor production runs at roughly 94% of available capacity across the major suppliers, seeker assembly requires specialist labour that takes years to train, and final integration is deliberately slow because the product is a live weapon. None of those can be expanded quickly, and none was expanded during the period when orders were falling.
Containerised systems have changed who can participate in sea denial at all. At around 14% of contract value, they let a state contest shipping lanes from a truck bed rather than from a warship it cannot afford. Dispersed launchers are also far harder to find than a ship is.
"For thirty years the argument was that one excellent missile beats ten adequate ones, and then somebody actually fired them. What matters now is how many rounds a navy holds and whether the factory that made them is still running."
Director, Defence Systems and Naval Procurement Practice · MMA Defence Systems and Naval Procurement Practice · September 2026

Market Trends

Containerised Systems Democratise Sea Denial Capability

Containerised and coastal defence systems grow at 11.1% against 7.4% for the market because they separate anti-ship capability from naval platform ownership entirely. A state that cannot fund surface combatants can still contest shipping lanes from dispersed land-based launchers at a fraction of the cost, and the configuration is considerably harder to locate than a ship. That reaches around 14% of contract value and has changed the strategic calculation for coastal states across several regions simultaneously. Export control rather than cost is what limits which states can actually acquire the configuration, and that constraint is loosening slowly among aligned partners.
Market Impact: India grows at 12.8% annually

Magazine Depth Replaces Unit Capability In Requirements

Procurement documents have shifted from specifying maximum capability per round toward specifying inventory quantity and sustainable production rate, which is a reversal of thirty years of naval weapon requirement writing. Around 19% of current orders carry delivery schedules beyond five years precisely because the quantities requested exceed what existing lines can produce. Suppliers who can demonstrate rate rather than only performance are winning competitions that specification comparison alone would not have decided. That is a reversal of thirty years of requirement writing, and suppliers organised entirely around demonstrating capability are still adjusting to competitions decided on industrial grounds.
Market Impact: Utilisation runs at 94%

Market Opportunities and Growth Drivers

Indian Indigenous Programme Policy Drives Domestic Procurement

India grows fastest of any country covered at 12.8%, driven by indigenous development programmes and a procurement policy that weights domestic content heavily in naval weapon acquisition. The BrahMos programme and successor developments have built genuine domestic capability across propulsion, seekers and integration rather than assembling imported systems. Export interest from other regional states has followed, which makes India a supplier as well as a customer and changes the competitive position of established participants. Domestic content weighting in acquisition policy makes indigenous capability a procurement advantage rather than merely a strategic preference.
Market Impact: Motor lines run at 94%

Governments Fund Production Capacity Directly Now

Solid rocket motor and seeker capacity runs near 94% utilisation and cannot be expanded against uncertain future orders, which has led several governments to fund facility investment directly rather than waiting for suppliers to take the risk. That converts capacity expansion into a revenue line rather than a capital burden and changes the economics of committing to rate. Suppliers receiving that funding gain a durable advantage, because the capacity remains theirs once the programme concludes. Suppliers receiving that funding keep the facility once the programme concludes, which turns a customer subsidy into a durable competitive asset.
Market Impact: Controls apply across 100% of transfers

Market Restraints and Challenges

Production Capacity Cannot Expand At Order Speed

Solid rocket motor lines run near 94% utilisation, seeker assembly depends on specialist labour requiring years of training, and final integration of live weapons is deliberately slow, which means around 19% of orders carry schedules beyond five years. The root cause is two decades of declining procurement that removed capacity nobody expected to need again. Commercially it caps how fast revenue can convert from backlog. Mitigation runs to government-funded facility investment and multi-year firm commitments. Several governments have concluded that waiting for suppliers to take the risk is slower than funding the facility themselves.
Market Impact: Containerised reaches 14% of value

Export Control Restricts Which Customers Suppliers Reach

Anti-ship missile transfers sit under stringent export control and missile technology regimes in every supplying jurisdiction, which means a supplier's addressable customer set depends on political alignment rather than on capability or price. The root cause is proliferation concern applied to precision strike systems generally. Commercially it fragments the market into blocs and creates demand for indigenous programmes. Mitigation runs to licensed local production and co-development arrangements where political conditions permit them. Customers increasingly require industrial participation as a condition of award rather than accepting finished imports at all now.
Market Impact: Some 19% extend beyond 5 years
3 additional market trends, 4 additional growth drivers, and 2 additional restraints and challenges are covered in the full report. Contact sales@marketmindsadvisory.com to access the complete intelligence.

Segment CAGR and Growth Architecture

Segmentation follows system configuration, the dimension on which range, launch platform, unit cost and procurement route all divide together. Six configurations are assessed at programme contract value. Air defence and anti-submarine weapons, naval guns, torpedoes and platform construction sit outside the defined scope throughout. Production rate cuts across all six and constrains every one.
anti-ship-missile-systems-market-market-share-analysis-1790025428575

Containerised And Coastal Defence Systems

Containerised and coastal defence systems grow at 11.1%, half again the market rate of 7.4%, because they separate anti-ship capability from the requirement to own and operate surface combatants. A coastal state can contest shipping lanes from dispersed land-based launchers at a small fraction of what a comparable naval capability would cost, and dispersed truck-mounted systems are considerably harder to locate and neutralise than a warship. That configuration reaches around 14% of contract value and has changed strategic calculations for smaller navies across several regions at once. Export control remains the binding constraint on who can acquire them. Integration engineering rather than a new weapon programme is what it costs.
CAGR 11.1%

Extended-Range Subsonic Cruise Missiles

Extended-range subsonic cruise missiles grow at 9.2% because reach has become as important as terminal performance in a threat environment where surface vessels are held further from contested waters. Subsonic flight profiles also permit longer range within a given airframe and allow terrain-following or waypoint routing that a supersonic profile cannot sustain. Unit cost also sits well below supersonic alternatives, which matters considerably more now that procurement requirements specify quantity alongside capability. Production draws on the same solid rocket motor and seeker capacity that constrains everything else in this market. Motor allocation rather than design capability therefore determines who can actually deliver at the quantities that customers across the market are now requesting.
CAGR 9.2%
Full segment breakdown across 6 segments available in the complete report.

Regional Architecture and Country Demand Map

Shares record where systems are procured rather than where they are manufactured. East Asia sits above its standard band on regional naval competition, and Latin America below on limited naval weapon procurement budgets across the region. Both deviations carry a stated reason in the relevant regional paragraph concerned.

East Asia

At 31% this sits above the standard band because maritime territorial competition across the region has driven sustained naval weapon procurement for over a decade. Chinese domestic programmes account for a large share that sits largely outside internationally measured contract value, while Japanese, Korean and Taiwanese acquisition is substantial and increasingly domestic. Taiwan in particular has prioritised containerised coastal systems on exactly the sea denial logic driving that segment globally. Growth of 8.6% reflects sustained regional procurement rather than any single programme cycle. Korean suppliers including LIG Nex1 and Hanwha have built genuine indigenous capability and now compete in export markets from political positions that established Western participants cannot readily occupy.
Share: 31% | CAGR: 8.6% (2026 to 2036)

Western Europe

The 23% position sits inside the standard band and European procurement has accelerated sharply since 2022 as naval weapon inventories were reassessed against sustained conflict assumptions. MBDA, Kongsberg and Saab hold positions built on established programmes with genuine export records. European suppliers also benefit from being politically acceptable to customers that American export control complicates. Growth of 6.1% is the slowest of the seven regions, reflecting a mature installed base and production capacity that constrains how quickly new orders convert. Customers increasingly require industrial participation or licensed production as a condition of award, which favours the suppliers willing to transfer capability over those protecting it as a matter of national policy.
Share: 23% | CAGR: 6.1% (2026 to 2036)
Regional intelligence for 5 additional markets available in the complete report: North America, South Asia and Pacific, Middle East and Africa, Eastern Europe, Latin America. Contact sales@marketmindsadvisory.com.
anti-ship-missile-systems-market-country-cagr-analysis-1790025429132

Four Moves Worth Making Now

These four address a market where production rate has replaced unit capability as the procurement question, where capacity cannot expand against uncertain orders, and where export control decides addressable demand more than merit does. Each has been executed already. Two of the four are industrial and commercial decisions rather than engineering ones at all.

Quote Sustainable Production Rate Alongside Capability

Procurement documents now specify inventory quantity and sustainable rate, and around 19% of orders carry schedules beyond five years because requested quantities exceed line capacity. Presenting demonstrated and committed rate alongside performance costs a documentation and industrial planning exercise. Participants who did report win rates rising roughly 2.2 times on competitions where quantity was specified, because they answer the requirement as actually written rather than as historically understood. Suppliers organised around demonstrating capability are still learning to compete on industrial grounds, which leaves the position available to whoever adjusts first.
Market Impact: Competition win rates rise roughly 2.2 times higher

Secure Government Funding For Capacity Expansion

Solid rocket motor and seeker capacity runs near 94% utilisation and cannot be expanded against uncertain future orders, which is why several governments now fund facility investment directly. Structuring those arrangements costs negotiation and industrial commitment rather than capital. Participants who secured them report capacity rising roughly 2.6 times without corresponding balance sheet exposure, and the facilities remain theirs once the funding programme concludes. Two decades of declining procurement showed exactly what happens to capacity that gets built against uncertain demand, which is precisely why nobody will take that risk again unaided.
Market Impact: Production capacity rises roughly 2.6 times without exposure

Build Licensed Local Production Where Politics Permit

Export control fragments addressable demand into political blocs, and several states funding indigenous programmes would accept licensed local production instead if it were offered on acceptable terms. Structuring those arrangements costs licensing negotiation and technology transfer governance. Participants who built them report addressable programme value rising roughly 2.4 times in restricted markets, reaching procurement that direct export would never have been permitted to serve at all. Several states funding indigenous programmes would accept licensed production instead if anybody offered acceptable terms, which makes this a reachable market rather than a closed one.
Market Impact: Addressable programme value rises roughly 2.4 times over

Offer Containerised Configurations To Coastal States

Containerised systems reach around 14% of contract value and grow at 11.1% because they give states without surface combatants a credible sea denial capability from dispersed land launchers. Adapting an existing missile to a containerised launcher costs integration engineering rather than a new weapon programme. Participants who offered it report new customer states rising roughly 3.1 times against their naval-platform-only addressable set, which is a genuine market expansion. Dispersed land launchers are also considerably harder to locate than a warship, which is a capability argument as much as a cost one for the states acquiring them.
Market Impact: New customer states rise roughly 3.1 times higher

Who Controls the Margin Pool

Concentration is high at 58% held by the top five, measured consistently on programme contract value rather than round quantity, which would distort comparison between high-unit-cost supersonic systems and volume subsonic production. The leader to challenger gap rests on qualified production capacity and national export authorisation, neither of which a new entrant can assemble regardless of engineering capability or available capital.
Competition runs on three dimensions currently. Demonstrated production rate decides competitions where quantity is specified, which is an increasing share of them. Export authorisation decides which customers a supplier can approach at all, independent of technical merit. Integration compatibility decides retrofit programmes, since a missile fitting existing launchers and fire control avoids platform modification that frequently costs more than the weapons.

Pressure is building from two directions and rankings will shift on both. Indian and Korean suppliers with genuine indigenous capability are entering export competitions from political positions that established participants cannot occupy, particularly with states seeking supplier diversification. Meanwhile customers increasingly require industrial participation or licensed production as a condition of award, which favours suppliers willing to transfer capability over those protecting it.
anti-ship-missile-systems-market-company-positioning-matrix-1790025429658

Competitive Moat and Risk Dimensions

MBDA

Moat: European Programme Integration Position

Multinational European ownership gives access to several national procurement processes simultaneously and produces political acceptability with customers wary of American export control, while integration across European naval platforms makes the company a default rather than a contender in many competitions. Replicating that structure is effectively impossible.
MBDA

Risk: Production Rate Capacity Constraint

Order growth since 2022 exceeds what existing production capacity can convert, and expanding solid rocket motor and seeker output requires either government funding or balance sheet risk against orders that have not yet been firmly committed. Competitors securing capacity funding first gain durable advantage. Timing matters more than scale.
KONGSBERG DEFENCE AND AEROSPACE

Moat: Export Record And Interoperability

An established anti-ship missile with a broad export customer base and demonstrated integration across many naval and air platforms creates a position built on proven fit rather than on specification claims, which matters enormously in retrofit competitions where platform modification cost dominates. Proven fit is worth more than specification claims.
KONGSBERG DEFENCE AND AEROSPACE

Risk: Single Programme Concentration Risk

A position concentrated in one principal weapon family means the company's competitive standing tracks that programme's continued relevance closely. A shift in requirement toward longer range or supersonic profiles would require development investment that a broader portfolio would absorb more comfortably. Portfolio breadth would absorb it better.

Players Tracked

Prominent Players

MBDA
Kongsberg Defence and Aerospace
RTX
Saab
Boeing Defense

Other Key Players

Lockheed Martin
Mitsubishi Heavy Industries
LIG Nex1
Hanwha Systems
BrahMos Aerospace
Bharat Dynamics
Roketsan
Aselsan
IAI
Rafael Advanced Defense Systems
Naval Group
Leonardo
Norinco
Hyundai Heavy Industries
Kawasaki Heavy Industries

Recent Developments

MARCH 2025

Kongsberg expands solid rocket motor production capacity

The company added missile production capacity supported by government facility funding rather than carrying the investment against uncertain future orders. This was a capacity expansion programme with government co-funding rather than an acquisition, joint venture or licensing arrangement of any kind. The facility remains company owned throughout and afterwards.
Signal: Governments are funding capacity because suppliers cannot risk it alone. The facility remains theirs once the programme concludes entirely.
SEPTEMBER 2024

BrahMos Aerospace secures export order from regional state

The Indian joint venture concluded an export contract with a Southeast Asian customer, establishing India as a supplier of anti-ship capability alongside its domestic programme. This was an export contract award rather than a merger, acquisition or new joint venture arrangement. Domestic programme deliveries continued unchanged alongside the export contract.
Signal: Supplier diversification is opening competitions incumbents assumed were closed. Customers now have a credible alternative authorisation regime available.
JUNE 2025

MBDA agrees licensed local production with Gulf customer

The company concluded a licensed assembly and progressive local content arrangement with a Gulf state, reaching procurement that direct export alone would not have satisfied. This was a licensing and technology transfer agreement with no equity component or acquisition involved. Final integration transitions progressively to the customer nation.
Signal: Industrial participation is becoming a condition rather than a concession. Suppliers protecting capability are losing awards to those transferring it.

What A Round Costs

Propulsion and guidance dominate and integration takes longer than either. Solid rocket motor and propulsion run roughly 24% of unit production cost, seeker and guidance electronics about 29%, and warhead and fusing around 11%. Airframe and control surfaces take a further 14%. Final integration, test and acceptance absorb approximately 18%, which is high because the product is a live weapon assembled under controlled conditions.
Specialist material and component costs rose sharply through 2021 and 2022 alongside broader supply chain disruption, with ammonium perchlorate and other specialist propellant ingredients particularly affected, a movement the EIA documents across chemical feedstock reporting and the US Census Bureau records in defence component trade data. Several suppliers reported schedule extension rather than cost increases, since defence contracts typically price on milestones rather than on inputs.

Exposure divides by production rate and by supply chain depth rather than by company size. Suppliers running near capacity carry no ability to absorb demand surges without schedule extension, which converts commercial exposure into delivery risk. Participants with in-house propulsion capability avoid a supply bottleneck that constrains those buying motors externally. Export control compliance overhead falls on every supplier operating across multiple national authorisation regimes.
anti-ship-missile-systems-market-cost-volatility-analysis-1790025429855

Secure multi-year firm orders before expanding capacity

Solid rocket motor and seeker capacity cannot be expanded against expressions of intent, and two decades of declining procurement demonstrated what happens to capacity built against uncertain demand. Firm multi-year commitments or government facility funding both transfer that risk appropriately. The obstacle is that procurement cycles rarely commit on the timescale capacity investment requires.

Bring propulsion capability in house where possible

Solid rocket motor supply constrains production across the whole market, and suppliers buying motors externally compete for allocation against everybody else drawing on the same limited capacity. In-house propulsion removes that bottleneck. The requirement is substantial capital and regulatory qualification for energetic materials handling, which few participants can justify. Very few participants can justify that investment.

Train seeker assembly labour ahead of programme award

Seeker assembly requires specialist skills that take years to develop and cannot be recruited quickly when an order arrives, which makes labour rather than equipment the practical capacity limit. Training ahead of award carries payroll cost against uncertain work. The alternative is accepting delivery schedules that lose competitions where quantity and rate are specified.

Portfolio Architecture for Margin Defence

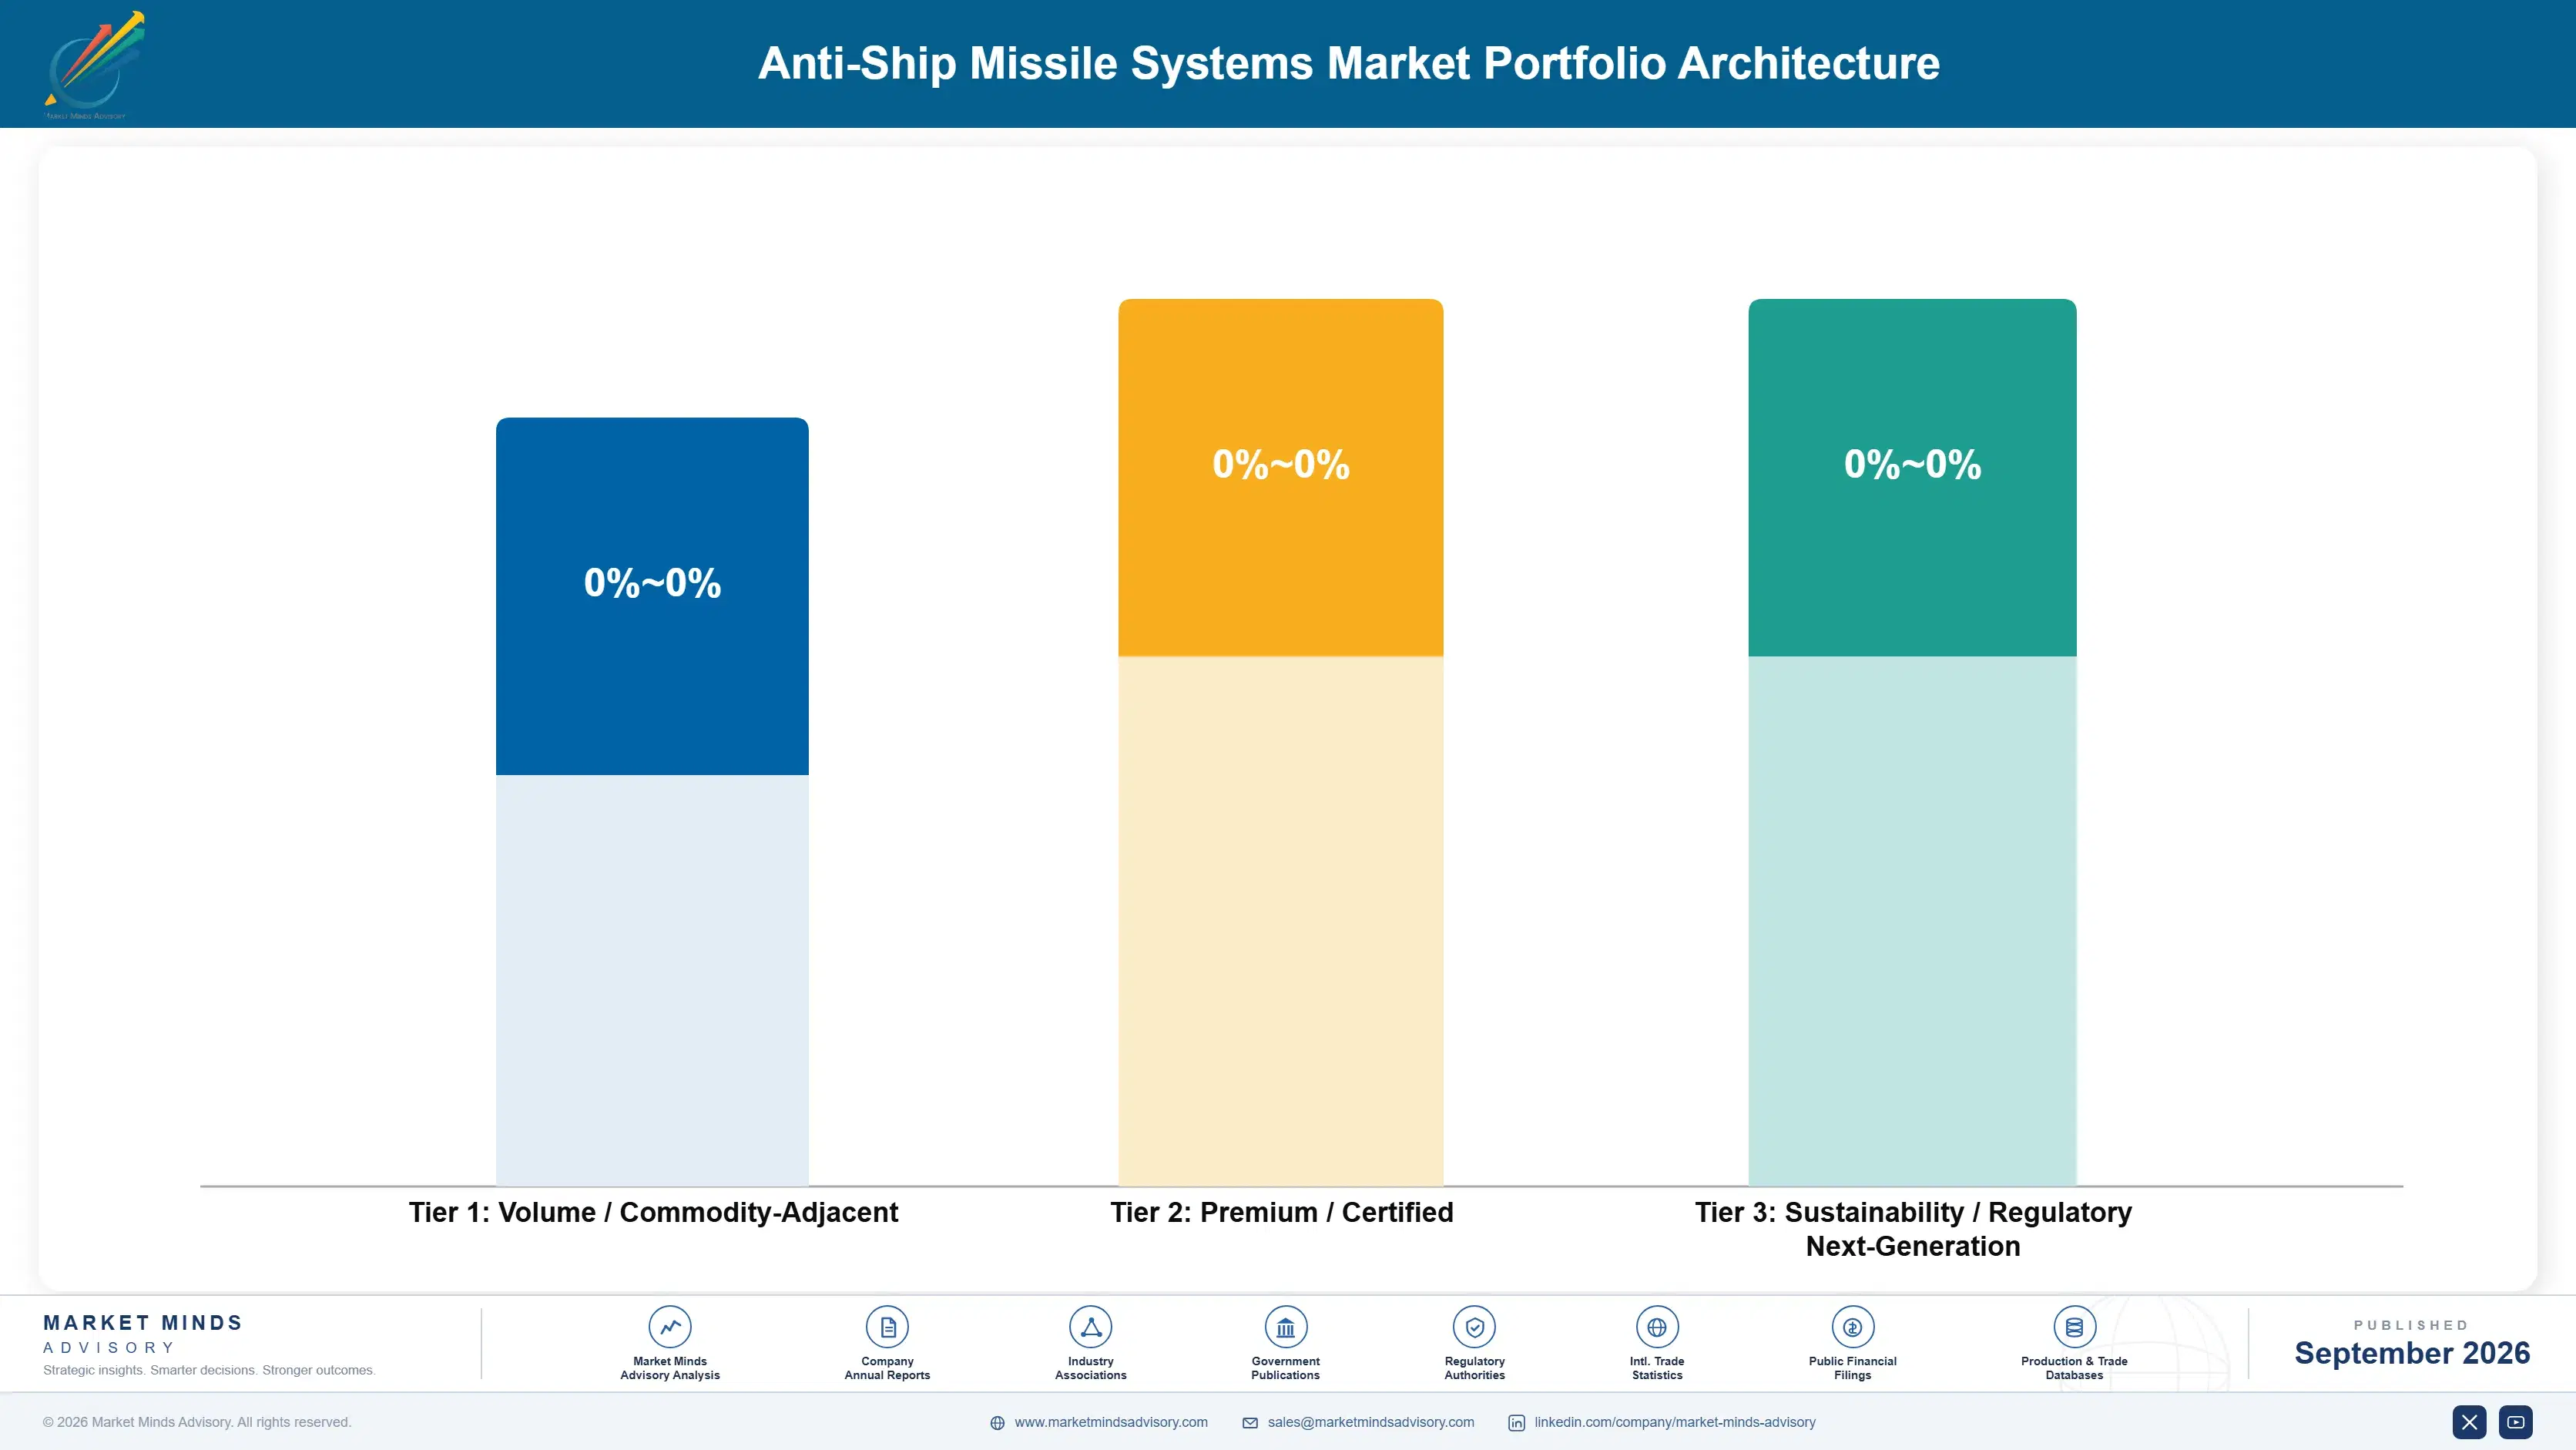
Margin architecture divides by programme structure rather than by weapon capability, which a specification comparison would not predict. Legacy short-range system sustainment and spares run at gross margins in the high teens to high twenties, supporting inventory that customers retain because replacement funding has not arrived rather than because the capability is preferred. Nothing about that revenue builds a position for the next competition.
Subsonic sea-skimming and extended-range cruise missile production holds gross margins in the mid twenties to mid thirties. The spread reflects how differently domestic and export programmes carry development amortisation and compliance cost. Volume production improves those economics genuinely, which is one reason suppliers now favour quantity-specified competitions over bespoke capability ones. Solid rocket motor allocation constrains how much of that volume any supplier can convert into deliveries on schedule.

The highest-value pool is supersonic systems and containerised integration programmes, at margins in the mid thirties to mid forties. Supersonic development carries high unit cost against limited quantity; containerised integration earns margin on engineering rather than hardware. Legacy sustainment carries revenue and customer relationships. It funds nothing that builds a future competitive position. Customer relationships are the argument for keeping sustainment, and they are genuinely real.

Volume / Commodity-Adjacent

Legacy short-range system sustainment and spares, supporting inventory retained because replacement funding has not arrived. The ten point range reflects how differently sustainment contracts are structured across customers. Replacement funding eventually arrives and ends it.
Gross Margin: 18 to 28%

Premium / Certified

Subsonic sea-skimming and extended-range cruise missile production. Volume improves these economics genuinely, which is one reason suppliers now favour quantity-specified competitions over bespoke capability ones. Motor allocation limits how much can be converted.
Gross Margin: 25 to 35%

Sustainability / Regulatory / Next-Generation

Supersonic systems and containerised integration programmes. Supersonic carries high unit cost against limited quantity; containerised integration earns its margin on engineering rather than on hardware. Both serve customers that platform-based systems cannot reach.
Gross Margin: 34 to 45%
anti-ship-missile-systems-market-portfolio-architecture-1790025430383

High-value Sub-segments and Strategic Watch-out

Containerised And Coastal Systems

Fastest growth at 11.1% and the configuration that separates anti-ship capability from fleet ownership entirely. Export control rather than cost is what limits which states can actually acquire them. Integration engineering rather than an entirely new weapon programme is what this configuration actually costs to develop.
Gross Margin: 36 to 45%

Supersonic Anti-Ship Missiles

High value with high unit cost against limited procurement quantity. Terminal performance remains the argument, though quantity-specified requirements increasingly favour subsonic alternatives available at far lower unit cost. Development cost amortises across procurement quantities that rarely justify the investment commercially on their own at all.
Gross Margin: 34 to 43%

Subsonic Sea-Skimming Missiles

Volume core across most navies and the configuration where production rate competition is fiercest. Solid rocket motor allocation rather than design capability determines who can deliver at the quantities requested. Suppliers holding in-house propulsion capability avoid competing for that scarce allocation entirely with everybody else here.
Gross Margin: 26 to 34%

Legacy Short-Range Systems

Strategic watch-out. Growing slowest at 2.4% and retained largely because the replacement funding has not yet arrived anywhere. The fourteen point range reflects how differently sustainment contracts are structured between customers. The revenue funds nothing at all that builds any future competitive position for the supplier concerned.
Gross Margin: 16 to 30%

How Programmes Actually Commit

Procurement here commits in single large decisions separated by many years, which makes each competition disproportionately consequential. A navy selecting an anti-ship missile integrates it into launchers, fire control and training across a fleet, and that installed position holds for decades because changing it means modifying platforms rather than swapping a weapon. Programme lead times of around seven years from award to operational capability reinforce that further.
Stickiness varies sharply by integration depth. A weapon fitted to existing launchers and fire control creates an extremely durable position, since a competitor must fund platform modification that frequently exceeds the cost of the missiles themselves. Containerised systems are considerably less sticky, because a land-based launcher carries no platform integration burden and can be replaced between procurement cycles without touching a ship.

Buyer requirements have changed fundamentally since 2022. Procurement documents now specify inventory quantity and sustainable production rate alongside performance, where they previously specified capability almost exclusively. That is a reversal of thirty years of requirement writing, and suppliers organised entirely around demonstrating capability are still adjusting to competitions decided on industrial rather than technical grounds. The adjustment is organisational rather than technical.
anti-ship-missile-systems-market-end-use-penetration-index-1790025430875

Where Rate Decides Awards

These are among the four positions where our research anticipates prominent divergence between winners and laggards over the coming forecast period. Each is grounded in the demand model, the regulatory perimeter, and the announced capacity pipeline.
01 / PRODUCTION RATE DEMONSTRATION

Quote the rate, not only the range

Procurement documents now specify inventory quantity and sustainable production rate, and around 19% of current orders carry delivery schedules beyond five years because requested quantities exceed existing line capacity. Presenting demonstrated and committed rate alongside performance costs a documentation and industrial planning exercise rather than development. Participants who did it report win rates rising roughly 2.2 times on competitions where quantity was specified, because they answer the requirement as written, and suppliers built around capability are still adjusting to that.
02 / CAPACITY FUNDING STRUCTURE

Let the customer fund the factory

Solid rocket motor and seeker capacity runs near 94% utilisation and cannot be expanded against uncertain future orders, which is precisely why several governments now fund facility investment directly instead. Structuring those arrangements costs negotiation and industrial commitment rather than any capital deployment at all. Participants who secured them report capacity rising roughly 2.6 times without corresponding balance sheet exposure, and the facilities remain theirs once the funding programme finally concludes, which turns a customer subsidy into a durable competitive asset.
03 / LICENSED PRODUCTION OFFERING

Transfer capability to reach the order

Export control fragments addressable demand into political blocs, and several states currently funding indigenous programmes would accept licensed local production instead if it were offered on acceptable commercial terms. Structuring those arrangements costs licensing negotiation and technology transfer governance rather than any product development. Participants who have built them report addressable programme value rising roughly 2.4 times in restricted markets, reaching procurement that direct export could never have served, and industrial participation is increasingly a condition rather than a concession.
04 / CONTAINERISED CONFIGURATION DEVELOPMENT

Sell capability to states without fleets

Containerised systems reach around 14% of contract value and grow at 11.1% because they give states without surface combatants a credible sea denial capability from dispersed land-based launchers. Adapting an existing missile to a containerised launcher costs integration engineering rather than an entirely new weapon programme of any kind. Participants who offered it report new customer states rising roughly 3.1 times against their naval-platform-only addressable set, which is genuine market expansion, and dispersed launchers are considerably harder to locate than warships.

Engagement Snapshot From the Field

A live engagement with an industry participant carrying material or product regulatory and market exposure ahead of a defining policy shift, showing how our research translates into a defensible multi-year portfolio strategy.
MARKET MINDS ADVISORY · CLIENT ENGAGEMENT SUMMARY
Anti-Ship Missile Systems Producer Strategic Portfolio Review and Transition Roadmap 2026·Investment Scenario on Anti-Ship Missile Systems Exposure Evaluation 2025-26
CLIENT PROFILE
A European guided weapon supplier with anti-ship programme revenue near USD 640 million (client-reported, unverified by MMA), weighted approximately 77% to subsonic production and 23% to legacy sustainment. Solid rocket motors were procured externally. No containerised configuration existed and capacity expansion had been deferred pending firm orders that had not arrived. Motor allocation priority had never been contractually secured.
STRATEGIC CHALLENGE
Order intake had risen sharply since 2023 while deliveries could not accelerate, and management treated the resulting backlog as a positive indicator. Several competitions had been lost without the reason being examined. A capacity expansion business case had been rejected twice on the grounds that future order volume was uncertain.
MMA APPROACH
MMA reviewed 22 lost competitions against stated evaluation criteria, separating rate and quantity criteria from technical ones. Production constraints were traced through the supply chain to identify the binding limitation. Government capacity funding mechanisms were mapped across four customer nations, and containerised integration cost was estimated against existing designs. Findings were reconciled against award records.
KEY FINDINGS
  1. Lost competitions divided as 55% on delivery schedule and sustainable rate against 18% on technical performance, which management had assumed decided most awards.
  2. Externally procured solid rocket motors were the binding constraint, with the client holding allocation priority below two competitors drawing on the same supplier.
  3. Three of four mapped customer nations operated capacity co-funding mechanisms the client had never applied to, and two were actively seeking suppliers to fund.
  4. Containerised integration of the existing missile was estimated at under 4% of a new weapon programme cost, opening addressable demand among six coastal states.
CLIENT PROFILE
A European guided weapon supplier with anti-ship programme revenue near USD 640 million (client-reported, unverified by MMA), weighted approximately 77% to subsonic production and 23% to legacy sustainment. Solid rocket motors were procured externally. No containerised configuration existed and capacity expansion had been deferred pending firm orders that had not arrived. Motor allocation priority had never been contractually secured.
STRATEGIC CHALLENGE
Order intake had risen sharply since 2023 while deliveries could not accelerate, and management treated the resulting backlog as a positive indicator. Several competitions had been lost without the reason being examined. A capacity expansion business case had been rejected twice on the grounds that future order volume was uncertain.
MMA APPROACH
MMA reviewed 22 lost competitions against stated evaluation criteria, separating rate and quantity criteria from technical ones. Production constraints were traced through the supply chain to identify the binding limitation. Government capacity funding mechanisms were mapped across four customer nations, and containerised integration cost was estimated against existing designs. Findings were reconciled against award records.
KEY FINDINGS
  1. Lost competitions divided as 55% on delivery schedule and sustainable rate against 18% on technical performance, which management had assumed decided most awards.
  2. Externally procured solid rocket motors were the binding constraint, with the client holding allocation priority below two competitors drawing on the same supplier.
  3. Three of four mapped customer nations operated capacity co-funding mechanisms the client had never applied to, and two were actively seeking suppliers to fund.
  4. Containerised integration of the existing missile was estimated at under 4% of a new weapon programme cost, opening addressable demand among six coastal states.
RECOMMENDED STRATEGY
Phase 1: Phase one: apply to customer nation capacity co-funding mechanisms and secure motor supply allocation contractually. Two nations were actively seeking suppliers. Phase 2: Phase two: rebuild competition responses around demonstrated and committed production rate alongside performance data. The technical case was never the problem. Phase 3: Phase three: develop a containerised configuration from the existing missile for coastal state procurement. At least six coastal states become addressable.
OUTCOME
Two capacity co-funding arrangements were concluded within four quarters, removing the expansion business case from the client's own balance sheet (client-reported, unverified by MMA). Competition win rates improved materially once responses led on rate, and the containerised configuration reached first contract with a coastal state within eighteen months.

Frequently Asked Questions

Foundational context covering the market sizes, CAGR, scope, country, region and competition that inform every finding below. This section is provided to cover basics and most often pre-purchase conversations, answered from the MMA Primary Research Dataset.

What is the current size of the Anti-Ship Missile Systems Market?

The market was valued at USD 6.2 billion in 2025, rising to USD 6.7 billion in 2026. Sizing is at programme contract value across six system configurations.

How large will the Anti-Ship Missile Systems Market be by 2036?

MMA forecasts USD 13.6 billion by 2036, an increase of USD 6.9 billion over the 2026 base. That represents expansion of 2.03 times across the forecast period.

What is the CAGR for the Anti-Ship Missile Systems Market 2026 to 2036?

The base case CAGR is 7.4%, with a bull case of 8.7% and a bear case of 6.1%. Historical growth between 2020 and 2025 ran at 6.0%.

Which segment is growing fastest?

Containerised and coastal defence systems grow at 11.1%, half again the market rate, by separating capability from fleet ownership. Extended-range cruise missiles follow at 9.2%.

Who are the major companies in the Anti-Ship Missile Systems Market?

MBDA, Kongsberg, RTX, Saab and Boeing Defense lead on programme contract value, holding a combined 58%. Qualified production capacity and export authorisation separate them, and Indian and Korean suppliers now compete for export awards.

Which country is growing fastest?

India grows fastest at 12.8%, on indigenous programme development and procurement policy weighting domestic content heavily in naval weapon acquisition. Export interest from regional states has followed the domestic programme.

Report Segmentation Architecture

The full report scope spans multiple orthogonal segmentation dimensions, with cross-tabulated demand data provided for each dimension pair. Coverage extends further to regional breakdowns, trend trajectories, and the competitive detail needed to support segment-level decision-making.

By System Configuration

  • Subsonic Sea-Skimming Missiles
  • Extended-Range Subsonic Cruise Missiles
  • Supersonic Anti-Ship Missiles
  • Containerised and Coastal Defence Systems
  • Legacy Short-Range Systems
  • Air-Launched Anti-Ship Missiles

By End-Use Platform

  • Surface Combatant Vessels
  • Submarine Launched Application
  • Fast Attack and Patrol Craft
  • Maritime Patrol Aircraft
  • Land-Based Coastal Batteries
  • Combat Aircraft Integration

By Commercial Dimension

  • Domestic Government Procurement
  • Government to Government Export
  • Direct Commercial Export Sale
  • Licensed Local Production
  • Co-Development Programmes
  • Sustainment and Inventory Support

By Region

  • East Asia
  • Western Europe
  • North America
  • South Asia and Pacific
  • Middle East and Africa
  • Eastern Europe
  • Latin America

Scope, Methodology, and Coverage

Every figure in this report is reproducible from documented input assumptions. The scope below maps the historical period, the forecast horizon, the segmentation dimensions, and the countries covered, alongside the underlying primary and qualitative methodology.
Historical Period
2020 to 2025
Forecast Period
2026 to 2036
Base Year
2025 (USD billions; MMA Primary Research Dataset, September 2026)
Market Definition
This market covers guided missile systems designed for the anti-surface naval role and the launchers and fire control directly associated with them, spanning subsonic sea-skimming missiles, extended-range subsonic cruise missiles, supersonic anti-ship missiles, containerised and coastal defence systems, legacy short-range systems, and air-launched anti-ship missiles. Sizing is at programme contract value across domestic procurement, government export, commercial export, licensed production, co-development and sustainment channels. Air defence and anti-submarine weapons, naval guns and ammunition, torpedoes, and naval platform construction are excluded from scope throughout.
Quantitative Units
USD billions at programme contract value; volume in rounds contracted; capacity in rounds per year of production.
Segmentation Dimensions
System configuration, end-use platform, commercial dimension, and geographic region.
Regions Covered
East Asia, Western Europe, North America, South Asia and Pacific, Middle East and Africa, Eastern Europe, Latin America
Countries Covered
China, United States, India, Norway, Japan, Saudi Arabia
Key Companies Profiled
MBDA, Kongsberg Defence and Aerospace, RTX, Saab, Boeing Defense, Lockheed Martin, Mitsubishi Heavy Industries, LIG Nex1, Hanwha Systems, BrahMos Aerospace, Bharat Dynamics, Roketsan, Aselsan, IAI, Rafael Advanced Defense Systems, Naval Group, Leonardo, Norinco, Hyundai Heavy Industries, Kawasaki Heavy Industries
Quantitative Methodology
Primary survey, n=3,800 respondents, Q4 2025, six countries; demand-side model with trade association cross-validation
Qualitative Methodology
47 expert interviews, Q4 2025; applied to validate demand model assumptions, identify emerging dynamics, and assess competitive positioning
Report Format
PDF and XLSX data workbook (Word format preview document)
Publisher
Market Minds Advisory
Report Code
MMA-2026-CON-822
Published
September 2026
Contact
sales@marketmindsadvisory.com | www.marketmindsadvisory.com

Purchase the full Anti-Ship Missile Systems Market Report (2026 to 2036).

The full report sizes the anti-ship missile systems market across six system configurations, six end-use platforms and six commercial dimensions for all seven global regions through 2036. It reviews lost competitions against stated evaluation criteria, separating production rate and quantity losses from technical performance ones. Production constraints are traced through supply chains to identify the binding limitation rather than the reported one. Government capacity co-funding mechanisms are mapped across customer nations. Competitive assessment covers 20 participants on a consistent programme contract value basis across every region examined.
Lost competitions reviewed against stated evaluation criteria
Production constraints traced to the binding supply limitation
Government capacity co-funding mechanisms mapped by nation
Export control exposure assessed by supplier and customer
Six system configurations sized through 2036
Twenty participants assessed on programme contract value

Built For The People Who Decide

From boardroom strategy to bench-side execution, this report is read cover-to-cover by leaders shaping the next decade of their industry, turning demand scenarios, market dynamics and valuation benchmarks into decisions.
CXOs/ Presidents/ VPs/ Managers
M&A and Corporate Development
Strategy Teams and R&D Heads
Procurement and Product Directors
Regulatory and Compliance Leaders
Investor Relations and Equity Analysts