Market Minds Advisory
Anti Aging Market

Anti Aging Market: One Consumer, Four Regulatory Regimes

One consumer, four regulatory regimes: a cosmetic claim, a food supplement, a medical device and a prescription drug all sell the same promise, and the evidence each must carry differs by orders of magnitude.

Lead Analyst

Published

September 2026

Make Smarter Decisions with Customized Research Insights

Request a free sample report and evaluate market opportunities, growth trends, and competitive dynamics relevant to your business needs.

2025 MARKET VALUE$78.4BMarket Size 2025
2036 FORECAST VALUE$194.2BBase Case , 2026 to 2036
CAGR 2026 TO 20368.6 %Bull 9.8% / Bear 7.4%
INCREMENTAL OPPORTUNITY$109.1BNet 10- year value creation
EXPANSION MULTIPLE2.28x2036 value over 2026 base
Strategic Levers
M&A Pipeline
Regional Outlook
Country Rankings
Competitive Intelligence
Segmental Deep-dive
Call-Us : 91 93563 13602

Executive Snapshot and Market Trajectory

The category is quietly changing what it sells. For 30 years it sold the appearance of youth; increasingly it sells a measured biological age, and that shift moves authority from marketing departments to clinical evidence nobody in cosmetics has ever had to produce. Cosmetics has never needed proof before.
East Asia holds 34% of value, driven by aesthetic procedure rates in Korea that no other country approaches and by Chinese demand growing from a base that was negligible a decade ago. Oral longevity supplements grow at 12.9%, half again the market rate of 8.6%, as NAD precursors and senolytic candidates move from research into retail. Injectables remain the profit engine everywhere. Nothing else funds a clinic the way a toxin appointment does.
Concentration is low at 21% because no company competes across all four regulatory regimes at once, and most do not try. Korean toxin manufacturers have collapsed pricing in emerging markets while Western brands defend on clinical dossiers. GLP-1 weight loss drugs created a volume-restoration demand nobody forecast. The winners are firms holding both a prescription franchise and a consumer brand, and there are not many.
Market Definition
The market covers products and procedures whose primary claim is delaying, reducing or reversing the visible and measurable effects of ageing, including topical cosmeceuticals, injectable neuromodulators, dermal fillers and biostimulators, energy-based aesthetic devices, oral longevity supplements and regenerative therapies. General skincare, sun protection, hair loss treatment, surgical procedures and hormone replacement prescribed for endocrine indications are excluded. Clinic operations and practitioner training fall outside scope.
Base Year Value
$78.4B in 2025 (MMA Primary Research Dataset, August 2026)
Forecast Period
2026 to 2036, eleven discrete annual values
CAGR
8.6% base case. Bull 9.8%. Bear 7.4%.
Fastest Growth Segment
Oral Longevity Supplements: 12.9% CAGR
Fastest Growth Country
China: 12.2% CAGR
Fastest Growth Region
South Asia and Pacific: 10.8% CAGR
Largest Region
East Asia: 34% of 2025 global value
Market Leaders
L'Oreal, AbbVie, Galderma, Beiersdorf, Estee Lauder. Source: MMA Analysis based on disclosed aesthetics and skincare segment revenue, company annual reports 2025.
Primary Survey
n=3,800 procurement and R&D decision-makers, Q4 2025, six countries
Methodology
Demand-side build-up, cross-validated against public data, 47 expert interviews

Anti Aging Market Forecast Scenarios

anti-aging-market-size-forecast-scenario-1787676757923
The 2020 to 2025 period compounded at 7.2%, and the pandemic did something nobody expected. Video calls made people study their own faces for hours a day, and aesthetic bookings rebounded far past pre-2020 levels once clinics reopened. Topical sales grew more slowly, squeezed between mass brands and clinical alternatives. Supplements arrived late and grew fastest from almost nothing.
The 8.6% base case rests on three mechanisms. GLP-1 receptor agonists prescribed for weight loss produce facial volume loss that pushes patients toward fillers and biostimulators, a demand stream that did not exist in 2020 and now shows in every clinic booking system. Biological age testing is moving from research into consumer channels, which gives supplement brands a measurable claim they never had. And aesthetic procedure rates keep rising in markets where they were culturally resisted five years ago.
The bull case at 9.8% turns on a senolytic compound clearing a credible clinical endpoint, which would legitimise the entire longevity supplement category overnight. The bear case at 7.4% is a filler safety event: delayed-onset nodules or vascular occlusion at scale would trigger regulatory tightening that clinics could not absorb quickly. Neither of those scenarios is far-fetched.

Four Regulatory Regimes, One Consumer Wallet

A woman buying a retinol serum, a collagen supplement, a filler appointment and a laser session is treating one concern with four products regulated under four different laws. The cosmetic needs no proof. The supplement needs safety and a carefully hedged claim. The device needs clearance. The toxin needs a full drug approval. Margins run in roughly that order too, and so does defensibility.
FIVE-FIRM CONCENTRATION21%Share of aesthetics and skincare revenue held by leaders
AVERAGE TOXIN PRICE$9.40Typical clinic cost per unit of botulinum toxin
TOP CONSUMING COUNTRYKorea 14%Korean share of global aesthetic procedures performed annually
REPEAT TREATMENT INTERVAL4.2 monthsMedian gap between neuromodulator appointments for regular patients
TRIAL COST SHARE17%Portion of injectable revenue reinvested in clinical evidence
PRACTITIONER DENSITY84 per millionQualified aesthetic injectors serving each million adults nationally
Injectables are where the money is and where the risk sits. A neuromodulator patient returns every 4.2 months for years, which is the best repeat economics in aesthetics and better than most pharmaceutical franchises. Korean manufacturers have driven per-unit pricing down sharply in emerging markets, and Western brands have responded by competing on training, dossiers and complication support rather than on price.
The longevity supplement wave is the interesting part and the least resolved. NAD precursors, senolytics and rapamycin analogues all carry real research behind them and none carries an approved anti-ageing indication anywhere. Brands sell them on biomarker panels rather than on outcomes, which is a claim structure regulators have not yet decided how to treat. That ambiguity is worth a great deal to whoever is still standing when it closes.
"The industry spent decades selling hope against a mirror. It is now being asked to sell against a blood test, and most of it has no idea how badly that goes."
Director, Aesthetics and Longevity Practice · MMA Healthcare Practice · August 2026

Market Trends

GLP-1 Weight Loss Creates Facial Volume Demand

Rapid weight loss on semaglutide and tirzepatide takes fat from the face along with everywhere else, and the result reads as ageing rather than as slimness. Clinics reported the pattern before anyone published on it. Filler and biostimulator bookings from patients on GLP-1 therapy now represent a meaningful share of new volume-restoration appointments in North America and Western Europe. The demographic is different too: these patients are younger, more male and arriving through a medical referral rather than through cosmetic marketing. Nobody in the category forecast this stream two years ago.
Market Impact: Cuts unit pricing by 43%

Biological Age Testing Enters Consumer Retail Channels

Epigenetic clocks measuring DNA methylation started as research instruments and now sell direct to consumers for a few hundred dollars. The science behind them is genuine and the consumer interpretation is not always careful. What matters commercially is that a supplement brand can now show a before-and-after number instead of a testimonial, which changes the entire selling proposition of a category built on faith. Regulators have not decided whether a biological age improvement constitutes a health claim. Until they do, brands are running the argument at full volume and building customer bases on it.
Market Impact: Raises male share to 22%

Market Opportunities and Growth Drivers

Korean Toxin Exports Reset Pricing In Emerging Markets

Hugel, Medytox and their domestic competitors built botulinum toxin manufacturing at costs Western producers cannot match, and they have taken large positions across Southeast Asia, Latin America and the Middle East. Per-unit clinic pricing in those markets sits well below European levels. The effect on volume is the point: procedures that were unaffordable become routine, and the total number of treated patients grows faster than the revenue does. Western manufacturers are not competing on price and mostly cannot. They compete on regulatory dossiers, injector training and complication management, which works in markets where liability matters.
Market Impact: Limits claims on 92% of topicals

Male Patients Enter Aesthetics At Unprecedented Rates

Male share of neuromodulator procedures has climbed steadily and shows no sign of stalling, driven partly by video call self-scrutiny and partly by the GLP-1 cohort arriving through weight management rather than cosmetics. Men present differently: they want less change, they research more before booking and they are considerably more price-sensitive once they do. Clinics that built their marketing entirely around female patients are learning this slowly. Product implications follow, since male facial musculature requires higher dosing, which improves per-appointment revenue for the same chair time. That arithmetic is doing quiet work.
Market Impact: Caps volume at 84 injectors

Market Restraints and Challenges

Cosmetic Claim Rules Limit What Topicals Can Say

A cosmetic cannot claim to affect the structure or function of the body, which is precisely what an effective anti-ageing active does. The root cause is regulatory classification: crossing that line makes the product a drug and triggers approval requirements no cosmetics company wants. So brands describe appearance rather than biology, and consumers cannot distinguish a formulation with clinical support from one without. Commercially this suppresses the return on genuine formulation research, since nobody can claim the benefit. Some companies are running clinical trials anyway and publishing them, which builds practitioner credibility even when the label stays silent.
Market Impact: Adds 18% to filler volume

Injector Supply Constrains Growth More Than Demand Does

Aesthetic injection requires a trained clinician, and the number of them grows far more slowly than the patient population wanting appointments. Practitioner density runs at 84 per million adults in developed markets and far lower elsewhere. Root cause is training capacity plus scope-of-practice rules that vary by jurisdiction and change slowly. The commercial impact is a hard ceiling on procedure volume regardless of marketing spend, and clinics running at capacity have no reason to discount. Manufacturers are mitigating through training academies and by supporting nurse-injector scope expansion where regulators permit it.
Market Impact: Reaches 3.4 million consumer tests
4 additional market trends, 3 additional growth drivers, and 2 additional restraints and challenges are covered in the full report. Contact sales@marketmindsadvisory.com to access the complete intelligence.

Segment CAGR and Growth Architecture

Segmentation follows intervention modality: how the treatment reaches the patient and what it does mechanically, rather than which concern it addresses or where it is sold. Six modalities cover the market cleanly, from topical actives through to regenerative therapies. Regulatory classification and distribution channel are treated separately, because both cut across every modality unevenly. The unevenness is the interesting part.
anti-aging-market-market-share-analysis-1787676758501

Oral Longevity Supplements

This is the category with the best story and the weakest evidence, growing at 12.9%, half again the market rate of 8.6%. NAD precursors dominate current volume, with senolytic candidates and rapamycin analogues attracting more attention than sales. What changed is measurement: epigenetic age tests give brands a number to point at, which no supplement category has ever had. The regulatory position is unresolved, since biological age improvement sits somewhere between a structure-function claim and a wellness statement. Companies building genuine trial data now will be the ones still selling when that question gets answered, and the rest will be reformulating. That reckoning is closer than most of the category admits.
CAGR 12.9%

Regenerative and Cell-Based Therapies

Platelet-rich plasma, exosome preparations, autologous fat grafting and cultured fibroblast injection all sit here, and they share a regulatory problem rather than a mechanism. Most operate under minimal manipulation exemptions that regulators are steadily narrowing, particularly in the United States where FDA enforcement discretion has tightened. Growth at 11.4% comes largely from clinics offering these as premium alternatives to conventional injectables, at prices that reflect scarcity rather than proven superiority. The evidence base is thin and improving. Whoever produces a controlled trial with a hard endpoint will define the category, and several groups are trying, though none has published anything decisive yet. The first credible dataset will be worth a great deal.
CAGR 11.4%
Full segment breakdown across 6 segments available in the complete report.

Regional Architecture and Country Demand Map

Geography follows procedure culture more than income, which is why Korea outweighs countries many times its size. East Asia leads on aesthetic treatment rates and on domestic manufacturing. North America holds value share through pricing rather than volume, while South Asia grows fastest on a rapidly forming clinic network.

North America

American demand is priced higher than anywhere else and that alone lifts the region's value share above its procedure count. Medspas have proliferated beyond dermatology practices, bringing injectables into retail settings with a regulatory patchwork that varies by state. GLP-1 prescribing is heaviest here, which makes the volume-restoration demand stream most visible in American clinic bookings. Canadian demand runs similarly but at lower prices under different advertising rules. Mexican clinics serve substantial cross-border traffic from patients seeking the same procedures at a third of the price, which distorts both markets and is rarely counted properly by anyone. The traffic runs in one direction and keeps growing. Nobody in either country counts it.
Share: 24% | CAGR: 7.8% (2026 to 2036)

Western Europe

European regulation is stricter on advertising and claims than anywhere else, which shapes how the category is sold rather than how much of it sells. German and Italian clinics run high procedure volumes with conservative aesthetic preferences. French demand skews toward dermocosmetics and devices over injection, reflecting both cultural preference and a pharmacy channel that remains genuinely influential. British clinics operate under looser practitioner rules than most of the continent, which has produced both rapid growth and periodic regulatory alarm. Spanish and Portuguese markets grew fastest in recent years from lower bases. Nordic demand is small, expensive and heavily weighted toward supplements over procedures. Six markets, six different buying logics.
Share: 19% | CAGR: 7.0% (2026 to 2036)
Regional intelligence for 5 additional markets available in the complete report: East Asia, South Asia and Pacific, Latin America, Middle East and Africa, Eastern Europe. Contact sales@marketmindsadvisory.com.
anti-aging-market-country-cagr-analysis-1787676759027

Crossing Between The Regulatory Regimes

The same consumer buys under four different sets of rules, and each set carries its own evidence burden, margin structure and defensibility. Companies that operate in only one are competing with a hand tied. Four levers exploit the boundaries between them, and each requires accepting a cost the neighbouring regime never asks for. That cost is the barrier.

Run Clinical Trials On Products That Need None

A cosmetic requires no efficacy evidence, which is why almost nobody generates any. Running a controlled trial on a topical costs a fraction of a pharmaceutical study, roughly 400,000 dollars for a credible split-face design, and produces something competitors cannot buy: practitioner recommendation. Dermatologists recommend what they have seen data on. The label still cannot make a drug claim, but the sales force can hand a physician a published paper, and physician-recommended topicals hold price through discounting cycles that flatten everything around them. Few cosmetics companies have the patience for this.
Market Impact: Costs roughly 400,000 dollars and defends premium pricing

Build The Injector Base Before Competitors Reach Them

Practitioner density caps procedure volume at 84 injectors per million adults, which makes each one a scarce distribution point rather than a customer. Manufacturers running training academies create injectors who learned on their product and will keep using it, and the switching friction is habit rather than contract. Training a cohort costs meaningful money and returns nothing in the year it happens. It returns a decade of appointments afterward. Companies treating training as marketing expense rather than as channel investment consistently underfund it and consistently lose share in new markets.
Market Impact: Secures access to 84 injectors per million adults

Attach Biomarker Testing To Supplement Subscriptions

A supplement without measurement is a repeat purchase that depends on faith. Bundling an epigenetic age test at enrolment and again at 6 months gives the customer a number and gives the brand a retention mechanism no competitor formulation can match. Subscription retention improves markedly when a customer has invested in a baseline they want to see move. The cost is the test itself plus the risk that the number goes the wrong way, which brands manage by framing results as trajectory rather than as verdict. Some do this carefully. Most do not.
Market Impact: Improves subscription retention measurably across 6 month cycles

Compete On Complication Support, Not Product Price

Korean toxin pricing has fallen 43% below Western levels in several emerging markets and Western manufacturers cannot follow it down. What they can offer is what happens when something goes wrong: hyaluronidase supply, a vascular occlusion protocol, a clinician on the phone within the hour and insurance that recognises the product. Injectors carry personal liability and they price that risk into their purchasing. This works only where malpractice exposure is real, which excludes several markets entirely, and it works extremely well where it applies. Knowing which markets are which is the whole skill.
Market Impact: Defends premium pricing against alternatives priced 43% cheaper

Who Controls the Margin Pool

Measured on disclosed aesthetics and skincare segment revenue, the five largest companies hold a CR5 of 21%, which is low and genuinely reflects the market rather than obscuring it. Nobody spans all four regulatory regimes. Within injectables concentration is far higher, and within cosmeceuticals far lower. L'Oreal and AbbVie lead from opposite ends, one through consumer scale and the other through a prescription franchise.
Three contests are running at once. Injectable manufacturers compete on clinical dossier depth and injector loyalty rather than on price, because they cannot win on price against Korean supply. Cosmeceutical brands compete on ingredient stories and retail distribution, a contest that rewards marketing budget over formulation. Supplement companies compete on measurement, racing to attach credible biomarker evidence before regulators decide what counts. Almost nobody is competing in more than one of these, which is the most striking feature of the market.

Pressure is arriving from pharmaceutical companies with GLP-1 franchises who now hold a direct relationship with exactly the patients aesthetics wants. Rankings will shift wherever a weight management prescription becomes the front door to an aesthetic appointment, and that door is already open in several American practices.
anti-aging-market-company-positioning-matrix-1787676759570

Competitive Moat and Risk Dimensions

L'OREAL

Moat: Consumer Distribution And Formulation Scale

L'Oreal reaches more consumers through more channels than any competitor and spends more on formulation research than most pharmaceutical mid-caps. That combination lets it move an ingredient from laboratory to global mass retail faster than anyone, and to support the launch with media weight competitors cannot match. Scale buys shelf position, which remains the single largest determinant of topical sales.
L'OREAL

Risk: Clinical Evidence Gap Widens

Cosmetic regulation means L'Oreal cannot claim what its formulations actually do, and consumers are increasingly directed toward injectables and supplements that make bolder promises with better-looking support. As biological age measurement spreads, a category selling appearance alone looks progressively weaker. The company's answer has been dermatological brand acquisition, which helps and does not close the gap.
ABBVIE

Moat: Prescription Franchise And Injector Loyalty

AbbVie's aesthetics business rests on a neuromodulator with two decades of clinical data and an injector base trained on it from the beginning. Habit in this market is unusually durable, because a clinician who knows exactly how a product behaves is reluctant to relearn dosing on a patient's face. The dossier depth also carries weight with regulators in newer markets.
ABBVIE

Risk: Price Erosion From Korean Supply

Korean manufacturers produce botulinum toxin at costs AbbVie cannot approach, and they are taking volume across emerging markets where clinical dossier depth matters less than unit price. The franchise is defensible in litigious markets with strong liability exposure and considerably less so elsewhere. Growth in aesthetics is happening precisely in the markets where that defence is weakest.

Players Tracked

Prominent Players

L'Oreal
AbbVie
Galderma
Beiersdorf
Estee Lauder

Other Key Players

Merz Pharma
Ipsen
Hugel
Medytox
Bausch Health
InMode
Cutera
Candela
Alma Lasers
Shiseido
Amorepacific
Unilever
Johnson and Johnson
Nestle Health Science
Croma-Pharma

Recent Developments

MARCH 2025

Galderma expands biostimulator manufacturing capacity in Switzerland

Galderma commissioned additional biostimulator manufacturing capacity in Switzerland, an organic expansion rather than an acquisition or joint venture. The company cited volume-restoration demand from patients on weight loss medication as a specific driver, alongside general growth in collagen-stimulating treatments that compete with conventional hyaluronic acid fillers.
Signal: A manufacturer naming GLP-1 patients as a capacity driver confirms the demand stream is real and durable.
JULY 2025

Hugel receives regulatory approval for botulinum toxin in additional European markets

Hugel secured regulatory approval to market its botulinum toxin product in further European territories, an approval decision rather than a partnership or acquisition. Entry brings Korean manufacturing cost structures into markets where pricing has been set by three Western manufacturers for two decades, and clinics have begun negotiating accordingly.
Signal: Price competition is arriving in the markets Western manufacturers assumed their clinical dossiers would protect indefinitely.
OCTOBER 2025

Nestle Health Science acquires longevity supplement brand with biomarker platform

Nestle Health Science acquired a longevity supplement business whose subscription model bundles epigenetic age testing with formulation. This was an acquisition rather than a partnership or minority investment. The stated rationale centred on the retention advantage of measurement-linked subscriptions over conventional supplement repeat purchase behaviour.
Signal: Large food companies are buying measurement platforms rather than formulations, which tells you where the durable advantage sits.

What The Treatment Costs To Deliver

Cost structures differ so sharply by modality that a single figure would mislead. Botulinum toxin manufacturing runs 8 to 11% of selling price, since the active is produced in tiny quantities and everything else is regulatory overhead. Topical actives run 14 to 17% of COGS, with peptides and stabilised vitamin C sourced from a narrow set of specialty chemical producers in Japan and Switzerland.
The clearest recent volatility was in hyaluronic acid feedstock rather than in energy. Bacterial fermentation capacity for pharmaceutical-grade hyaluronic acid concentrated in a small number of Chinese producers, and pricing moved sharply through 2022 and 2023 as demand from both aesthetics and ophthalmology grew. Galderma and Bausch Health annual reports for the period describe input cost pressure on filler portfolios. Those buying at spot took the entire move.

Exposure runs opposite to what most people assume. Toxin manufacturers carry almost no input cost risk, since the active is a rounding error against regulatory and commercial overhead. Filler and topical producers carry real feedstock exposure and thinner margins to absorb it. Supplement companies are worst placed, buying ingredients on commodity terms into a category where consumers notice every price increase.
anti-aging-market-cost-volatility-analysis-1787676759769

Contract fermentation capacity ahead of filler volume growth

Pharmaceutical-grade hyaluronic acid comes from a handful of fermentation plants, and aesthetics competes for that capacity with ophthalmology and orthopaedics. Manufacturers holding multi-year volume agreements rode through the 2022 squeeze without repricing. Those buying opportunistically discovered that fermentation capacity cannot be expanded on the timeline a shortage creates, because validation alone takes over a year.

Qualify second sources for specialty topical actives

Peptides and stabilised vitamin C derivatives come from a small number of Japanese and Swiss producers whose capacity serves several industries. Qualifying an alternative takes stability testing and reformulation work measured in months. Brands that did it during calm periods held shelf presence when supply tightened, and brands that did not quietly reformulated under pressure and lost consistency.

Shift portfolio weight toward low input cost modalities

Toxin manufacturing carries almost no feedstock exposure because the active costs almost nothing to produce relative to what it sells for. Every point of portfolio weight moved from fillers and topicals toward neuromodulators reduces input cost sensitivity across the whole business. The constraint is regulatory: building a toxin franchise takes a decade and most companies cannot start now.

Portfolio Architecture for Margin Defence

Margin follows regulatory burden almost perfectly, and in the direction most people find surprising. The harder a product is to approve, the better it earns. Botulinum toxin carries the heaviest evidence requirement and the highest gross margin in the category. Cosmetics carry none of the burden and the thinnest returns, competing against every other brand on a shelf.
The tension sits inside companies that own both. A consumer division measured on revenue growth will always outvote an aesthetics division measured on margin, and capital flows toward the larger number. Several groups have separated the two entirely, running aesthetics as a pharmaceutical business with its own commercial model rather than as an extension of skincare. Those that kept them together report better revenue and worse returns, and the pattern is consistent enough that it cannot be coincidence.

High-value pools concentrate in three places. Neuromodulators in liability-sensitive markets, where clinical dossiers and complication support defend pricing against cheaper supply. Biostimulators, which command filler pricing with better repeat economics and a stronger clinical story. And measurement-linked supplement subscriptions, where the test rather than the formulation creates retention. None of these is where the volume sits.

Volume / Commodity-Adjacent

Mass and masstige topical anti-ageing products sold through grocery, drugstore and online retail. The 7-point range separates own-manufactured lines from those produced by contract formulators. Media spend rather than formulation decides share, and promotional pricing resets the reference every quarter.
Gross Margin: 48-55%

Premium / Certified

Prescription neuromodulators, cleared dermal fillers and energy-based devices sold into clinical settings. The 7-point spread separates established franchises with deep dossiers from newer entrants competing on price. Regulatory approval and injector familiarity rather than product performance hold this pricing.
Gross Margin: 68-75%

Sustainability / Regulatory / Next-Generation

Biostimulators, measurement-linked longevity supplements and regenerative preparations. The 13-point range is unusually wide because approved biostimulators price like pharmaceuticals while longevity supplements price like consumer subscriptions, and both sit in this tier awaiting regulatory clarification that will separate them.
Gross Margin: 58-71%
anti-aging-market-portfolio-architecture-1787676760273

High-value Sub-segments and Strategic Watch-out

Collagen Biostimulator Injectables

Highest value and strong growth, benefiting directly from volume-restoration demand among weight loss patients. Clinical evidence is better than fillers and repeat intervals are longer, which trades appointment frequency for treatment price. The risk is that longer intervals weaken the clinic relationship that drives everything else.
Gross Margin: 72-75%

Measurement-Linked Supplement Subscriptions

High value with fast growth, where the biomarker test rather than the formulation creates retention. Competitive position depends on testing platform ownership, which is why acquirers are buying platforms instead of brands. The regulatory question remains open and will eventually determine whether this survives in its current form.
Gross Margin: 62-65%

Mass Market Anti-Ageing Topicals

The volume core, carrying most units sold and the least differentiation. Claims regulation prevents any brand from saying what actually works, so competition runs on media weight and shelf position. Most established companies manage this line for scale and cash rather than for growth, which is the only sensible approach.
Gross Margin: 49-52%

Premium Neuromodulator Franchises

The strategic watch-out. These franchises carry most of the category's profit and face Korean supply priced 43% below them in exactly the markets where growth is fastest. The risk is defending on clinical dossiers in jurisdictions where liability exposure does not make that defence worth paying for.
Gross Margin: 69-72%

Why Patients Keep Coming Back

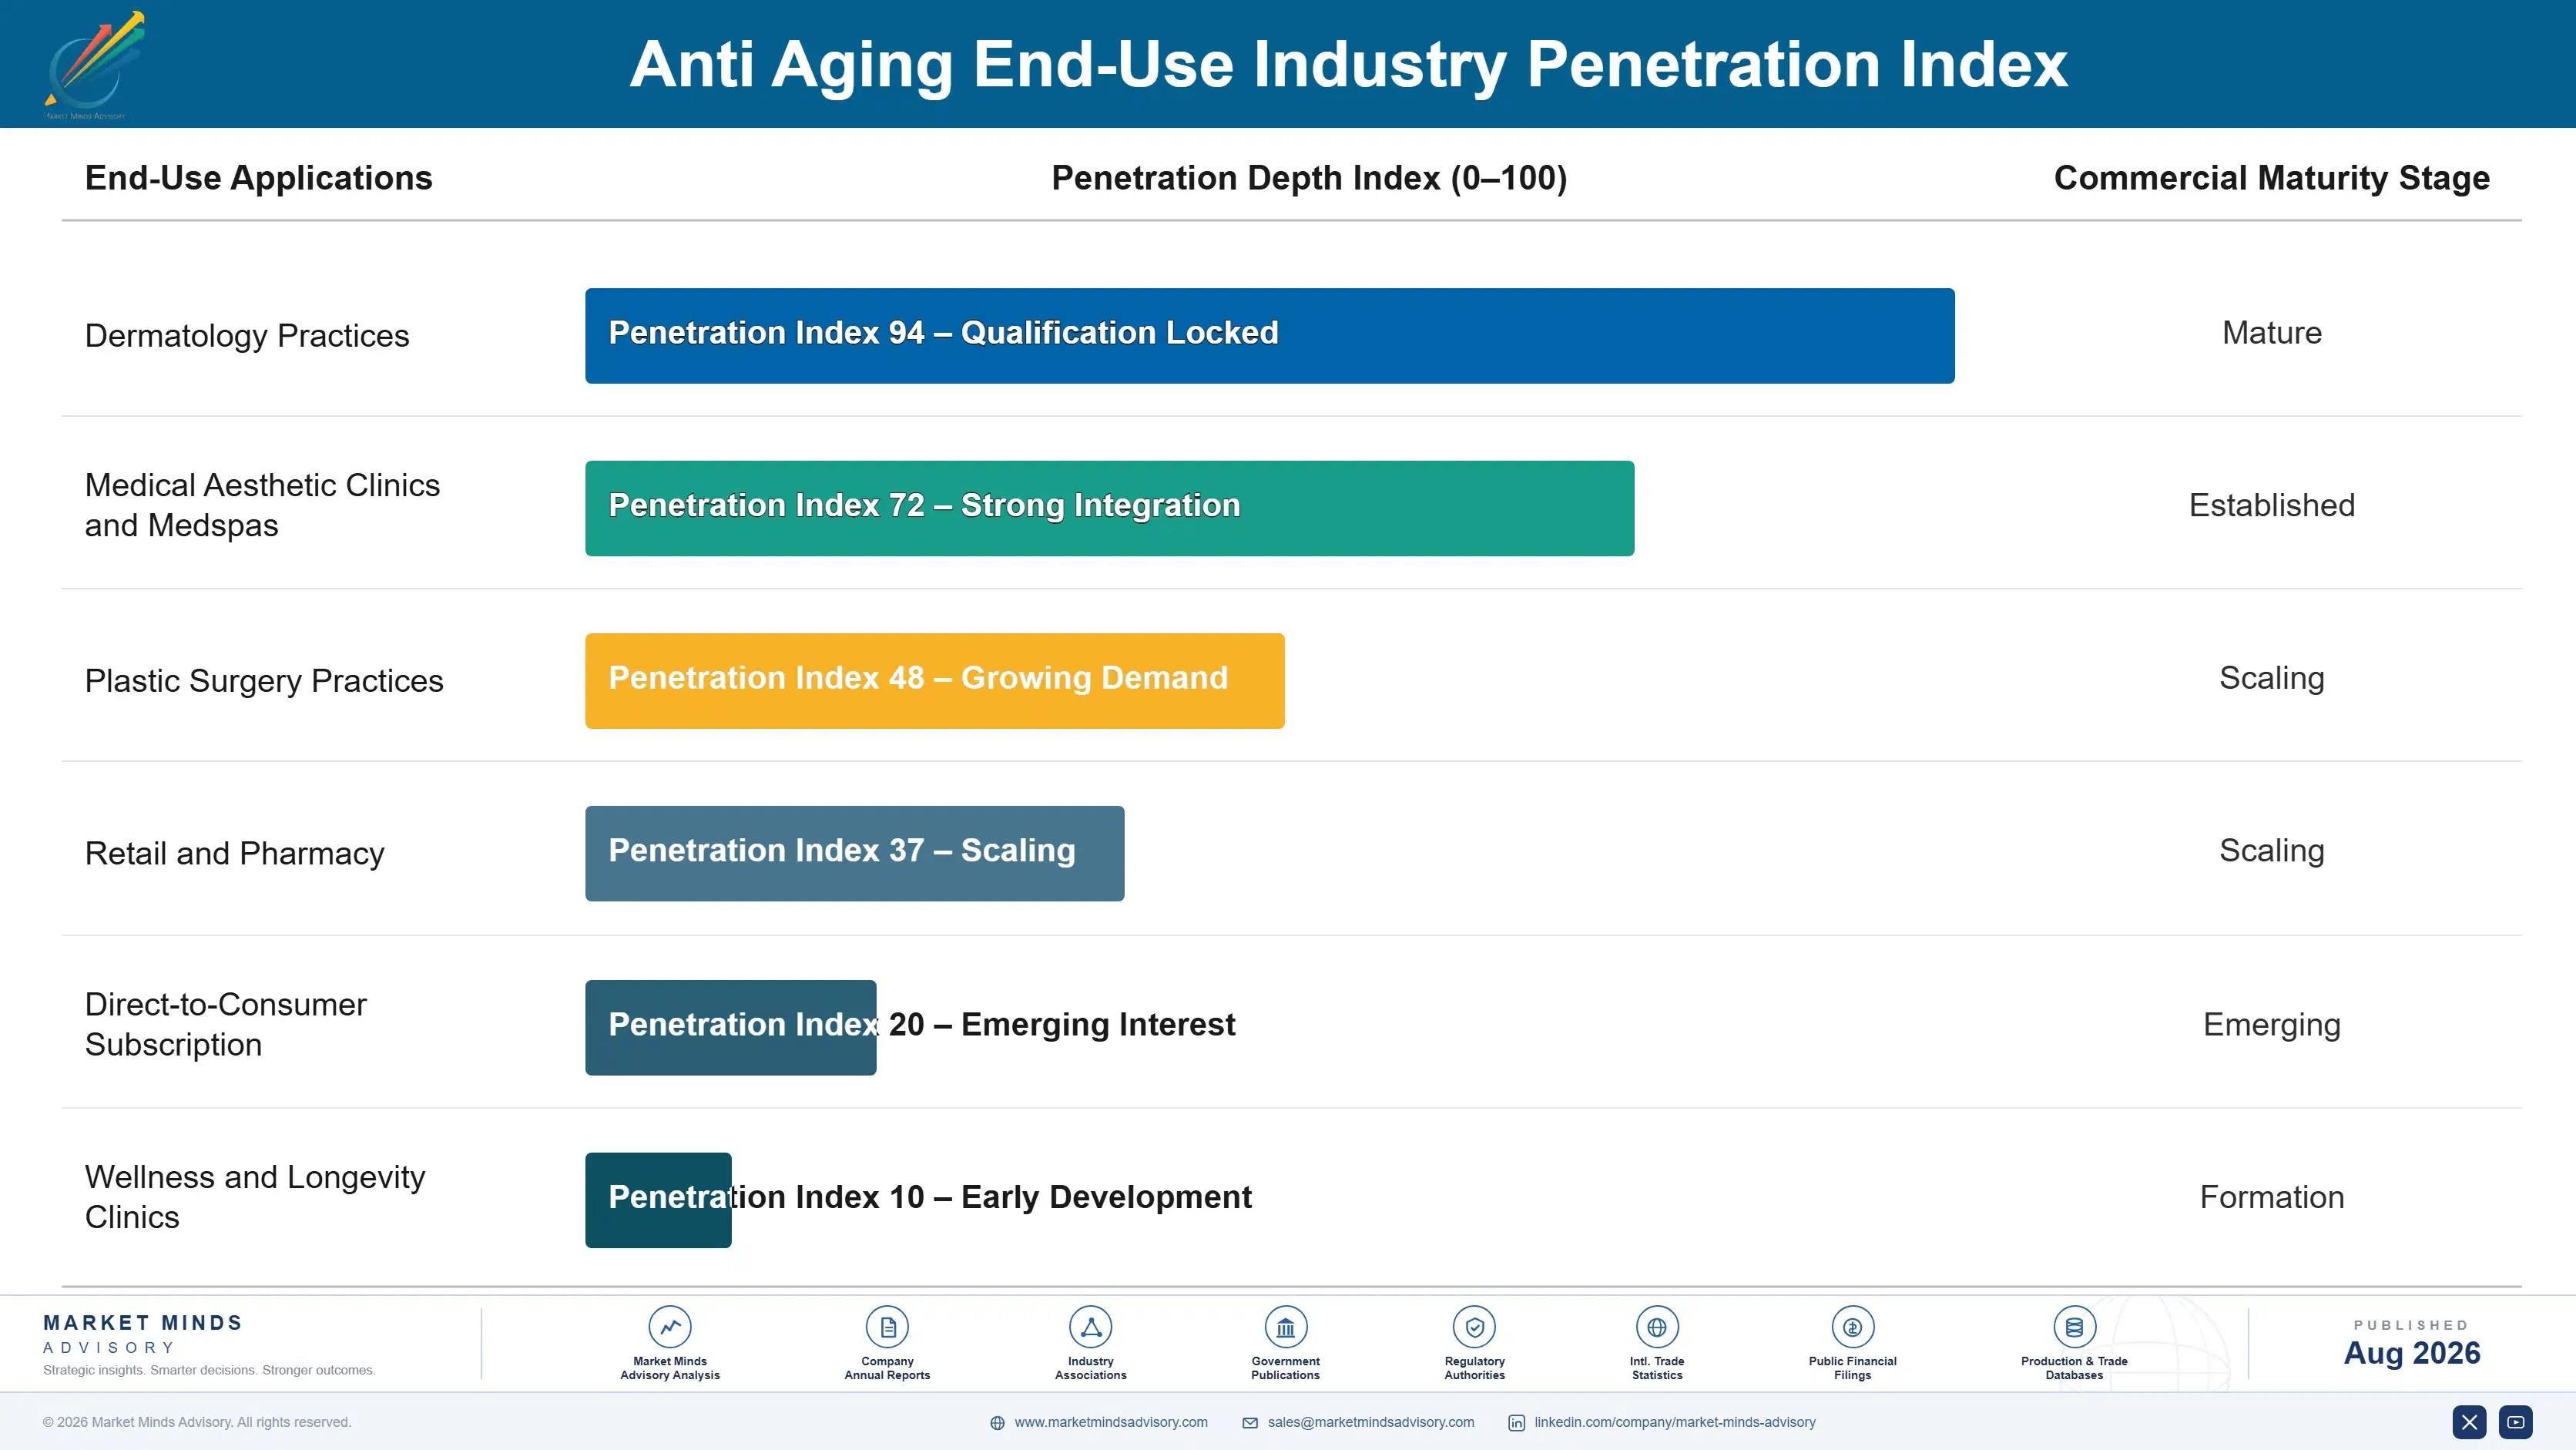
Neuromodulator treatment is one of the best annuities in consumer health. A patient returns every 4.2 months because the effect wears off on a biological schedule nobody can argue with, and stopping means visibly reverting. Lifetime value per patient runs into thousands of dollars across a decade, and acquisition cost is paid once. No topical product generates anything comparable.
Stickiness varies by how visible the reversal is. Neuromodulator patients almost never stop voluntarily, because the return of movement is obvious to them within weeks. Filler patients are more discretionary, since the decline is gradual. Device treatment courses complete and then require a new decision, which is why device clinics work harder on retention than injectable clinics do. Supplement subscribers churn heavily, because nothing visible happens when they stop taking them.

The patient profile is changing. Male share keeps climbing toward a quarter of neuromodulator procedures, and the average first-treatment age keeps falling as preventive treatment normalises among people in their late twenties. Both shifts extend lifetime value substantially, since a patient starting at 28 rather than 45 has an additional 17 years of appointments. Clinics have noticed. Manufacturers have been slower to reprice around it.
anti-aging-market-end-use-penetration-index-1787676760761

Where The Regulatory Premium Sits

These are among the four positions where our research anticipates prominent divergence between winners and laggards over the coming forecast period. Each is grounded in the demand model, the regulatory perimeter, and the announced capacity pipeline.
01 / EVIDENCE INVESTMENT STRATEGY

Generate clinical data where none is required

Cosmetic regulation demands no efficacy evidence, which is exactly why generating it separates a brand from everything else on the shelf and why so few companies bother. A credible split-face trial costs roughly 400,000 dollars, a rounding error against a launch media budget, and produces a published paper that a sales team can put in front of a dermatologist. Physician-recommended topicals hold price through the promotional cycles that flatten competitors, and the recommendation persists long after the media spend stops working.
02 / INJECTOR CHANNEL OWNERSHIP

Treat training academies as channel investment, not marketing

Practitioner density caps procedure volume at roughly 84 injectors per million adults, which makes each trained clinician a scarce distribution point rather than an ordinary customer. An injector who learned dosing on one product is reluctant to relearn it on a patient's face, and that habit outlasts any contract or rebate arrangement. Companies that book training as marketing expense underfund it in every budget cycle, and they lose share in exactly the new markets where the injector base is still being formed.
03 / GLP-1 REFERRAL CAPTURE

Build the referral path from weight clinic to injector

Weight loss medication produces facial volume loss that reads as ageing, and the resulting demand now adds meaningfully to filler and biostimulator bookings in North America and Western Europe. These patients arrive younger, more often male and through a medical referral rather than through cosmetic advertising, which means the acquisition channel is a prescriber rather than a campaign. Companies building relationships with weight management practices are capturing a demand stream that nobody in aesthetics had forecast even two years ago.
04 / TOXIN PRICE DEFENCE

Defend on liability, concede on price

Korean manufacturing has taken per-unit toxin pricing 43% below Western levels in emerging markets, and no Western producer can follow that down without destroying the franchise economics that fund their clinical programmes. What can be defended is what happens when a treatment goes wrong: hyaluronidase supply, occlusion protocols and a clinician reachable within the hour, all of which injectors carrying personal liability will pay for. That defence works only where malpractice exposure is genuine, so the discipline is knowing which markets to contest and which to concede.

Engagement Snapshot From the Field

A live engagement with an industry participant carrying material or product regulatory and market exposure ahead of a defining policy shift, showing how our research translates into a defensible multi-year portfolio strategy.
MARKET MINDS ADVISORY · CLIENT ENGAGEMENT SUMMARY
Anti Aging Producer Strategic Portfolio Review and Transition Roadmap 2026·Investment Scenario on Anti Aging Exposure Evaluation 2025-26
CLIENT PROFILE
A European aesthetics manufacturer selling neuromodulators and dermal fillers across 46 countries, with aesthetics revenue reported at 1.2 billion euros (client-reported, unverified by MMA). Roughly 71% of that came from Western Europe and North America. The company had been losing unit share across Southeast Asia and Latin America for three consecutive years without a clear internal explanation for why.
STRATEGIC CHALLENGE
Korean competitors were pricing 40% below the company in the same clinics, and the sales force had been responding with discounts that damaged margin without recovering volume. Head office believed the problem was product positioning. The regional teams believed it was price. Nobody had established which markets were genuinely defensible and which were already lost, so every territory received the same instruction.
MMA APPROACH
MMA scored every territory by malpractice liability exposure, practitioner licensing strictness and insurance requirements, rather than by price gap, on the reasoning that liability determines whether clinical support carries commercial value. Eighteen expert interviews with injectors across nine countries established what they actually paid for beyond product. The analysis treated legal environment, not competitor pricing, as the variable that decides defensibility.
KEY FINDINGS
  1. Only 14 of the 46 territories had malpractice environments where injectors demonstrably paid a premium for complication support, and the company was discounting in all 46.
  2. Discounting in low-liability markets recovered no measurable volume at all, because injectors there treated the products as interchangeable regardless of clinical dossier depth.
  3. Injector training programmes correlated more strongly with retained share than either price or dossier depth, and the company had cut training budgets in the affected regions.
  4. Withdrawing from 9 territories entirely and reinvesting the margin in training across the remaining 37 modelled better than defending everywhere (client-reported, unverified by MMA).
CLIENT PROFILE
A European aesthetics manufacturer selling neuromodulators and dermal fillers across 46 countries, with aesthetics revenue reported at 1.2 billion euros (client-reported, unverified by MMA). Roughly 71% of that came from Western Europe and North America. The company had been losing unit share across Southeast Asia and Latin America for three consecutive years without a clear internal explanation for why.
STRATEGIC CHALLENGE
Korean competitors were pricing 40% below the company in the same clinics, and the sales force had been responding with discounts that damaged margin without recovering volume. Head office believed the problem was product positioning. The regional teams believed it was price. Nobody had established which markets were genuinely defensible and which were already lost, so every territory received the same instruction.
MMA APPROACH
MMA scored every territory by malpractice liability exposure, practitioner licensing strictness and insurance requirements, rather than by price gap, on the reasoning that liability determines whether clinical support carries commercial value. Eighteen expert interviews with injectors across nine countries established what they actually paid for beyond product. The analysis treated legal environment, not competitor pricing, as the variable that decides defensibility.
KEY FINDINGS
  1. Only 14 of the 46 territories had malpractice environments where injectors demonstrably paid a premium for complication support, and the company was discounting in all 46.
  2. Discounting in low-liability markets recovered no measurable volume at all, because injectors there treated the products as interchangeable regardless of clinical dossier depth.
  3. Injector training programmes correlated more strongly with retained share than either price or dossier depth, and the company had cut training budgets in the affected regions.
  4. Withdrawing from 9 territories entirely and reinvesting the margin in training across the remaining 37 modelled better than defending everywhere (client-reported, unverified by MMA).
RECOMMENDED STRATEGY
Phase 1: Phase one: end discounting immediately in the 14 high-liability territories and reposition entirely on complication support and clinical dossier depth. Phase 2: Phase two: restore injector training investment across all retained territories, funded by the margin recovered from ending unproductive discounting elsewhere. Phase 3: Phase three: withdraw from the 9 lowest-liability territories over 18 months rather than abruptly, preserving relationships with injectors who may relocate.
OUTCOME
Margin in the 14 high-liability territories recovered within three quarters and unit share held steady rather than declining further. Training investment across retained markets produced measurable share gains in six countries within the first year (client-reported, unverified by MMA). Withdrawal from the lowest-liability territories is running to schedule and has drawn no customer complaint.

Frequently Asked Questions

Foundational context covering the market sizes, CAGR, scope, country, region and competition that inform every finding below. This section is provided to cover basics and most often pre-purchase conversations, answered from the MMA Primary Research Dataset.

What is the current size of the Anti Aging Market?

The market was worth 78.4 billion dollars in 2025, covering topicals, injectables, aesthetic devices, longevity supplements and regenerative therapies. It reaches 85.1 billion dollars in 2026 on current forecasts.

How large will the Anti Aging Market be by 2036?

MMA forecasts 194.2 billion dollars by 2036, an increase of 109.1 billion dollars over the 2026 base. That represents an expansion multiple of 2.28 times across the forecast period.

What is the CAGR for the Anti Aging Market 2026 to 2036?

The base case compounds at 8.6% annually. MMA's bull case reaches 9.8% if a senolytic compound clears a credible clinical endpoint, while the bear case sits at 7.4% following any major filler safety event.

Which segment is growing fastest?

Oral longevity supplements, at 12.9%, half again the market rate of 8.6%. Epigenetic age testing gives the category a measurable claim that no supplement segment has ever had before.

Who are the major companies in the Anti Aging Market?

L'Oreal, AbbVie, Galderma, Beiersdorf and Estee Lauder lead on disclosed aesthetics and skincare segment revenue. Merz Pharma, Ipsen, Hugel, Medytox and InMode compete strongly within specific modalities.

Which country is growing fastest?

China at 12.2%, driven by tier-one city clinic expansion and a domestic consumer base that barely existed a decade ago. India follows on a rapidly forming clinic network.

Report Segmentation Architecture

The full report scope spans multiple orthogonal segmentation dimensions, with cross-tabulated demand data provided for each dimension pair. Coverage extends further to regional breakdowns, trend trajectories, and the competitive detail needed to support segment-level decision-making.

By Intervention Modality

  • Topical Cosmeceuticals
  • Injectable Neuromodulators
  • Dermal Fillers and Biostimulators
  • Energy-Based Aesthetic Devices
  • Oral Longevity Supplements
  • Regenerative and Cell-Based Therapies

By End-Use Industry

  • Dermatology Practices
  • Medical Aesthetic Clinics and Medspas
  • Plastic Surgery Practices
  • Retail and Pharmacy
  • Direct-to-Consumer Subscription
  • Wellness and Longevity Clinics

By Commercial Dimension

  • Prescription Channel
  • Practitioner Direct Supply
  • Distributor and Wholesaler
  • Retail and E-Commerce
  • Subscription Membership
  • Medical Tourism Channel

By Region

  • North America
  • Western Europe
  • East Asia
  • South Asia and Pacific
  • Latin America
  • Middle East and Africa
  • Eastern Europe

Scope, Methodology, and Coverage

Every figure in this report is reproducible from documented input assumptions. The scope below maps the historical period, the forecast horizon, the segmentation dimensions, and the countries covered, alongside the underlying primary and qualitative methodology.
Historical Period
2020 to 2025
Forecast Period
2026 to 2036
Base Year
2025 (USD billions; MMA Primary Research Dataset, August 2026)
Market Definition
Scope covers products and procedures sold primarily on a claim to delay, reduce or reverse the visible and measurable effects of ageing, spanning topical cosmeceuticals, injectable neuromodulators, dermal fillers and collagen biostimulators, energy-based aesthetic devices, oral longevity supplements and regenerative or cell-based preparations. General skincare, sun protection, hair loss treatment, surgical procedures and endocrine-indicated hormone replacement are excluded. Clinic operations, practitioner training services and diagnostic testing sold independently fall outside the boundary.
Quantitative Units
USD billions (current prices); procedures performed; toxin units sold; treatment courses delivered; subscription members
Segmentation Dimensions
By Intervention Modality; By End-Use Industry; By Commercial Dimension; By Region
Regions Covered
North America, Western Europe, East Asia, South Asia and Pacific, Latin America, Middle East and Africa, Eastern Europe
Countries Covered
USA, China, Germany, France, UK, Japan, South Korea, India, Brazil, Mexico, Italy, Spain, Poland, Saudi Arabia, South Africa
Key Companies Profiled
L'Oreal, AbbVie, Galderma, Beiersdorf, Estee Lauder, Merz Pharma, Ipsen, Hugel, Medytox, Bausch Health, InMode, Cutera, Candela, Alma Lasers, Shiseido, Amorepacific, Unilever, Johnson and Johnson, Nestle Health Science, Croma-Pharma
Quantitative Methodology
Primary survey, n=3,800 respondents, Q4 2025, six countries; demand-side model with trade association cross-validation
Qualitative Methodology
47 expert interviews, Q4 2025; applied to validate demand model assumptions, identify emerging dynamics, and assess competitive positioning
Report Format
PDF and XLSX data workbook (Word format preview document)
Publisher
Market Minds Advisory
Report Code
MMA-2026-HLT-153
Published
August 2026
Contact
sales@marketmindsadvisory.com | www.marketmindsadvisory.com

Purchase the full Anti Aging Market Report (2026 to 2036).

The full report runs to 225 pages and covers all six intervention modality segments, seven regions and 20 profiled companies in detail. It includes the complete segment CAGR set, regional procedure volume and pricing data, and practitioner density analysis across fifteen national markets. Company profiles carry evaluation on disclosed aesthetics and skincare segment revenue, with moat and risk assessment for the top five suppliers. The competitive section extends to 18 tracked corporate developments across 2024 and 2025, each with commercial interpretation. Primary research inputs include a quantitative survey of 3,800 respondents and 47 expert interviews conducted in Q4 2025.
Six intervention modality segments with individual CAGR forecasts
Seven regional markets with procedure volume and pricing
Twenty company profiles on consistent revenue evaluation basis
Eighteen tracked corporate developments with commercial interpretation notes
Practitioner density analysis across fifteen national markets
Regulatory classification comparison across four product regimes

Built For The People Who Decide

From boardroom strategy to bench-side execution, this report is read cover-to-cover by leaders shaping the next decade of their industry, turning demand scenarios, market dynamics and valuation benchmarks into decisions.
CXOs/ Presidents/ VPs/ Managers
M&A and Corporate Development
Strategy Teams and R&D Heads
Procurement and Product Directors
Regulatory and Compliance Leaders
Investor Relations and Equity Analysts