Market Minds Advisory
Animal Feed Protein Ingredients Market

Animal Feed Protein Ingredients Market: Soybean Dependence, Deforestation Compliance, and the Amino Acids Quietly Shrinking Demand

Soybean meal still supplies most of the world's feed protein, yet synthetic amino acids keep cutting how much of it a diet needs, while European deforestation rules redraw which origins may enter the chain.

Lead Analyst

Lisa Gevelber

Published

September 2026

Make Smarter Decisions with Customized Research Insights

Request a free sample report and evaluate market opportunities, growth trends, and competitive dynamics relevant to your business needs.

2025 MARKET VALUE$268.0BMarket Size 2025
2036 FORECAST VALUE$430.4BBase Case , 2026 to 2036
CAGR 2026 TO 20364.4 %Bull 5.7% / Bear 3.1%
INCREMENTAL OPPORTUNITY$150.6BNet 10- year value creation
EXPANSION MULTIPLE1.54x2036 value over 2026 base
Strategic Levers
M&A Pipeline
Regional Outlook
Country Rankings
Competitive Intelligence
Segmental Deep-dive
Call-Us : 91 93563 13602

Executive Snapshot and Market Trajectory

The feed protein market has an awkward secret. Synthetic lysine, methionine, threonine, and valine let nutritionists cut crude protein in a diet without losing performance, which means every advance in amino acid supply quietly removes tonnes of soybean meal demand that nobody records as a loss.
Commercial power sits with whoever controls origin documentation as much as tonnage. The European Union Deforestation Regulation requires geolocation evidence for soy entering the bloc, and that requirement has split Brazilian supply into compliant and non-compliant streams at visibly different prices. Insect proteins grow fastest at 21.3%, roughly 4.84 times the market, though from a base measured in tens of thousands of tonnes. East Asia takes 30% of value.
Concentration is low at roughly 28% for the top five, because oilseed crushing is dispersed across origins and hundreds of regional operators handle rendered and co-product streams. Regulation moves demand in both directions: the European Union reopened processed animal proteins for pig and poultry feed in 2021 after two decades of prohibition, while deforestation rules constrain which soy may enter at all. Chinese policy actively targets lower soybean meal inclusion. Policy pressure continues.
Market Definition
This report covers protein-supplying ingredients sold into compound feed and on-farm rations, spanning oilseed meals, grain processing co-product proteins, marine proteins, rendered animal proteins, insect proteins, and microbial and single-cell proteins. Value is measured at ingredient level as traded to feed mills, integrators, and farm buyers. Synthetic amino acids, vitamins, enzymes, forages, whole grains fed as energy sources, and complete compound feed sold as finished product fall outside scope.
Base Year Value
$268.0B in 2025 (MMA Primary Research Dataset, August 2026)
Forecast Period
2026 to 2036, eleven discrete annual values
CAGR
4.4% base case. Bull 5.7%. Bear 3.1%.
Fastest Growth Segment
Insect Proteins: 21.3% CAGR
Fastest Growth Country
Vietnam: 6.9% CAGR
Fastest Growth Region
South Asia and Pacific: 6.4% CAGR
Largest Region
East Asia: 30% of 2025 global value
Market Leaders
Cargill, Archer Daniels Midland, Bunge Global, Louis Dreyfus Company, COFCO International. Source: MMA Analysis based on company annual reports.
Primary Survey
n=3,800 procurement and R&D decision-makers, Q4 2025, six countries
Methodology
Demand-side build-up, cross-validated against public data, 47 expert interviews

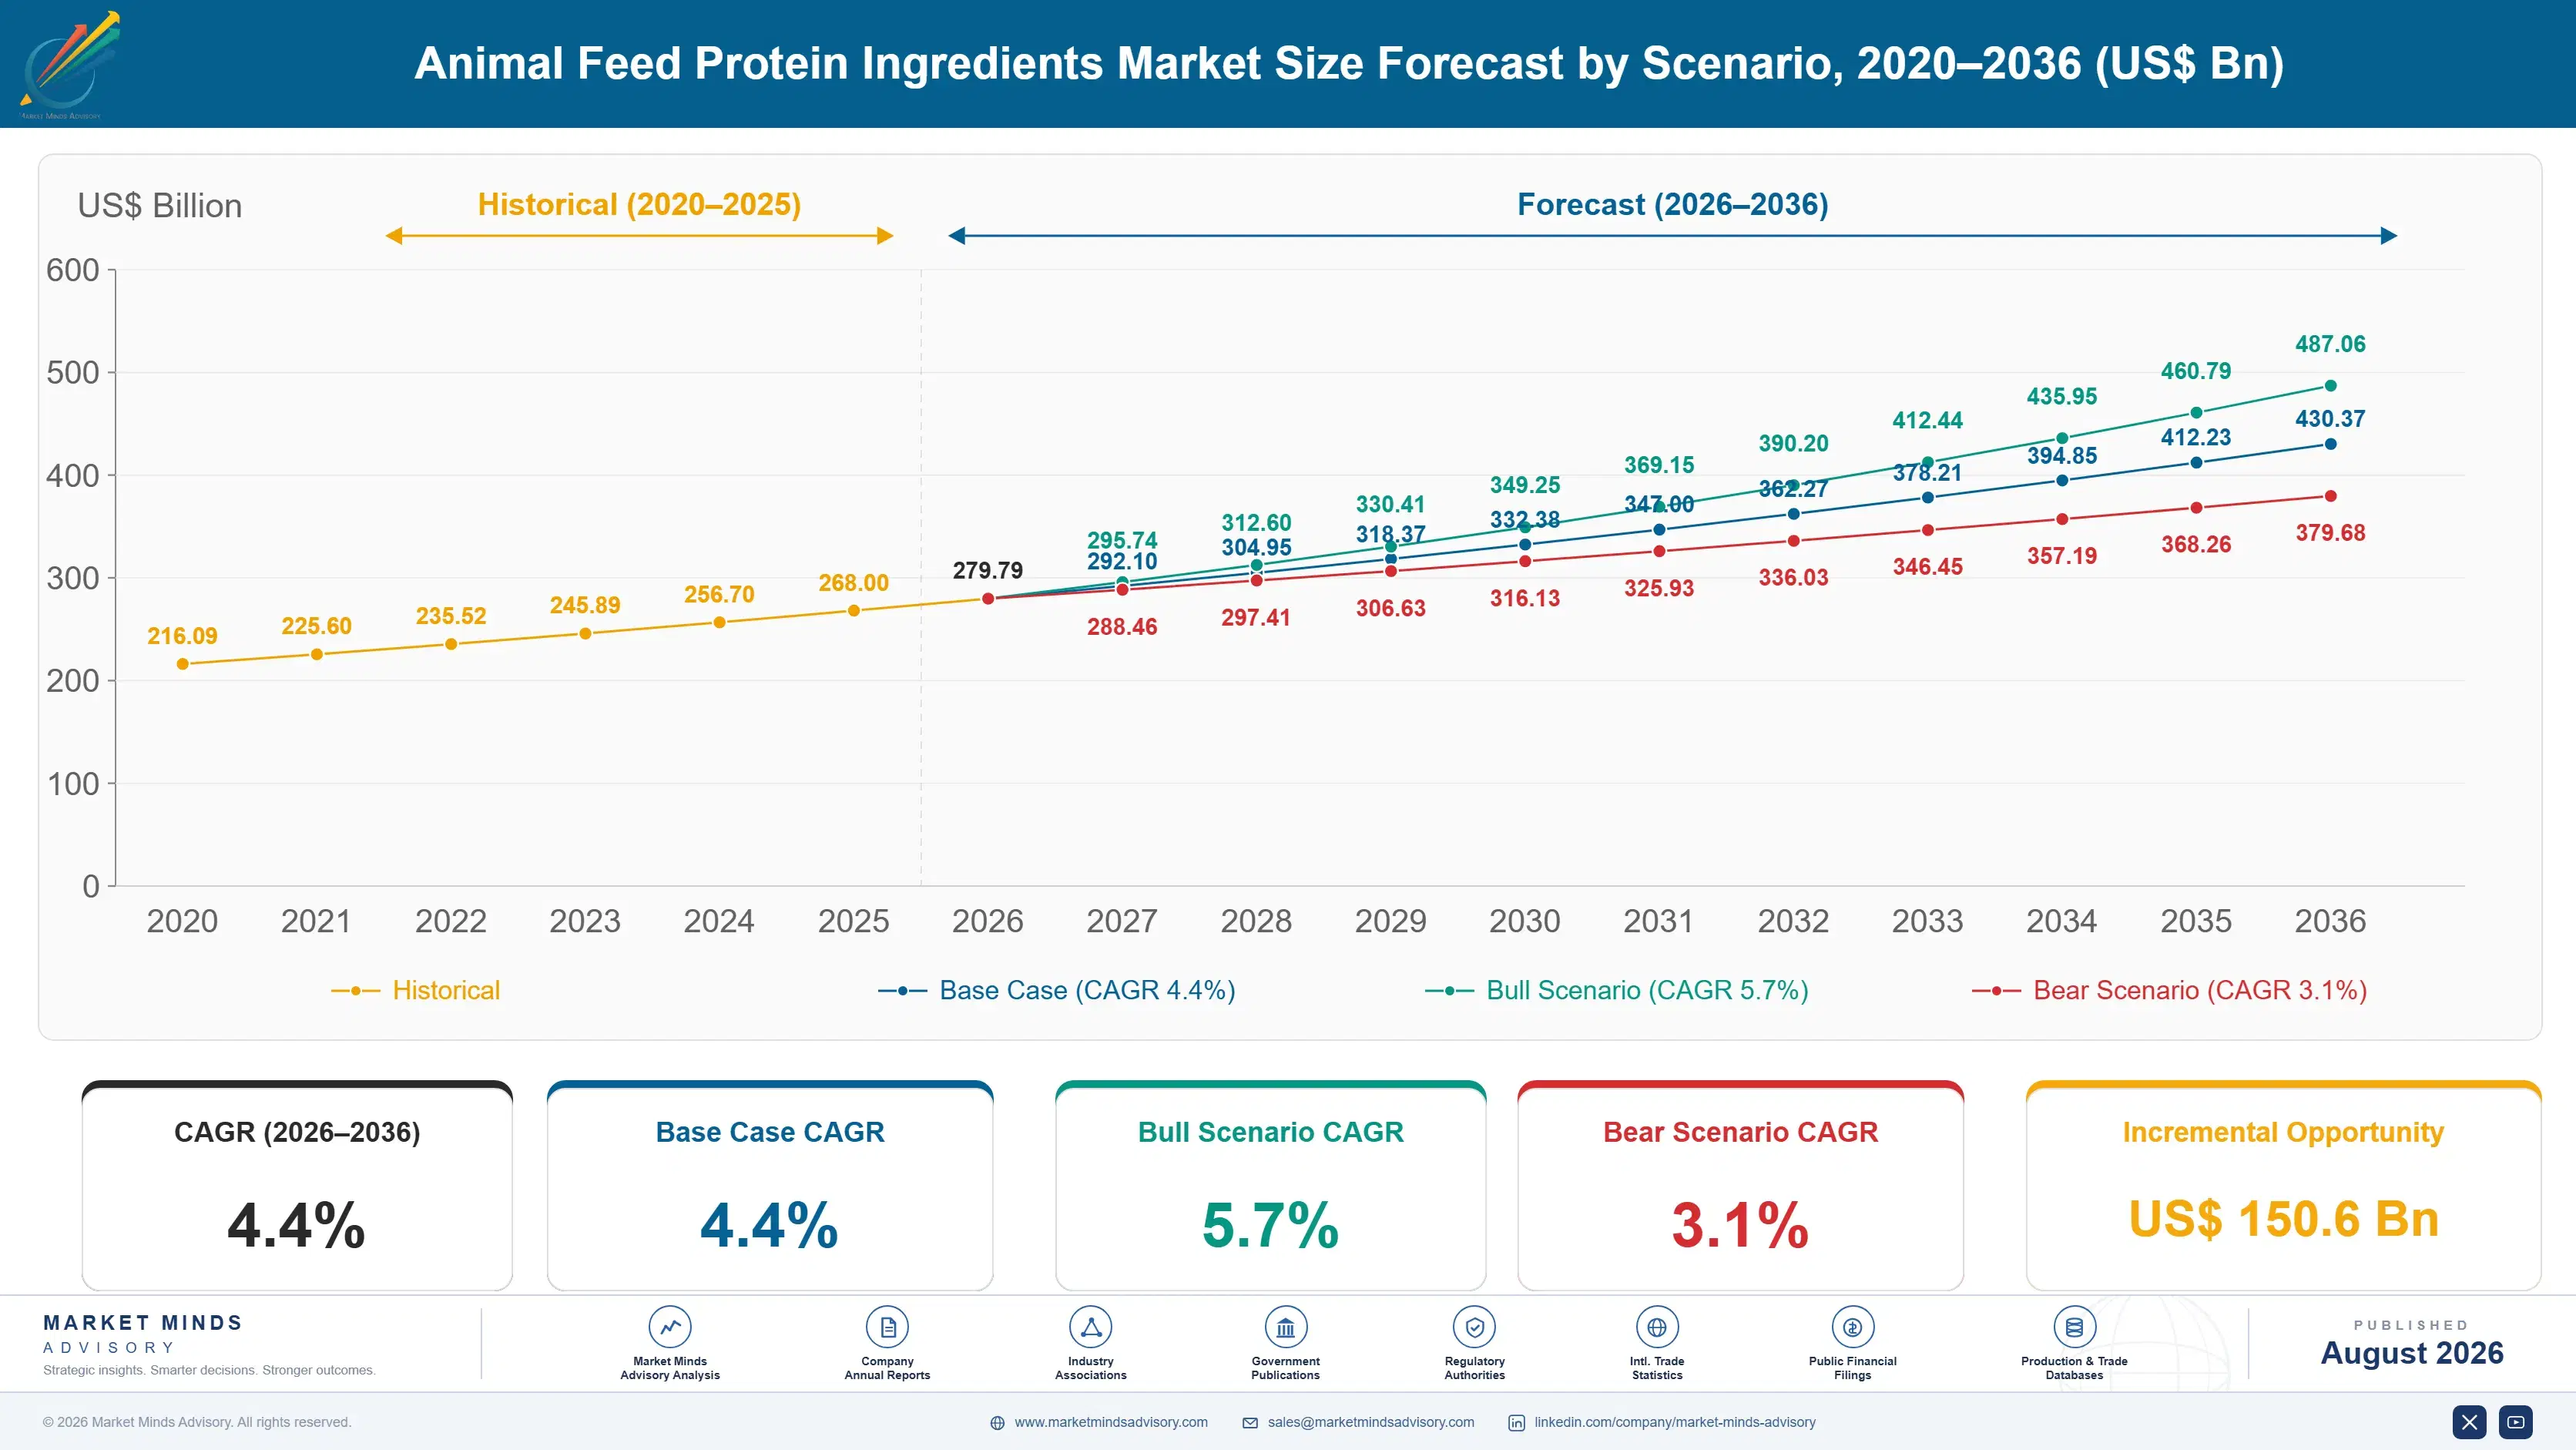
Animal Feed Protein Ingredients Market Forecast Scenarios

animal-feed-protein-ingredients-market-size-forecast-scenario-1787462342478
The 2020 to 2025 period was dominated by price rather than by tonnage. African swine fever recovery in China lifted feed demand through 2020 and 2021, Black Sea disruption pushed protein meal values to multi-year highs in 2022, and Argentine drought cut crush volumes in 2023. Volumes grew modestly, and the 3.7% historical growth reflects commodity pricing far more than expansion in animals fed.
The 4.4% base case rests on three mechanisms. Global meat and aquaculture production keeps rising in Asia, Africa, and Latin America, and every additional animal requires dietary protein regardless of source. Rendered animal proteins keep recovering European volume following the 2021 reopening for pig and poultry feed, displacing some oilseed meal at better nutritional density. And certified deforestation-compliant soy commands a premium that lifts value without adding tonnage. Amino acid substitution offsets part of the volume gain throughout.
The 5.7% bull case assumes protein meal prices stay firm while certified and alternative proteins scale faster than expected. The 3.1% bear case reflects aggressive amino acid substitution combined with Chinese policy success in cutting soybean meal inclusion, which together could remove tens of millions of tonnes of demand across the forecast period. Chinese policy is the variable.

Why Amino Acids Threaten Protein Volume

Three forces pull this market in different directions simultaneously. Animal protein consumption keeps rising across Asia, Africa, and Latin America, raising feed volume. Amino acid supplementation keeps improving, which lowers the protein density each tonne of feed needs. And origin regulation keeps tightening, which shifts value between suppliers without changing tonnage.
TOP-FIVE CONCENTRATION28%Share of traded feed protein volume held collectively
AVERAGE SELLING PRICE$486/tonneBlended price across oilseed meal and alternative proteins
SOYBEAN MEAL SHARE63%Portion of global feed protein supplied by soybean
CRUDE PROTEIN REDUCTION1.8ppAverage dietary protein cut through amino acid supplementation
TRADE INTENSITY42%Share of feed protein crossing a border before use
CERTIFIED VOLUME SHARE17%Deforestation-compliant material as proportion of European soy imports
The commercial character is that of a commodity business with a compliance layer bolted on. Oilseed meal trades on crush margins, freight, and origin basis, and the crushers who win are those with origination networks and port assets rather than superior product. What has changed is that a Brazilian cargo without geolocation evidence can no longer enter Europe legally, which means documentation quality now determines market access in a way that protein content never did. Traders have rebuilt sourcing systems accordingly.
The next decade tests whether alternative proteins matter commercially or only reputationally. Insect and microbial proteins grow at rates that look spectacular against a base of tens of thousands of tonnes, and they solve real problems in aquaculture and pet food. Whether they ever displace meaningful oilseed volume depends entirely on production cost, which remains several multiples above soybean meal on a protein-equivalent basis.
"The biggest competitor to soybean meal is not insect protein or single-cell protein. It is a nutritionist with a good amino acid matrix, quietly taking two points of crude protein out of a broiler diet and losing nothing."
Director, Agricultural Commodities and Feed Practice · MMA Agricultural Commodities / Animal Nutrition Practice · August 2026

Market Trends

Deforestation Rules Split Soy Supply Into Two Streams

The European Union Deforestation Regulation requires operators placing soy on the European market to hold geolocation data proving the material did not originate from land deforested after December 2020. That obligation has divided Brazilian and Argentine supply into documented and undocumented streams that trade at visibly different values, and it has pushed traders to rebuild origination systems around plot-level records rather than around elevator receipts. Compliance costs money and time, but non-compliant cargoes simply lose access to European buyers. Certified material now represents a meaningful and rising share of the flow into the bloc.
Market Impact: Adds 34 million tonnes demand
Processed Animal Proteins Return to European Pig and Poultry Diets

Regulation 2021/1372 reopened the use of processed animal proteins in European pig and poultry feed in August 2021, reversing a prohibition in place since the BSE crisis, with species separation rules preventing intra-species recycling. Poultry meal and porcine proteins offer better amino acid profiles and phosphorus availability than most oilseed meals, so nutritionists have reintroduced them where cost and consumer acceptance allow. Uptake has been slower than the regulation permits, largely because retailers remain cautious. The volume recovering is nonetheless material and comes directly at the expense of imported oilseed meal.
Market Impact: Delivers 12% higher digestible protein

Market Opportunities and Growth Drivers

Asian and African Animal Protein Consumption Keeps Rising

Poultry, pork, and farmed fish production continues expanding across China, Southeast Asia, India, and Sub-Saharan Africa as incomes rise and cold chain infrastructure reaches further into secondary cities. Every additional bird, pig, or fish requires dietary protein irrespective of which ingredient supplies it, which makes this the most reliable demand mechanism in the market. Vietnamese, Indonesian, and Nigerian compound feed output has grown consistently through 2024 and 2025. Volume growth here also shifts the geographic centre of gravity for trade flows, pulling South American and North American origination eastward year after year.
Market Impact: Cuts dietary protein 1.8 points

Rendered Protein Recovery Improves Nutritional Density Economics

Poultry meal, blood meal, and feather meal hydrolysates carry higher digestible protein and better phosphorus availability than soybean meal, which lets nutritionists hit specifications at lower inclusion rates and lower diet cost. European reopening in 2021 restored a channel closed for two decades, and American, Brazilian, and Australian renderers have expanded output for both domestic and export use. Pet food demand competes for the same material at higher prices, which supports pricing across the whole category. Renderers with species-separated processing lines and full traceability capture the premium reliably. Mixed streams without documented separation earn considerably less everywhere.
Market Impact: Costs 4x soybean meal equivalent

Market Restraints and Challenges

Amino Acid Supplementation Steadily Removes Protein Meal Demand

Industrial lysine, methionine, threonine, tryptophan, and valine let nutritionists formulate to digestible amino acid requirements rather than to crude protein, cutting dietary protein by roughly two percentage points without any loss in animal performance. The root cause is straightforward: soybean meal supplies amino acids in fixed ratios that rarely match what an animal needs, so excess protein is simply excreted. Every fermentation capacity addition in China or Europe removes soybean meal tonnage permanently. Meal suppliers respond by targeting species and geographies where amino acid supply is expensive, and by promoting nutritional density rather than protein percentage.
Market Impact: Covers 17% of European imports

Alternative Protein Costs Remain Multiples Above Oilseed Meal

Insect and microbial proteins currently cost several times more per unit of digestible protein than soybean meal, which confines them to aquaculture, pet food, and specialist piglet diets where performance premiums exist. The root cause is capital intensity: rearing or fermentation facilities carry heavy fixed costs against output measured in thousands of tonnes, while a soybean crush plant handles millions. Several European insect producers have restructured or scaled back after finding commodity feed markets unreachable. Participants respond by targeting high-value applications first, by pursuing waste-stream feedstocks, and by seeking co-product revenue from oils and frass.
Market Impact: Recovers 1.4 million tonnes annually
2 additional market trends, 4 additional growth drivers, and 3 additional restraints and challenges are covered in the full report. Contact sales@marketmindsadvisory.com to access the complete intelligence.

Segment CAGR and Growth Architecture

Segmentation follows protein origin, a single biological and supply-chain logic that determines cost structure, regulatory treatment, and which species may legally consume the material. Origin decides everything commercially relevant here, from trade documentation to amino acid profile. Species application, feed format, and channel structure appear separately in the framework as commercial dimensions rather than parallel segments.
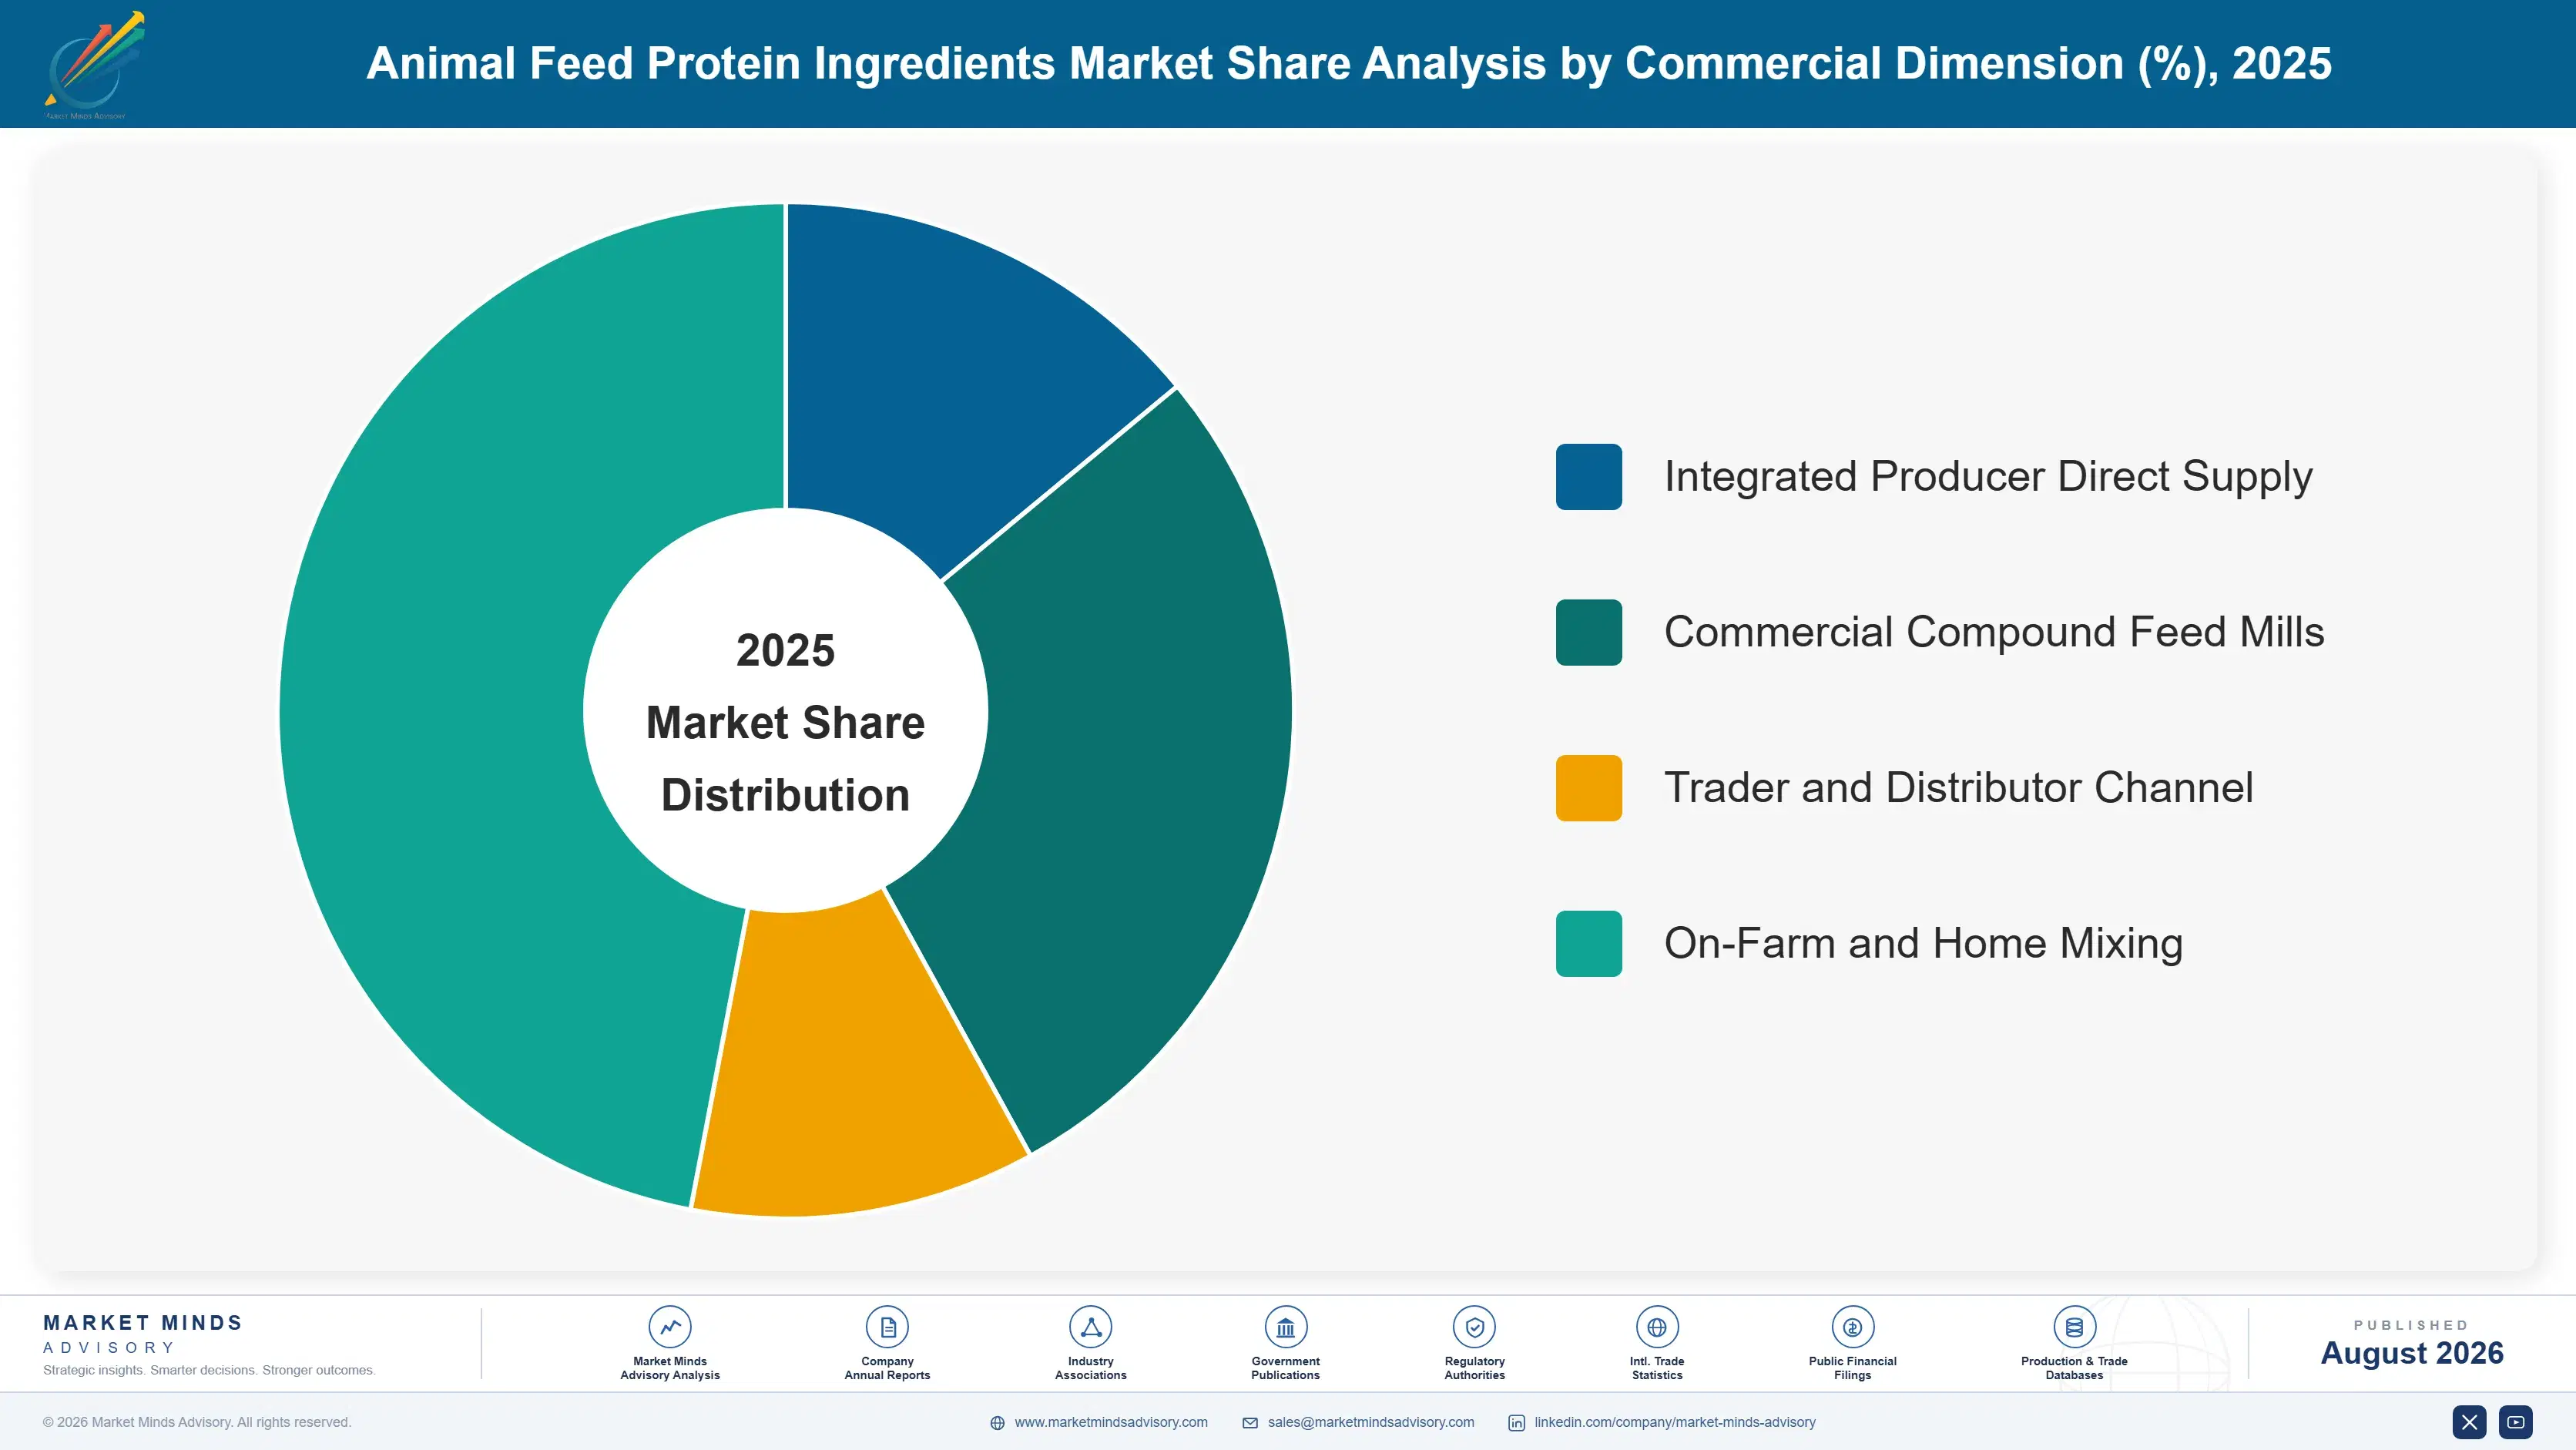
animal-feed-protein-ingredients-market-market-share-analysis-1787462343031

Insect Proteins

Growth of 21.3%, roughly 4.84 times the market, comes off a base measured in tens of thousands of tonnes rather than millions, so the rate flatters the commercial reality considerably. Black soldier fly and mealworm meals hold European authorisation for aquaculture since 2017 and for pig and poultry feed since 2021, and they perform well in aquafeed and pet food where buyers pay for functionality. The binding constraint is production cost, which sits several multiples above soybean meal per unit of digestible protein. Several European producers have restructured after discovering that commodity feed markets remain unreachable, and survivors have narrowed focus toward aquaculture, pet food, and premium piglet applications. Volumes remain trivial against oilseed meal.
CAGR 21.3%

Microbial and Single-Cell Proteins

Bacterial, yeast, and algal proteins produced by fermentation on methane, methanol, or sugar substrates offer something no agricultural protein can match: output uncoupled from land, weather, and harvest cycles entirely. Growth of 17.6% reflects capacity commissioning rather than established demand, with projects in Norway, Denmark, the United States, and China at various stages. Aquaculture is the beachhead application because fishmeal pricing sets a high enough benchmark to clear. The economics depend on substrate cost and on cheap energy, so siting decisions matter more than technology choice. Scaling to volumes that would affect oilseed demand remains a long way off on any realistic capital deployment schedule. Aquaculture buyers will pay; poultry integrators will not, at least not yet.
CAGR 17.6%
Full segment breakdown across 6 segments available in the complete report.

Regional Architecture and Country Demand Map

East Asia holds the largest share at 30%, driven by Chinese compound feed output that exceeds any other region by a wide margin. North America and Latin America dominate supply rather than demand, while South Asia and Pacific grows fastest as poultry and aquaculture production expands.

North America

This region is a supplier before it is a consumer, and both roles shape pricing globally. American soybean crushing capacity has expanded substantially since 2022, driven by renewable diesel demand for soybean oil, which has increased meal availability as an unavoidable co-product and pressured meal prices downward. Domestic demand comes from broiler production across Georgia, Arkansas, and Alabama, hog production in Iowa and North Carolina, and a large rendering industry supplying both feed and pet food. Canadian canola meal moves into American dairy rations at scale. Regional growth of 3.6% reflects a mature herd base where value shifts on crush economics rather than on rising animal numbers. Meal is increasingly a by-product of oil policy.
Share: 24% | CAGR: 3.6% (2026 to 2036)

Western Europe

Regulation defines this market more than any commercial variable does. The European Union Deforestation Regulation requires plot-level geolocation evidence for imported soy, splitting supply into compliant and non-compliant streams and forcing traders to rebuild origination systems entirely. Regulation 2021/1372 reopened processed animal proteins for pig and poultry feed in 2021, restoring a channel closed since the BSE crisis, though retailer caution has slowed uptake below what the rules permit. Dutch, German, Spanish, and French crushers handle substantial rapeseed and imported soybean volume. Growth of 2.9% reflects a contracting livestock herd under nitrogen and emissions constraints, particularly in the Netherlands and Denmark. Compliance capability now decides which traders keep European access at all.
Share: 18% | CAGR: 2.9% (2026 to 2036)
Regional intelligence for 5 additional markets available in the complete report: East Asia, South Asia and Pacific, Latin America, Middle East and Africa, Eastern Europe. Contact sales@marketmindsadvisory.com.
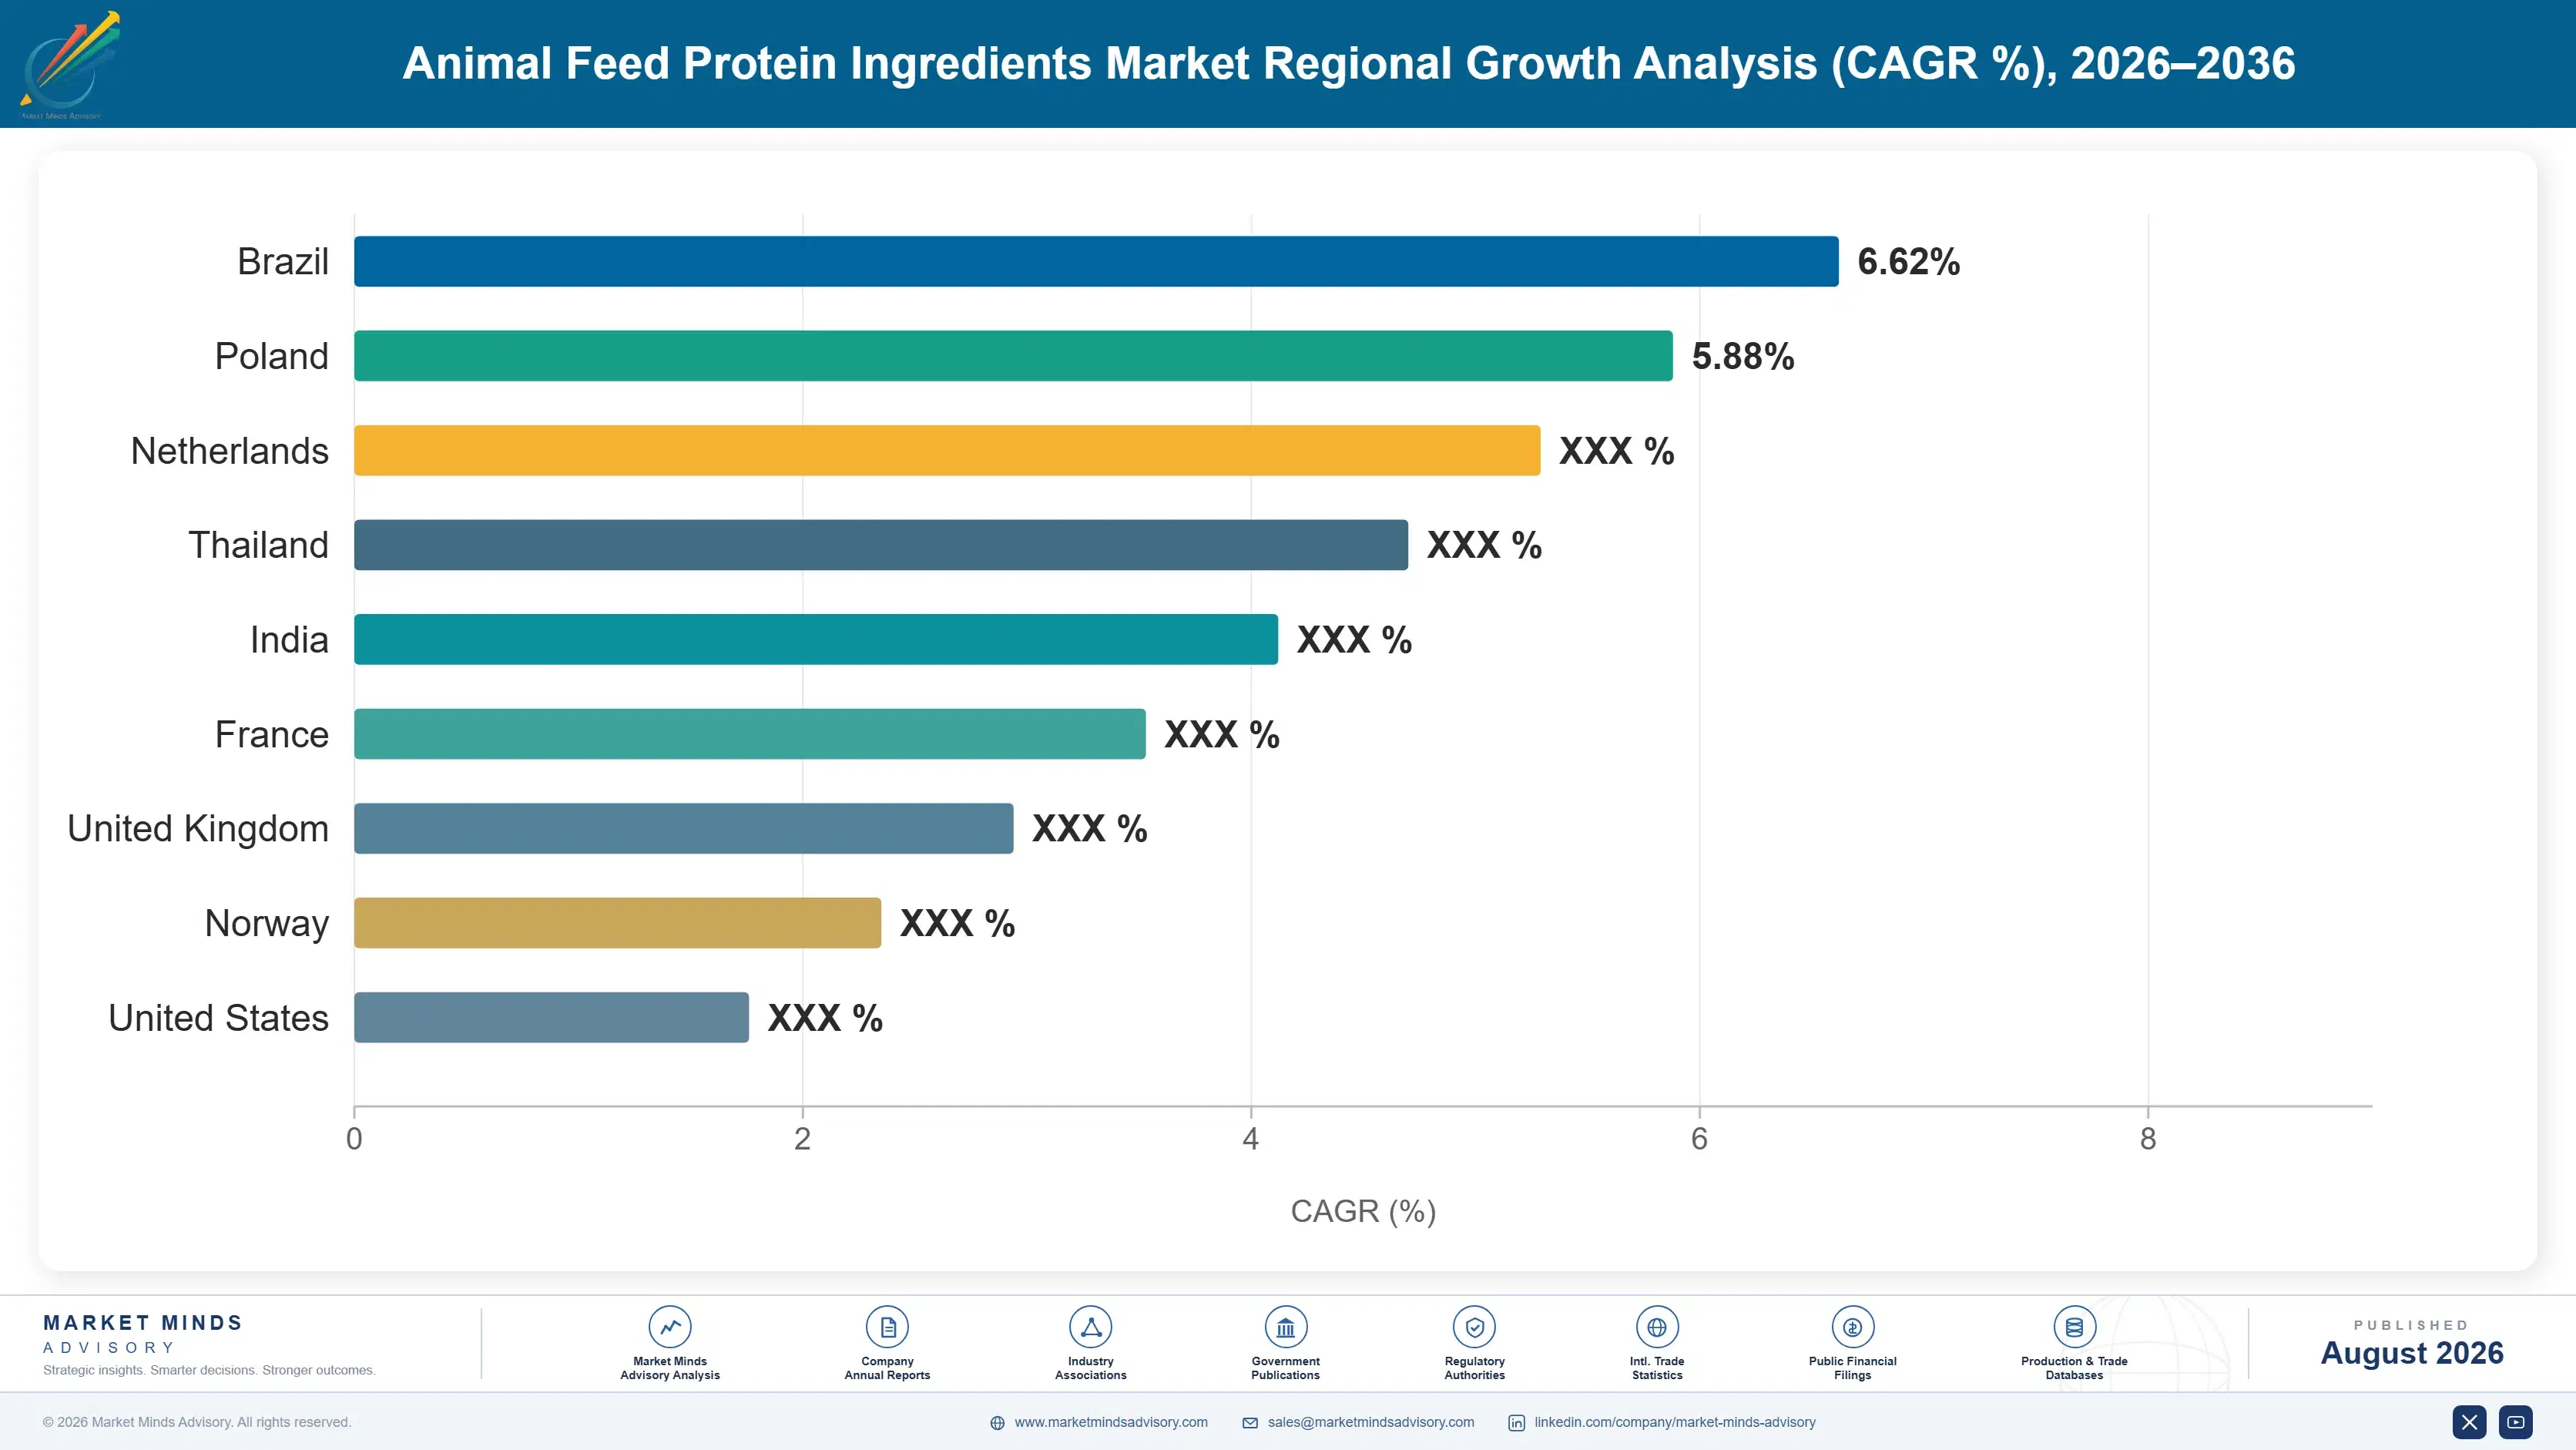
animal-feed-protein-ingredients-market-country-cagr-analysis-1787462343544

Where Feed Protein Margin Actually Sits

Trading oilseed meal on crush margin is a volume business with thin and cyclical returns. The four moves below shift revenue toward positions competitors cannot copy from a spreadsheet: verified origin documentation, nutritional density selling, rendered stream separation, and the amino acid partnerships that turn a demand threat into a joint commercial offer. None requires new crush capacity.

Build Plot-Level Origin Documentation Ahead of Enforcement

European deforestation obligations require geolocation evidence that most South American supply chains were never designed to produce, and traders scrambling to assemble it after enforcement begins will pay far more than those who built systems early. Documented cargoes already trade at a premium of roughly $18 to $28 per tonne over undocumented equivalents into European destinations. The system investment runs perhaps $4 million for a mid-sized originator. It also creates a durable position, since farmers enrolled in a verification programme rarely move to a competitor without cause. Enforcement timetables will not wait for slow adopters here.
Market Impact: Captures a $18 to $28 per tonne premium

Sell Digestible Amino Acids Rather Than Crude Protein

Nutritionists formulate against digestible amino acid requirements, yet most meal is still marketed on crude protein percentage, which understates the value of higher-quality material considerably. Suppliers publishing digestibility coefficients by species, backed by in vivo work rather than book values, let formulators reduce inclusion and hit specification at lower total diet cost. That capability supports a premium of 4% to 7% over commodity meal of the same declared protein. It also builds relationships with nutritionists rather than only with procurement, which is where formulation decisions actually get made. Procurement rarely knows what the nutritionist actually values.
Market Impact: Supports a 4 to 7% price premium consistently

Separate Rendered Streams by Species and Traceability

European reopening of processed animal proteins in 2021 requires strict species separation, and pet food buyers pay considerably more for fully traceable single-species material than feed buyers pay for mixed streams. Renderers who invest in dedicated lines and documented collection can direct the same raw material toward whichever channel prices best that quarter. Line separation costs around $9 million per facility and typically pays back inside four years. The optionality matters as much as the premium, since pet food and feed demand rarely soften at the same time. Few renderers have made the investment so far.
Market Impact: Adds a 22% premium on species-separated rendered streams

Partner With Amino Acid Suppliers Instead of Resisting Them

Amino acid substitution removes soybean meal tonnage permanently, and no marketing programme will reverse that. Suppliers who instead build joint offers with lysine and methionine producers, selling an optimised low-protein diet package rather than a commodity ingredient, capture value from the transition rather than losing to it. The combined proposition lets integrators cut nitrogen excretion by roughly 20% while holding performance, which matters increasingly under European and Chinese environmental rules. Margin on the package exceeds commodity meal margin by several points and the relationship proves far more durable. Resisting the trend has not worked for anyone.
Market Impact: Cuts customer nitrogen excretion by roughly 20% overall

Who Controls the Margin Pool

Concentration is low: the top five hold roughly 28% of traded feed protein volume, measured consistently as tonnage originated, processed, or traded at ingredient level. Cargill, ADM, Bunge, Louis Dreyfus, and COFCO dominate the oilseed complex through origination networks, crush capacity, and port assets, yet rendered proteins, sunflower meal, and regional co-product streams are handled by hundreds of operators the majors never touch. The gap is infrastructure, not product.
Competition runs along three lines. Origination and documentation capability is the first, sharpened considerably by European deforestation requirements that reward traders with plot-level farmer relationships. Crush capacity positioning is the second, with American expansion driven by renewable diesel demand for soybean oil creating meal as an unavoidable co-product. The third is alternative protein investment, where several majors hold minority positions in insect and fermentation ventures without committing heavily.

Two pressures will reshape positions. Amino acid producers are effectively competitors now, since every fermentation capacity addition removes meal tonnage, and Chinese policy actively encourages that substitution. Meanwhile renderers with species-separated traceable streams are capturing value that oilseed suppliers previously held by default. The exposed position is a mid-sized crusher without origination depth, documentation systems, or a differentiated nutritional proposition to defend.
animal-feed-protein-ingredients-market-company-positioning-matrix-1787462344069

Competitive Moat and Risk Dimensions

CARGILL

Moat: Origination and Port Infrastructure

Cargill operates farmer relationships, inland elevators, river terminals, and export capacity across the major origins, which lets it move protein between destinations as basis and freight shift. That infrastructure took decades and enormous capital, and it now underpins the plot-level documentation European buyers require. Competitors without comparable origination depth cannot assemble compliant cargoes at similar cost or reliability.
CARGILL

Risk: Commodity Margin Cyclicality

Crush and trading margins swing widely with harvest outcomes, freight, and policy shocks, and no amount of scale removes that volatility. The 2023 Argentine drought and subsequent American crush expansion both compressed returns sharply. Value-added positions in documentation and nutrition remain small relative to the commodity book, so earnings still follow agricultural cycles more closely than management would prefer.
ARCHER DANIELS MIDLAND

Moat: Integrated Crush and Processing

The company converts oilseeds into meal, oil, and downstream nutrition products within integrated complexes, capturing value at several points along a single flow. Renewable diesel demand for soybean oil has improved the economics of crushing considerably, which effectively subsidises meal production. That integration gives flexibility on how value is realised that pure crushers or pure traders cannot match.
ARCHER DANIELS MIDLAND

Risk: Meal As Unavoidable Co-Product

When crushing is driven by oil demand rather than meal demand, meal arrives whether the market wants it or not, and prices soften accordingly. American crush expansion since 2022 has already pressured meal values. If renewable diesel policy support continues while amino acid substitution reduces meal requirements, the co-product could shift from contributor to persistent drag on complex returns.

Players Tracked

Prominent Players

Cargill
Archer Daniels Midland
Bunge Global
Louis Dreyfus Company
COFCO International

Other Key Players

Wilmar International
CJ CheilJedang
Darling Ingredients
Nutreco
Alltech
Pelagia AS
TripleNine Group
Protix
InnovaFeed
Ynsect
Calysta
Unibio
Corbion
Lallemand
Roquette Freres

Recent Developments

FEBRUARY 2025

European Commission confirms deforestation regulation application timetable

The European Commission confirmed the timetable for applying deforestation due diligence obligations to soy and other listed commodities, after an earlier postponement. Traders and crushers responded by accelerating plot-level data collection across Brazilian and Argentine supply chains, and compliant cargo premiums into European destinations widened noticeably through the following quarter.
Signal: Origin documentation has become a market access requirement rather than a voluntary sustainability programme for suppliers.
AUGUST 2024

American soybean crush capacity expansion continues on oil demand

Further American soybean crushing capacity came into service, driven principally by renewable diesel demand for soybean oil rather than by any increase in meal requirement. The additional meal output pressured domestic prices and increased exportable surplus, altering trade flows into Asian and European destinations during the second half.
Signal: Meal supply is now being set by oil policy, which decouples availability from actual feed demand.
NOVEMBER 2024

European insect protein producers restructure amid cost pressure

Several European insect protein producers restructured operations or reduced expansion plans after finding that commodity feed markets remained unreachable at achievable production costs. Survivors narrowed commercial focus toward aquaculture, pet food, and premium piglet applications where performance premiums exist and volumes are smaller but far better priced.
Signal: Alternative proteins are becoming specialty ingredients rather than commodity substitutes, which changes their competitive relevance entirely.

Crush Margins, Freight, and Origin Risk

Raw oilseed purchase dominates everything, running roughly 78% of delivered cost for a crusher, sourced from Brazil, the United States, Argentina, Canada, Ukraine, and Australia. Energy for extraction, desolventising, and drying takes around 7%, drawn from natural gas and grid power. Ocean and inland freight contributes 9% on traded volumes, and hexane, utilities, and labour absorb the balance across most crushing operations.
The 2022 Black Sea disruption removed Ukrainian sunflower meal from world trade abruptly and pushed all protein meal values to multi-year highs, while European gas prices rose steeply according to IEA reporting, raising extraction costs when margins looked attractive. The 2023 Argentine drought then cut crush volumes to decade lows. Bunge and ADM both referenced margin volatility across their 2023 and 2024 annual reporting, and several European crushers idled capacity rather than run negative.

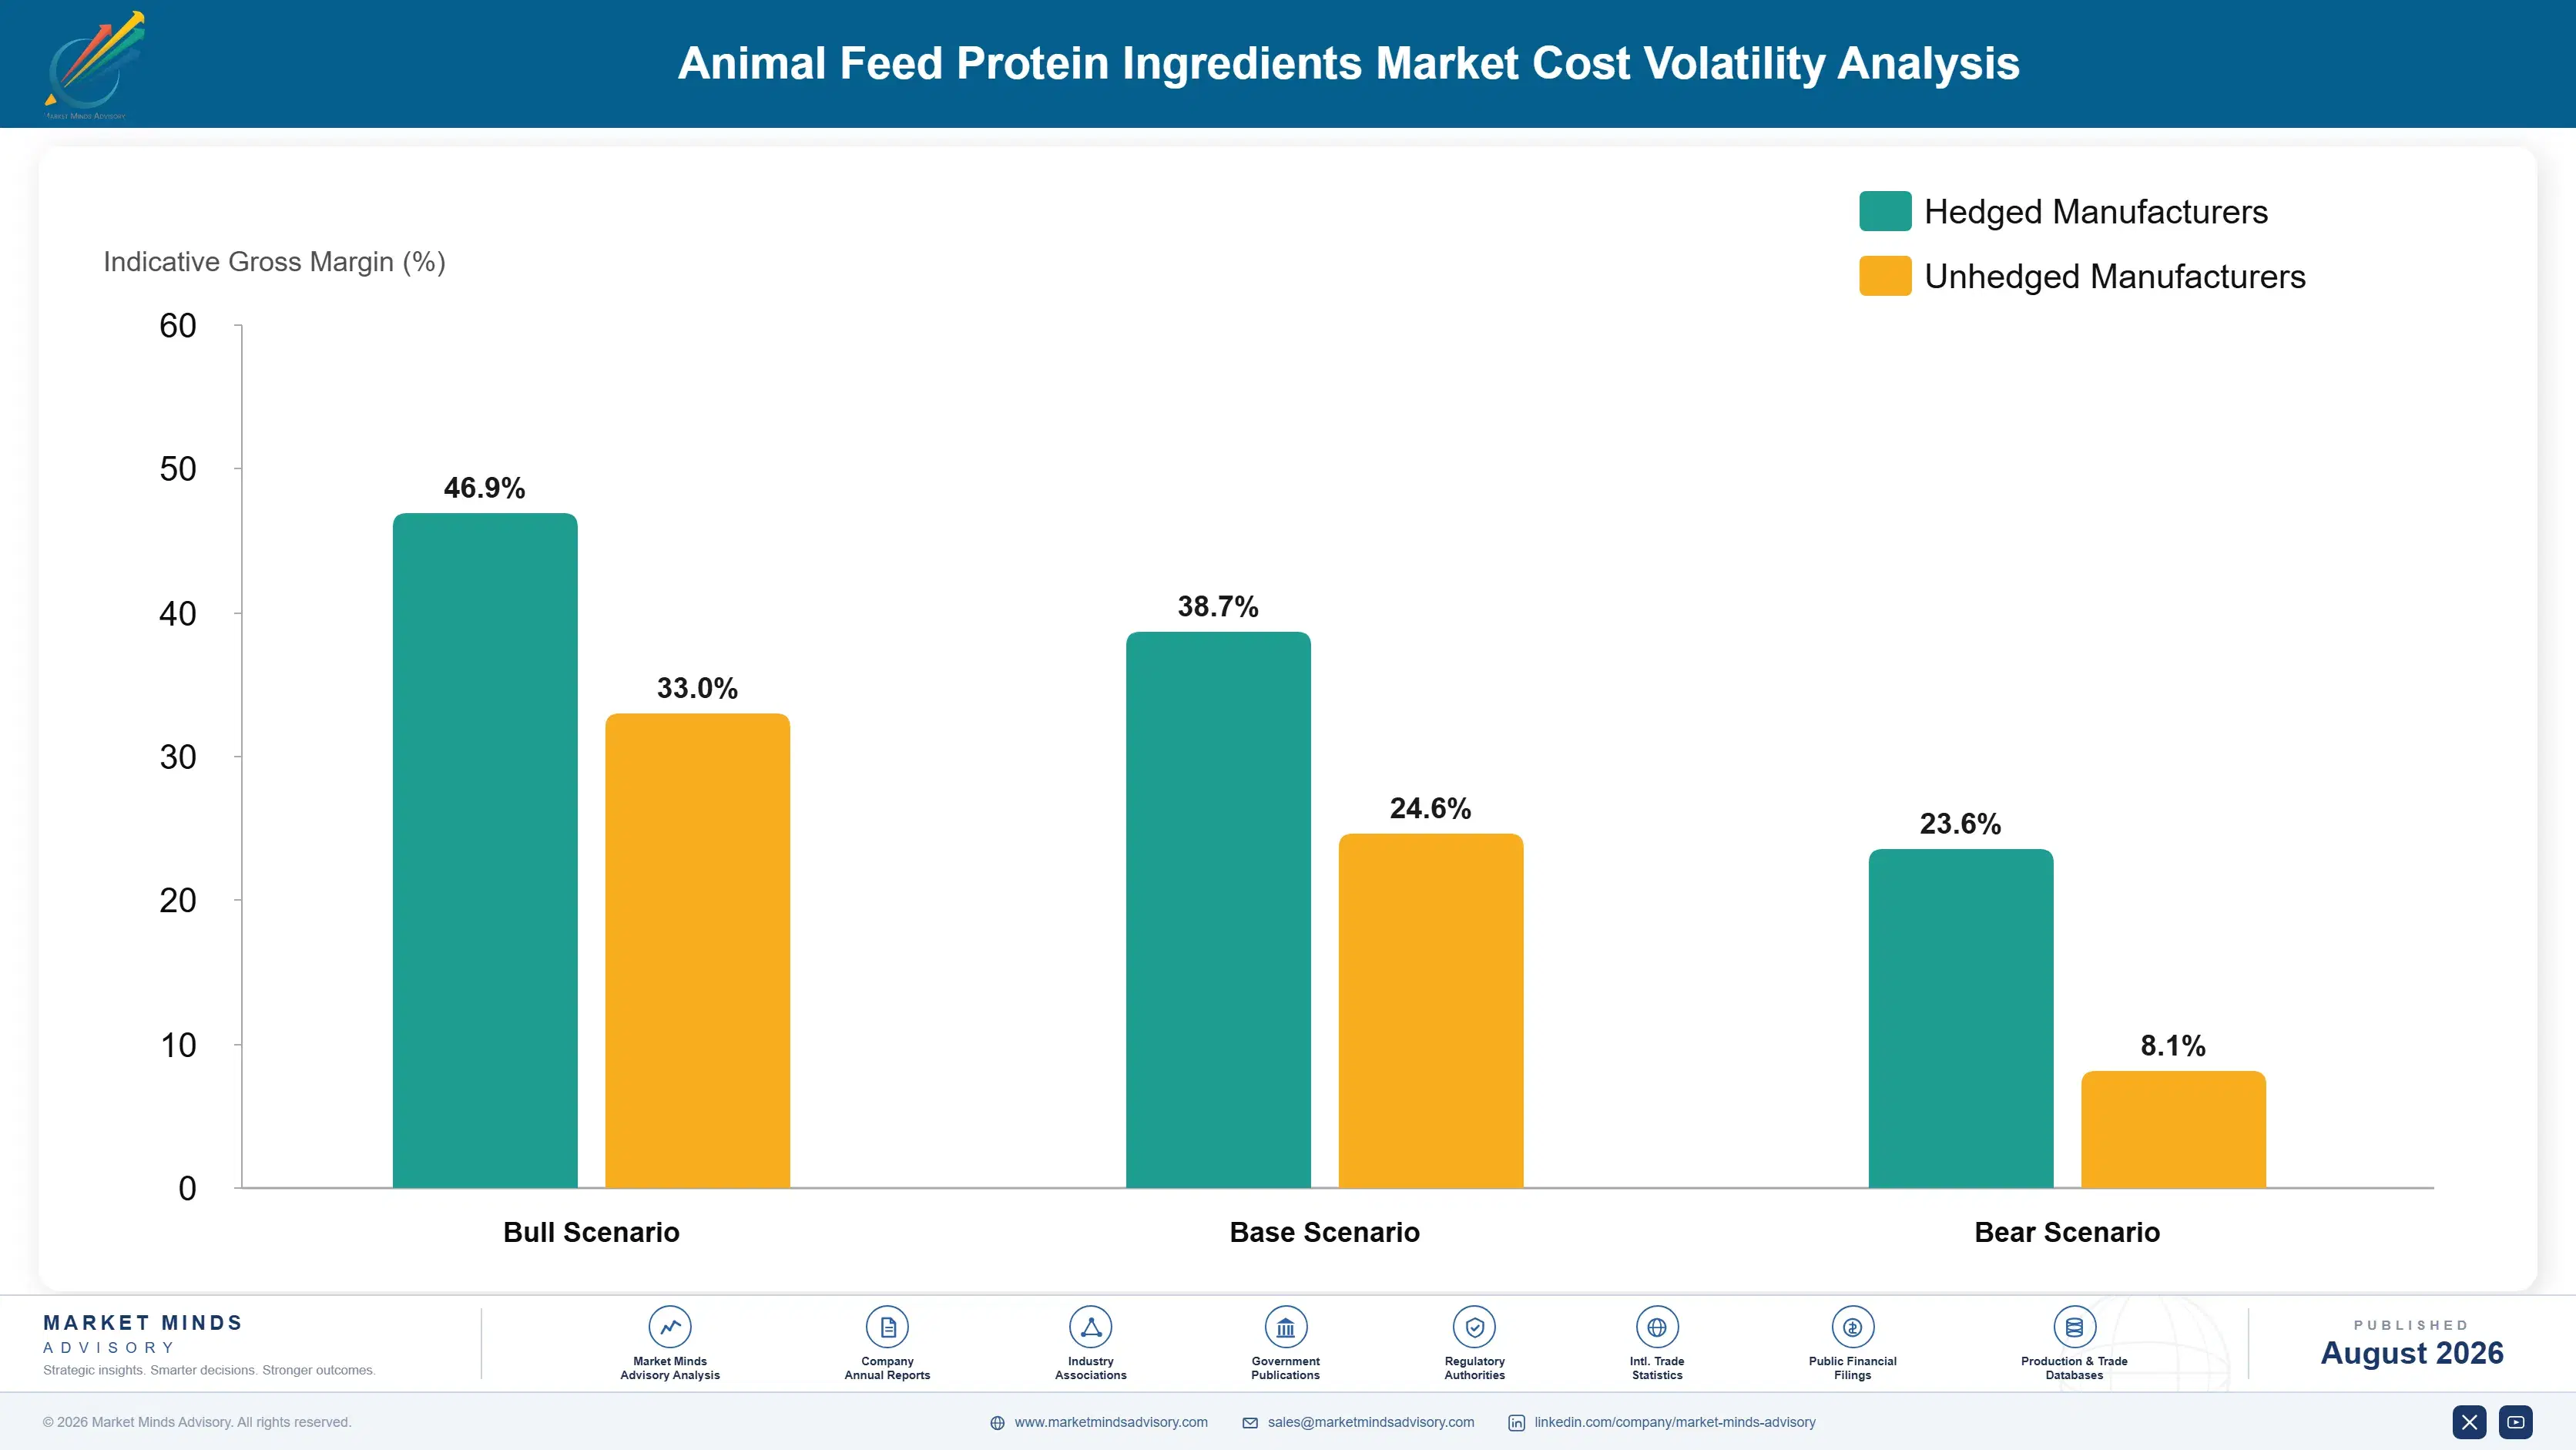
Exposure varies by integration and by origin position rather than by scale alone. Traders with origination across multiple hemispheres shift purchasing as harvests diverge, and hedge on liquid futures markets. Regional crushers tied to one origin absorb every local weather outcome. Renderers face different exposure, since raw material arrives with slaughter volume and is priced by abattoir contracts rather than commodity markets.
animal-feed-protein-ingredients-market-cost-volatility-analysis-1787462344267

Multi-hemisphere origination with basis rather than flat price exposure

Holding origination capability across both hemispheres means a Northern Hemisphere harvest failure meets a Southern Hemisphere crop already growing. Managing basis risk rather than flat price, through futures hedging combined with physical optionality, keeps the exposure inside a manageable band. Regional crushers tied to one origin have no equivalent protection and absorb every local weather outcome in full.

Energy contracting matched to seasonal crush campaign patterns

Extraction and desolventising loads follow crush campaigns rather than a flat annual profile, so contracting energy against actual seasonal demand avoids paying peak rates during harvest processing peaks. European crushers caught by the 2022 gas spike learned that expensively. The saving is a point or two of margin, which matters in a business running on thin spreads.

Farmer verification programmes financed as origination investment

Deforestation documentation costs money, but enrolling farmers into verification programmes creates supply relationships that competitors cannot access quickly. Treating the spend as origination investment rather than compliance overhead changes how it is evaluated internally. Enrolled growers rarely move to another buyer without cause, which converts a regulatory cost into a durable sourcing position over several seasons.

Portfolio Architecture for Margin Defence

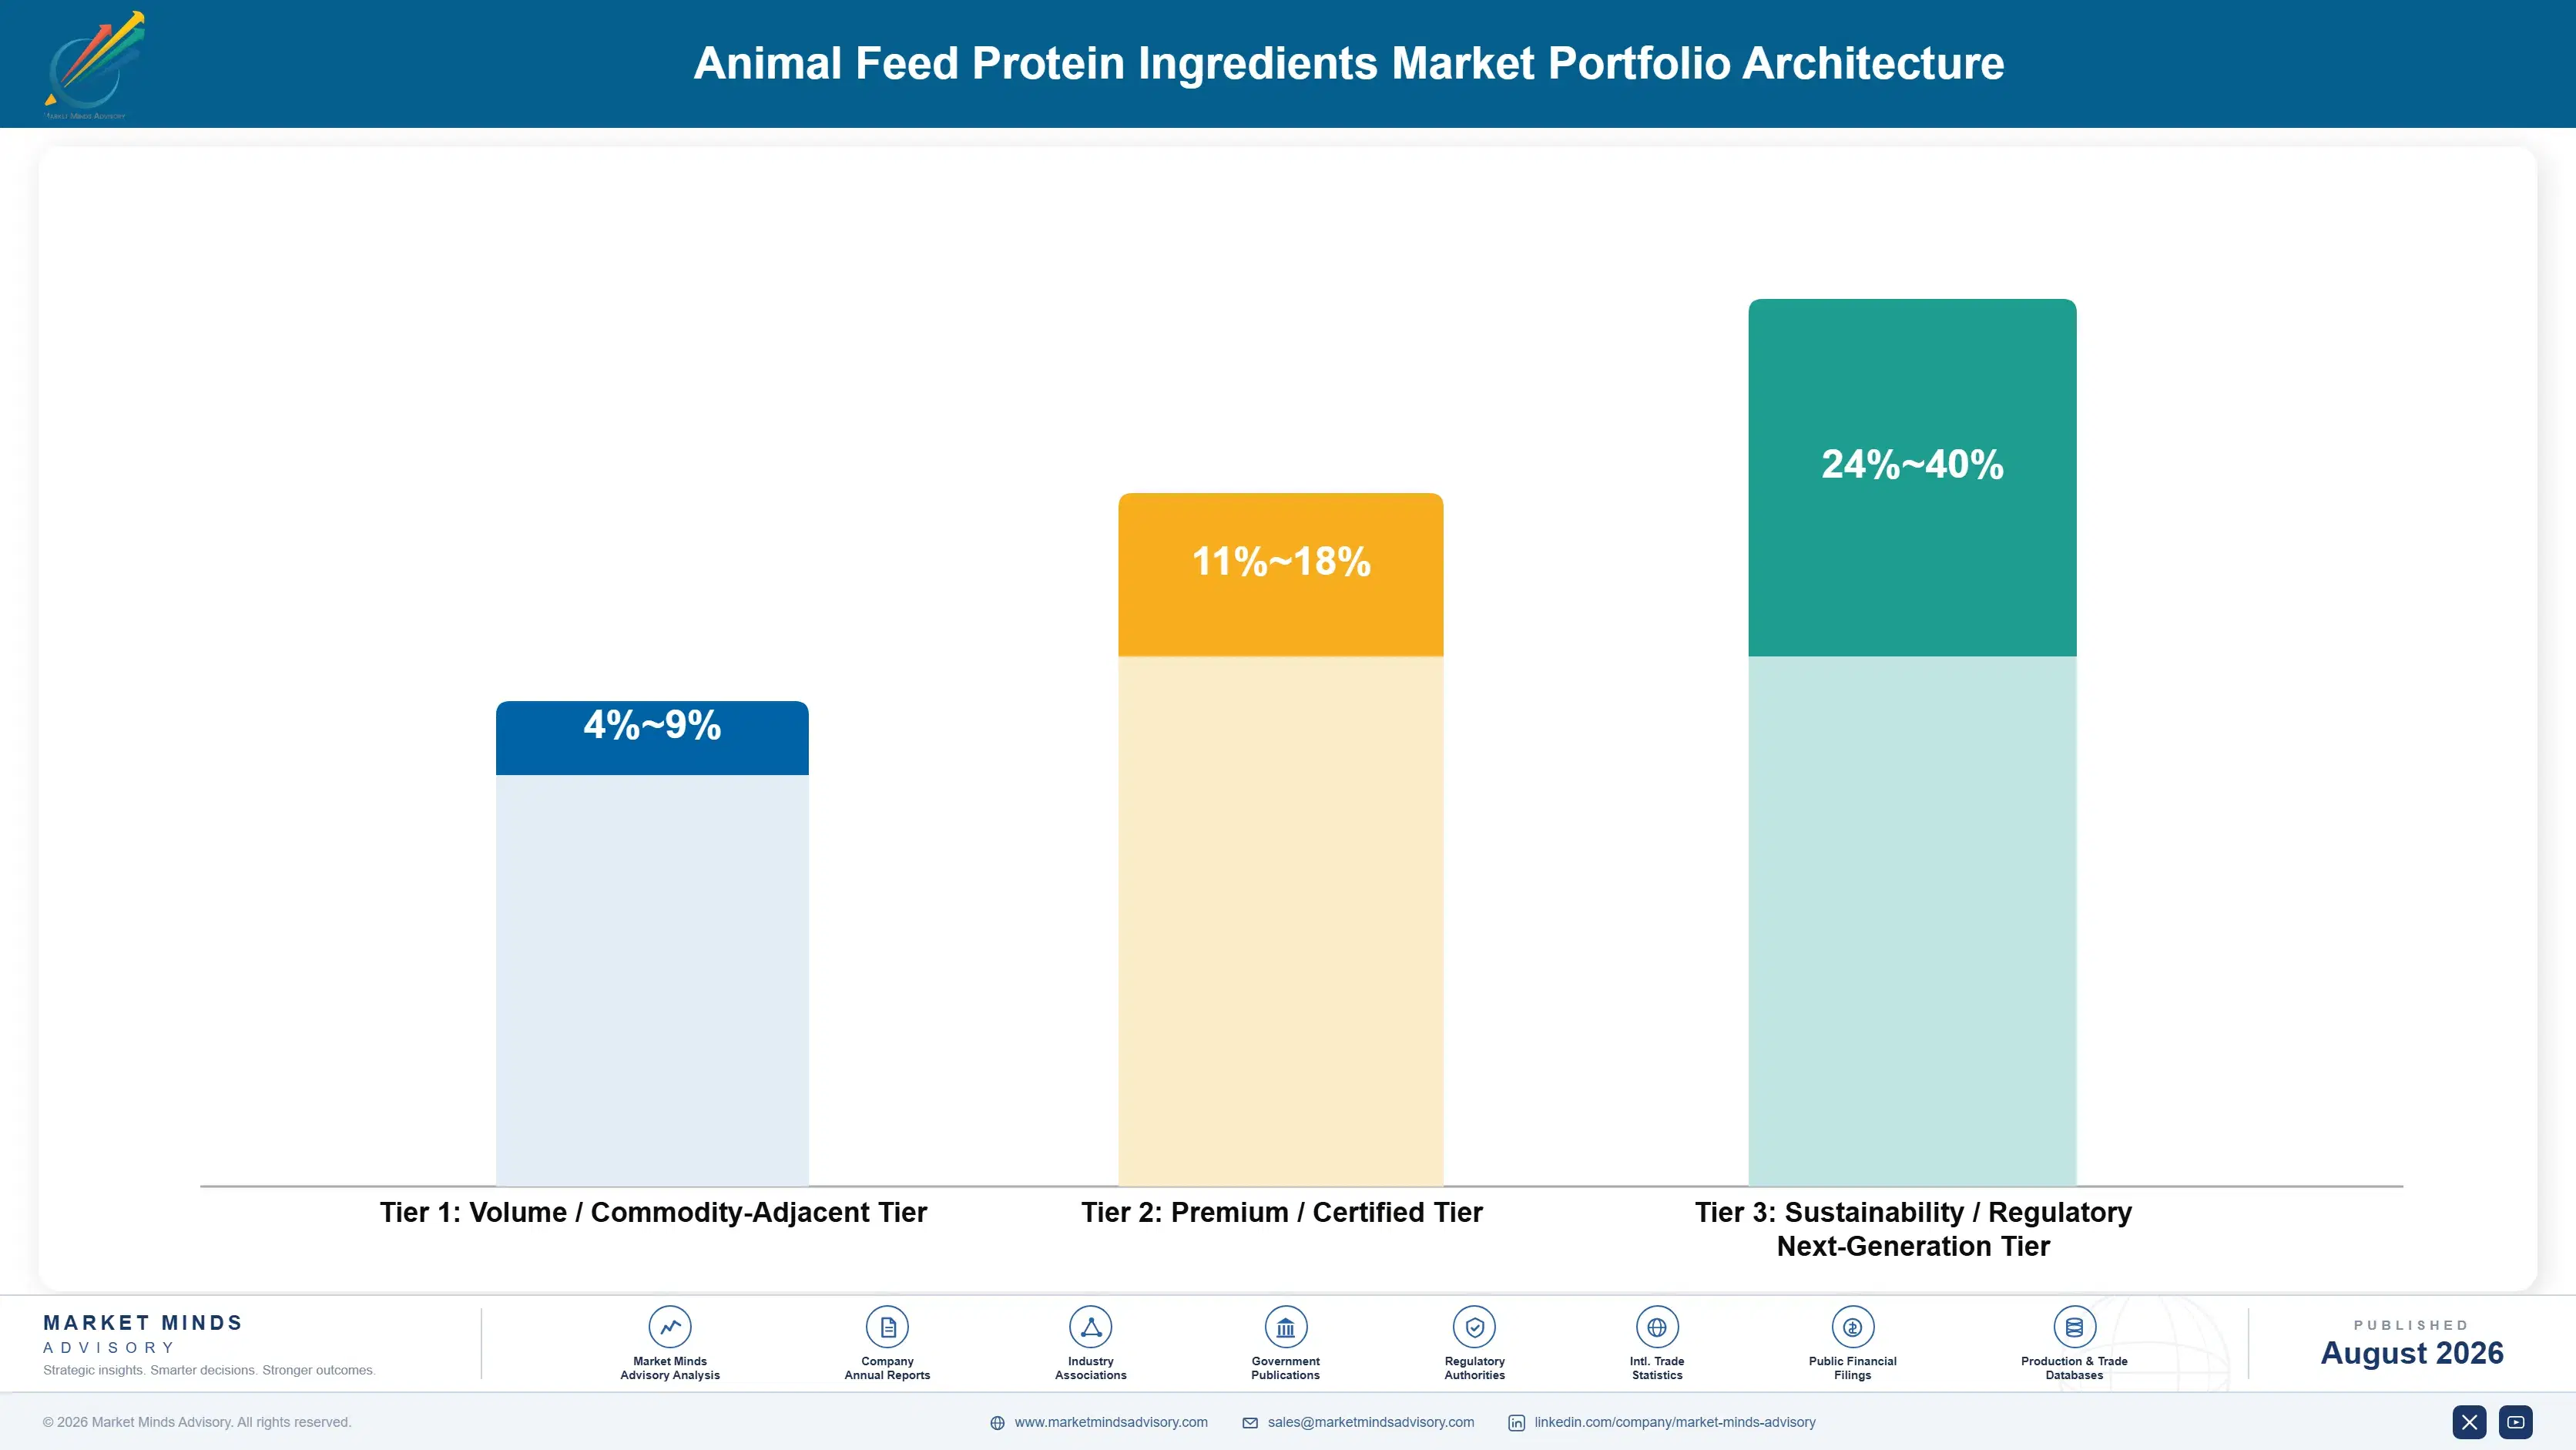
Three tiers separate on documentation and nutritional evidence rather than on protein content. Undifferentiated oilseed meal traded on declared crude protein earns 4% to 9%, which is normal for a commodity flow business. Certified deforestation-compliant and species-separated traceable material earns 11% to 18%, because the buyer needs market access rather than better nutrition. Alternative and specialty proteins sold on documented performance earn far more on much smaller volume.
The tension is between tonnage and differentiation, and most operators resolve it badly. Commodity meal volume keeps crush plants and logistics assets loaded, which is genuinely necessary, but chasing it at commodity margin leaves nothing to fund documentation systems or nutritional evidence work. Several crushers have found that a modest certified programme, run properly, contributes more to earnings than a large increment of undifferentiated volume ever did.

High-value pools sit where the buyer needs something protein content cannot supply. Market access through deforestation compliance, species-separated traceability for pet food, and documented digestibility for precision formulation all resist commodity pricing because they solve problems tonnage alone cannot address. Buyers in those pools cannot simply retender on price, because the alternative supplier would need seasons to assemble an equivalent position.

Volume / Commodity-Adjacent Tier

Undifferentiated soybean, rapeseed, and sunflower meal traded on declared crude protein and delivered cost. Competes purely on basis and freight. The wide range reflects large differences in origination depth and crush integration between operators across the cycle.
Gross Margin: 4%-9%

Premium / Certified Tier

Deforestation-compliant soy carrying plot-level geolocation evidence, plus species-separated rendered proteins with documented traceability. Buyers pay for market access and audit survival. Range width separates single-certification material from fully documented supply chains.
Gross Margin: 11%-18%

Sustainability / Regulatory / Next-Generation Tier

Insect, microbial, and single-cell proteins sold on documented performance into aquaculture, pet food, and premium piglet diets. Scarcity and functional evidence, rather than production economics, sustain the margin structure across this tier today.
Gross Margin: 24%-40%
animal-feed-protein-ingredients-market-portfolio-architecture-1787462344775

High-value Sub-segments and Strategic Watch-out

Deforestation-Compliant Certified Soy

Highest value in the oilseed complex and growing as enforcement tightens. Documented cargoes trade at $18 to $28 per tonne over undocumented equivalents into European destinations. Farmer enrolment creates supply relationships competitors cannot assemble quickly once obligations bind. Enrolling growers now beats chasing certified premiums later.
Gross Margin: 14%-22%

Species-Separated Rendered Proteins

High value with steady growth, serving pet food and reopened European feed channels at once. Pet food buyers pay considerably more for traceable single-species material. The dual channel provides useful optionality, since pet food and feed demand rarely soften together. Traceability systems are the barrier, not capacity.
Gross Margin: 16%-26%

Commodity Soybean and Rapeseed Meal

The volume core at 63% of global feed protein, traded on basis and freight with margins that follow crush spreads rather than any commercial skill. It keeps assets loaded and funds everything else, which is the honest reason to retain the position. Expect nothing more from it.
Gross Margin: 3%-8%

Standard Fishmeal for Aquaculture

The strategic watch-out. Anchoveta quota volatility makes supply unreliable while substitution programmes reduce inclusion permanently with every reformulation cycle. Pricing stays high but volume erodes, and no participant should build capacity assuming the tonnage returns. Price strength here is disguising a demand base that keeps shrinking.
Gross Margin: 10%-20%

How Feed Formulas Actually Renew

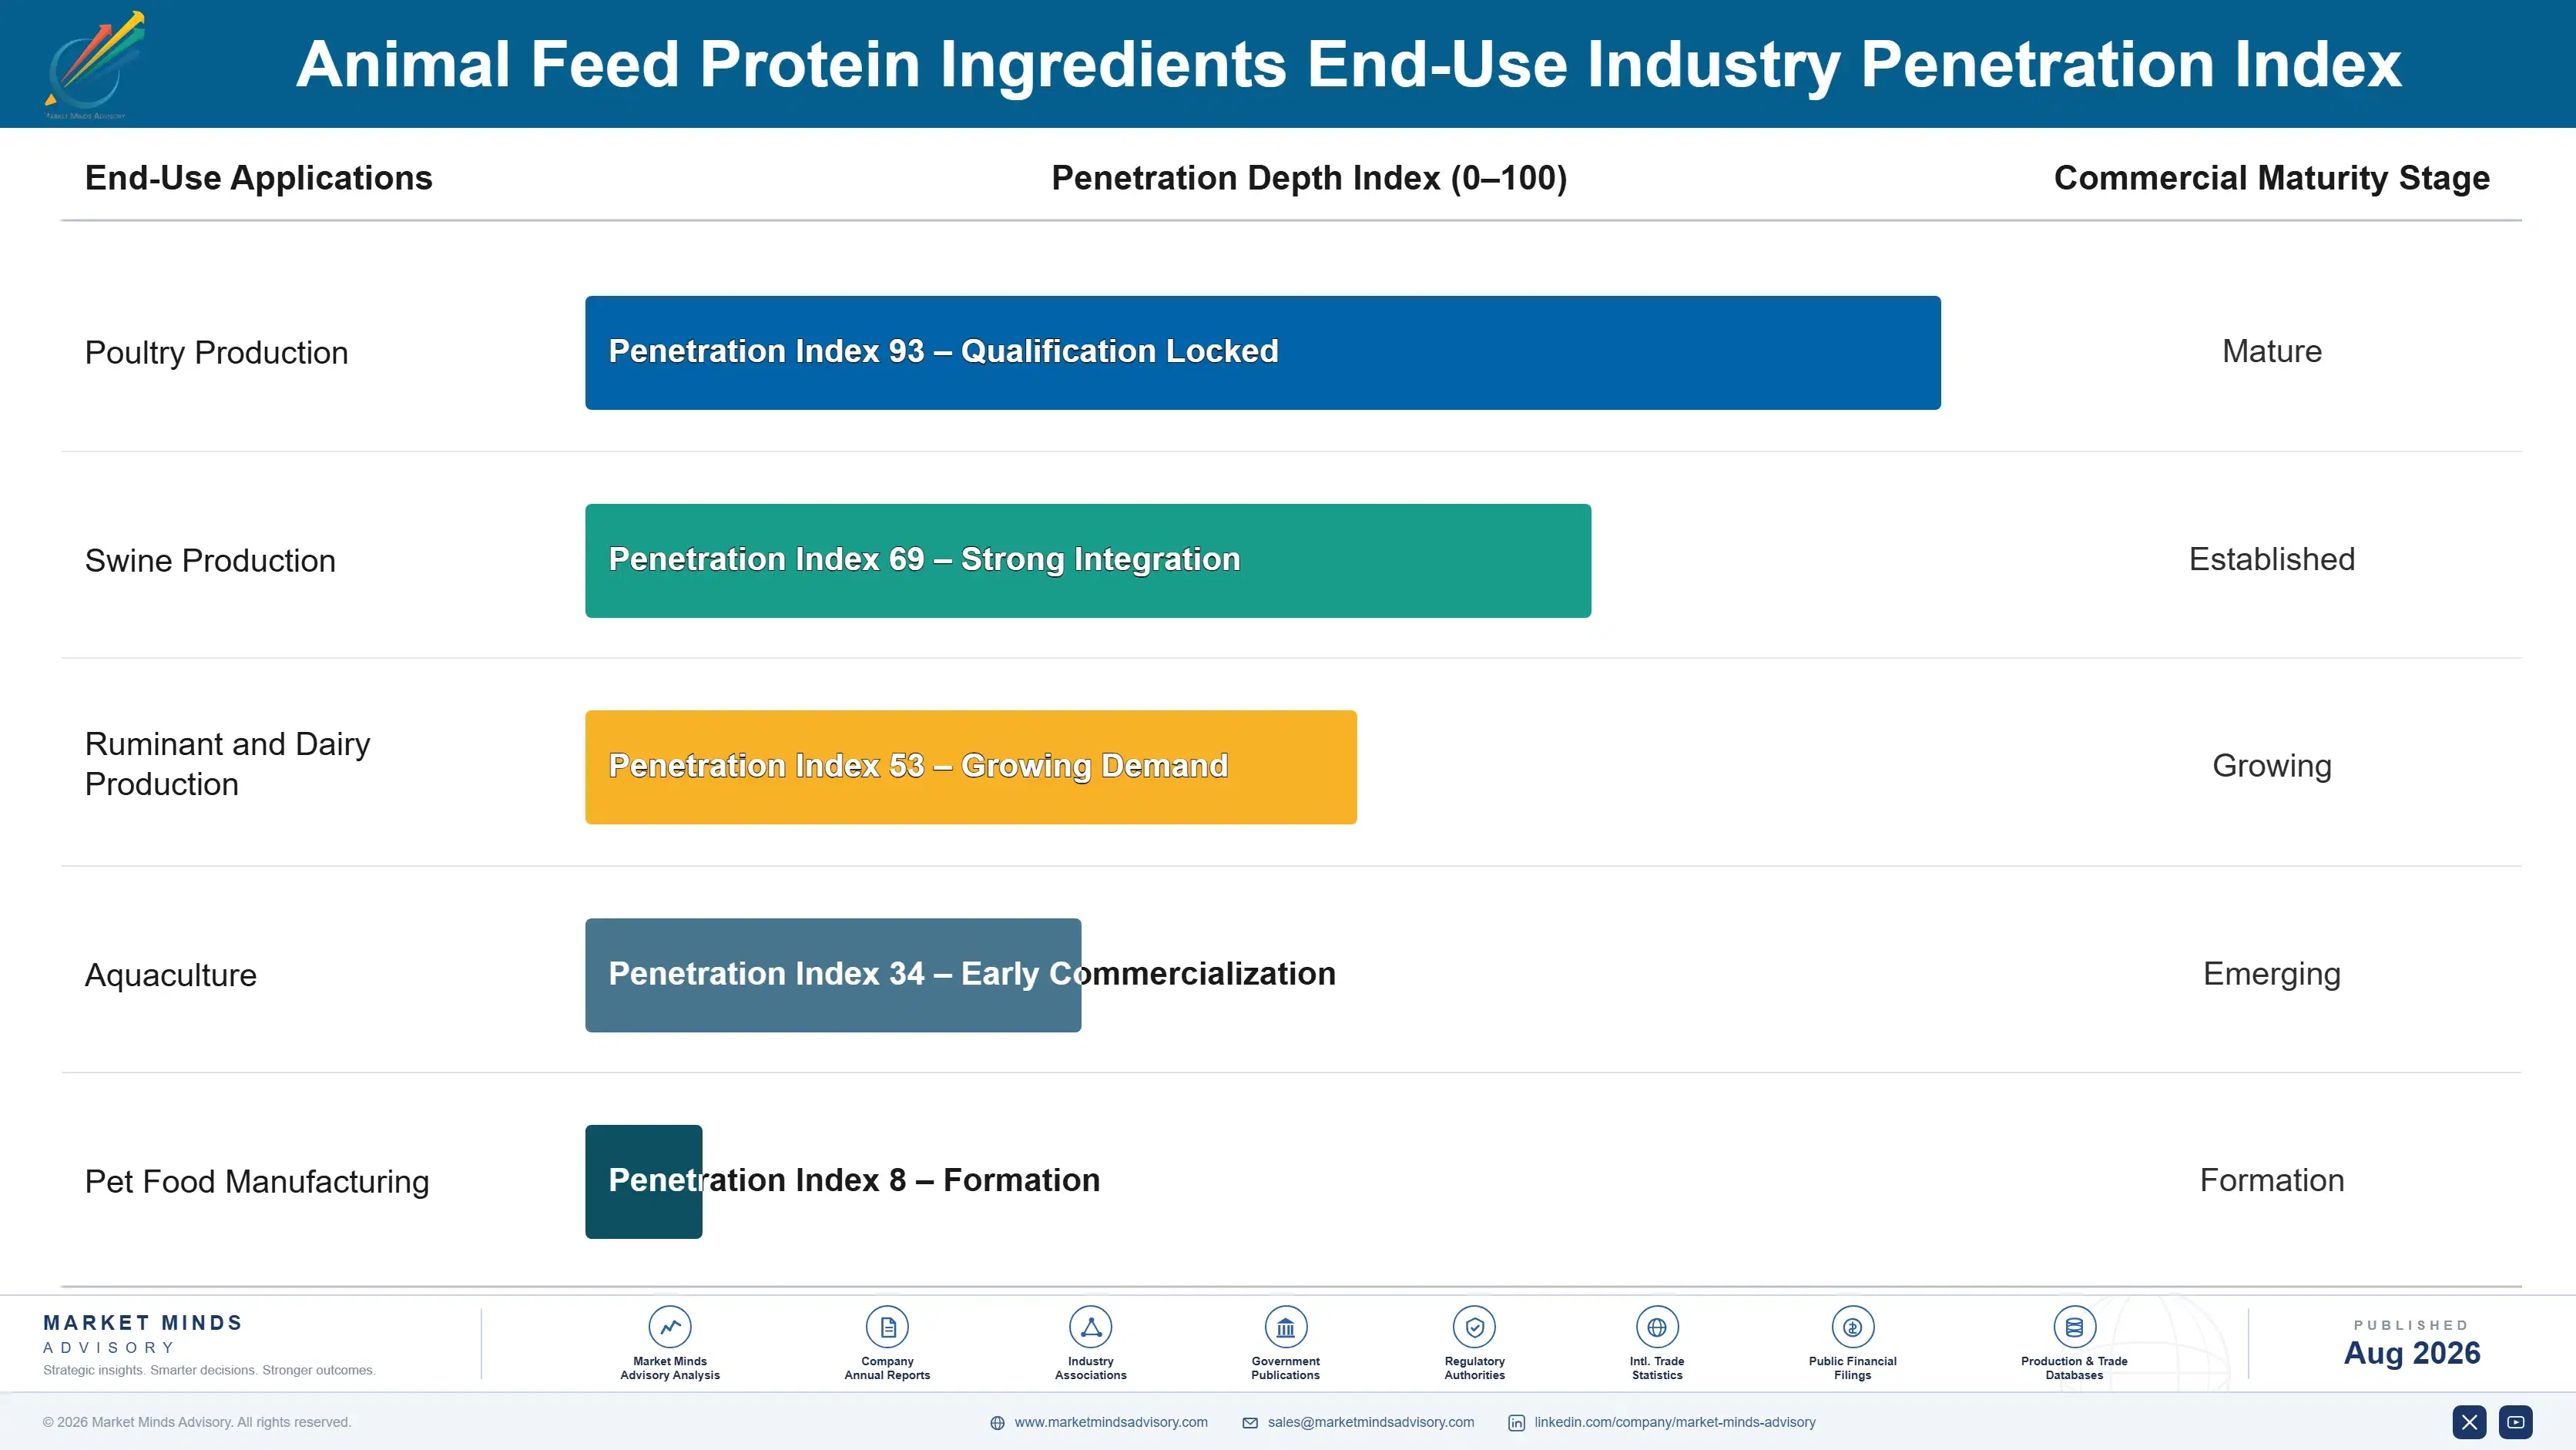
Feed protein revenue is unusual in behaving as an annuity despite trading as a commodity. Large integrators contract meal volume months ahead against production plans, and mills build ingredient handling, storage, and quality systems around specific supply relationships that survive years of price movement. Typical supply tenure with a major integrator runs four to seven years, punctuated by annual price negotiation rather than by genuine supplier replacement, because switching disrupts logistics far more than it saves.
Stickiness varies sharply by ingredient position. Certified and documented supply is the most durable, since the buyer's market access depends on it and requalifying a chain takes seasons rather than weeks. Species-separated rendered material comes next, protected by traceability systems and pet food specifications. Undifferentiated meal is the least sticky of all, moving on basis, freight, and availability with no attachment whatsoever to the incumbent supplier from one cargo to the next.

Buyer profiles have shifted considerably. Sustainability and compliance functions now sit alongside procurement in supplier reviews, and questions about geolocation evidence and nitrogen excretion arrive before price is discussed at all. Retail customer specifications now travel upstream faster than regulation does, and they frequently bind tighter.
animal-feed-protein-ingredients-market-end-use-penetration-index-1787462345275

Where Protein Suppliers Should Position

These are among the four positions where our research anticipates prominent divergence between winners and laggards over the coming forecast period. Each is grounded in the demand model, the regulatory perimeter, and the announced capacity pipeline.
01 / ORIGIN DOCUMENTATION INVESTMENT

Build plot-level verification before enforcement makes it expensive

European deforestation obligations require geolocation evidence that South American supply chains were never designed to produce, and originators assembling systems after enforcement begins will pay considerably more than those who moved early. Documented cargoes already trade at roughly $18 to $28 per tonne over undocumented equivalents into European destinations, which covers system investment quickly at meaningful volume. Farmers enrolled in a verification programme rarely move to a competitor, so the compliance spend converts into a durable origination position rather than a recurring cost.
02 / NUTRITIONAL DENSITY SELLING

Market digestible amino acids instead of declared crude protein

Nutritionists formulate against digestible amino acid requirements while most meal is still sold on crude protein percentage, which systematically understates the value of higher-quality material to the very people making formulation decisions in practice. Publishing species-specific digestibility coefficients backed by in vivo work lets formulators cut inclusion and hit specification at lower total diet cost, supporting a premium of roughly 4% to 7% over equivalent commodity meal. It also builds relationships with nutritionists rather than only with procurement teams focused on delivered price alone.
03 / AMINO ACID PARTNERSHIP

Join the substitution trend rather than pretending it will reverse

Synthetic lysine, methionine, threonine, and valine remove roughly two percentage points of dietary crude protein without any measurable performance loss at all, and every fermentation capacity addition takes meal tonnage away permanently. No marketing programme reverses that trajectory, so resisting it wastes commercial effort that could be earning elsewhere instead. Building joint low-protein diet offers with amino acid producers captures value from the transition, cuts customer nitrogen excretion by around 20%, and creates relationships far more durable than any commodity supply arrangement.
04 / ALTERNATIVE PROTEIN REALISM

Treat insect and microbial proteins as specialty, not commodity substitutes

Insect and microbial proteins grow at 21.3% and 17.6% respectively, yet they cost several multiples of soybean meal per unit of digestible protein and operate at annual volumes measured in thousands of tonnes. Several European insect producers restructured during 2024 after discovering that commodity feed markets remain unreachable at achievable production costs. Investment here should target aquaculture, pet food, and premium piglet applications where performance premiums genuinely exist, rather than assuming a cost curve that has not yet bent will bend on anybody's schedule.

Engagement Snapshot From the Field

A live engagement with an industry participant carrying material or product regulatory and market exposure ahead of a defining policy shift, showing how our research translates into a defensible multi-year portfolio strategy.
MARKET MINDS ADVISORY · CLIENT ENGAGEMENT SUMMARY
Animal Feed Protein Ingredients Producer Strategic Portfolio Review and Transition Roadmap 2026·Investment Scenario on Animal Feed Protein Ingredients Exposure Evaluation 2025-26
CLIENT PROFILE
A European compound feed group operating eleven mills across four countries, producing poultry, pig, and dairy rations with annual revenue near EUR 1.4 billion (client-reported, unverified by MMA). Imported soybean meal supplied roughly 44% of dietary protein across the portfolio, sourced through four traders on annual contracts, with no visibility of farm-level origin and no internal capability to verify deforestation compliance claims.
STRATEGIC CHALLENGE
European deforestation obligations were approaching enforcement and two major retail customers had written origin verification into their own supplier requirements. The group could not demonstrate compliance for most of its soy volume, faced a probable premium of several million euros annually to secure documented material, and had not evaluated whether alternative protein sources could reduce the exposure instead.
MMA APPROACH
MMA mapped every protein ingredient against its actual origin and documentation status, quantifying which volumes carried genuine regulatory exposure. Substitution options were modelled on digestible amino acid equivalence rather than crude protein, covering rapeseed, sunflower, rendered proteins, and increased amino acid supplementation. Supplier capability was assessed on verification systems rather than on price. Findings were tested through 47 expert interviews during Q4 2025.
KEY FINDINGS
  1. Only 31% of imported soybean meal volume carried documentation that would satisfy European deforestation obligations, and two of the four incumbent traders held no plot-level systems at all.
  2. Raising amino acid supplementation and rebalancing toward domestic rapeseed could cut soy inclusion by 19% across poultry rations without any measured loss in performance.
  3. Reintroducing processed animal proteins into pig diets, permitted since 2021, was blocked by one retail customer's specification rather than by any regulation or nutritional constraint.
  4. The certified soy premium was roughly a third of the cost of the substitution programme, making documented sourcing the cheaper compliance route for remaining volume.
CLIENT PROFILE
A European compound feed group operating eleven mills across four countries, producing poultry, pig, and dairy rations with annual revenue near EUR 1.4 billion (client-reported, unverified by MMA). Imported soybean meal supplied roughly 44% of dietary protein across the portfolio, sourced through four traders on annual contracts, with no visibility of farm-level origin and no internal capability to verify deforestation compliance claims.
STRATEGIC CHALLENGE
European deforestation obligations were approaching enforcement and two major retail customers had written origin verification into their own supplier requirements. The group could not demonstrate compliance for most of its soy volume, faced a probable premium of several million euros annually to secure documented material, and had not evaluated whether alternative protein sources could reduce the exposure instead.
MMA APPROACH
MMA mapped every protein ingredient against its actual origin and documentation status, quantifying which volumes carried genuine regulatory exposure. Substitution options were modelled on digestible amino acid equivalence rather than crude protein, covering rapeseed, sunflower, rendered proteins, and increased amino acid supplementation. Supplier capability was assessed on verification systems rather than on price. Findings were tested through 47 expert interviews during Q4 2025.
KEY FINDINGS
  1. Only 31% of imported soybean meal volume carried documentation that would satisfy European deforestation obligations, and two of the four incumbent traders held no plot-level systems at all.
  2. Raising amino acid supplementation and rebalancing toward domestic rapeseed could cut soy inclusion by 19% across poultry rations without any measured loss in performance.
  3. Reintroducing processed animal proteins into pig diets, permitted since 2021, was blocked by one retail customer's specification rather than by any regulation or nutritional constraint.
  4. The certified soy premium was roughly a third of the cost of the substitution programme, making documented sourcing the cheaper compliance route for remaining volume.
RECOMMENDED STRATEGY
Phase 1: Phase 1 (months one to five): consolidate soy purchasing with the two traders holding plot-level verification systems and contract documented volume forward. Phase 2: Phase 2 (months six to fifteen): reformulate poultry rations toward higher amino acid supplementation and domestic rapeseed, cutting soy inclusion across the portfolio. Phase 3: Phase 3 (months sixteen to twenty-eight): negotiate processed animal protein acceptance with retail customers and qualify rendered supply for pig diets.
OUTCOME
The group secured documented soy for 94% of remaining volume and cut total soy inclusion by 17% within fifteen months (client-reported, unverified by MMA). Compliance exposure was closed ahead of enforcement, and the reformulation reduced ration cost by EUR 6 per tonne. Two trader relationships were retired during the process.

Frequently Asked Questions

Foundational context covering the market sizes, CAGR, scope, country, region and competition that inform every finding below. This section is provided to cover basics and most often pre-purchase conversations, answered from the MMA Primary Research Dataset.

What is the current size of the Animal Feed Protein Ingredients Market?

The market was valued at USD 268.0 billion in 2025, rising to an estimated USD 279.8 billion in 2026. East Asia holds the largest regional share at 30% of global value.

How large will the Animal Feed Protein Ingredients Market be by 2036?

MMA forecasts USD 430.4 billion by 2036 under the base case, an expansion multiple of 1.54 times the 2026 level. Incremental value creation across the period reaches USD 150.6 billion.

What is the CAGR for the Animal Feed Protein Ingredients Market 2026 to 2036?

The base case CAGR is 4.4%, with a bull case of 5.7% and a bear case of 3.1%. Historical growth between 2020 and 2025 ran at 3.7%, reflecting commodity pricing more than tonnage.

Which segment is growing fastest?

Insect proteins, at 21.3%, roughly 4.84 times the overall market rate. The rate comes off a base measured in tens of thousands of tonnes, so commercial relevance remains limited.

Who are the major companies in the Animal Feed Protein Ingredients Market?

Cargill, Archer Daniels Midland, Bunge Global, Louis Dreyfus Company, and COFCO International lead, holding roughly 28% of traded volume between them. Wilmar and Darling Ingredients follow.

Which country is growing fastest?

Vietnam, at 6.9%, driven by poultry integration and export-oriented aquaculture expansion. Compound feed output has grown consistently, pulling imported protein meal eastward year after year.

Report Segmentation Architecture

The full report scope spans multiple orthogonal segmentation dimensions, with cross-tabulated demand data provided for each dimension pair. Coverage extends further to regional breakdowns, trend trajectories, and the competitive detail needed to support segment-level decision-making.

By Protein Origin

  • Oilseed Meals
  • Grain Processing Co-Product Proteins
  • Marine Proteins
  • Rendered Animal Proteins
  • Insect Proteins
  • Microbial and Single-Cell Proteins

By End-Use Industry

  • Poultry Production
  • Swine Production
  • Ruminant and Dairy Production
  • Aquaculture
  • Pet Food Manufacturing

By Commercial Dimension

  • Integrated Producer Direct Supply
  • Commercial Compound Feed Mills
  • Trader and Distributor Channel
  • On-Farm and Home Mixing

By Region

  • North America
  • Western Europe
  • East Asia
  • South Asia and Pacific
  • Latin America
  • Middle East and Africa
  • Eastern Europe

Scope, Methodology, and Coverage

Every figure in this report is reproducible from documented input assumptions. The scope below maps the historical period, the forecast horizon, the segmentation dimensions, and the countries covered, alongside the underlying primary and qualitative methodology.
Historical Period
2020 to 2025
Forecast Period
2026 to 2036
Base Year
2025 (USD billions; MMA Primary Research Dataset, August 2026)
Market Definition
The market comprises protein-supplying ingredients traded into compound feed manufacture and on-farm rations, covering oilseed meals, grain processing co-product proteins, marine proteins, rendered animal proteins, insect proteins, and microbial and single-cell proteins. Value is measured at ingredient level as traded to feed mills, integrators, and farm buyers. Synthetic amino acids, vitamin and mineral premixes, feed enzymes, forages, whole grains fed as energy sources, and finished compound feed sold as a complete product fall outside scope.
Quantitative Units
USD billions (current prices); million tonnes of ingredient; USD per tonne average selling price
Segmentation Dimensions
By Protein Origin; By End-Use Industry; By Commercial Dimension; By Region
Regions Covered
North America, Western Europe, East Asia, South Asia and Pacific, Latin America, Middle East and Africa, Eastern Europe
Countries Covered
USA, China, Germany, France, UK, Japan, South Korea, India, Australia, Canada, Brazil, Mexico, Indonesia, Vietnam, Thailand, Malaysia, UAE, Saudi Arabia, South Africa, Nigeria, Turkey, Poland, Netherlands, Italy, Spain, Sweden, Switzerland, Argentina, Colombia, Singapore, and additional markets relevant to this sector
Key Companies Profiled
Cargill, Archer Daniels Midland, Bunge Global, Louis Dreyfus Company, COFCO International, Wilmar International, CJ CheilJedang, Darling Ingredients, Nutreco, Alltech, Pelagia AS, TripleNine Group, Protix, InnovaFeed, Ynsect, Calysta, Unibio, Corbion, Lallemand, Roquette Freres
Quantitative Methodology
Primary survey, n=3,800 respondents, Q4 2025, six countries; demand-side model with trade association cross-validation
Qualitative Methodology
47 expert interviews, Q4 2025; applied to validate demand model assumptions, identify emerging dynamics, and assess competitive positioning
Report Format
PDF and XLSX data workbook (Word format preview document)
Publisher
Market Minds Advisory
Report Code
MMA-2026-AGR-118
Published
August 2026
Contact
sales@marketmindsadvisory.com | www.marketmindsadvisory.com

Purchase the full Animal Feed Protein Ingredients Market Report (2026 to 2036).

The full report sizes feed protein demand across six origin categories and seven regions with 2026 to 2036 forecasts under base, bull, and bear cases. It quantifies how much oilseed meal demand amino acid supplementation removes each year, by species and by geography, which no volume forecast built on animal numbers alone captures. Competitive profiles cover twenty participants assessed consistently on tonnage originated, processed, or traded. Regulatory analysis maps deforestation obligations, processed animal protein rules, and Chinese protein reduction policy. Commercial guidance addresses origin documentation, nutritional density selling, and alternative protein realism.
Six protein origins sized and forecast separately
Amino acid substitution quantified by species and region
Twenty participant profiles on consistent tonnage basis
Deforestation compliance premiums tracked by origin and destination
Rendered protein channel economics compared against pet food
Alternative protein cost curves benchmarked against oilseed meal

Built For The People Who Decide

From boardroom strategy to bench-side execution, this report is read cover-to-cover by leaders shaping the next decade of their industry, turning demand scenarios, market dynamics and valuation benchmarks into decisions.
CXOs/ Presidents/ VPs/ Managers
M&A and Corporate Development
Strategy Teams and R&D Heads
Procurement and Product Directors
Regulatory and Compliance Leaders
Investor Relations and Equity Analysts