

Market Minds Advisory
Analytical Laboratory Service Market

Analytical Laboratory Service Market: Analytical Laboratory Service Market. Testing Infrastructure for Pharmaceutical, Environmental, and Food Safety Compliance

Expanding pharmaceutical quality mandates, tightening environmental testing regulations, and rising food safety scrutiny push manufacturers and regulators toward accredited third-party laboratories offering faster turnaround than internal testing capacity ever allows.

Lead Analyst

Published

September 2026

Make Smarter Decisions with Customized Research Insights

Request a free sample report and evaluate market opportunities, growth trends, and competitive dynamics relevant to your business needs.

2025 MARKET VALUE$28.0BMarket Size 2025
2036 FORECAST VALUE$56.0BBase Case , 2026 to 2036
CAGR 2026 TO 20366.5 %Bull 7.7% / Bear 5.3%
INCREMENTAL OPPORTUNITY$26.2BNet 10- year value creation
EXPANSION MULTIPLE1.88x2036 value over 2026 base
Strategic Levers
M&A Pipeline
Regional Outlook
Country Rankings
Competitive Intelligence
Segmental Deep-dive
Call-Us : 91 93563 13602

Executive Snapshot and Market Trajectory.

Analytical laboratory service demand is shifting from routine compliance testing to strategic quality partnership as manufacturers outsource increasingly complex analytical work to accredited third-party providers rather than building costly internal testing capacity and specialized scientific staff at their own manufacturing sites across every product line and facility.
AI-assisted data interpretation services are pulling ahead of manual analysis as clients chase faster turnaround across regulatory submission timelines spanning pharmaceutical, environmental, and food safety testing categories simultaneously. North America's concentrated pharmaceutical and environmental testing demand keeps the fastest deployment activity there, well ahead of comparable adoption in most other regions globally today, particularly among clients facing the strictest regulatory submission deadlines and highest compliance stakes.
Established multinational testing conglomerates compete against newer specialist laboratories winning deals on turnaround speed and niche analytical method depth, but accreditation breadth and data interpretation capability are becoming the decisive purchase criteria as clients consolidate testing spend onto fewer, higher-capability laboratory partners each contract cycle, pressuring smaller single-method laboratories to differentiate sharply on niche expertise and service responsiveness rather than accreditation breadth alone, an increasingly difficult position to sustain across most contract tiers.
Market Definition
The Analytical Laboratory Service Market covers third-party contract testing, analysis, and certification services for pharmaceutical, environmental, food, and industrial materials samples. It excludes in-house corporate laboratory operations not offered commercially to external clients, laboratory equipment and instrument manufacturing, and medical diagnostic testing performed directly on patient samples.
Base Year Value
$28.0B in 2025 (MMA Primary Research Dataset, September 2026)
Forecast Period
2026 to 2036, eleven discrete annual values
CAGR
6.5% base case. Bull 7.7%. Bear 5.3%.
Fastest Growth Segment
AI-Assisted Analytical Data Interpretation Services: 11.5% CAGR
Fastest Growth Country
India: 9.0% CAGR
Fastest Growth Region
South Asia and Pacific: 8.3% CAGR
Largest Region
North America: 29% of 2025 global value
Market Leaders
SGS, Bureau Veritas, Eurofins Scientific, Intertek, and ALS Limited lead the market. Source: MMA Analysis, July 2026.
Primary Survey
n=3,800 procurement and R&D decision-makers, Q4 2025, six countries
Methodology
Demand-side build-up, cross-validated against public data, 47 expert interviews

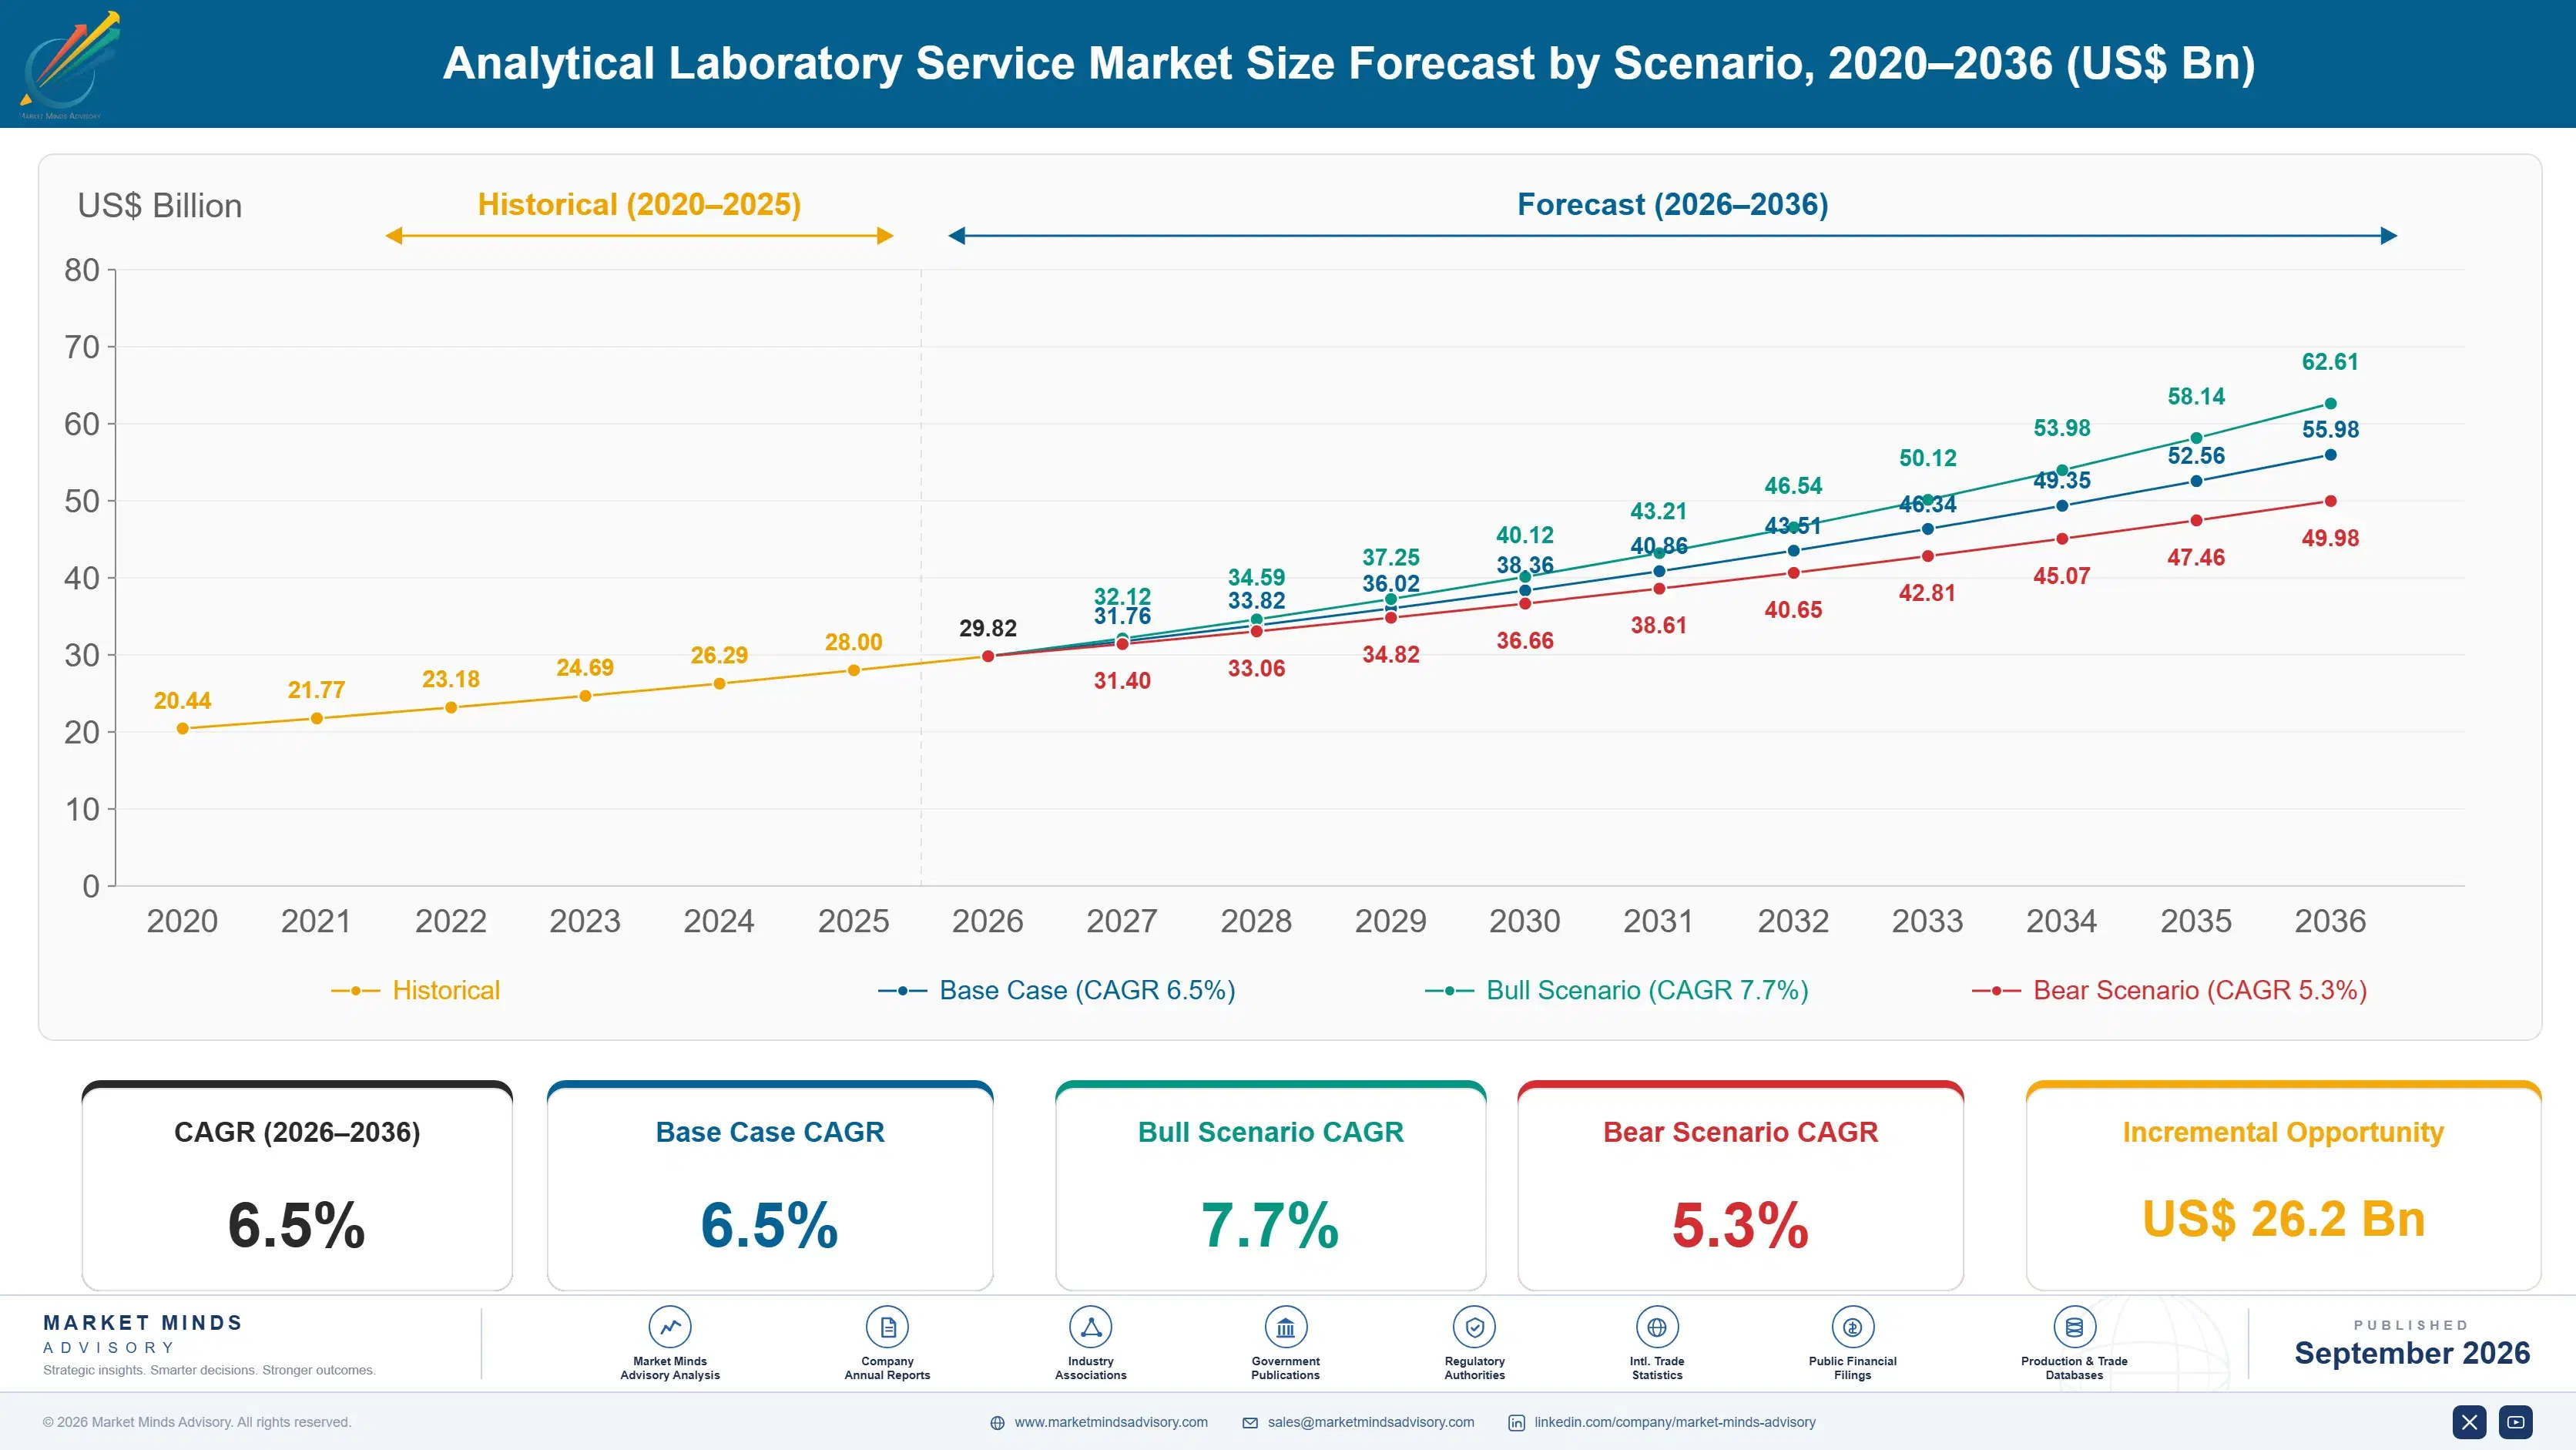
Analytical Laboratory Service Market Forecast Scenarios

analytical-laboratory-service-market-size-forecast-scenario-1789980289291
Analytical laboratory service demand grew steadily between 2020 and 2025 as expanding pharmaceutical development pipelines and tightening environmental regulation pushed manufacturers to outsource testing volume beyond internal laboratory capacity. Historical growth ran near 5.5 percent annually across that period, accelerating meaningfully as regulatory scrutiny intensified toward the tail end of that historical window across most covered testing categories.
The base case assumes sustained growth through 2036, driven by three commercial mechanisms working together. Expanding pharmaceutical quality and environmental testing mandates are forcing outsourced testing investment regardless of near-term client budget pressure. AI-assisted data interpretation is shortening turnaround times considerably compared to fully manual analysis workflows. Rising food safety scrutiny continues widening the addressable testing volume base each successive regulatory cycle across most major covered markets and testing categories.
A bull case built on accelerated pharmaceutical pipeline expansion and expanding environmental testing mandates across major regulatory jurisdictions could push growth meaningfully above base case levels through the back half of the forecast period. A bear case tied to delayed regulatory enforcement or prolonged pharmaceutical development slowdown would slow testing volume growth considerably across price-sensitive client segments.

Turnaround Speed Becomes the Deciding Factor

Laboratory clients are treating testing partner selection less like a routine vendor procurement exercise and more like a strategic quality relationship, since accreditation depth and turnaround reliability now directly shape regulatory submission timelines and product launch schedules, a shift from the purely cost-driven vendor selection process that characterized this testing category only a handful of years earlier, before regulatory submission stakes and enforcement scrutiny rose considerably across most covered industries and jurisdictions.
MARKET CONCENTRATION33% CR5top five providers hold this combined participation share currently
AVERAGE TEST TURNAROUND TIME8 daystypical time required to complete a standard analytical test
ACCREDITED METHOD COVERAGE SHARE68%test volume performed under formal third-party accreditation standards
REPEAT CLIENT CONTRACT RATE82%share of clients renewing testing service contracts each fiscal year
AI-ASSISTED ANALYSIS SHARE24%test volume processed using automated data interpretation tools
PHARMACEUTICAL TESTING VOLUME SHARE37%total test volume destined for pharmaceutical quality and safety compliance
Commercially, the market splits between multinational testing conglomerates defending large accredited method portfolios through deep relationships with global manufacturers and regulators, and newer specialist laboratories winning deals on turnaround speed and niche analytical method depth for demanding regulatory categories that generalist labs cannot easily match without significant, sustained additional accreditation investment and specialized scientific staffing over time.
Over the coming decade, AI-assisted data interpretation and accreditation breadth will keep separating credible testing partners from smaller laboratories that clients increasingly find too slow to support tightening regulatory submission timelines, pushing commodity testing vendors toward steadily eroding client relevance over time relative to AI-forward challenger laboratories gaining ground quickly among regulatory-conscious client accounts across most industry verticals.
"Clients don't switch labs because of price anymore. They switch because a competitor turns results around three days faster during a regulatory crunch."
Director, Testing, Inspection, and Certification Services Practice · MMA Contract Analytical Testing and Laboratory Service Providers Practice · September 2026

Market Trends

AI-Assisted Data Interpretation Accelerates Result Turnaround

AI-assisted data interpretation tools, which automatically flag anomalies and generate preliminary result summaries, are becoming the preferred approach as clients demand faster turnaround without sacrificing analytical rigor across increasingly complex test panels. Roughly 24 percent of test volume now uses automated interpretation tools, up meaningfully from prior years as machine learning models trained on historical result patterns mature. This shift is compressing the competitive gap between legacy manual-review laboratories and newer platforms built with automated interpretation as a core function from the outset, forcing incumbents to accelerate their own technology investment considerably.
Market Impact: 44 percent cite pipeline complexity

Accreditation Breadth Expands Across New Testing Categories

Formal third-party accreditation, historically concentrated in pharmaceutical and select environmental testing categories, is expanding into new sectors including food traceability testing and industrial materials certification, widening the addressable accredited testing base considerably. Roughly 68 percent of total test volume now falls under formal accreditation standards, up meaningfully from a smaller share several years earlier as client procurement requirements tighten across most major manufacturing economies worldwide. This accreditation broadening is pulling smaller regional laboratories toward either investing in formal accreditation or losing access to increasingly accreditation-mandated client contracts entirely across most regulated testing categories.
Market Impact: 31 percent cite environmental rules

Market Opportunities and Growth Drivers

Pharmaceutical Pipeline Growth Sustains Testing Volume

Expanding pharmaceutical development pipelines, particularly across biologics and specialty therapeutics requiring extensive analytical characterization, continue sustaining strong testing volume growth well beyond what traditional small-molecule drug testing historically generated for contract laboratories. This has pushed testing service investment from a discretionary quality function toward a core development pathway dependency that pharmaceutical sponsors treat as non-negotiable across most development stages. Roughly 44 percent of surveyed pharmaceutical sponsors cite pipeline complexity growth as their primary testing outsourcing justification, ahead of pure cost savings alone as the primary justification cited by these sponsors.
Market Impact: 8 months average capacity ramp-up time

Environmental Regulation Tightening Expands Testing Scope

Expanding environmental monitoring and reporting regulations across water, air, and soil quality categories continue widening the addressable testing scope that regulated industrial facilities must satisfy through accredited third-party laboratories rather than internal testing capacity alone. Facilities operating under tightened environmental permits report meaningfully higher testing frequency requirements than those operating under legacy permit terms issued years earlier. Roughly 31 percent of large industrial facilities now cite expanded environmental testing requirements as a primary driver of laboratory service budget growth this year, up meaningfully from prior years across most covered industrial sectors.
Market Impact: 17 percent of overhead from fragmentation

Market Restraints and Challenges

Skilled Analyst Shortage Constrains Capacity Expansion

Laboratories face persistent difficulty hiring qualified analytical chemists and method specialists, since this skill requires years of training that most university programs cannot fully substitute for practical laboratory experience. The root cause is that laboratory science programs graduate fewer specialists than the industry's growing testing volume requires, creating a persistent talent gap across most covered categories. This scarcity extends average new capacity ramp-up timelines to roughly eight months for specialized categories, well beyond the six-week timeline typical of routine testing categories with abundant staff. Laboratories increasingly partner with universities to build dedicated analytical chemistry training pipelines addressing this recurring gap.
Market Impact: 24 percent of volume now AI-assisted

Fragmented Regional Accreditation Complicates Global Operations

Laboratories operating across multiple regulatory jurisdictions must obtain separate accreditation from each national or regional authority, forcing multinational testing providers to navigate parallel accreditation processes with differing technical requirements and renewal cycles. The underlying cause is that accreditation bodies developed independently before any coordinated international harmonization effort gained meaningful traction across the industry. This fragmentation accounts for roughly 17 percent of multinational laboratory operating overhead in covered markets, according to surveyed laboratory leadership. Laboratories increasingly pursue mutual recognition agreements between accreditation bodies to reduce this recurring compliance friction across jurisdictions.
Market Impact: 68 percent of volume now accredited
3 additional market trends, 4 additional growth drivers, and 3 additional restraints and challenges are covered in the full report. Contact sales@marketmindsadvisory.com to access the complete intelligence.

Segment CAGR and Growth Architecture

This report segments the Analytical Laboratory Service Market by service function, the clearest lens for near-term procurement decisions across large client categories and regulatory jurisdictions, since analytical testing, accreditation certification, and data interpretation services carry distinct pricing structures and buyer profiles despite often bundling within a single provider relationship serving a given client account.
analytical-laboratory-service-market-market-share-analysis-1789980289852

AI-Assisted Analytical Data Interpretation Services

AI-assisted data interpretation services automatically flag anomalies and generate preliminary result summaries, replacing the fully manual review process that previously consumed meaningful analyst time at large testing laboratories. Demand for this segment is accelerating fastest among clients facing the tightest regulatory submission deadlines, where turnaround speed directly determines whether a product launch or regulatory filing stays on schedule. Laboratories demonstrating interpretation accuracy above industry benchmarks are commanding premium pricing over manual-review competitors, and clients increasingly treat AI-assisted interpretation as a mandatory service requirement rather than an optional upgrade during vendor evaluation processes across most regulated testing categories, particularly among larger pharmaceutical sponsors with dedicated regulatory affairs staff evaluating multiple competing laboratories.
CAGR 11.5%

Multi-Jurisdiction Accreditation Certification Services

Multi-jurisdiction accreditation certification services validate testing results against multiple national and regional accreditation standards simultaneously, replacing the separate per-jurisdiction certification processes that previously forced multinational clients to maintain redundant testing relationships across each target market. This segment is growing fastest among multinational manufacturers selling products across multiple regulatory jurisdictions simultaneously, where maintaining separate single-jurisdiction laboratory relationships becomes increasingly impractical as global product launches proliferate. Laboratories increasingly bundle multi-jurisdiction certification with data interpretation capability, since documentation requirements typically follow immediately after successful multi-standard test validation across each covered regional accreditation standard, creating a natural cross-sell path that single-jurisdiction laboratories cannot easily replicate without acquiring dedicated accreditation capability of their own through internal investment.
CAGR 8.5%
Full segment breakdown across 6 segments available in the complete report.

Regional Architecture and Country Demand Map

North America leads on concentrated pharmaceutical and environmental testing demand plus rigorous regulatory enforcement across most industries, East Asia follows closely on rapid manufacturing quality assurance growth and expanding export certification volume today, and South Asia and Pacific grows fastest off a smaller installed base.

North America

United States pharmaceutical and biotechnology companies face some of the world's most rigorous Food and Drug Administration testing and documentation requirements, sustaining strong demand for accredited third-party laboratory partnerships across drug development and manufacturing quality assurance. Major pharmaceutical and environmental testing laboratory headquarters concentrated in this region lead technology innovation, often launching AI-assisted interpretation capabilities here before other covered markets receive them. Canada's regulated industries follow a similar trajectory at smaller scale. Concentrated environmental regulatory enforcement across this region sustains steady demand for water, air, and soil testing services across large industrial and municipal client accounts spanning most major metropolitan markets and industrial corridors throughout the region and beyond today.
Share: 29% | CAGR: 7.0% (2026 to 2036)

Western Europe

Germany, France, and the United Kingdom's dense pharmaceutical and chemicals manufacturing base, combined with European Medicines Agency and REACH chemical regulation requirements, makes accredited laboratory testing increasingly necessary for manufacturers targeting continued market access. The European Union's ongoing regulatory framework updates are compressing certification timelines across manufacturers previously operating under less formalized testing requirements. Regional laboratories with deep expertise navigating fragmented national accreditation bodies hold a durable service advantage over foreign entrants unfamiliar with country-specific compliance practices. Growth trails East Asia and North America since regulatory finalization has proceeded somewhat more gradually across the bloc's many member states and national accreditation authorities and regulatory enforcement bodies involved throughout the union.
Share: 23% | CAGR: 5.5% (2026 to 2036)
Regional intelligence for 5 additional markets available in the complete report: East Asia, South Asia and Pacific, Latin America, Middle East and Africa, Eastern Europe. Contact sales@marketmindsadvisory.com.
analytical-laboratory-service-market-country-cagr-analysis-1789980290430

Monetizing Beyond the Base Testing Fee

Beyond standard per-test fees, laboratories are building several distinct and increasingly important adjacent revenue streams around expedited turnaround premiums, regulatory submission consulting, ongoing multi-jurisdiction accreditation bundling, and proprietary interpretation model licensing arrangements that together capture considerably more of the total value their testing services already deliver to clients across regulatory categories and geographies worldwide.

Offer Expedited Turnaround Premium Service Tiers

Laboratories are pricing expedited turnaround service tiers above standard processing timelines, capturing incremental revenue from clients facing tight regulatory submission deadlines who cannot afford the standard 8-day turnaround window most testing categories require. This captures value proportional to the urgency involved without requiring proportional increases in fixed laboratory infrastructure or additional analyst headcount beyond what standard laboratory operations already require and consistently maintain year-round. Clients purchasing expedited tiers generate meaningfully higher revenue per test than those accepting standard processing timelines during routine, non-urgent testing cycles across most laboratory service categories.
Market Impact: Captures value from the 8 day standard turnaround segment

Sell Regulatory Submission Consulting Services Directly

Laboratories are layering regulatory submission consulting onto core testing services, helping clients translate raw analytical results into audit-ready documentation aligned with expanding pharmaceutical and environmental compliance requirements across covered jurisdictions. This service captures budget that would otherwise flow to standalone regulatory consulting firms lacking direct testing data access. Consulting-attached deals command materially higher average contract value than standalone testing subscriptions, and the 44 percent of sponsors citing pipeline complexity as their primary driver represent the clearest addressable base for this consulting expansion across the laboratory's existing sponsor relationships and referral network of satisfied clients.
Market Impact: Targets the 44 percent complexity-driven buyer segment directly

Bundle Multi-Jurisdiction Accreditation Certification As Premium Tier

Laboratories are pricing multi-jurisdiction accreditation certification as a premium tier above single-jurisdiction base testing, capturing incremental revenue from the 68 percent of test volume already falling under formal accreditation standards across multiple national and regional regulatory bodies simultaneously. This tiered approach lets laboratories monetize the additional certification and documentation complexity directly rather than absorbing that cost into flat base pricing that fails to reflect actual value delivered to multinational manufacturing clients operating across several regulatory jurisdictions simultaneously each fiscal year and every successive reporting cycle throughout each fiscal year served.
Market Impact: Captures value from the 68 percent accredited base

License Interpretation Models To Instrument Manufacturers

Laboratories with proven AI-assisted data interpretation capability are licensing their underlying analytical models to laboratory instrument manufacturers seeking to embed automated interpretation directly into their own testing equipment at the point of sale. This creates a software licensing revenue stream distinct from direct testing service fees, reaching new deployment channels laboratories could not otherwise efficiently serve. Given that AI-assisted interpretation already commands the widest pricing premium of any covered segment, this licensing extends that proven advantage into channels reached only indirectly before, across roughly 7 active instrument manufacturer partnerships currently in place.
Market Impact: Extends the pricing premium into 7 manufacturer channels

Who Controls the Margin Pool

The top five providers hold roughly 33 percent combined market participation, a fragmented concentration that leaves a wide gap open for a long tail of regional and specialist laboratories still building comparable accreditation scale across major covered markets and geographies worldwide, particularly outside their traditional home territories and long-established core customer bases built over many decades of accreditation investment.
Current competitive activity centers on three fronts: AI-assisted interpretation accuracy claims validated against independent regulatory audits, expanding multi-jurisdiction accreditation portfolios covering additional national regulatory bodies, and aggressive bundling of regulatory submission consulting into what were previously standalone testing service sales sold without ongoing support, across most client account sizes and testing complexity levels, from small regional buyers to global pharmaceutical sponsors.

Regional specialist laboratories without multinational conglomerate legacies are gaining ground fastest in niche analytical method categories where no existing accreditation relationship favors an incumbent, and rankings could shift meaningfully if one of these challengers secures a landmark multi-site contract with a top-tier global pharmaceutical sponsor during the coming several years of continued market expansion and steady consolidation activity across the broader competitive landscape now taking shape.
analytical-laboratory-service-market-company-positioning-matrix-1789980290951

Competitive Moat and Risk Dimensions

SGS

Moat: Broad Global Accreditation Depth

Decades of accreditation across dozens of national regulatory jurisdictions give SGS direct access to multinational client relationships that regional specialist laboratories must build market by market, shortening its sales cycles considerably relative to newer entrants lacking comparable global accreditation breadth and distribution built over many years of continuous accreditation investment.
SGS

Risk: AI Interpretation Capability Gap

Specialist AI-forward laboratories increasingly out-innovate SGS on data interpretation sophistication and turnaround speed, since its own operational scale historically prioritized broad accreditation coverage over the automated interpretation technology that turnaround-sensitive clients increasingly expect from qualified vendors bidding on major regulatory testing contracts across most covered client segments.
EUROFINS SCIENTIFIC

Moat: Aggressive Acquisition-Led Scale

Decades of aggressive acquisition activity have given Eurofins Scientific meaningfully broader analytical method coverage across niche testing categories than organically grown competitors can match quickly, particularly among clients requiring highly specialized method availability across food, environmental, and pharmaceutical categories requiring rare, highly specific analytical expertise.
EUROFINS SCIENTIFIC

Risk: Integration Complexity Risk

Eurofins Scientific's acquisition-heavy growth strategy creates ongoing integration complexity across disparate laboratory systems and quality standards that organically grown competitors with more unified, centralized operations largely avoid, potentially slowing consistent service quality delivery across its sprawling multi-site laboratory network and global operations spanning dozens of countries and regulatory jurisdictions.

Players Tracked

Prominent Players

SGS
Bureau Veritas
Eurofins Scientific
Intertek
ALS Limited

Other Key Players

TUV SUD
TUV Rheinland
DEKRA
Mistras Group
Element Materials Technology
Applus
DNV
UL Solutions
AsureQuality
Merieux NutriSciences
Charles River Laboratories
Pace Analytical Services
Envirochem Services
NSF International
Impact Analytical

Recent Developments

MAY 2025

SGS Launches AI-Powered Data Interpretation Platform

SGS introduced a new AI-based data interpretation platform designed to integrate directly with its existing global testing network, targeting clients seeking automated result review without requiring a separate standalone software vendor relationship or entirely new platform migration effort across their testing programs and existing client accounts.
Signal: Signals established multinational providers racing to close the AI interpretation gap against faster-moving specialist challengers entering their core markets.
SEPTEMBER 2025

Bureau Veritas Acquires Specialty Pharmaceutical Testing Laboratory

Bureau Veritas acquired a privately held specialty pharmaceutical testing laboratory to accelerate its biologics and specialty therapeutics analytical characterization capability, folding the acquired team's expertise directly into its existing life sciences portfolio rather than continuing to build comparable capability internally from scratch over a multi-year timeline.
Signal: Signals consolidation pressure building steadily as incumbents choose to buy specialty testing depth rather than build it internally over time.
JANUARY 2026

Intertek Signs Global Regulatory Consulting Partnership Agreement

Intertek signed a global partnership agreement with a major regulatory affairs consulting firm to jointly deliver submission-ready testing documentation to pharmaceutical and environmental clients undergoing broader regulatory transformation initiatives, expanding its reach into deployment channels it could not efficiently serve through direct sales channels alone in prior years.
Signal: Signals growing reliance on regulatory consulting partnerships to reach large, complex enterprise deployment engagements efficiently across the enterprise segment.

Skilled Labor and Instrument Reagent Exposure

Skilled analyst labor and analytical instrument reagents together represent roughly 46 percent of cost of goods sold for laboratory service providers, with pharmaceutical and biologics testing carrying the highest labor intensity given the specialized method expertise and rare scientific credentials those testing categories require of qualified analytical staff across most regulated pharmaceutical and environmental testing markets today.
Skilled laboratory analyst compensation rose noticeably during 2024 and 2025 amid tightening labor markets for qualified scientific staff across the broader life sciences sector, with unit compensation costs increasing by roughly 12 percent within a single fiscal year according to named industry compensation survey data and named laboratory operator annual disclosures. Providers passed a meaningful portion of this cost increase through to newly signed testing contracts across most affected service categories.

This cost exposure disadvantages smaller specialist laboratories most severely, since they typically lack the scale and multi-year staffing pipeline relationships that established incumbents negotiate directly with universities and training programs. Laboratories offering the most specialized testing categories face proportionally higher labor cost exposure than those offering routine, high-volume testing categories with more abundant qualified staff readily available across most labor markets.
analytical-laboratory-service-market-cost-volatility-analysis-1789980291148

Build University Analyst Pipeline Partnerships Directly

Laboratories partnering directly with university science programs to build dedicated analyst training pipelines secure more predictable staffing availability, insulating operations from short-term labor market volatility that smaller competitors without comparable pipeline relationships cannot avoid as easily during tight labor periods across most covered testing categories and geographic markets served by these laboratory partners each fiscal year.

Standardize Testing Protocols Across Method Categories

Laboratories are consolidating testing protocol designs across multiple analytical method categories to reduce cross-training requirements per analyst and enable more flexible staff deployment across testing categories, reducing per-test labor cost considerably without requiring separate specialized hiring for each individual method category offered across the laboratory's broader service portfolio and full testing category offerings served.

Shift Toward AI-Assisted Interpretation Workflows Broadly

Laboratories are investing in AI-assisted data interpretation workflows that reduce the analyst review time required per test result without sacrificing analytical accuracy, an increasingly important margin lever as skilled labor costs continue rising across most covered testing categories and geographies served by leading laboratory providers each successive fiscal year across the broader testing industry worldwide today.

Portfolio Architecture for Margin Defence

Analytical laboratory service margins split along a volume-to-premium axis similar to other testing and inspection categories. Routine, high-volume testing generates modest gross margins under intense price competition, while certified specialty testing and multi-jurisdiction accreditation bundles command materially higher margins on the strength of method depth and regulatory credibility that basic testing services cannot replicate without significant, sustained additional accreditation investment over time.
The volume tier serves smaller clients seeking baseline compliance testing, where price competition compresses standalone service margin and switching costs stay low. Premium tiers serving multinational pharmaceutical and biotechnology clients carry meaningfully higher willingness to pay, since accreditation complexity and specialty method demands at that tier make premium laboratory partnerships close to unavoidable, unlike smaller clients with lower regulatory exposure and simpler compliance obligations overall.

High-value margin pools concentrate in regulatory submission consulting and AI-assisted interpretation bundles, where demonstrated accreditation depth and turnaround reliability justify premium pricing well above standard testing sales, and where laboratories with proven regulatory track records increasingly capture disproportionate deal value relative to their overall test volume, particularly among the largest multinational pharmaceutical clients operating across several regulatory jurisdictions simultaneously.

Basic Routine Compliance Testing Services

Entry-level routine testing serving smaller clients seeking baseline compliance under intense price competition and thin standalone service margin across most industry sectors and testing volume tiers covered comprehensively across this report today.
Gross Margin: 18-26%

Certified Specialty Testing And Method Services

Multi-jurisdiction specialty testing platforms commanding meaningfully higher willingness to pay from pharmaceutical and biotechnology clients facing accreditation exposure and rising regulatory scrutiny across most major manufacturing markets and regulatory jurisdictions today.
Gross Margin: 32-42%

Regulatory Consulting And AI Interpretation Bundle Systems

Specialty testing bundled with regulatory submission consulting and AI-assisted interpretation serving audit-exposed, multinational clients pursuing defensible quality practices across multiple regulatory jurisdictions and increasingly divergent compliance frameworks and enforcement standards.
Gross Margin: 42-52%
analytical-laboratory-service-market-portfolio-architecture-1789980291661

High-value Sub-segments and Strategic Watch-out

Regulatory Submission Consulting Bundles

High-value, high-growth pool serving pharmaceutical and environmental clients requiring audit-defensible submission documentation, where demonstrated regulatory track record commands premium engagement pricing well above standard testing sales, and deal size scales directly with client complexity and total testing volume involved across all major client accounts served.
Gross Margin: 58-66%

AI-Assisted Interpretation Service Bundles

High-value, moderate-growth pool serving clients seeking faster turnaround without sacrificing accuracy, where bundled interpretation services generate durable recurring engagement revenue as regulatory submission deadlines continue tightening across most major jurisdictions covered under this report's defined scope and analytical framework outlined and carefully defined throughout this analysis document.
Gross Margin: 52-60%

Single-Test Routine Compliance Services

Volume core segment serving smaller clients with straightforward compliance needs, where price competition keeps standalone service pricing power limited despite steady renewal volume across the broader installed client base heading into subsequent contract renewal cycles for most smaller clients operating with somewhat limited testing budgets available.
Gross Margin: 18-25%

Legacy Manual-Review Migration Deployments

Strategic watch-out segment where fully manual review laboratories face growing obsolescence pressure from AI-assisted alternatives, threatening to strand existing client relationships relative to certified systems built for current turnaround requirements and expectations adopted across most covered testing markets and industry sectors covered under this report's scope.
Gross Margin: 26-34%

Regulatory Renewal Cycles Compound

Analytical laboratory service revenue behaves like an annuity anchored to continuous regulatory testing obligations rather than a one-time project engagement. Once a client validates a laboratory's methods and accreditation depth against its own quality management system, switching providers requires re-validating an entirely new laboratory relationship, a costly and disruptive process most quality teams avoid unless service performance falls short considerably over several consecutive reporting periods.
Adoption depth varies meaningfully by end-use vertical. Pharmaceutical and biotechnology clients show the deepest laboratory partnership loyalty, since method validation and regulatory submission history built up over multiple product development cycles become genuinely difficult to replicate with a new provider, while smaller consumer goods clients with simpler testing needs show comparatively weaker loyalty and shop more actively on price at each contract renewal point.

Buyer profiles are shifting generationally as regulatory affairs and quality assurance roles, increasingly central to laboratory vendor selection decisions, now sit alongside procurement and finance leadership in supplier evaluation committees, pushing average contract value and accreditation sophistication expectations steadily upward across the client buyer base as this newer generation of decision makers gains budget authority and organizational influence within manufacturing companies.
analytical-laboratory-service-market-end-use-penetration-index-1789980292157

Where MMA Sees the Opportunity

These are among the four positions where our research anticipates prominent divergence between winners and laggards over the coming forecast period. Each is grounded in the demand model, the regulatory perimeter, and the announced capacity pipeline.
01 / AI INTERPRETATION INVESTMENT

Prioritize AI interpretation depth as the primary differentiator

AI-Assisted Analytical Data Interpretation Services is growing at roughly 11.5 percent annually against a market-wide 6.5 percent average, the widest gap of any covered segment. Laboratories that under-invest in interpretation capability will lose large sponsor deals to competitors offering demonstrably faster, more accurate result turnaround, since procurement teams increasingly benchmark laboratories directly against each other on this single measurable metric. MMA views interpretation depth as the primary competitive battleground through 2036, ahead of pricing or accreditation breadth alone, since interpretation accuracy is now independently verifiable against regulatory audit standards.
02 / CONSULTING SERVICE EXPANSION

Build regulatory consulting revenue beyond core testing

Regulatory submission consulting bundles carry the industry's highest gross margins, well above standard testing sales available to smaller consumer goods clients. Laboratories that pair core testing with submission consulting capture disproportionate deal value as pharmaceutical pipeline complexity intensifies across major covered regulatory jurisdictions worldwide. MMA expects consulting-attached revenue to outpace standalone testing growth meaningfully across the coming decade for laboratories that execute this transition early and effectively, ahead of slower-moving competitors still reliant entirely on flat per-test pricing models with no attached consulting revenue.
03 / INDIA MARKET ENTRY

Prioritize India given its fastest national growth trajectory

India is growing at roughly 9.0 percent annually, the fastest of any covered country, driven by rapidly expanding pharmaceutical generics manufacturing alongside government-backed export quality initiatives. Laboratories without localized accreditation support risk ceding this expansion to regional specialists building compliant testing capacity from the outset. MMA views early localized capacity investment there as materially cheaper than later market entry once domestic incumbents establish local partnership networks and sponsor trust that slower-moving latecomers will struggle to replicate quickly once the domestic market consolidates around early movers.
04 / RETENTION INFRASTRUCTURE INVESTMENT

Defend renewal economics through deeper validation lock-in

Switching cost from re-validating an entirely new laboratory relationship against a client's own quality management system is the strongest retention lever available to incumbents, and it strengthens with every additional product cycle a client stays with one provider. Laboratories should invest in deeper method validation and accreditation continuity rather than competing purely on entry-level pricing alone. MMA expects laboratories with the strongest validation depth to command premium renewal pricing well ahead of price-competitive challengers by 2036, particularly among pharmaceutical and biotechnology clients.

Engagement Snapshot From the Field

A live engagement with an industry participant carrying material or product regulatory and market exposure ahead of a defining policy shift, showing how our research translates into a defensible multi-year portfolio strategy.
MARKET MINDS ADVISORY · CLIENT ENGAGEMENT SUMMARY
Analytical Laboratory Service Producer Strategic Portfolio Review and Transition Roadmap 2026·Investment Scenario on Analytical Laboratory Service Exposure Evaluation 2025-26
CLIENT PROFILE
The client is a mid-size biotechnology sponsor developing biologics therapeutics across North America and Western Europe, relying on multiple regional testing laboratories for analytical characterization work across different development programs. Facing rising regulatory submission complexity as its pipeline expanded, the sponsor sought an independent assessment of laboratory partner consolidation options before committing to a long-term single-provider relationship.
STRATEGIC CHALLENGE
The sponsor's development programs had accumulated separate laboratory relationships across different regions and testing categories over several years, leaving inconsistent turnaround times and duplicated method validation effort across similar analytical requirements. Leadership needed clarity on whether a phased single-provider consolidation or continued multi-laboratory management better balanced deployment risk against ongoing regulatory submission timeline pressure.
MMA APPROACH
MMA conducted structured interviews with regulatory affairs, quality, and program leadership across four representative development programs, alongside a comparative technical assessment of five leading laboratory providers' AI interpretation capability and multi-jurisdiction accreditation depth. The engagement benchmarked projected turnaround times against the sponsor's own historical submission timeline data across the preceding two years.
KEY FINDINGS
  1. Fragmented laboratory relationships across programs added a measurable turnaround delay each quarter that a consolidated provider relationship would substantially eliminate going forward.
  2. Development programs with the highest analytical complexity showed the largest projected turnaround gains from AI interpretation adoption relative to simpler, lower-complexity programs in the portfolio.
  3. A phased single-provider consolidation reduced projected total validation cost meaningfully compared to continued multi-laboratory management, per client-reported estimates shared during the engagement.
  4. Regulatory affairs staff reported measurably higher confidence in submission timeline predictability once consolidated laboratory reporting replaced the prior fragmented, program-by-program tracking approach entirely.
CLIENT PROFILE
The client is a mid-size biotechnology sponsor developing biologics therapeutics across North America and Western Europe, relying on multiple regional testing laboratories for analytical characterization work across different development programs. Facing rising regulatory submission complexity as its pipeline expanded, the sponsor sought an independent assessment of laboratory partner consolidation options before committing to a long-term single-provider relationship.
STRATEGIC CHALLENGE
The sponsor's development programs had accumulated separate laboratory relationships across different regions and testing categories over several years, leaving inconsistent turnaround times and duplicated method validation effort across similar analytical requirements. Leadership needed clarity on whether a phased single-provider consolidation or continued multi-laboratory management better balanced deployment risk against ongoing regulatory submission timeline pressure.
MMA APPROACH
MMA conducted structured interviews with regulatory affairs, quality, and program leadership across four representative development programs, alongside a comparative technical assessment of five leading laboratory providers' AI interpretation capability and multi-jurisdiction accreditation depth. The engagement benchmarked projected turnaround times against the sponsor's own historical submission timeline data across the preceding two years.
KEY FINDINGS
  1. Fragmented laboratory relationships across programs added a measurable turnaround delay each quarter that a consolidated provider relationship would substantially eliminate going forward.
  2. Development programs with the highest analytical complexity showed the largest projected turnaround gains from AI interpretation adoption relative to simpler, lower-complexity programs in the portfolio.
  3. A phased single-provider consolidation reduced projected total validation cost meaningfully compared to continued multi-laboratory management, per client-reported estimates shared during the engagement.
  4. Regulatory affairs staff reported measurably higher confidence in submission timeline predictability once consolidated laboratory reporting replaced the prior fragmented, program-by-program tracking approach entirely.
RECOMMENDED STRATEGY
Phase 1: Phase one: pilot a single laboratory provider across two representative development programs over four months, tracking turnaround and validation gains. Phase 2: Phase two: expand the provider relationship to remaining development programs across all covered regions while sunsetting legacy laboratories incrementally across each development program. Phase 3: Phase three: negotiate a multi-year enterprise agreement bundling regulatory submission consulting and AI-assisted interpretation services across the entire development pipeline going forward.
OUTCOME
The sponsor adopted the recommended phased single-provider consolidation, reporting a substantial reduction in submission timeline variance within three quarters of full transition (client-reported, unverified by MMA). Regulatory affairs staff previously consumed by multi-laboratory coordination were redirected toward proactive submission strategy work instead, strengthening overall pipeline predictability.

Frequently Asked Questions

Foundational context covering the market sizes, CAGR, scope, country, region and competition that inform every finding below. This section is provided to cover basics and most often pre-purchase conversations, answered from the MMA Primary Research Dataset.

What is the current size of the Analytical Laboratory Service Market?

The Analytical Laboratory Service Market reached an estimated 28.0 billion dollars in 2025. Growth is driven by expanding pharmaceutical quality mandates and environmental testing regulation worldwide.

How large will the Analytical Laboratory Service Market be by 2036?

MMA projects the market will reach approximately 55.98 billion dollars by 2036. This reflects sustained regulatory pressure and expanding AI-assisted interpretation adoption across laboratories worldwide.

What is the CAGR for the Analytical Laboratory Service Market 2026 to 2036?

The market is projected to grow at a 6.5 percent compound annual growth rate between 2026 and 2036. Bull and bear scenarios range from 5.3 to 7.7 percent.

Which segment is growing fastest?

AI-Assisted Analytical Data Interpretation Services is the fastest-growing segment, expanding at roughly 11.5 percent annually. This outpaces the overall market by nearly 1.8 times over the forecast period.

Who are the major companies in the Analytical Laboratory Service Market?

Leading providers include SGS, Bureau Veritas, Eurofins Scientific, Intertek, and ALS Limited. Together these five providers hold an estimated 33 percent combined share on a market participation basis.

Which country is growing fastest?

India is the fastest-growing country, expanding at roughly 9.0 percent annually. Rapidly expanding pharmaceutical generics manufacturing is driving this accelerated growth trajectory across the region.

Report Segmentation Architecture

The full report scope spans multiple orthogonal segmentation dimensions, with cross-tabulated demand data provided for each dimension pair. Coverage extends further to regional breakdowns, trend trajectories, and the competitive detail needed to support segment-level decision-making.

By Service Function

  • AI-Assisted Analytical Data Interpretation Services
  • Multi-Jurisdiction Accreditation Certification Services
  • Routine Compliance Testing Services
  • Regulatory Submission Consulting Services
  • Method Development and Validation Services
  • Sample Collection and Chain of Custody Services

By End-Use Industry

  • Pharmaceutical and Biotechnology
  • Environmental and Water Testing
  • Food and Beverage Safety
  • Industrial Materials and Chemicals
  • Agriculture and Agrochemicals

By Commercial Deployment Model

  • Direct Per-Test Service Fees
  • Expedited Turnaround Premium Tiers
  • Regulatory Consulting Service Bundles
  • Instrument Manufacturer Licensing Channels

By Region

  • North America
  • Western Europe
  • East Asia
  • South Asia and Pacific
  • Latin America
  • Middle East and Africa
  • Eastern Europe

Scope, Methodology, and Coverage

Every figure in this report is reproducible from documented input assumptions. The scope below maps the historical period, the forecast horizon, the segmentation dimensions, and the countries covered, alongside the underlying primary and qualitative methodology.
Historical Period
2020 to 2025
Forecast Period
2026 to 2036
Base Year
2025 (USD billions; MMA Primary Research Dataset, September 2026)
Market Definition
The Analytical Laboratory Service Market covers third-party contract testing, analysis, and certification services for pharmaceutical, environmental, food, and industrial materials samples. It excludes in-house corporate laboratory operations not offered commercially to external clients, laboratory equipment and instrument manufacturing, and medical diagnostic testing performed directly on patient samples.
Quantitative Units
USD billions, market share percent, CAGR percent
Segmentation Dimensions
Service function, end-use industry, commercial deployment model, region
Regions Covered
North America, Western Europe, East Asia, South Asia and Pacific, Latin America, Middle East and Africa, Eastern Europe
Countries Covered
United States, China, Germany, India, Japan, Brazil, and 14 additional countries across seven regions
Key Companies Profiled
SGS, Bureau Veritas, Eurofins Scientific, Intertek, ALS Limited, and 15 additional participants
Quantitative Methodology
Primary survey, n=3,800 respondents, Q4 2025, six countries; demand-side model with trade association cross-validation
Qualitative Methodology
47 expert interviews, Q4 2025; applied to validate demand model assumptions, identify emerging dynamics, and assess competitive positioning
Report Format
PDF and XLSX data workbook (Word format preview document)
Publisher
Market Minds Advisory
Report Code
MMA-2026-CHM-593
Published
September 2026
Contact
sales@marketmindsadvisory.com | www.marketmindsadvisory.com

Purchase the full Analytical Laboratory Service Market Report (2026 to 2036).

This report delivers a complete assessment of the Analytical Laboratory Service Market spanning sizing, segmentation, regional dynamics, and competitive positioning through 2036. It combines primary survey data from 3,800 respondents across six countries with 47 expert interviews conducted in the fourth quarter of 2025. Analysts detail segment-level growth drivers, regional demand mechanisms, and competitive moats among leading providers, alongside forward-looking scenario analysis. The report also profiles input cost exposure, portfolio economics, and regulatory consulting monetization strategies, supported by an anonymized client engagement case study drawn from a real advisory mandate.
Segment-level CAGR and market share breakdowns
Seven-region demand analysis with quantified drivers
Competitive landscape with moat and risk profiles
Input cost exposure and mitigation strategies
Portfolio tier economics and margin benchmarks
Anonymized client engagement case study analysis

Built For The People Who Decide

From boardroom strategy to bench-side execution, this report is read cover-to-cover by leaders shaping the next decade of their industry, turning demand scenarios, market dynamics and valuation benchmarks into decisions.
CXOs/ Presidents/ VPs/ Managers
M&A and Corporate Development
Strategy Teams and R&D Heads
Procurement and Product Directors
Regulatory and Compliance Leaders
Investor Relations and Equity Analysts