

Market Minds Advisory
Amplifier and Comparator Market

Amplifier and Comparator Market: Amplifier and Comparator Market. Precision Analog Signal Chain Technology Through 2036

Automotive and industrial electronics designers are specifying precision amplifiers and comparators at unprecedented volumes as sensor fusion and battery management systems proliferate, wagering that analog signal chain quality can differentiate products software alone cannot.

Lead Analyst

Published

September 2026

Make Smarter Decisions with Customized Research Insights

Request a free sample report and evaluate market opportunities, growth trends, and competitive dynamics relevant to your business needs.

2025 MARKET VALUE$5.2BMarket Size 2025
2036 FORECAST VALUE$12.8BBase Case , 2026 to 2036
CAGR 2026 TO 20368.5 %Bull 9.8% / Bear 7.2%
INCREMENTAL OPPORTUNITY$7.1BNet 10- year value creation
EXPANSION MULTIPLE2.26x2036 value over 2026 base
Strategic Levers
M&A Pipeline
Regional Outlook
Country Rankings
Competitive Intelligence
Segmental Deep-dive
Call-Us : 91 93563 13602

Executive Snapshot and Market Trajectory.

Amplifier and comparator demand is accelerating rapidly as automotive electrification, industrial sensing, and medical monitoring applications require increasingly precise analog signal conditioning that digital processing alone cannot fully replace anymore, reshaping design-in priorities across nearly every electronics manufacturer and product category tracked closely in this analysis worldwide today.
Instrumentation amplifiers and programmable gain amplifiers are capturing outsized growth as automotive battery management and industrial precision sensing applications demand higher accuracy signal chains than standard operational amplifiers provide today. East Asia holds the largest share given concentrated semiconductor fabrication and electronics assembly capacity, while standard operational amplifiers remain the largest deployed product category by unit count across consumer and industrial electronics worldwide today.
Competition splits between diversified analog semiconductor giants offering broad amplifier and comparator portfolios spanning thousands of part numbers and specialized manufacturers competing on ultra-low noise performance and precision specifications for niche applications across multiple end markets and product categories worldwide today. Supply chain pressure around semiconductor fabrication capacity is reshaping sourcing strategy, forcing designers to qualify second-source suppliers well beyond what single-vendor design practices previously required across the electronics industry broadly worldwide today.
Market Definition
The amplifier and comparator market covers standard operational amplifiers, instrumentation amplifiers, differential amplifiers, programmable gain amplifiers, voltage comparators, and power or radio frequency amplifiers used in analog signal conditioning applications. It excludes digital signal processors, microcontrollers without integrated analog front ends, and discrete transistor-level amplifier designs not sold as packaged integrated circuits.
Base Year Value
$5.2B in 2025 (MMA Primary Research Dataset, September 2026)
Forecast Period
2026 to 2036, eleven discrete annual values
CAGR
8.5% base case. Bull 9.8%. Bear 7.2%.
Fastest Growth Segment
Programmable Gain Amplifiers: 11.0% CAGR
Fastest Growth Country
China: 10.0% CAGR
Fastest Growth Region
South Asia and Pacific: 10.5% CAGR
Largest Region
East Asia: 30% of 2025 global value
Market Leaders
[object Object]
Primary Survey
n=3,800 procurement and R&D decision-makers, Q4 2025, six countries
Methodology
Demand-side build-up, cross-validated against public data, 47 expert interviews

Amplifier and Comparator Market Forecast Scenarios

amplifier-and-comparator-market-size-forecast-scenario-1790006085425
Between 2020 and 2025 amplifier and comparator demand accelerated as automotive electrification and industrial automation investment recovered from pandemic-related semiconductor supply disruption, pushing designers toward higher-precision analog components across nearly every application category tracked closely. Historical annual growth ran near 7.5 percent as battery management and sensor fusion designs multiplied across new vehicle platforms worldwide today.
The base case assumes 8.5 percent annual growth through 2036, driven by three mechanisms: continued automotive electrification requiring increasingly sophisticated battery management and motor control signal chains across every new vehicle platform worldwide, expanding industrial automation and precision sensing applications demanding higher accuracy amplifier performance than legacy designs provide, and rising semiconductor content per device across medical monitoring and consumer electronics categories sustaining unit volume growth well beyond simple replacement demand.
A bull scenario centers on accelerated electric vehicle production forcing widespread adoption of advanced battery management amplifier architectures faster than currently planned design cycles across major automakers and their broader global supplier base network. The bear risk is prolonged semiconductor capital expenditure caution delaying planned fabrication capacity expansion across cost-sensitive manufacturers globally this coming product cycle and beyond.

Precision Analog Components Power Automotive Electrification

Silicon wafer processing and packaging together represent the largest share of manufacturing cost for amplifier and comparator integrated circuits, since precision analog performance depends heavily on wafer fabrication process node maturity and trimming calibration steps performed at specialized foundries concentrated in East Asia and North America.
MARKET CONCENTRATIONCR5 48%Top five suppliers hold a fairly high combined market presence
DESIGN-IN CYCLE LENGTH3-5 yearsDesign-in relationships keep spanning many years before major renewal
TOP PRODUCING COUNTRYTaiwan 26%One country generates a large share of new production
FABRICATION UTILISATION79%Fabrication facilities keep running below theoretical maximum wafer output
TRADE INTENSITYHighImport and export activity remains high across this category
WAFER COST SHARE50% of COGSWafer fabrication and packaging represent the largest vendor cost
Design engineers increasingly differentiate suppliers by long-term parametric stability and documented reliability data rather than raw datasheet specifications alone. Companies comparing vendors now weigh second-source availability and long-term supply commitment as heavily as unit price, narrowing the room for suppliers offering only single-source specialized parts without committed long-term production plans. Automotive qualification certification has also become a meaningful differentiator as designers face tightening functional safety requirements across multiple vehicle platforms.
Design-in cycles for amplifier and comparator components typically span three to five years once a part is qualified into a production platform, giving incumbent suppliers with existing design-in relationships a durable advantage over new entrants lacking comparable long-term qualification history and proven field performance data. That dynamic keeps switching costs meaningfully high for designers evaluating alternative suppliers during scheduled product refresh cycles and new platform development projects across the broader product line.
"Nobody notices a well-designed amplifier until it fails in the field, and by then the recall has already cost more than a decade of unit price savings. That is why serious automotive customers still pay up for parts with a proven qualification history."
Principal Analyst, Analog Semiconductor and Components Practice · MMA Technology: Analog Semiconductor Components Practice · September 2026

Market Trends

Electric Vehicle Battery Management Drives Precision Amplifier Demand

Electric vehicle battery management systems require precision instrumentation amplifiers capable of measuring individual cell voltages with extreme accuracy across hundreds of cells connected in series, driving demand for automotive-qualified analog components far beyond what internal combustion vehicles ever required. Battery management architectures increasingly integrate multiple amplifier channels per module to enable cell-level monitoring rather than pack-level estimation, multiplying the amplifier content per vehicle considerably compared to earlier generation designs. Suppliers capable of delivering automotive-grade amplifiers certified for functional safety and extended temperature range are winning design-in slots well ahead of suppliers offering only industrial-grade qualification levels.
Market Impact: Adds 6 signal channels per system
Sensor Fusion Architectures Increase Amplifier Channel Density

Advanced driver assistance systems and industrial robotics increasingly combine multiple sensor types into fused perception architectures, each requiring dedicated signal conditioning amplifiers to translate raw sensor output into usable digital data for processing units. This trend has become a standard design requirement in competitive automotive and robotics procurement evaluations, particularly among suppliers facing strict accuracy and latency requirements around real-time perception. Suppliers lacking sufficient amplifier channel density and integration options are increasingly losing competitive design wins to rivals offering multi-channel integrated solutions rather than discrete single-channel components, reshaping near-term product roadmap priorities across the sensor industry broadly.
Market Impact: Doubles content across 2 vehicle types

Market Opportunities and Growth Drivers

Industrial Automation Expansion Sustains Precision Amplifier Demand

Continued industrial automation expansion across factory robotics, motor control, and precision measurement equipment is sustaining new amplifier and comparator installation well beyond simple replacement activity seen in more mature legacy equipment segments worldwide today. New industrial automation platforms require multiple precision signal conditioning channels per system, generating meaningfully larger per-project semiconductor content than replacement work in established equipment designs overall. Suppliers with established automotive-grade qualification and long-term supply agreements are capturing a disproportionate share of this new capacity investment, since documented reliability shortens qualification timelines considerably for time-sensitive platform launches.
Market Impact: Extends lead times past 20 weeks

Rising Semiconductor Content Per Vehicle Sustains Long Term Growth

Electric and hybrid vehicles carry substantially more analog semiconductor content per unit than conventional internal combustion vehicles, sustaining amplifier and comparator demand growth even during periods of broader automotive production volume caution elsewhere in the industry. Automakers calculate return on investment against actual realized battery efficiency and safety improvement rather than theoretical performance estimates, strengthening the business case considerably across nearly every electric vehicle platform studied closely. Vehicles with the highest battery pack cell counts report the greatest amplifier content per unit and the strongest ongoing appetite for continued precision component investment across future platform generations.
Market Impact: Cuts discrete demand by 15 percent

Market Restraints and Challenges

Semiconductor Fabrication Capacity Constraints Limit Supply Flexibility

Amplifier and comparator production depends on specialized analog semiconductor fabrication capacity that competes directly with digital chip production for the same limited foundry wafer starts, meaning sudden demand spikes can quickly outstrip available capacity. The root cause is the capital intensity of analog fabrication facilities, which discourages rapid capacity expansion compared to more standardized digital fabrication processes serving larger addressable markets. The commercial impact falls hardest on smaller manufacturers lacking long-term capacity reservation agreements, facing extended lead times during demand surges. Several suppliers now offer dual-fab qualified parts as a mitigation approach to reduce capacity concentration risk.
Market Impact: Adds amplifier content on 8 cells

Price Competition From Integrated Solutions Compresses Discrete Margins

Highly integrated system-on-chip solutions increasingly bundle amplifier and comparator functionality directly into larger microcontroller and sensor packages, reducing demand for standalone discrete amplifier components in cost-sensitive consumer applications. The root cause is the genuine cost and board space advantage integration provides for high-volume, less demanding applications where discrete precision performance is not strictly required. The commercial impact falls hardest on suppliers of standard commodity operational amplifiers lacking differentiated performance, facing margin compression as customers shift toward integrated alternatives. Several suppliers now offer higher-precision discrete parts as a mitigation approach targeting applications integration cannot serve.
Market Impact: Adds 12 amplifier channels per module
3 additional market trends, 4 additional growth drivers, and 2 additional restraints and challenges are covered in the full report. Contact sales@marketmindsadvisory.com to access the complete intelligence.

Segment CAGR and Growth Architecture

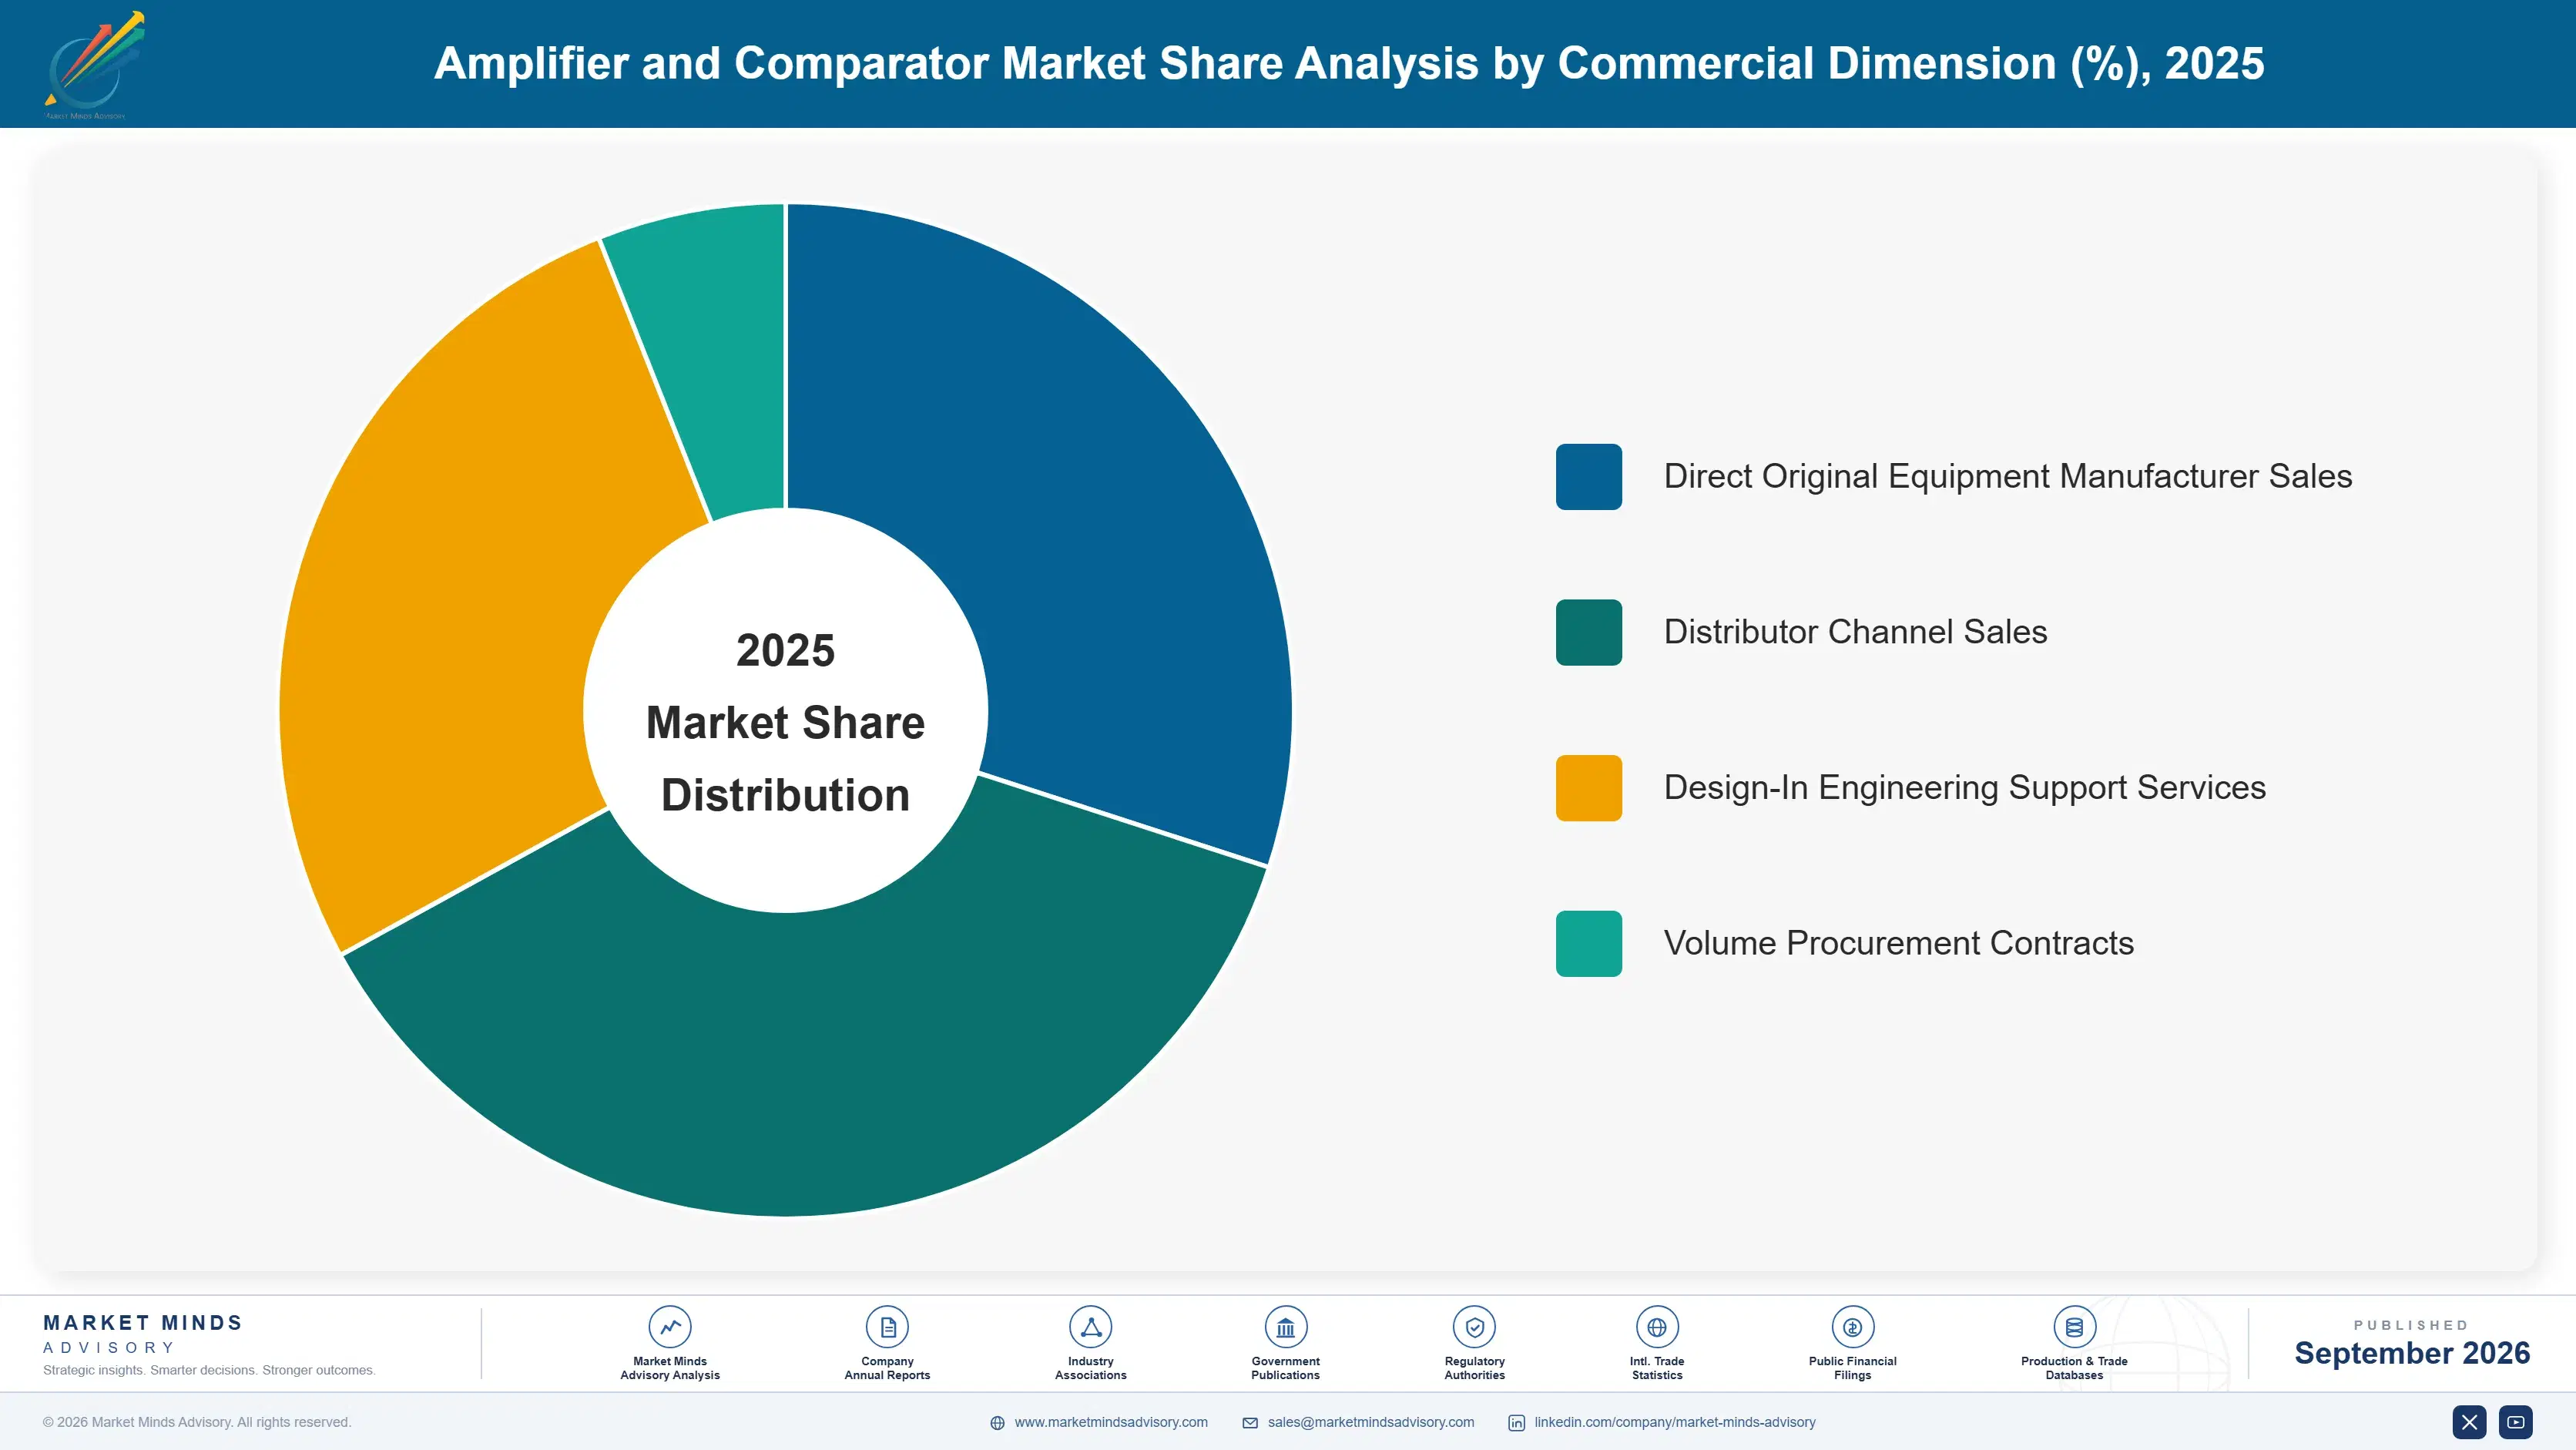
Amplifier and comparator components segment by core signal processing function, spanning standard operational amplifiers and voltage comparators through instrumentation amplifiers, differential amplifiers, programmable gain amplifiers, and power or radio frequency amplifiers used across many industries. Instrumentation and programmable gain amplifiers lead growth as automotive and industrial precision sensing applications demand higher accuracy worldwide today.
amplifier-and-comparator-market-market-share-analysis-1790006085967

Programmable Gain Amplifiers

Programmable gain amplifiers let designers digitally adjust signal amplification levels in real time to accommodate varying sensor output ranges, eliminating the need for multiple fixed-gain amplifier stages in applications where signal magnitude varies considerably during operation. Demand concentrates among automotive battery management, industrial process control, and medical diagnostic equipment manufacturers seeking flexible signal chains that can adapt to changing measurement conditions without hardware redesign. Designers increasingly specify programmable gain amplifiers as a baseline architecture choice for new precision measurement platforms rather than an optional premium feature, pushing suppliers to reduce cost and simplify digital control interfaces for broader adoption. Deployment complexity remains higher than fixed-gain alternatives given the digital configuration work required, though standardized interface protocols have reduced this burden.
CAGR 11.0%

Instrumentation Amplifiers

Instrumentation amplifiers combine multiple operational amplifier stages into a single precision package optimized for measuring small differential signals in the presence of large common-mode noise, a combination standard operational amplifiers handle poorly without extensive external circuitry. Demand spans automotive battery monitoring, industrial weigh scale and bridge sensor applications, and medical monitoring equipment manufacturers seeking the highest achievable measurement accuracy in electrically noisy environments. This segment commands premium pricing tied to noise performance and common-mode rejection specifications rather than simple unit cost, creating a meaningfully different competitive dynamic than standard operational amplifier products entirely. Suppliers compete heavily on long-term parametric stability and documented reliability data, since measurement drift directly undermines the accuracy case customers use to justify the premium price.
CAGR 10.5%
Full segment breakdown across 6 segments available in the complete report.

Regional Architecture and Country Demand Map

Regional demand tracks semiconductor fabrication concentration, automotive and industrial electronics manufacturing scale, and design center presence, with East Asia leading on both fabrication capacity and assembly volume while North America drives premium automotive and industrial design activity nationwide across the entire wider global market today.

North America

The United States drives the overwhelming majority of North American demand, hosting the design centers of leading analog semiconductor suppliers and major automotive and industrial electronics customers requiring the highest precision components available nationwide today. Canada contributes a smaller but steadily growing share, tied to its own automotive component manufacturing base concentrated near the border region overall today. Automotive qualification requirements from major original equipment manufacturers are accelerating supplier consolidation, favoring vendors with established documentation and long-term reliability testing infrastructure over smaller entrants lacking comparable compliance history overall. Design-in and replacement demand both remain healthy in this mature but still innovating market across nearly every electronics vertical tracked closely today.
Share: 25% | CAGR: 8.5% (2026 to 2036)

Western Europe

Germany leads regional adoption by a wide margin, driven by its concentrated automotive and industrial machinery manufacturing base that specifies precision amplifiers extensively across both vehicle electronics and factory automation equipment nationwide today. France and Italy contribute meaningful demand tied to their own automotive and industrial equipment manufacturing sectors, though at considerably smaller scale than Germany overall. The United Kingdom maintains steady demand tied to its aerospace and specialty electronics manufacturing base despite operating under a separate post-Brexit regulatory framework. Growth trails East Asia considerably since most Western European semiconductor fabrication capacity has consolidated elsewhere, limiting demand primarily to design activity and component sourcing rather than local wafer production capacity.
Share: 19% | CAGR: 7.0% (2026 to 2036)
Regional intelligence for 5 additional markets available in the complete report: East Asia, South Asia and Pacific, Latin America, Middle East and Africa, Eastern Europe. Contact sales@marketmindsadvisory.com.
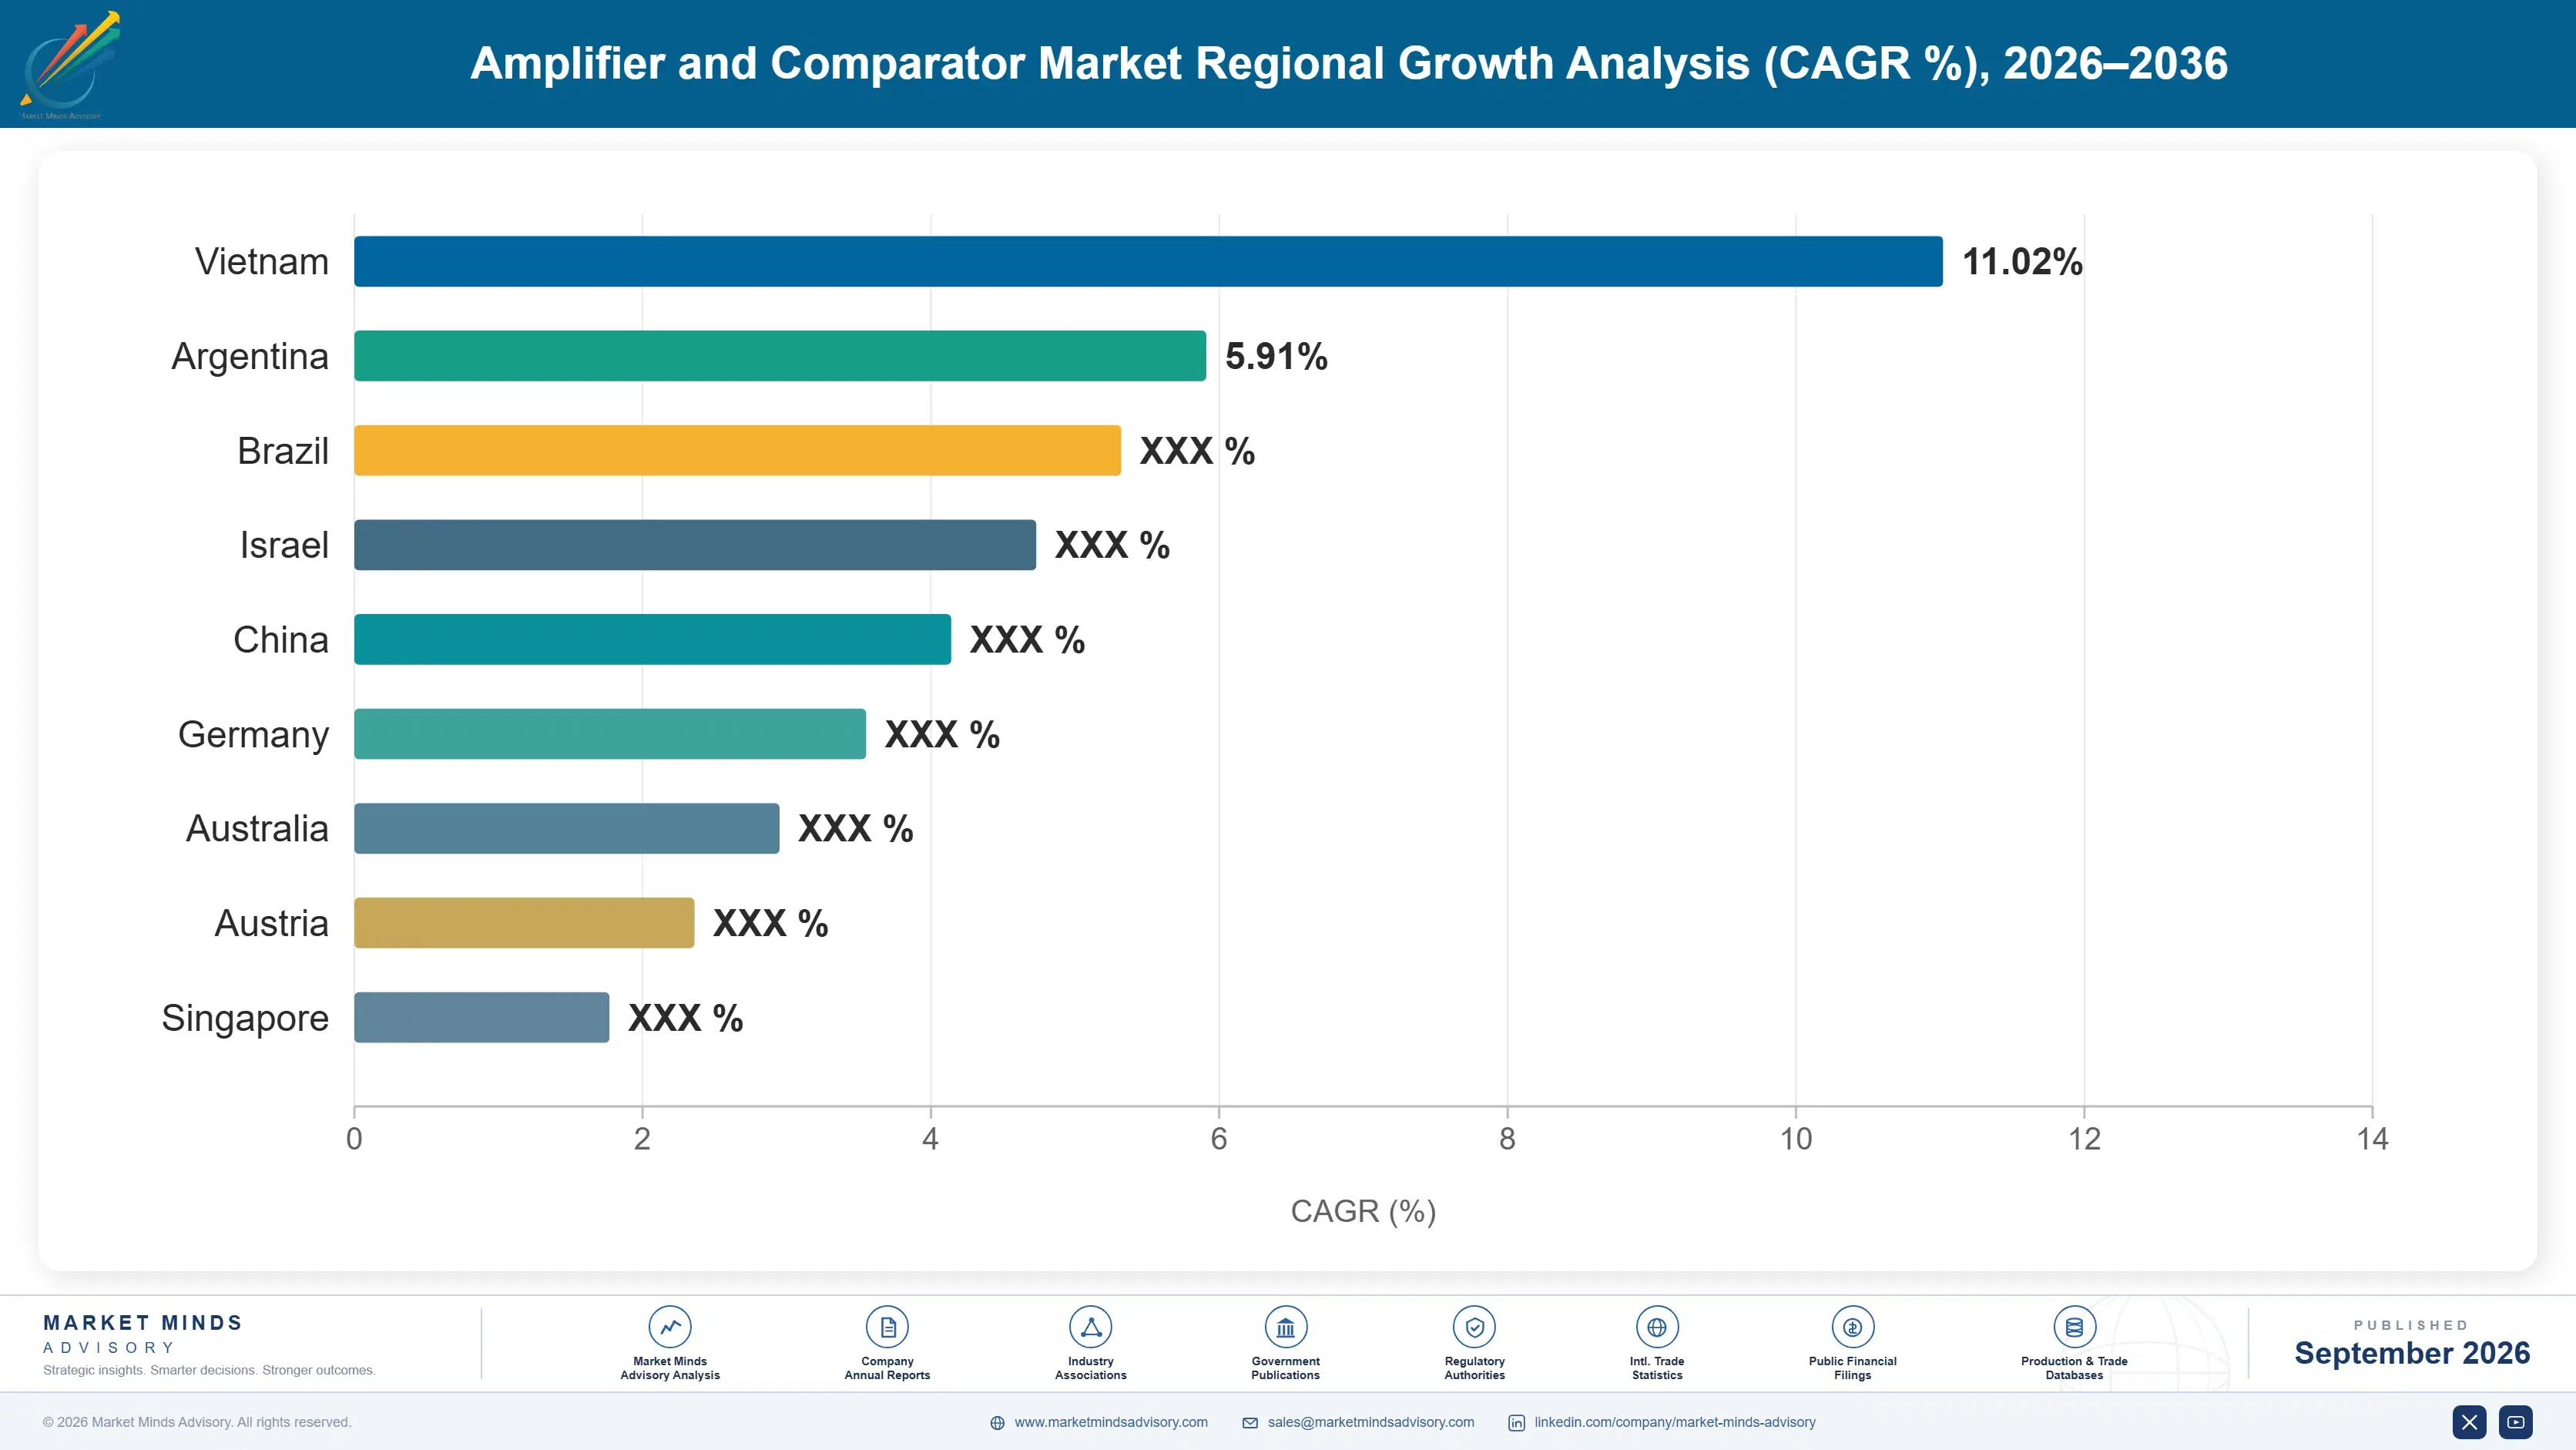
amplifier-and-comparator-market-country-cagr-analysis-1790006086479

Monetizing Automotive Qualification and Design Longevity

Amplifier and comparator margins increasingly depend on automotive qualification depth and long design-in life rather than standard commodity pricing alone. Suppliers that build deep functional safety documentation capability capture disproportionate lifetime value from every design win across successive product generations built on the same underlying platform for many years of continuous production and repeat ordering.

Automotive Qualification Documentation Premium Pricing Model

Charging a premium for automotive-grade qualification testing and functional safety documentation converts a standard commodity sale into a higher-margin certified relationship that competitors selling only industrial-grade parts cannot easily replicate at comparable speed. Suppliers report automotive qualification increases average selling price by roughly 45 percent compared to equivalent industrial-grade parts, since the certification investment creates genuine switching cost once a design is validated for production. Customers accept this premium because it transfers reliability and compliance risk partly to the supplier, reducing their own internal validation burden considerably across the entire program.
Market Impact: Raises average selling price by 45 percent overall

Long Life Platform Design Win Capture

Winning design-in on a long-life automotive or industrial platform lets suppliers capture repeat orders across every subsequent production run for ten years or more without additional sales investment required each cycle or renewal period. This repeat order revenue now represents close to 60 percent of total amplifier revenue for suppliers with strong automotive design win portfolios, reflecting the durable nature of platform-level component specifications across the industry. Suppliers favor pursuing long-life platform design wins over shorter consumer electronics cycles since the revenue durability justifies a more patient sales investment approach overall.
Market Impact: Captures roughly 60 percent of total platform revenue

Dual Source Qualified Supply Agreement Premium

Offering a dual-source qualified supply agreement across two manufacturing facilities lets suppliers command a premium from customers seeking supply chain resilience following recent semiconductor shortage experiences across the broader global industry today. This dual-source premium typically commands 10 percent above single-source equivalent pricing, reflecting the additional qualification and manufacturing coordination investment required to maintain identical performance across two facilities. Customers increasingly view dual-source qualification as a standard procurement requirement for critical automotive and industrial applications rather than an optional enhancement, expanding the addressable market for this premium considerably over time.
Market Impact: Commands roughly a 10 percent dual-source pricing premium

Who Controls the Margin Pool

Concentration is moderate to high, with the top five suppliers by annual semiconductor shipment revenue holding roughly 48 percent combined share of a market split between diversified analog giants and specialized precision manufacturers. Texas Instruments leads by a meaningful margin over the next closest challenger, built on decades of manufacturing scale and design-in relationships worldwide that newer entrants struggle to match at comparable breadth.
Current competitive activity centers on automotive qualification expansion, dual-source manufacturing capacity announcements, and integrated multi-channel amplifier solutions across nearly every supplier product roadmap tracked in this analysis today. Diversified analog giants continue expanding automotive-qualified portfolios spanning thousands of part numbers, while specialized manufacturers compete on ultra-low noise performance and precision specifications for regulated buyers evaluating multiple competing proposals simultaneously.

Emerging pressure comes from Chinese domestic analog semiconductor manufacturers expanding rapidly, threatening to reshape competitive dynamics beyond their traditional commodity segment stronghold within the next several years across the industry. Rankings could shift meaningfully if any top-five supplier secures a dominant automotive battery management design win with a major electric vehicle platform or suffers a significant fabrication capacity disruption that damages customer trust considerably.
amplifier-and-comparator-market-company-positioning-matrix-1790006087005

Competitive Moat and Risk Dimensions

TEXAS INSTRUMENTS

Moat: Broad portfolio manufacturing scale

Texas Instruments benefits from decades of manufacturing scale and the industry's broadest amplifier and comparator portfolio, giving it distribution reach and inventory availability that specialized manufacturers cannot match without years of comparable capital investment. That existing footprint means many designers default to Texas Instruments for new platform specifications without formally evaluating competing suppliers during routine component selection.
TEXAS INSTRUMENTS

Risk: Slower niche precision responsiveness

Texas Instruments moves more cautiously on ultra-niche precision requests than smaller specialist manufacturers solely focused on extreme low-noise performance, since its broad portfolio spreads engineering resources across many product categories. If nimble competitors continue capturing specialized design wins through faster precision innovation, Texas Instruments could lose share in the highest-precision instrumentation segment.
ANALOG DEVICES

Moat: Deep precision engineering reputation

Analog Devices built its reputation through decades of precision engineering leadership in instrumentation and high-performance signal chain design, giving it an advantage with customers requiring the highest achievable measurement accuracy that generalist suppliers cannot easily match. That specialization attracts customers in medical, aerospace, and precision industrial applications who specifically prioritize proven performance over lowest unit price.
ANALOG DEVICES

Risk: Higher price limits volume segments

Analog Devices premium pricing tied to its precision engineering reputation makes it a harder sell for high-volume consumer electronics customers seeking lower-cost standard amplifiers without extreme precision requirements attached. If lower-cost manufacturers continue expanding adequate precision capability at meaningfully lower price points, Analog Devices could lose share among cost-sensitive volume segments.

Players Tracked

Prominent Players

Texas Instruments
Analog Devices
STMicroelectronics
onsemi
Microchip Technology

Other Key Players

Renesas Electronics
Infineon Technologies
ROHM Semiconductor
Toshiba
Diodes Incorporated
NXP Semiconductors
Skyworks Solutions
Qorvo
Cirrus Logic
Nexperia
Vishay Intertechnology
Monolithic Power Systems
Silicon Labs
Semtech
Nisshinbo Micro Devices

Recent Developments

JANUARY 2026

Texas Instruments: product launch

Texas Instruments announced an expanded automotive-qualified instrumentation amplifier family targeting battery management applications, offering cell-level monitoring accuracy compatible with existing automotive electronic control unit architectures across multiple vehicle platforms nationwide. The launch targets electric vehicle manufacturers seeking higher channel density without full system redesign work.
Signal: Signals diversified analog giants racing to expand automotive-qualified precision amplifier portfolios very quickly across the industry
APRIL 2026

Analog Devices: product launch

Analog Devices launched a dual-source manufacturing initiative for its highest-volume automotive amplifier parts, qualifying a second fabrication facility to address customer supply chain resilience concerns following recent industry-wide shortage experiences. The launch responds directly to accelerating customer demand for documented supply continuity guarantees across critical platforms.
Signal: Signals established suppliers racing to qualify dual-source manufacturing capacity across critical automotive product lines very quickly
AUGUST 2026

STMicroelectronics: acquisition

STMicroelectronics acquired a smaller precision instrumentation amplifier design firm to add ultra-low noise engineering capability to its existing analog portfolio for customers managing increasingly demanding medical and industrial measurement requirements. The deal accelerates STMicroelectronics entry into the fast-growing instrumentation amplifier segment without years of internal design work.
Signal: Signals established analog vendors acquiring precision specialists quickly to capture growing instrumentation amplifier market demand overall

Wafer Fabrication Capacity Exposure

Silicon wafer fabrication and packaging together represent roughly 50 percent of amplifier and comparator cost of goods sold, sourced predominantly from specialized analog foundries concentrated in Taiwan, the United States, and select European locations. Testing, trimming, and quality assurance labor make up most of the remaining structured cost base for a typical precision analog part.
Analog foundry capacity tightened meaningfully during 2021 and 2022 as automotive and consumer electronics demand competed directly with digital chip production for limited mature-node fabrication slots, according to a Texas Instruments annual report, squeezing margins for smaller manufacturers without long-term capacity reservation agreements locked in advance. Suppliers facing allocation cuts during that period experienced delivery delays exceeding six months, forcing several to delay planned product launches and lose design-in opportunities to better-supplied competitors.

Scaled manufacturers with owned fabrication facilities absorbed that disruption with far less delivery delay than smaller fabless competitors buying wafer capacity through foundry partners at marked-up prices and longer lead times. This exposure gap compounds further since large diversified analog vendors can shift production across multiple owned facilities and process nodes more easily than specialized manufacturers dependent on a single foundry relationship for their entire product portfolio.
amplifier-and-comparator-market-cost-volatility-analysis-1790006087201

Long Term Capacity Reservation Agreements

Locking in wafer fabrication capacity through multi-year reservation agreements with foundry partners shields larger manufacturers from allocation shortages during periods of industry-wide chip demand, though it requires forecasting production volume years in advance and carries meaningful penalty exposure if actual order volume falls well short of contracted minimums during an unexpected sudden demand slowdown.

Owned Fabrication Facility Investment Strategy

Investing in owned wafer fabrication facilities rather than relying entirely on external foundry partners reduces allocation dependency risk, though it requires substantial upfront capital investment that only the largest manufacturers can justify economically. Manufacturers with owned fabrication capacity absorbed the last industry-wide shortage considerably better than fabless competitors dependent entirely on external foundry allocation decisions.

Multi Foundry Qualification Diversification Approach

Qualifying product designs across multiple analog foundries reduces single-source capacity dependency risk, though it requires additional engineering validation work to confirm performance consistency across different foundry processes and various manufacturing tolerances involved. Manufacturers that diversified foundry relationships before the last shortage recovered delivery schedules considerably faster than single-source competitors still relying on one supplier.

Portfolio Architecture for Margin Defence

Gross margins vary meaningfully across the amplifier and comparator portfolio, from thin margins on basic standard operational amplifiers up to strong margins on instrumentation amplifiers, programmable gain amplifiers, and automotive-qualified precision parts sold to automotive and industrial customers worldwide. Volume sits overwhelmingly in the commodity-adjacent standard amplifier tier, but value concentrates in the smaller precision and automotive-qualified tiers instead, across nearly every regional market this study tracks in fine detail.
The tension between chasing unit volume and protecting margin plays out visibly in supplier sales strategy, where companies must decide how much to discount standard commodity amplifiers to win large consumer electronics accounts against how much to recoup through automotive qualification and precision instrumentation design wins that actually drive long-term profit across the full multi-year customer relationship each supplier maintains with its largest accounts.

High-value pools concentrate in instrumentation amplifiers, programmable gain amplifiers, and automotive-qualified precision parts, where customers pay for measurable accuracy and functional safety compliance rather than raw commodity hardware alone. That is where most suppliers are now directing new product development spend, well ahead of any planned expansion in commodity-tier standard operational amplifier functionality currently under consideration at most manufacturers today.

Standard Operational Amplifiers

Thin margin standard operational amplifiers and comparators sold primarily on price and basic reliability through electronics distribution channels, competing almost entirely on unit cost rather than precision specifications or advanced features.
Gross Margin: 18-28%

Automotive-Qualified Amplifiers

Automotive-qualified amplifiers carrying proven functional safety documentation and extended temperature certification support, sold through direct sales relationships at a meaningful premium over basic industrial-grade alternatives and unproven newer market suppliers.
Gross Margin: 30-40%

Instrumentation and Programmable Gain Amplifiers

Advanced instrumentation and programmable gain amplifiers built around ultra-low noise performance and precision engineering collaboration, targeting customers willing to pay a premium for measurable accuracy and long-term parametric stability over time.
Gross Margin: 40-50%
amplifier-and-comparator-market-portfolio-architecture-1790006087706

High-value Sub-segments and Strategic Watch-out

Programmable Gain Amplifiers

Instrumentation amplifiers represent the highest value, fastest growing pocket of the market, driven by automotive battery management and industrial precision sensing applications demanding measurement accuracy that extends supplier lifetime value considerably across every design win and product generation for years to come across the industry.
Gross Margin: 40-50%

Instrumentation Amplifiers

Programmable gain amplifiers are a high-value, moderate-growth pocket where digital flexibility and calibration precision support durable pricing power even as unit growth moderates relative to newer instrumentation amplifier categories gaining share steadily across nearly every industrial vertical tracked worldwide over the coming decade and beyond.
Gross Margin: 30-40%

Standard Operational Amplifiers

Standard operational amplifiers remain the volume core of the market, competing largely on reliability and price through electronics distribution channels, generating thinner margins but still sustaining the largest absolute deployment base across nearly every electronics manufacturing segment tracked globally each and every single year without exception.
Gross Margin: 18-28%

Fabrication Capacity Concentration

Fabrication capacity concentration is a strategic watch-out rather than a true revenue segment today, where suppliers lacking dual-source manufacturing agreements risk exclusion from critical automotive and industrial procurement shortlists as customers grow increasingly wary of single-source supply disruption and unplanned lengthy delivery delays over time.
Gross Margin: n/a

Recurring Design-In and Volume Revenue

Amplifier and comparator revenue increasingly resembles annuity revenue once a part wins design-in on a production platform, since engineering teams rarely re-qualify analog components for an existing platform once initial validation and characterization is complete. Suppliers that win design-in on a high-volume automotive or industrial platform typically capture repeat orders across every subsequent production run for years, creating a durable revenue tail extending well beyond the initial design win.
Adoption depth varies sharply by end-use vertical. Automotive and industrial customers adopt precision instrumentation and programmable gain amplifiers aggressively given demanding accuracy and functional safety requirements, while consumer electronics manufacturers prioritize cost and integration density over raw precision, creating a meaningfully different specification profile within each specific vertical entirely across the wider electronics industry overall.

Buyer profiles are shifting as younger analog design engineers increasingly specify integrated diagnostics and communication interfaces as standard practice rather than treating connectivity as an optional premium feature reserved for flagship platforms only. This generational shift is broadening the addressable buyer base considerably beyond traditional discrete component specialists toward system-level design teams overseeing plant-wide sensor integration programs across the wider organization today.
amplifier-and-comparator-market-end-use-penetration-index-1790006088197

Where Amplifier Value Concentrates

These are among the four positions where our research anticipates prominent divergence between winners and laggards over the coming forecast period. Each is grounded in the demand model, the regulatory perimeter, and the announced capacity pipeline.
01 / AUTOMOTIVE QUALIFICATION INVESTMENT STRATEGY

Qualification depth separates durable suppliers from commodity component vendors

Suppliers that build deep automotive qualification and functional safety documentation capability capture disproportionate lifetime value that competitors selling only industrial-grade parts cannot easily match at comparable price or speed. That advantage compounds as automotive and industrial customers keep favoring suppliers with proven certification depth over vendors offering only basic qualification levels across nearly every product category tracked. Suppliers treating automotive qualification as optional will find their addressable customer base shrinking steadily as functional safety requirements keep rising across nearly every regulated sector this study tracks closely.
02 / BATTERY MANAGEMENT DESIGN STRATEGY

Battery management design wins become the new automotive baseline

Precision instrumentation amplifiers are shifting from specialty niche component to baseline battery management specification faster than most supplier roadmaps anticipated just a few years ago at this point. Suppliers committing engineering resources to automotive-grade instrumentation amplifiers now will capture disproportionate share of new electric vehicle platform contracts through 2036 as automakers increasingly treat cell-level monitoring as a mandatory safety requirement across nearly every vehicle segment. Competitors relying solely on standard operational amplifiers risk losing customers to whichever supplier wins the battery management design slot first.
03 / FOUNDRY SOURCING DIVERSIFICATION STRATEGY

Foundry diversification reduces supplier delivery and cost exposure meaningfully

Suppliers that diversify wafer fabrication sourcing beyond a single foundry partner reduce delivery and cost exposure that competitors relying on one facility cannot absorb as easily during periods of real capacity stress or allocation disruption. The 2021 analog chip shortage demonstrated how quickly delivery delays can spread for manufacturers lacking diversified fabrication relationships across multiple foundry partners and geographic regions worldwide already operating at scale. Suppliers that diversify fabrication sourcing earliest will hold a meaningful delivery and resilience advantage over slower-moving rivals for years ahead.
04 / INTEGRATED MULTI-CHANNEL PLATFORM STRATEGY

Integrated channel density becomes the next amplifier competitive battleground

Diversified analog giants and specialized precision manufacturers are converging on integrated multi-channel amplifier solutions as the next major competitive battleground across the entire amplifier and comparator industry today. Suppliers investing in higher channel density and integrated diagnostics now will protect design win contracts that competitors relying on standalone discrete components risk losing entirely as buyer expectations keep rising steadily across every electronics sector. This protection becomes more valuable as sensor fusion architecture adoption keeps intensifying across every major manufacturing industry tracked in this analysis.

Engagement Snapshot From the Field

A live engagement with an industry participant carrying material or product regulatory and market exposure ahead of a defining policy shift, showing how our research translates into a defensible multi-year portfolio strategy.
MARKET MINDS ADVISORY · CLIENT ENGAGEMENT SUMMARY
Amplifier and Comparator Producer Strategic Portfolio Review and Transition Roadmap 2026·Investment Scenario on Amplifier and Comparator Exposure Evaluation 2025-26
CLIENT PROFILE
The client is a mid-size electric vehicle manufacturer launching its third vehicle platform with an in-house designed battery management system requiring instrumentation amplifiers across 400 individual battery cells per pack. Annual amplifier and comparator component spend was approximately 30 million dollars (client-reported, unverified by MMA) prior to the engagement, sourced from a single qualified supplier.
STRATEGIC CHALLENGE
The client faced growing board-level concern about single-source supply risk following a recent industry-wide semiconductor shortage, but leadership remained uncertain whether qualifying a second supplier could be completed in time without delaying the upcoming vehicle launch timeline or compromising quality. Leadership needed a credible dual-sourcing evaluation framework before committing engineering resources.
MMA APPROACH
MMA conducted primary interviews with amplifier suppliers and comparable electric vehicle manufacturers already running dual-sourced battery management programs, benchmarked automotive qualification coverage across multiple supplier proposals, and modeled financial outcomes across three sourcing scenarios ranging from single-supplier continuation to full dual-source qualification spanning the entire vehicle platform lifecycle and beyond.
KEY FINDINGS
  1. Second-source suppliers with proven automotive qualification history delivered validated samples measurably faster than suppliers lacking comparable prior certification experience with the client.
  2. Comparable electric vehicle manufacturers running dual-sourced battery management programs reported meaningfully improved negotiating leverage and reduced production risk exposure across the board.
  3. Parametric performance testing showed the leading second-source candidate matched incumbent supplier accuracy within acceptable tolerance across all tested operating temperature ranges and conditions.
  4. A phased qualification approach limited to the newest vehicle platform reduced program risk while preserving the timeline for the upcoming vehicle launch commitment.
CLIENT PROFILE
The client is a mid-size electric vehicle manufacturer launching its third vehicle platform with an in-house designed battery management system requiring instrumentation amplifiers across 400 individual battery cells per pack. Annual amplifier and comparator component spend was approximately 30 million dollars (client-reported, unverified by MMA) prior to the engagement, sourced from a single qualified supplier.
STRATEGIC CHALLENGE
The client faced growing board-level concern about single-source supply risk following a recent industry-wide semiconductor shortage, but leadership remained uncertain whether qualifying a second supplier could be completed in time without delaying the upcoming vehicle launch timeline or compromising quality. Leadership needed a credible dual-sourcing evaluation framework before committing engineering resources.
MMA APPROACH
MMA conducted primary interviews with amplifier suppliers and comparable electric vehicle manufacturers already running dual-sourced battery management programs, benchmarked automotive qualification coverage across multiple supplier proposals, and modeled financial outcomes across three sourcing scenarios ranging from single-supplier continuation to full dual-source qualification spanning the entire vehicle platform lifecycle and beyond.
KEY FINDINGS
  1. Second-source suppliers with proven automotive qualification history delivered validated samples measurably faster than suppliers lacking comparable prior certification experience with the client.
  2. Comparable electric vehicle manufacturers running dual-sourced battery management programs reported meaningfully improved negotiating leverage and reduced production risk exposure across the board.
  3. Parametric performance testing showed the leading second-source candidate matched incumbent supplier accuracy within acceptable tolerance across all tested operating temperature ranges and conditions.
  4. A phased qualification approach limited to the newest vehicle platform reduced program risk while preserving the timeline for the upcoming vehicle launch commitment.
RECOMMENDED STRATEGY
Phase 1: Phase one: qualify the leading second-source supplier against the brand newest vehicle platform within the very first eight calendar months. Phase 2: Phase two: validate production-level parametric performance across a full battery pack sample set before scaling to full volume production levels. Phase 3: Phase three: extend the qualified second source to the two earlier vehicle platforms based on the validated field performance test data.
OUTCOME
Within ten months of initiating the qualification program, the client successfully validated a second amplifier supplier and secured board approval for dual-sourced battery management components across all three vehicle platforms (client-reported, unverified by MMA), meeting the original vehicle launch timeline without any delay whatsoever to the schedule.

Frequently Asked Questions

Foundational context covering the market sizes, CAGR, scope, country, region and competition that inform every finding below. This section is provided to cover basics and most often pre-purchase conversations, answered from the MMA Primary Research Dataset.

What is the current size of the Amplifier and Comparator Market?

The global amplifier and comparator market was valued at approximately 5.2 billion dollars in 2025, covering operational amplifiers, instrumentation amplifiers, differential amplifiers, programmable gain amplifiers, voltage comparators, and power or radio frequency amplifiers.

How large will the Amplifier and Comparator Market be by 2036?

The market is projected to reach approximately 12.75 billion dollars by 2036, up from 5.64 billion dollars in 2026, an incremental gain of roughly 7.11 billion dollars over the forecast period.

What is the CAGR for the Amplifier and Comparator Market 2026 to 2036?

The market is expected to grow at a compound annual rate of 8.5 percent between 2026 and 2036, with a bull case near 9.8 percent and a bear case near 7.2 percent annually.

Which segment is growing fastest?

Programmable gain amplifiers lead segment growth at 11.0 percent annually, roughly 1.29 times the overall market rate, as automotive battery management and industrial sensing demand higher accuracy.

Who are the major companies in the Amplifier and Comparator Market?

Texas Instruments, Analog Devices, STMicroelectronics, onsemi, and Microchip Technology lead the market on annual shipment revenue, together holding roughly 48 percent of combined global share.

Which country is growing fastest?

China leads country-level growth given its enormous electronics assembly base and rapidly expanding domestic semiconductor design capability serving automotive and consumer electronics manufacturers nationwide today.

Report Segmentation Architecture

The full report scope spans multiple orthogonal segmentation dimensions, with cross-tabulated demand data provided for each dimension pair. Coverage extends further to regional breakdowns, trend trajectories, and the competitive detail needed to support segment-level decision-making.

By Product Type

  • Standard Operational Amplifiers
  • Instrumentation Amplifiers
  • Differential Amplifiers
  • Programmable Gain Amplifiers
  • Voltage Comparators
  • Power/RF Amplifiers

By End-Use Industry

  • Automotive
  • Industrial Automation
  • Consumer Electronics
  • Medical Devices
  • Telecommunications
  • Aerospace and Defense

By Commercial Dimension

  • Direct Original Equipment Manufacturer Sales
  • Distributor Channel Sales
  • Design-In Engineering Support Services
  • Volume Procurement Contracts

By Region

  • North America
  • Western Europe
  • East Asia
  • South Asia and Pacific
  • Latin America
  • Middle East and Africa
  • Eastern Europe

Scope, Methodology, and Coverage

Every figure in this report is reproducible from documented input assumptions. The scope below maps the historical period, the forecast horizon, the segmentation dimensions, and the countries covered, alongside the underlying primary and qualitative methodology.
Historical Period
2020 to 2025
Forecast Period
2026 to 2036
Base Year
2025 (USD billions; MMA Primary Research Dataset, September 2026)
Market Definition
The amplifier and comparator market covers standard operational amplifiers, instrumentation amplifiers, differential amplifiers, programmable gain amplifiers, voltage comparators, and power or radio frequency amplifiers used in analog signal conditioning applications. It excludes digital signal processors, microcontrollers without integrated analog front ends, and discrete transistor-level amplifier designs not sold as packaged integrated circuits.
Quantitative Units
USD Billion, CAGR (%) 2026-2036
Segmentation Dimensions
Product Type, End-Use Industry, Commercial Dimension, Region
Regions Covered
North America, Western Europe, East Asia, South Asia and Pacific, Latin America, Middle East and Africa, Eastern Europe
Countries Covered
US, Canada, Germany, UK, France, Italy, China, Japan, South Korea, Taiwan, India, Australia, Mexico, Brazil, UAE
Key Companies Profiled
20
Quantitative Methodology
Primary survey, n=3,800 respondents, Q4 2025, six countries; demand-side model with trade association cross-validation
Qualitative Methodology
47 expert interviews, Q4 2025; applied to validate demand model assumptions, identify emerging dynamics, and assess competitive positioning
Report Format
PDF and XLSX data workbook (Word format preview document)
Publisher
Market Minds Advisory
Report Code
MMA-2026-TEC-706
Published
September 2026
Contact
sales@marketmindsadvisory.com | www.marketmindsadvisory.com

Purchase the full Amplifier and Comparator Market Report (2026 to 2036).

The full report delivers a complete strategic assessment of the amplifier and comparator market, spanning detailed segment-level forecasts, regional demand modeling, and competitive benchmarking across the top twenty market participants. It includes proprietary primary survey data covering three thousand eight hundred respondents and forty-seven expert interviews conducted in the fourth quarter of 2025. Buyers receive access to editable data tables alongside the narrative analysis for internal strategic planning use across design engineering, procurement, and product development teams. The analysis is designed to support decisions on supplier qualification, design-in strategy, and capital investment over the coming decade.
Segment level revenue forecasts through the year 2036
Regional market sizing across seven world regions
Competitive benchmarking of twenty key market participants
Editable data tables for internal strategic planning
Primary survey data from 3,800 global respondents
Expert interview insights from 47 industry practitioners

Built For The People Who Decide

From boardroom strategy to bench-side execution, this report is read cover-to-cover by leaders shaping the next decade of their industry, turning demand scenarios, market dynamics and valuation benchmarks into decisions.
CXOs/ Presidents/ VPs/ Managers
M&A and Corporate Development
Strategy Teams and R&D Heads
Procurement and Product Directors
Regulatory and Compliance Leaders
Investor Relations and Equity Analysts