

Market Minds Advisory
Amorphous Metal Cores Market

Amorphous Metal Cores Market: Ribbon-Based Magnetic Cores Across Transformers and Power Electronics, 2026 to 2036

A core that cuts no-load losses by roughly 70% still loses most tenders on purchase price, because the utilities buying transformers rarely pay the electricity bill those transformers generate over thirty years.

Lead Analyst

David Horsley

Published

September 2026

Make Smarter Decisions with Customized Research Insights

Request a free sample report and evaluate market opportunities, growth trends, and competitive dynamics relevant to your business needs.

2025 MARKET VALUE$1.9BMarket Size 2025
2036 FORECAST VALUE$5.0BBase Case , 2026 to 2036
CAGR 2026 TO 20369.2 %Bull 10.5% / Bear 8.1%
INCREMENTAL OPPORTUNITY$2.9BNet 10- year value creation
EXPANSION MULTIPLE2.41x2036 value over 2026 base
Strategic Levers
M&A Pipeline
Regional Outlook
Country Rankings
Competitive Intelligence
Segmental Deep-dive
Call-Us : 91 93563 13602

Executive Snapshot and Market Trajectory

The technical case has been settled for thirty years and the commercial case still is not. An amorphous core cuts transformer no-load loss by roughly 70% against grain-oriented silicon steel, and it costs more to buy. Whether that trade works depends on who pays the electricity bill afterwards.
Growth concentrates in nanocrystalline wound cores, expanding at 13.8%, pulled along by electric vehicle onboard chargers, common-mode chokes and high-frequency converters rather than by transformer demand at all. East Asia holds 38% of value, well outside the usual regional band applied elsewhere, because ribbon casting capacity and amorphous distribution transformer installation are both concentrated there to a degree that simply has no parallel in other electrical materials.
Five participants control 68% of core tonnage shipped, and that concentration traces back to a single upstream constraint: melt-spun ribbon casting is difficult, capital-intensive and dominated by very few producers. Competition runs on ribbon access and annealing yield rather than on core geometry, which any competent winder produces to specification. Efficiency mandates in India, China and Japan are what finally turn a long-standing technical advantage into an actual purchase order somebody signs.
Market Definition
The market comprises magnetic cores manufactured from rapidly solidified amorphous alloy ribbon and from nanocrystalline ribbon derived from amorphous precursors, supplied as finished wound, cut, stacked or composite cores to transformer builders, power electronics manufacturers and motor producers. Sizing captures core revenue at realised delivered price, including captive production at transfer value. Amorphous alloy ribbon sold as raw material, grain-oriented and non-oriented silicon steel cores, ferrite and powdered iron cores, finished transformers, and the windings, tanks and assemblies built around a core fall outside scope.
Base Year Value
$1.9B in 2025 (MMA Primary Research Dataset, August 2026)
Forecast Period
2026 to 2036, eleven discrete annual values
CAGR
9.2% base case. Bull 10.5%. Bear 8.1%.
Fastest Growth Segment
Nanocrystalline Wound Cores: 13.8% CAGR
Fastest Growth Country
India: 11.6% CAGR
Fastest Growth Region
South Asia and Pacific: 11.4% CAGR
Largest Region
East Asia: 38% of 2025 global value
Market Leaders
Proterial, Advanced Technology and Materials, Qingdao Yunlu Advanced Materials, VACUUMSCHMELZE, Magnetec. Source: MMA Analysis based on company annual reports.
Primary Survey
n=3,800 procurement and R&D decision-makers, Q4 2025, six countries
Methodology
Demand-side build-up, cross-validated against public data, 47 expert interviews

Amorphous Metal Cores Market Forecast Scenarios

amorphous-metal-cores-market-trends-size-forecast-scenario-1787310256785
Growth of 7.9% across 2020 to 2025 came from two separate places that had nothing to do with each other. Indian and Chinese distribution transformer efficiency rules pulled amorphous cut cores into utility procurement at volumes the industry had waited decades for. Meanwhile nanocrystalline cores found an entirely new home in electric vehicle power electronics, a demand nobody in the transformer business had modelled.
The base case at 9.2% rests on three mechanisms. Minimum energy performance standards for distribution transformers keep tightening across India, China, Japan and increasingly the European Union, and amorphous cores are the cheapest route to compliance at the top efficiency tiers. Electric vehicle charging electronics keep growing, carrying nanocrystalline core content per vehicle. And grid replacement programmes across ageing distribution networks put transformers into procurement cycles where whole-life cost is finally being evaluated properly.
The bull case at 10.5% turns on European ecodesign rules moving to a tier that silicon steel cannot economically reach, which would open a market amorphous has never properly penetrated. The bear case at 8.1% turns on ribbon supply. Casting capacity expands slowly, and a shortage would ration growth regardless of how strong the demand case becomes.

What Governs Amorphous Core Economics

Everything upstream of the core determines what happens downstream of it. Ribbon accounts for 64% of finished core cost, and ribbon casting is a genuinely difficult process: molten alloy is quenched on a spinning wheel at roughly a million degrees per second to prevent crystallisation, and the resulting foil is 25 microns thick and brittle. Very few producers can do it consistently at scale, and 58% of world output comes from a single country.
TOP FIVE SHARE68%Concentration of core tonnage shipped across the largest producers
AMORPHOUS RIBBON PRICEUSD 4.60 per kgDelivered price per kilogram of cast amorphous alloy ribbon
CORE LOSS REDUCTION70%No-load loss reduction against conventional grain-oriented silicon steel
RIBBON COST SHARE64%Alloy ribbon share of finished core cost of goods
TOP PRODUCER SHARE58%Share of global ribbon output from the leading producing country
CORE ANNEALING YIELD91%First-pass yield through magnetic field annealing and finishing operations
That upstream concentration explains a competitive structure that looks strange from the outside. Winding, cutting and stacking cores is not hard, and dozens of regional fabricators do it competently. Access to ribbon on reliable terms is hard, which is why the five largest core producers hold 68% of tonnage and most of them cast their own ribbon rather than buying it.
Annealing is the other technical gate. Cores must be heat treated in a magnetic field to develop their magnetic properties, and first-pass yield runs around 91% across the industry. The brittleness of annealed ribbon means handling losses continue after the furnace, which is where inexperienced fabricators quietly lose a great deal of money without ever recording it properly.
"The industry has spent three decades explaining that amorphous cores pay back in eight years, to buyers who are measured on capital cost this quarter. The mandates worked where the arithmetic never did, which tells you something uncomfortable about how utility procurement actually functions."
Director, Grid Equipment and Magnetic Materials Practice · MMA Energy / Electric

Market Trends

Electric Vehicle Electronics Pull Nanocrystalline Cores Into Volume

Nanocrystalline cores moved from a specialist niche into automotive volume production within about five years, driven by onboard chargers, common-mode chokes and high-frequency DC converters where permeability at switching frequency matters more than anything silicon steel offers. Content runs roughly 0.9 kilograms of nanocrystalline core material per electric vehicle across the relevant modules. This has reordered the industry's growth profile completely: a business built around utility distribution transformers now finds its fastest demand in automotive tier one supply chains, which buy on entirely different qualification cycles and hold quite different quality expectations.
Market Impact: Cuts no-load loss by 70%

Efficiency Mandates Replace Payback Arguments In Procurement

For decades the industry sold whole-life cost calculations to buyers who were funded on capital budgets, and lost. Minimum energy performance standards changed that by removing the choice: India's transformer efficiency levels, China's energy efficiency rules and Japanese top-runner standards now specify loss levels that grain-oriented silicon steel struggles to reach economically at the highest tiers. Roughly 34% of new distribution transformer installations in mandated markets now carry amorphous cores. The commercial lesson is unflattering but useful, since regulation has moved more volume in eight years than three decades of payback analysis achieved.
Market Impact: Runs 41% above previous decade

Market Opportunities and Growth Drivers

Distribution Transformer Efficiency Standards Keep Tightening Globally

India's Bureau of Energy Efficiency star rating levels, China's national efficiency standards and Japanese top-runner rules all specify no-load loss limits that push procurement toward amorphous construction at the upper tiers. The European Union's ecodesign framework is moving in the same direction on a slower schedule. Each tightening step converts a discretionary efficiency purchase into a compliance requirement, which is the only mechanism that has reliably moved volume in this market. Amorphous cores cut no-load loss by roughly 70%, a margin that no incremental silicon steel improvement has ever come close to approaching.
Market Impact: Ribbon is 64% of cost

Grid Replacement Cycles Reach Ageing Distribution Transformer Fleets

Distribution transformers installed through the 1970s and 1980s are reaching end of service life across North America, Western Europe and Japan simultaneously, and utilities replacing them face whole-life cost evaluation rules that did not exist when the originals were bought. Replacement volumes are running roughly 41% above the previous decade's average across mature grids. This matters more than new connection growth, because a replacement decision is evaluated against a known operating history rather than a projected one, and no-load loss over thirty years is far easier to argue when the utility has thirty years of meter data.
Market Impact: Yield sits at 91% first-pass

Market Restraints and Challenges

Ribbon Casting Capacity Constrains Growth Independent Of Demand

Ribbon is 64% of core cost and casting capacity expands in large, slow, capital-intensive increments. The root cause is process difficulty: melt spinning requires quench rates near a million degrees per second, wheel surfaces degrade continuously, and yield depends on process knowledge that takes years to build rather than equipment that can be bought. Commercially this caps growth during demand surges and hands pricing power upstream. Participants are responding with long-term ribbon supply agreements, backward integration into casting where capital permits, and nanocrystalline formulations that use ribbon more efficiently per unit of core performance.
Market Impact: Adds 0.9 kilograms per electric veh

Core Brittleness Raises Fabrication Loss And Handling Cost

Annealed amorphous ribbon is brittle enough that cores can be damaged by handling that would not trouble silicon steel at all. First-pass annealing yield sits at 91%, and losses continue through assembly. The root cause is the material itself: the atomic disorder that delivers low loss also removes the ductility that makes conventional laminations forgiving. The commercial impact falls on fabricators rather than users, compressing margin for anyone without mature handling processes. Mitigation runs through automated handling, resin impregnation of finished cores, and core geometries designed to reduce stress during transformer assembly.
Market Impact: Reaches 34% of mandated installatio
3 additional market trends, 4 additional growth drivers, and 2 additional restraints and challenges are covered in the full report. Contact sales@marketmindsadvisory.com to access the complete intelligence.

Segment CAGR and Growth Architecture

Segmentation follows core construction and ribbon class, which is the dimension that determines casting requirement, annealing process, achievable geometry and realised price together. End-use application cuts across construction types without separating them commercially, since a wound toroidal core serves a charger and a choke identically, so end-use application sits in demand analysis instead of here.
amorphous-metal-cores-market-trends-market-share-analysis-1787310257319

Nanocrystalline Wound Cores

Growing at 13.8%, exactly 1.50 times the market rate, and the reason this market's growth profile no longer resembles the transformer industry it came from. Nanocrystalline ribbon is cast amorphous and then crystallised under controlled annealing into grains a few tens of nanometres across, delivering permeability at switching frequency that no other material class matches at the price. Electric vehicle onboard chargers, common-mode chokes and high-frequency converters absorb most of the output, and content per vehicle runs near 0.9 kilograms across the relevant modules. Automotive qualification cycles are long and demanding, which favours established producers, and the segment carries by some distance the highest realised price per kilogram anywhere in this market.
CAGR 13.8%

Amorphous Toroidal Wound Cores

Expanding at 11.6% on demand from current sensors, instrument transformers, magnetic shielding and industrial power electronics, where the combination of high permeability and low loss justifies a price that transformer procurement would never accept. Toroidal winding is the simplest amorphous geometry to produce and the most forgiving of ribbon brittleness, which broadens the supplier base considerably relative to cut core production. Growth is genuinely diversified across dozens of small applications rather than concentrated in one, which makes the segment unusually stable. Realised pricing holds up well because most of these applications buy on measured magnetic performance rather than through competitive tender, and requalifying a core creates calibration work nobody wants.
CAGR 11.6%
Full segment breakdown across 5 segments available in the complete report.

Regional Architecture and Country Demand Map

Regional value follows two things that happen to coincide: where ribbon is cast, and where efficiency mandates force amorphous construction into transformer procurement. Both are concentrated far more tightly than electricity demand or grid investment would suggest, which distorts the regional picture considerably more than in most electrical equipment markets.

North America

Twenty-two percent of value rests on replacement rather than growth. Distribution transformers installed through the 1970s and 1980s are reaching end of life across United States and Canadian utilities together, and replacement volumes are running well above the previous decade's average. Department of Energy efficiency rules set loss levels that amorphous construction meets comfortably, though silicon steel still wins most tenders on capital cost where the standard permits it. Data centre and industrial power electronics contribute a growing nanocrystalline demand, largely served by imports. Growth of 8.6% is respectable but constrained by an absence of domestic ribbon casting capacity, which leaves every fabricator operating here dependent on Asian supply for material.
Share: 22% | CAGR: 8.6% (2026 to 2036)

Western Europe

Ecodesign regulation moves more slowly here than the industry hoped, and that single fact explains an 18% share in a region with substantial grid investment. Current tier loss limits remain reachable with high-grade silicon steel, so amorphous cores are left competing on the whole-life economics that utility procurement has resisted for thirty years. Nanocrystalline demand tells a different story: German and French power electronics and automotive tier one suppliers buy heavily, and VACUUMSCHMELZE and Magnetec both cast and process domestically. Growth of 7.6% is the slowest of any region. The next ecodesign tightening is the variable that could change this picture quickly, and its timing remains genuinely uncertain even to the participants lobbying on it.
Share: 18% | CAGR: 7.6% (2026 to 2036)
Regional intelligence for 5 additional markets available in the complete report: East Asia, South Asia and Pacific, Latin America, Middle East and Africa, Eastern Europe. Contact sales@marketmindsadvisory.com.
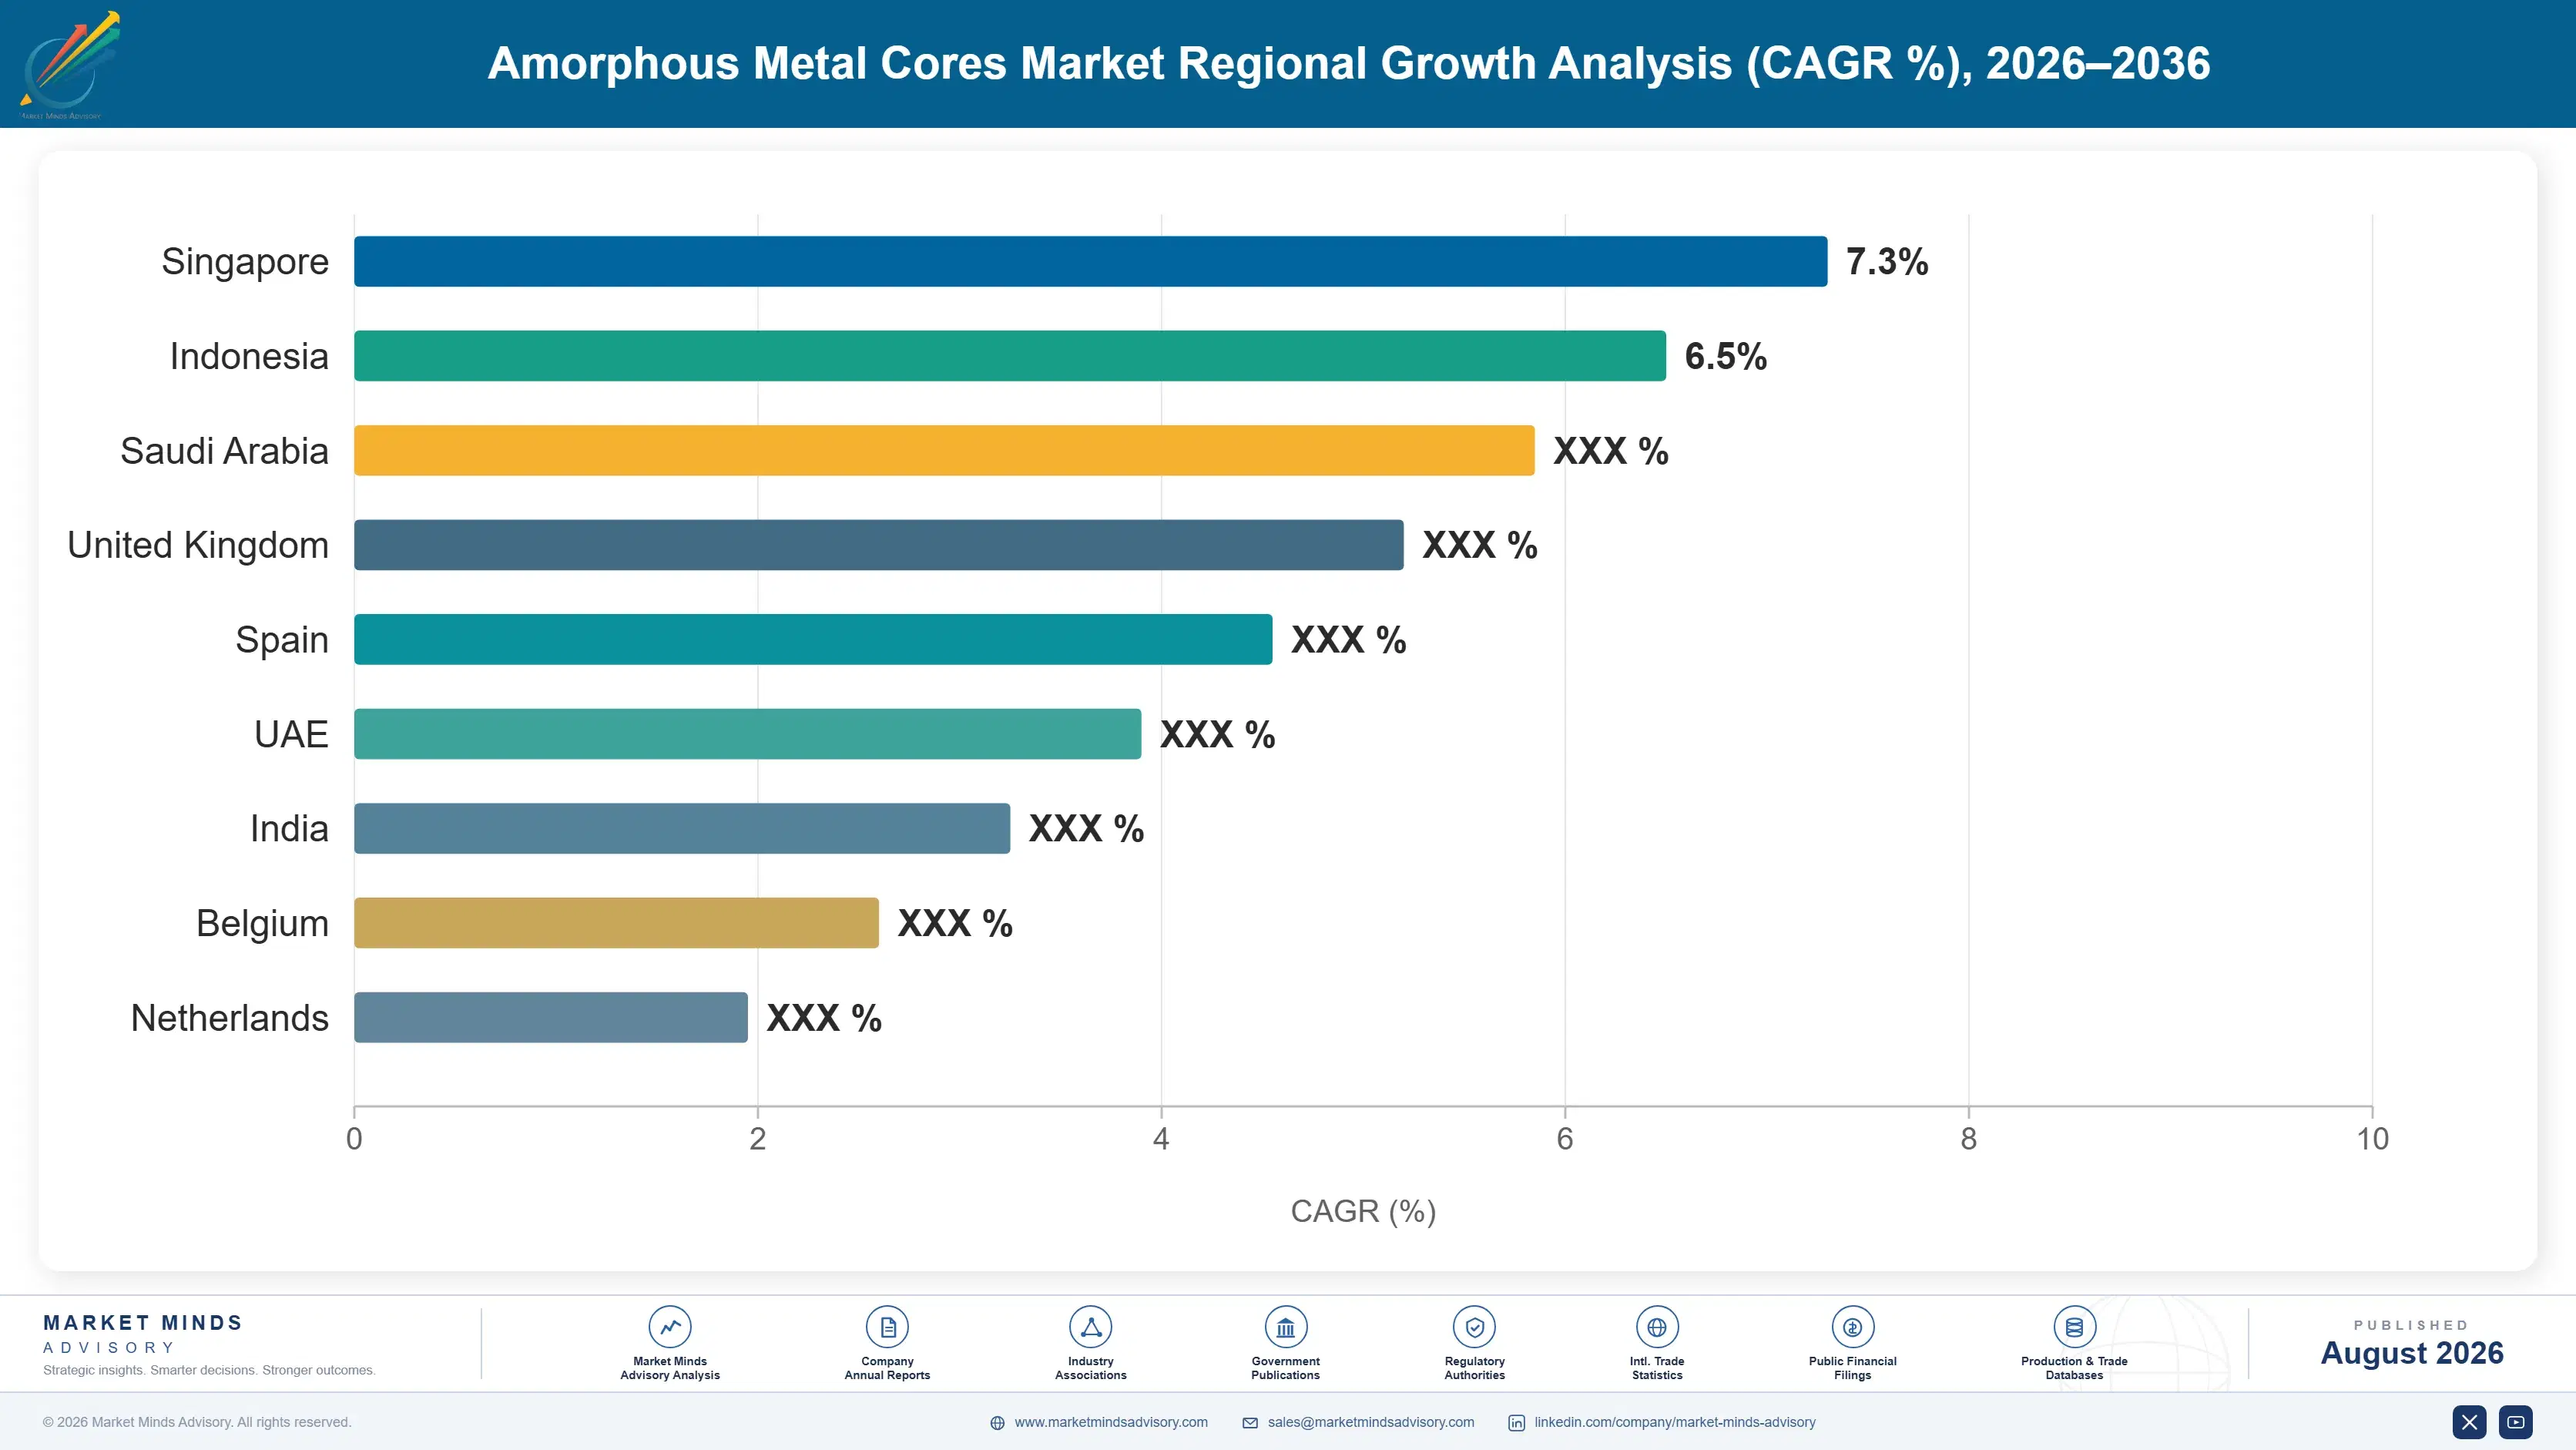
amorphous-metal-cores-market-trends-country-cagr-analysis-1787310257839

Where Core Producers Can Earn More

In a market where ribbon is 64% of cost and casting capacity sits with very few producers, competing on core fabrication price is competing over the smaller part of the value. The margin available sits upstream in ribbon access, downstream in application engineering, and in the yield losses that most fabricators still absorb quietly without measuring them.

Secure Multi-Year Ribbon Supply Before Capacity Tightens

Casting capacity expands in slow, capital-intensive increments while demand grows at 9.2% annually, which guarantees periodic shortage. Fabricators holding contracted multi-year ribbon allocation secure material at roughly 20% below what spot terms cost during a tight period, and more importantly can quote delivery when competitors cannot. Supply reliability wins automotive and utility qualification far more consistently than price does. The commitment looks expensive in a loose market and looks like the only sensible decision anybody made the moment allocation begins. Casting producers serve their own downstream operations first, which is the part fabricators consistently underestimate.
Market Impact: Secures ribbon roughly 20% below sp

Attack Annealing And Handling Yield Systematically

First-pass annealing yield sits at 91% industry-wide and handling losses continue after the furnace, on a material where 64% of the cost is already committed before annealing begins. Every point of yield recovered drops almost entirely to margin. Automated handling, furnace atmosphere control and impregnation of finished cores have together lifted yield by 4 to 6 points at producers who invested properly. The capital involved is modest against the material value being scrapped, and most fabricators have never once quantified what their handling losses actually cost them over a year.
Market Impact: Lifts first-pass yield by 4 to 6 po

Build Automotive Tier One Qualification Capability Deliberately

Nanocrystalline demand grows at 13.8% and sits behind automotive tier one qualification cycles that take two to three years and demand documentation most magnetics fabricators have never produced. That barrier is exactly why realised pricing holds up, with automotive-qualified nanocrystalline commanding roughly 35% above industrial equivalents. Producers treating qualification as a capability to build rather than a hurdle to clear end up capturing the fastest growing demand in this market. Those waiting to be invited will find the qualified supplier list already closed by the time they get round to applying.
Market Impact: Commands roughly 35% above industri

Sell Loss Economics To Whoever Pays The Bill

Three decades of payback arguments failed because they were made to procurement teams funded on capital budgets and measured on nothing else. The same arithmetic works when it reaches the regulator setting efficiency tiers, the utility's asset management function, or the industrial customer paying its own energy bill directly. Producers that redirected technical selling toward those audiences won specification changes worth roughly 25% volume uplift in the markets where they tried it. The analysis itself has not changed in thirty years; who actually hears it is the only variable that ever mattered.
Market Impact: Wins roughly 25% volume uplift wher

Who Controls the Margin Pool

Concentration is high and upstream in origin. The top five participants hold 68% of core tonnage shipped, the basis used throughout this section including captive production, and the gap between Proterial and the challenger group reflects three decades of ribbon casting process knowledge rather than any advantage in core fabrication. Advanced Technology and Materials and Qingdao Yunlu closed much of that distance by building Chinese capacity at scale, which reset global ribbon pricing in the pro
Competition currently runs on three dimensions. Ribbon access decides who can quote at all, since fabrication without secured supply is not a business. Annealing and handling yield decides who earns anything, on a material where most of the cost is committed upstream. Application engineering decides the growth segments, because automotive and power electronics customers buy a solved problem rather than a component.

Pressure is building from two directions. Chinese producers moving from ribbon supply into finished cores compress fabricator margins in export markets. European specialists hold nanocrystalline positions that automotive qualification protects for now. Rankings shift first in distribution transformer cut cores, where the product is closest to commodity and ribbon access is the only real defence.
amorphous-metal-cores-market-trends-company-positioning-matrix-1787310258361

Competitive Moat and Risk Dimensions

PROTERIAL

Moat: Ribbon casting process knowledge

Three decades of continuous melt spinning experience sit behind the alloy formulations and wheel process control that determine ribbon quality, and none of that transfers with equipment purchase. The company casts its own ribbon and fabricates cores from it, capturing value across both stages. Technical reference status with Japanese and international utilities compounds a position built on genuine process capability.
PROTERIAL

Risk: Chinese capacity and pricing

Chinese ribbon capacity built over the past fifteen years reset global pricing at levels that reward scale over process refinement, and the quality gap has narrowed considerably in that time. Defending premium positioning becomes harder each year as Chinese producers qualify into applications previously closed to them. The nanocrystalline segment offers shelter, but not indefinitely and not in every application.
ADVANCED TECHNOLOGY AND MATERIALS

Moat: Scale and domestic mandate access

Casting capacity built at a scale nobody else attempted, serving a domestic market where efficiency standards mandate amorphous construction in distribution transformers, gives volume economics no competitor can approach. Proximity to Chinese transformer manufacture removes freight and qualification friction entirely. That combination of cost position and captive domestic demand is genuinely difficult to attack from outside the region.
ADVANCED TECHNOLOGY AND MATERIALS

Risk: Concentration in one market

A very large share of demand depends on Chinese distribution transformer procurement and the efficiency standards driving it, which are policy decisions rather than commercial ones. Export expansion faces qualification barriers in automotive and Western utility applications where technical reference status matters. Nanocrystalline positioning in high-frequency applications remains behind the European and Japanese specialists holding those accounts.

Players Tracked

Prominent Players

Proterial
Advanced Technology and Materials
Qingdao Yunlu Advanced Materials
VACUUMSCHMELZE
Magnetec

Other Key Players

Toshiba Materials
TDK Corporation
Sumitomo Electric Industries
JFE Steel
Nippon Steel
POSCO
Tata Steel
Hitachi Energy
Siemens Energy
Schneider Electric
Eaton
Bharat Bijlee
Voltamp Transformers
CG Power and Industrial Solutions
China XD Group

Recent Developments

JUNE 2025

Nanocrystalline core capacity expansion for automotive supply

Additional nanocrystalline ribbon processing and core winding capacity was commissioned to serve electric vehicle onboard charger and common-mode choke demand, with output committed to automotive tier one customers under multi-year supply agreements covering both the qualification phase and the subsequent volume ramp across several vehicle platforms.
Signal: Capacity is now being built against automo
MARCH 2025

Indian utility procurement specifies amorphous distribution transformers

State distribution utilities across India issued procurement tenders specifying amorphous core construction in order to meet the upper Bureau of Energy Efficiency star rating levels, covering substantial multi-year transformer volumes and requiring domestic core fabrication content within the supply arrangements set out in the published tender documents.
Signal: Mandated efficiency tiers keep converting
NOVEMBER 2025

Ribbon supply agreement signed with transformer manufacturer

A multi-year amorphous ribbon supply agreement was concluded between a ribbon casting producer and a distribution transformer manufacturer, securing committed allocation ahead of anticipated capacity tightness and establishing indexed pricing tied to alloy and energy input costs across the full contract period rather than at fixed rates.
Signal: Allocation contracting ahead of shortage i

What Sits Inside Core Cost

Amorphous ribbon accounts for roughly 64% of finished core cost, and within the ribbon itself iron dominates, with boron, silicon and small additions of niobium and copper for nanocrystalline grades. Ferroboron supply is concentrated in China and Turkey, and niobium comes almost entirely from Brazil. Electricity for melt spinning and magnetic field annealing adds around 12% of core cost, and casting is genuinely energy intensive.
Energy and ferroalloy costs moved sharply in 2021 and 2022. Chinese provincial power rationing through the second half of 2021 cut ferroalloy and metallic output across several producing regions, and European industrial electricity prices through 2022 reached levels the IEA documented as unprecedented. VACUUMSCHMELZE and other European processors faced input costs that Asian competitors, buying power at a fraction of those rates, simply did not face.

The competitive disadvantage mechanism runs through electricity price rather than material access. Casting and annealing are both energy intensive, so a producer paying European industrial power rates carries a permanent cost handicap against one buying Chinese or Middle Eastern industrial electricity. That gap does not close through purchasing skill or process efficiency. European and Japanese producers defend position through alloy formulation, application engineering and qualification status instead.
amorphous-metal-cores-market-trends-cost-volatility-analysis-1787310258559

Index ribbon supply contracts to alloy and energy benchmarks

Indexation against published ferroalloy and industrial electricity series shares the volatility between caster and fabricator rather than concentrating all of it at one end of the chain. Customers resist indexation in tender and accept it at renewal, which means the agreements carrying it were generally negotiated at the right moment rather than by whoever bargained hardest in the room.

Recover and reprocess annealing and handling scrap

Brittle ribbon generates scrap that carries full alloy and casting cost, and recovering it into the melt reduces effective material consumption meaningfully. The economics are entirely straightforward at a 64% material cost share. Most fabricators handle scrap as waste rather than as a recoverable input, which is a habit inherited directly from conventional silicon steel practice.

Site annealing capacity where industrial power is cheapest

Magnetic field annealing runs long furnace cycles and consumes electricity accordingly, so the choice of location decides a genuinely meaningful part of delivered cost. Producers with a choice about where to site finishing capacity capture a permanent advantage that competitors in high-tariff regions cannot match through any amount of process improvement, scale or purchasing discipline.

Portfolio Architecture for Margin Defence

Margin architecture separates cleanly by how far a core sits from commodity tender. Distribution transformer cut cores earn what utility procurement allows once ribbon cost is covered, which is not much, and the participants competing there are competing on ribbon access rather than on anything they add. Value rises with application engineering content and qualification difficulty rather than with tonnage, which is the opposite of how the industry was structured for its first twenty years.
The volume versus premium tension is unusually stark. Transformer cores carry the tonnage that justifies casting capacity and keeps furnaces loaded, at margins that cannot fund development. Nanocrystalline automotive and power electronics cores carry the margin on a fraction of the mass. A producer chasing tonnage funds a capital-intensive operation from a shrinking premium base, which is visible now across several mid-sized fabricators without casting capability.

High-value pools concentrate in three places. Automotive-qualified nanocrystalline cores command price because qualification takes years and the supplier list closes. Current sensing and instrument transformer cores earn on performance rather than through tender. And ribbon casting itself captures the majority of value in every core sold, whoever fabricates it.

Volume / Commodity-Adjacent Tier

Distribution transformer cut cores and stacked block cores sold into utility tender against ribbon cost that the fabricator does not control. Tonnage justifies capacity utilisation while contributing very little to margin recovery.
Gross Margin: 14-21%

Premium / Certified Tier

Amorphous toroidal wound cores for current sensing, instrument transformers and industrial power electronics, bought on measured performance rather than through competitive tender. The seven-point range reflects standard against custom geometry work.
Gross Margin: 27-34%

Sustainability / Regulatory / Next-Generation Tier

Automotive-qualified nanocrystalline cores for onboard chargers and high-frequency converters, where qualification cycles and documentation requirements close the supplier list. Documentation and process audit requirements defend pricing here. The nine-point range reflects qualified programmes against developmental ones.
Gross Margin: 38-47%
amorphous-metal-cores-market-trends-portfolio-architecture-1787310259056

High-value Sub-segments and Strategic Watch-out

Automotive-qualified nanocrystalline cores

High value and high growth together, because electric vehicle power electronics demand grows at 13.8% while automotive qualification cycles running two to three years keep the supplier list effectively closed to newcomers. Content near 0.9 kilograms per vehicle across the relevant modules makes this demand unusually forecastable.
Gross Margin: 38-47%

Current sensing and instrument transformer cores

Strong realised value on moderate growth, protected because these applications buy measured magnetic performance rather than tendered price and because switching a qualified core creates calibration work nobody wants. Demand is diversified across many small applications, which makes the segment unusually stable through a cycle.
Gross Margin: 27-34%

Distribution transformer cut core tonnage

The volume core, growing with efficiency mandates and earning very little at all once ribbon cost is covered by whoever fabricates it. Necessary to justify casting capacity utilisation, but no fabricator without upstream integration should now expect this particular tier to fund any development work.
Gross Margin: 14-21%

Ribbon casting capacity ownership

The strategic watch-out, because fully 64% of core value sits upstream of fabrication and casting capacity expands far too slowly to follow demand growth. Fabricators without secured allocation will be rationed during the next tight period regardless of how strong their customer relationships happen to be.
Gross Margin: 22-41%

How Core Demand Actually Behaves

Demand here is programme-locked rather than transactional. A transformer design qualified around a specific core geometry runs for years without change, an automotive charger module carries its core through the vehicle platform's life, and requalifying either costs far more than any price difference between suppliers. Winning a design is expensive and slow; holding it costs almost nothing. That asymmetry is why producers defend qualified positions with an intensity that unit margins alone would
Stickiness varies considerably by application. Distribution transformer cut cores are the loosest, retendered regularly against generic loss specifications where any qualified fabricator can bid. Industrial power electronics sits in the middle, with switching performance creating real requalification cost. Automotive nanocrystalline is stickiest of all, where tier one documentation, process audits and change control make substitution a multi-year project that nobody undertakes without a serious reason.

The buyer profile has shifted in a way the transformer industry did not anticipate. A decade ago the customer was a utility procurement engineer evaluating loss guarantees. Today a growing share of value sits with automotive tier one purchasing and power electronics design engineers, who qualify on switching behaviour and audit process control rather than on thirty-year loss economics.
amorphous-metal-cores-market-trends-end-use-penetration-index-1787310259551

Where We Land On This

These are among the four positions where our research anticipates prominent divergence between winners and laggards over the coming forecast period. Each is grounded in the demand model, the regulatory perimeter, and the announced capacity pipeline.
01 / UPSTREAM SUPPLY SECURITY

Contract ribbon allocation well before capacity tightens

Ribbon accounts for 64% of finished core cost, and casting capacity expands in slow capital-intensive increments against demand growing at 9.2% annually, which makes periodic shortage close to arithmetic certainty. Fabricators holding contracted multi-year allocation secure material at roughly 20% below spot during tight periods and, more valuably, can quote delivery when competitors cannot. The commitment looks expensive in a loose market and looks entirely obvious the moment allocation actually begins, which is the wrong point to start negotiating it.
02 / YIELD RECOVERY DISCIPLINE

Treat annealing and handling yield as margin recovery

First-pass annealing yield sits at 91% across the industry and handling losses continue afterwards, on a material where nearly two thirds of the cost is already committed before the furnace door closes. Every yield point recovered drops almost entirely through to margin, and automated handling combined with furnace atmosphere control has lifted yield 4 to 6 points where producers invested properly. Most fabricators have never once quantified what their handling scrap actually costs them over a full year of production.
03 / AUTOMOTIVE QUALIFICATION CAPABILITY

Build tier one qualification capability before being asked

Nanocrystalline demand grows at 13.8% behind automotive qualification cycles running two to three years, with documentation and process audit requirements that most magnetics fabricators have never once had to produce for any customer. That barrier is precisely why automotive-qualified nanocrystalline commands roughly 35% above industrial pricing today, and precisely why it keeps commanding it. Producers waiting politely for an invitation will find the approved supplier list already closed by the time they submit a first application, and reopening one is rare.
04 / REGULATORY AUDIENCE REDIRECTION

Take loss economics to regulators rather than procurement

Three decades of whole-life cost arguments failed because they were addressed to buyers funded on capital budgets who were never measured on operating cost at all. The same analysis works when it reaches efficiency regulators, utility asset management functions or industrial customers paying their own electricity, and the producers who redirected their technical selling that way won roughly 25% volume uplift for the effort. The arithmetic itself has not changed in thirty years; only the choice of audience ever really mattered.

Engagement Snapshot From the Field

A live engagement with an industry participant carrying material or product regulatory and market exposure ahead of a defining policy shift, showing how our research translates into a defensible multi-year portfolio strategy.
MARKET MINDS ADVISORY · CLIENT ENGAGEMENT SUMMARY
Amorphous Metal Cores Producer Strategic Portfolio Review and Transition Roadmap 2026·Investment Scenario on Amorphous Metal Cores Exposure Evaluation 2025-26
CLIENT PROFILE
A magnetic core fabricator operating three winding and annealing sites across Europe and South Asia, supplying distribution transformer cut cores alongside a smaller toroidal and nanocrystalline business. Core revenue approached EUR 140 million annually (client-reported, unverified by MMA), roughly three quarters of it in transformer cut cores, and the business held no ribbon casting capability of its own at any site.
STRATEGIC CHALLENGE
Management planned to expand winding capacity to capture Indian efficiency mandate volume, on the assumption that fabrication capacity was the binding constraint. Ribbon procurement had become difficult during recent tight periods but was treated as a purchasing issue. Nobody had tested whether new winding lines could actually be supplied with material.
MMA APPROACH
MMA interviewed forty-seven casting producers, transformer manufacturers and utility procurement engineers across four markets, reconstructing how ribbon allocation is decided during tightness. We modelled delivered core cost by site including energy tariffs, quantified annealing and handling yield against benchmarks, and assessed the client's exposure under three separate ribbon availability scenarios across the forecast period.
KEY FINDINGS
  1. Ribbon allocation during the last tight period went to fabricators holding multi-year agreements and to casting producers' own downstream operations, with spot buyers served only after both.
  2. The client's first-pass annealing yield ran at 86% against a benchmark of 91%, and handling losses after annealing added a further three points that nobody had ever measured.
  3. European site energy tariffs made cut core fabrication there permanently uncompetitive against Asian supply, regardless of any yield or throughput improvement the client could achieve.
  4. Nanocrystalline revenue delivered a substantially higher gross margin than transformer cut cores (client-reported, unverified by MMA) on under a tenth of the tonnage shipped.
CLIENT PROFILE
A magnetic core fabricator operating three winding and annealing sites across Europe and South Asia, supplying distribution transformer cut cores alongside a smaller toroidal and nanocrystalline business. Core revenue approached EUR 140 million annually (client-reported, unverified by MMA), roughly three quarters of it in transformer cut cores, and the business held no ribbon casting capability of its own at any site.
STRATEGIC CHALLENGE
Management planned to expand winding capacity to capture Indian efficiency mandate volume, on the assumption that fabrication capacity was the binding constraint. Ribbon procurement had become difficult during recent tight periods but was treated as a purchasing issue. Nobody had tested whether new winding lines could actually be supplied with material.
MMA APPROACH
MMA interviewed forty-seven casting producers, transformer manufacturers and utility procurement engineers across four markets, reconstructing how ribbon allocation is decided during tightness. We modelled delivered core cost by site including energy tariffs, quantified annealing and handling yield against benchmarks, and assessed the client's exposure under three separate ribbon availability scenarios across the forecast period.
KEY FINDINGS
  1. Ribbon allocation during the last tight period went to fabricators holding multi-year agreements and to casting producers' own downstream operations, with spot buyers served only after both.
  2. The client's first-pass annealing yield ran at 86% against a benchmark of 91%, and handling losses after annealing added a further three points that nobody had ever measured.
  3. European site energy tariffs made cut core fabrication there permanently uncompetitive against Asian supply, regardless of any yield or throughput improvement the client could achieve.
  4. Nanocrystalline revenue delivered a substantially higher gross margin than transformer cut cores (client-reported, unverified by MMA) on under a tenth of the tonnage shipped.
RECOMMENDED STRATEGY
Phase 1: Phase 1 (0 to 9 months): Halt the winding capacity expansion and negotiate multi-year ribbon allocation before committing any further fabrication capital. Phase 2: Phase 2 (9 to 24 months): Rebuild annealing and handling yield toward benchmark, and consolidate cut core fabrication into the lowest energy tariff site. Phase 3: Phase 3 (24 to 42 months): Pursue automotive nanocrystalline qualification deliberately, funded by the capital released from the cancelled expansion.
OUTCOME
The client cancelled roughly EUR 30 million of planned winding capacity (client-reported, unverified by MMA) and secured a multi-year ribbon agreement instead. First-pass yield recovered to benchmark within a year, European cut core fabrication was consolidated, and the first automotive nanocrystalline qualification programme opened eighteen months into the engagement.

Frequently Asked Questions

Foundational context covering the market sizes, CAGR, scope, country, region and competition that inform every finding below. This section is provided to cover basics and most often pre-purchase conversations, answered from the MMA Primary Research Dataset.

What is the current size of the Amorphous Metal Cores Market?

The market reached USD 1.9 billion in 2025, measured as finished core revenue at realised delivered price including captive production. Distribution transformer cores account for the largest share of tonnage.

How large will the Amorphous Metal Cores Market be by 2036?

MMA forecasts USD 4.99 billion by 2036, an expansion of 2.41 times the 2026 level. Incremental value across the forecast period reaches USD 2.92 billion.

What is the CAGR for the Amorphous Metal Cores Market 2026 to 2036?

The base case compound annual growth rate is 9.2%, with a bull case of 10.5% and a bear case of 8.1%. European ecodesign tightening and ribbon casting capacity separate those scenarios.

Which segment is growing fastest?

Nanocrystalline wound cores grow fastest at 13.8%, exactly 1.50 times the overall market rate. Electric vehicle onboard chargers and high-frequency converters are driving that demand.

Who are the major companies in the Amorphous Metal Cores Market?

Proterial, Advanced Technology and Materials, Qingdao Yunlu Advanced Materials, VACUUMSCHMELZE and Magnetec lead, holding 68% of core tonnage between them. Ribbon casting capability rather than fabrication scale explains that concentration.

Which country is growing fastest?

India grows fastest at 11.6%, driven by Bureau of Energy Efficiency star rating levels that make amorphous construction the practical route to upper efficiency tiers. State utility procurement has specified it at substantial volumes.

Report Segmentation Architecture

The full report scope spans multiple orthogonal segmentation dimensions, with cross-tabulated demand data provided for each dimension pair. Coverage extends further to regional breakdowns, trend trajectories, and the competitive detail needed to support segment-level decision-making.

By Core Construction and Ribbon Class

  • Nanocrystalline Wound Cores
  • Amorphous Toroidal Wound Cores
  • Distribution Transformer Cut Cores
  • Stacked and Block Cores
  • Amorphous Powder Composite Cores

By End-Use Industry

  • Electric Utilities and Grid Operators
  • Automotive and Electric Vehicle Manufacturing
  • Industrial Power Electronics
  • Renewable Generation and Storage
  • Rail Traction and Heavy Equipment

By Customer Type and Sales Model

  • Transformer Original Equipment Manufacturers
  • Automotive Tier One Suppliers
  • Power Electronics Module Builders
  • Utility Direct Procurement
  • Magnetics Distributors and Component Resellers

By Region

  • North America
  • Western Europe
  • East Asia
  • South Asia and Pacific
  • Latin America
  • Middle East and Africa
  • Eastern Europe

Scope, Methodology, and Coverage

Every figure in this report is reproducible from documented input assumptions. The scope below maps the historical period, the forecast horizon, the segmentation dimensions, and the countries covered, alongside the underlying primary and qualitative methodology.
Historical Period
2020 to 2025
Forecast Period
2026 to 2036
Base Year
2025 (USD billions; MMA Primary Research Dataset, August 2026)
Market Definition
The market comprises magnetic cores manufactured from rapidly solidified amorphous alloy ribbon and from nanocrystalline ribbon derived from amorphous precursors, spanning nanocrystalline wound cores, amorphous toroidal wound cores, distribution transformer cut cores, stacked and block cores, and amorphous powder composite cores. Sizing captures finished core revenue at realised delivered price, including captive production valued at transfer price. Amorphous ribbon sold as raw material, grain-oriented and non-oriented silicon steel cores, ferrite and powdered iron cores, finished transformers, windings, tanks and assembled equipment fall outside scope.
Quantitative Units
USD billions (current prices); core tonnage shipped annually; USD per kilogram of finished core at delivered price
Segmentation Dimensions
By Core Construction and Ribbon Class; By End-Use Industry; By Customer Type and Sales Model; By Region
Regions Covered
North America, Western Europe, East Asia, South Asia and Pacific, Latin America, Middle East and Africa, Eastern Europe
Countries Covered
USA, Canada, Mexico, UK, Germany, France, Italy, Spain, Netherlands, Sweden, Switzerland, Poland, Czech Republic, Hungary, Turkey, China, Japan, South Korea, Taiwan, India, Vietnam, Thailand, Indonesia, Australia, Brazil, Argentina, Chile, Saudi Arabia, UAE, South Africa, and additional markets relevant to this sector
Key Companies Profiled
Proterial, Advanced Technology and Materials, Qingdao Yunlu Advanced Materials, VACUUMSCHMELZE, Magnetec, Toshiba Materials, TDK Corporation, Sumitomo Electric Industries, JFE Steel, Nippon Steel, POSCO, Tata Steel, Hitachi Energy, Siemens Energy, Schneider Electric, Eaton, Bharat Bijlee, Voltamp Transformers, CG Power and Industrial Solutions, China XD Group.
Quantitative Methodology
Primary survey, n=3,800 respondents, Q4 2025, six countries; demand-side model with trade association cross-validation
Qualitative Methodology
47 expert interviews, Q4 2025; applied to validate demand model assumptions, identify emerging dynamics, and assess competitive positioning
Report Format
PDF and XLSX data workbook (Word format preview document)
Publisher
Market Minds Advisory
Report Code
MMA-2026-ENE-396
Published
August 2026
Contact
sales@marketmindsadvisory.com | www.marketmindsadvisory.com

Purchase the full Amorphous Metal Cores Market Report (2026 to 2036).

The full report sizes the amorphous metal cores market across five core constructions, five end-use industries, five customer types and seven regions, with annual forecasts to 2036 in revenue and core tonnage shipped. It models delivered core cost by production site including energy tariffs and ribbon terms, which is the analysis that establishes where each fabricator is genuinely competitive. Twenty participants are assessed on a consistent core tonnage shipped basis including captive output, with ribbon casting capability mapped separately from fabrication capacity. Annealing and handling yield is benchmarked site by site across the industry.
Five core constructions sized and forecast annually
Delivered core cost modelled by site and energy tariff
Twenty participants on consistent core tonnage shipped basis
Ribbon casting capability mapped separately from fabrication capacity
Annealing and handling yield benchmarked across producing sites
Efficiency mandate schedules tracked across every regulated market

Built For The People Who Decide

From boardroom strategy to bench-side execution, this report is read cover-to-cover by leaders shaping the next decade of their industry, turning demand scenarios, market dynamics and valuation benchmarks into decisions.
CXOs/ Presidents/ VPs/ Managers
M&A and Corporate Development
Strategy Teams and R&D Heads
Procurement and Product Directors
Regulatory and Compliance Leaders
Investor Relations and Equity Analysts