Market Minds Advisory
Americas Seeds Market

Americas Seeds Market: Trait Royalties, Saved Seed Leakage, and the Gene Editing Divergence Redrawing Breeding Economics

Roughly a third of what an American grower pays for maize seed buys technology rather than germplasm, and Argentine saved-seed practice shows exactly what happens when that royalty cannot be collected.

Lead Analyst

Lisa Gevelber

Published

September 2026

Make Smarter Decisions with Customized Research Insights

Request a free sample report and evaluate market opportunities, growth trends, and competitive dynamics relevant to your business needs.

2025 MARKET VALUE$58.4BMarket Size 2025
2036 FORECAST VALUE$113.2BBase Case , 2026 to 2036
CAGR 2026 TO 20366.2 %Bull 7.5% / Bear 4.9%
INCREMENTAL OPPORTUNITY$51.2BNet 10- year value creation
EXPANSION MULTIPLE1.83x2036 value over 2026 base
Strategic Levers
M&A Pipeline
Regional Outlook
Country Rankings
Competitive Intelligence
Segmental Deep-dive
Call-Us : 91 93563 13602

Executive Snapshot and Market Trajectory

A bag of maize seed is mostly a licence agreement. Roughly 31% of what a grower pays covers trait technology rather than the genetics in the bag, and that share explains why this industry consolidated to five players and why royalty collection, not breeding skill, decides who earns where.
Commercial power in the Americas sits with whoever can enforce technology payment. Brazilian adoption of stacked herbicide and insect traits is close to universal and collection works reasonably well, while Argentine soybean plantings run heavily on farmer-saved seed that pays nothing. Vegetable seed grows fastest at 8.9%, roughly 1.44 times the market, on hybrid penetration and protected cropping. North America holds 32% of global value.
Concentration is high, with the top five holding roughly 58% of commercial seed value following a decade of consolidation that left Bayer, Corteva, Syngenta, BASF, and Limagrain facing each other across cross-licensed trait portfolios. Regulation is now diverging sharply rather than converging: the United States, Canada, Brazil, and Argentina treat most gene-edited crops as conventional, while European approval remains slow. That divergence is pulling breeding programmes westward. Nobody in the industry is waiting for Brussels.
Market Definition
This report covers commercial seed sold to growers, spanning maize, soybean, cereal and rice, oilseed and fibre, vegetable, and forage and turf seed, valued at grower purchase price including embedded trait royalties and applied seed treatment. Commercial coverage centres on North and South American demand with global supply and pricing context. Farmer-saved and informally traded seed, crop protection chemistry sold separately, fertilisers, digital agronomy subscriptions, and planting equipment fall outside scope.
Base Year Value
$58.4B in 2025 (MMA Primary Research Dataset, August 2026)
Forecast Period
2026 to 2036, eleven discrete annual values
CAGR
6.2% base case. Bull 7.5%. Bear 4.9%.
Fastest Growth Segment
Vegetable Seed: 8.9% CAGR
Fastest Growth Country
Brazil: 7.8% CAGR
Fastest Growth Region
South Asia and Pacific: 8.2% CAGR
Largest Region
North America: 32% of 2025 global value
Market Leaders
Bayer Crop Science, Corteva Agriscience, Syngenta Group, BASF, Limagrain. Source: MMA Analysis based on company annual reports.
Primary Survey
n=3,800 procurement and R&D decision-makers, Q4 2025, six countries
Methodology
Demand-side build-up, cross-validated against public data, 47 expert interviews

Americas Seeds Market Forecast Scenarios

americas-seeds-market-2024-2034-trends-size-forecast-scenario-1787462304913
The 2020 to 2025 period rewarded pricing power more than volume. Planted area across the Americas moved within a narrow band while seed prices rose steadily on trait stacking and input cost pass-through, and Brazilian expansion supplied most of the genuine acreage growth. Regulatory disruption punctuated the run, most visibly when American courts vacated dicamba registrations during 2024. The 5.1% historical growth was almost entirely price and mix.
The 6.2% base case rests on three mechanisms. Trait stacking keeps adding technology value per hectare as insect resistance, herbicide tolerance, and increasingly drought and disease traits combine in single events. Brazilian and Paraguayan soybean and second-crop maize area keeps expanding, adding hectares that Northern Hemisphere markets no longer supply. And vegetable seed keeps shifting toward high-value hybrids under protected cropping across Mexico, the United States, and Canada, where per-hectare seed spend is far higher.
The 7.5% bull case assumes gene-edited traits reach commercial launch quickly under permissive American regulation, adding value without the cost of transgenic approval. The 4.9% bear case reflects grain price weakness cutting input spend, alongside continued saved-seed leakage in Argentina and parts of Brazil that removes royalty revenue permanently. Enforcement, not agronomy, separates the two.

Why Traits, Not Germplasm, Set Price

Three forces set outcomes in this market and germplasm quality is only one of them. Trait technology determines what a grower will pay, because insect and herbicide traits translate directly into fewer passes and lower crop protection spend. Royalty enforceability then determines whether the seed company collects, which differs enormously between Iowa and Santa Fe province. And regulatory divergence on gene editing determines where the next generation of traits gets developed.
TOP-FIVE CONCENTRATION58%Share of global commercial seed value held collectively
AVERAGE SEED COST$118/hectareBlended per-hectare seed spend across major row crops
TRAIT ROYALTY SHARE31%Portion of maize and soybean seed price representing technology
FARMER-SAVED SEED RATE38%Share of soybean plantings using non-commercial saved seed
HYBRID PENETRATION74%Proportion of vegetable plantings using hybrid rather than open-pollinated
RESEARCH INTENSITY12%Share of seed revenue reinvested into breeding and biotechnology
The commercial character is closer to pharmaceutical licensing than to agricultural supply. Cross-licensing agreements mean competitors sell each other's traits inside their own germplasm, so a grower choosing between brands is often choosing between breeding programmes wrapped around identical technology. That makes agronomic performance, local yield trial data, and dealer relationships the real battleground. It also means trait developers earn from competitors' sales, which softens rivalry in ways that look odd from outside.
The next decade turns on gene editing. American, Canadian, Brazilian, and Argentine regulators treat most edited crops as conventional if no foreign DNA remains, which cuts development cost and timeline dramatically against transgenic events. European approval remains slow and contested. Breeding programmes are relocating accordingly, and the Americas are the principal beneficiary of that shift.
"Argentina proves the whole thesis by counterexample. Same growers, same agronomy, same genetics available, and a fraction of the seed revenue per hectare, purely because nobody can make the royalty stick."
Director, Crop Inputs and Seed Technology Practice · MMA Crop Inputs / Seed and Plant Genetics Practice · August 2026

Market Trends

Gene Editing Regulation Diverges Sharply Between Americas and Europe

The American SECURE rule exempts many gene-edited plants from biotechnology regulation where the change could have arisen through conventional breeding, and Canada, Brazil, Argentina, and Chile apply comparable case-by-case exemptions through their national biosafety bodies. Development timelines fall from over a decade to a few years, and cost drops by an order of magnitude against transgenic events. European approval remains slow while new genomic technique proposals work through legislative process. Breeding programmes and field trial capacity are relocating toward the Americas as a direct consequence, which compounds the region's existing advantage.
Market Impact: Adds 2.1 million hectares annually
Trait Stacking Raises Technology Value Per Hectare Steadily

Commercial maize events now routinely combine multiple insect resistance proteins with tolerance to two or three herbicide modes of action, and soybean stacks have followed the same path through Intacta and Enlist platforms across Brazil and the United States. Each additional trait adds a royalty layer, and growers accept it because the alternative is more crop protection passes at higher cost and greater weather risk. Refuge requirements and resistance management obligations travel with the technology. Value per hectare rises without any increase in planted area, which is precisely why seed pricing outruns acreage.
Market Impact: Costs 40x row crop seed

Market Opportunities and Growth Drivers

South American Acreage Expansion Adds Genuinely New Hectares

Brazilian soybean area has expanded relentlessly across Mato Grosso, Goias, and the Matopiba frontier, and second-crop maize following soybean has become standard practice across the centre-west, effectively doubling seed demand per hectare of land. Paraguayan and Bolivian expansion follows the same pattern at smaller scale. Northern Hemisphere acreage has been flat for years, so this is where volume growth actually comes from. Seed companies with Brazilian breeding stations, local germplasm adapted to tropical conditions, and established dealer networks capture that growth; those serving it from temperate programmes do not. Temperate germplasm simply does not perform at those latitudes.
Market Impact: Removes 38% of potential royalty

Protected Vegetable Cropping Lifts Per-Hectare Seed Spend

Greenhouse and shade-house tomato, pepper, and cucumber production across Sinaloa, Baja California, Ontario, and the American Southwest uses hybrid seed at costs per hectare an order of magnitude above row crops, because a single protected hectare generates revenue that justifies premium genetics. Disease resistance packages, grafting rootstocks, and shelf-life traits all command separate premiums. Mexican protected area has grown consistently, supplying North American winter retail demand. Vegetable seed therefore grows at 8.9% while contributing modest tonnage, which makes it the most attractive volume-to-value ratio in the market. No row crop segment approaches that value density anywhere.
Market Impact: Stranded 20 million treated hectares

Market Restraints and Challenges

Farmer-Saved Seed Removes Royalty Revenue in South America

Argentine soybean plantings run heavily on saved and informally traded seed, and a meaningful share of Brazilian and Paraguayan area does the same, which means the technology is used while the royalty is never collected. The root cause is legal: Argentina's seed law has stalled repeatedly in congress, leaving breeders' rights weaker than in North America and enforcement impractical across thousands of farms. Companies respond with point-of-delivery royalty collection at grain elevators, with technology use agreements enforced through grain buyers, and by holding new traits back from markets where payment cannot be secured.
Market Impact: Cuts development timelines by 60%

Herbicide Registration Instability Disrupts Trait Platform Value

A trait tolerant to a herbicide the grower cannot legally apply is worth nothing, and American courts vacated dicamba registrations for over-the-top use during 2024, stranding growers who had bought tolerant seed for that season. The root cause is that seed technology cycles run a decade while pesticide registrations can be withdrawn in a single ruling. Commercially this transfers regulatory risk from the chemistry business to the seed business. Participants respond by stacking tolerance to multiple modes of action, by shortening the exposure of any single platform, and by pairing trait launches with registration certainty rather than assuming it.
Market Impact: Adds 31% technology price share
3 additional market trends, 2 additional growth drivers, and 4 additional restraints and challenges are covered in the full report. Contact sales@marketmindsadvisory.com to access the complete intelligence.

Segment CAGR and Growth Architecture

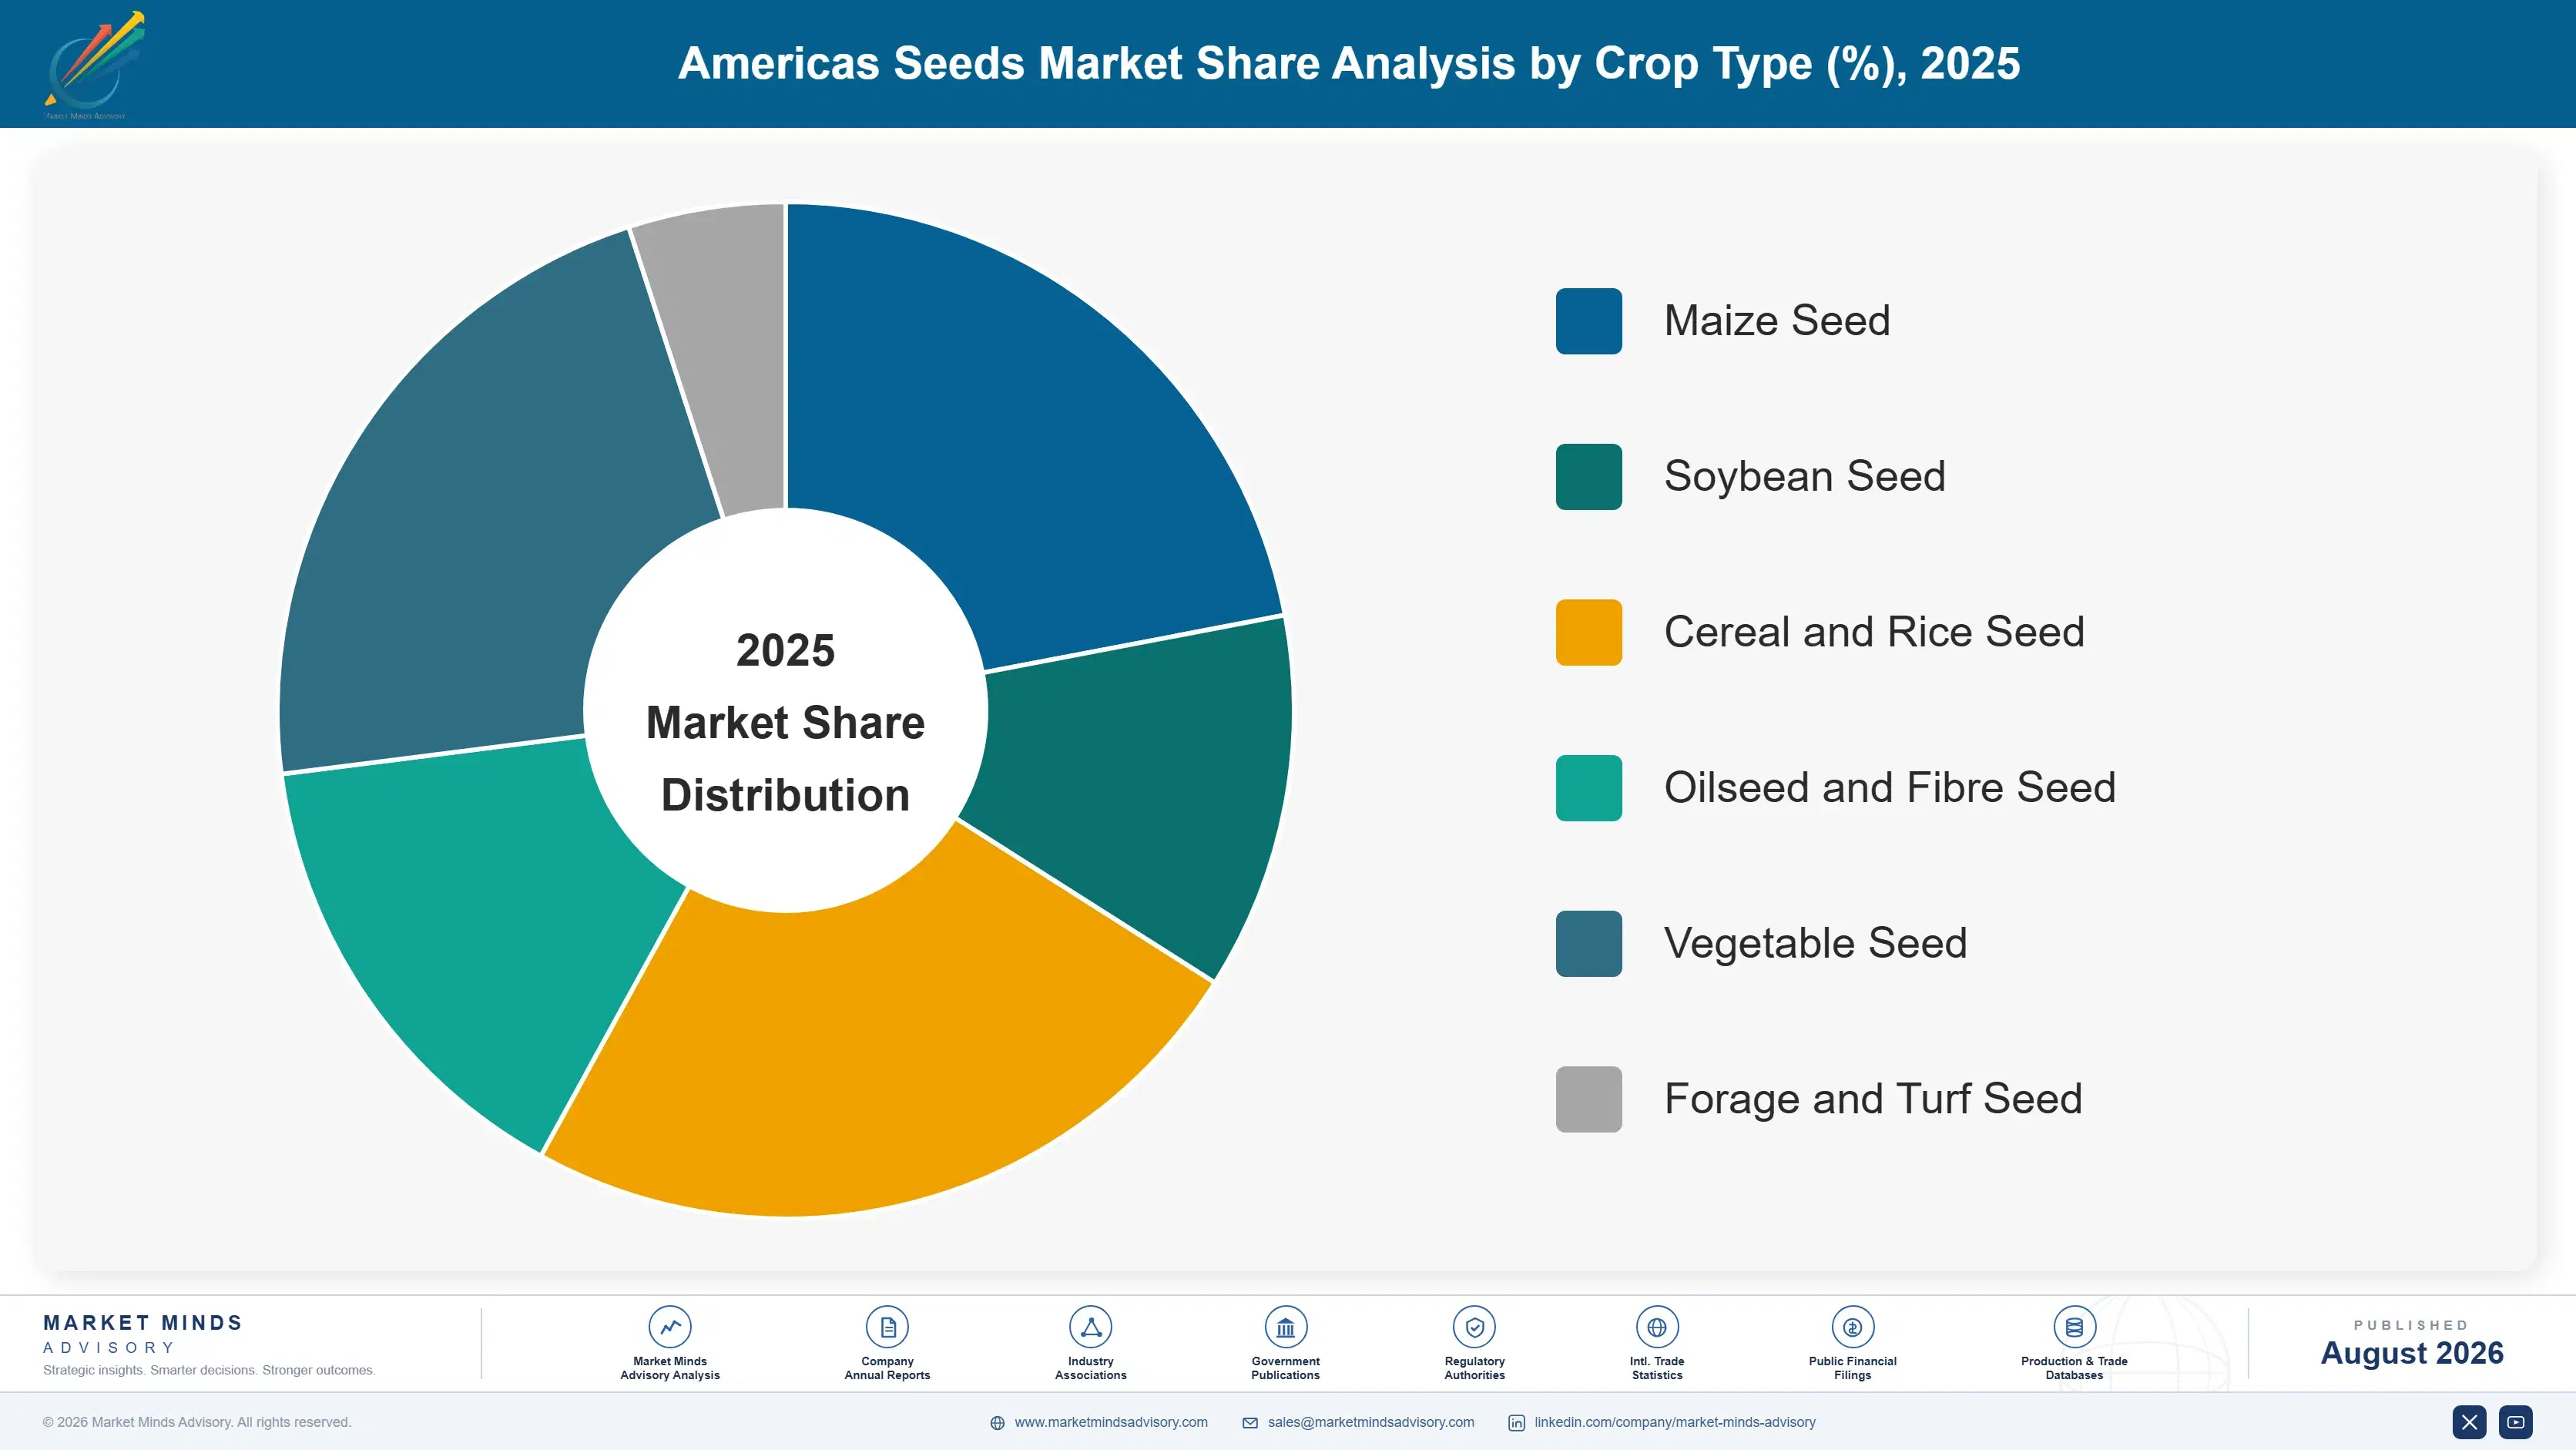
Segmentation follows crop type, the single agronomic logic that determines breeding programme structure, trait applicability, seed production method, and per-hectare value. Crop decides whether hybrid vigour is available, whether saved seed is practical, and what a grower will pay. Geography, channel structure, and trait platform appear separately in the framework as commercial dimensions rather than parallel segments.
americas-seeds-market-2024-2034-trends-market-share-analysis-1787462305467

Vegetable Seed

Vegetable seed is the best business in this market and the least discussed. Growth of 8.9%, roughly 1.44 times the market, comes from hybrid penetration now above seventy percent and from protected cropping expansion across Mexico, the American Southwest, and Ontario. Per-hectare seed spend runs an order of magnitude above row crops, because a protected tomato hectare generates revenue that justifies premium genetics several times over. Hybrid vigour also makes saved seed pointless, so royalty leakage barely exists here. Breeding is slow, germplasm-intensive, and protected through plant variety rights rather than patents, which is why specialists including Rijk Zwaan, Enza Zaden, and Sakata hold positions the row crop majors have never displaced.
CAGR 8.9%

Soybean Seed

Soybean carries most of the volume growth in the Americas and most of the royalty argument. Brazilian and Paraguayan area expansion adds genuinely new hectares while North American acreage stays broadly flat, and trait platforms including Intacta and Enlist have raised technology value per hectare considerably. Growth of 7.1% reflects that combination. The commercial weakness is that soybean is self-pollinating, so saved seed performs almost as well as purchased seed the following season, which makes collection a legal problem rather than a biological one. Argentina demonstrates the consequence starkly: comparable agronomy and genetics, a fraction of the seed revenue per hectare, and new traits withheld as a result. That single legal gap explains the whole regional divergence.
CAGR 7.1%
Full segment breakdown across 6 segments available in the complete report.

Regional Architecture and Country Demand Map

North America holds 32% of global value, reflecting the largest single commercial seed market and the highest per-hectare technology pricing anywhere. Latin America adds a further 9% and supplies most acreage growth, while South Asia and Pacific grows fastest from a smaller base. East Asia grows on policy investment.

North America

This is the world's largest commercial seed market and the one where technology pricing works best. American maize and soybean growers pay the highest per-hectare seed cost anywhere, royalty collection is enforceable through technology use agreements and courts that uphold them, and the dealer network makes annual repurchase routine rather than negotiated. The SECURE rule exempts many gene-edited crops from biotechnology regulation, which has pulled development activity here. Court vacatur of dicamba registrations during 2024 showed how quickly regulatory risk can move from chemistry to seed. Canadian canola and Mexican protected vegetable production add high-value demand at 5.4% regional growth. Enforceability, more than agronomy, is what makes this market worth breeding for.
Share: 32% | CAGR: 5.4% (2026 to 2036)

Western Europe

Regulation shapes this market more than agronomy does. Transgenic cultivation remains effectively absent across most member states, and new genomic technique proposals for gene-edited crops continue working through legislative process without resolution, which leaves European breeders competing on conventional genetics alone. That has pushed serious biotechnology investment toward the Americas. What Europe retains is exceptional vegetable seed capability, with Dutch and French breeders including Rijk Zwaan, Enza Zaden, and Limagrain holding globally leading positions built on germplasm depth and plant variety rights. Cereal seed volume is substantial but low-value, and farm-saved seed remains widespread under statutory exemptions. Growth of 4.6% is the slowest of any region. Biotechnology investment has largely left the region.
Share: 20% | CAGR: 4.6% (2026 to 2036)
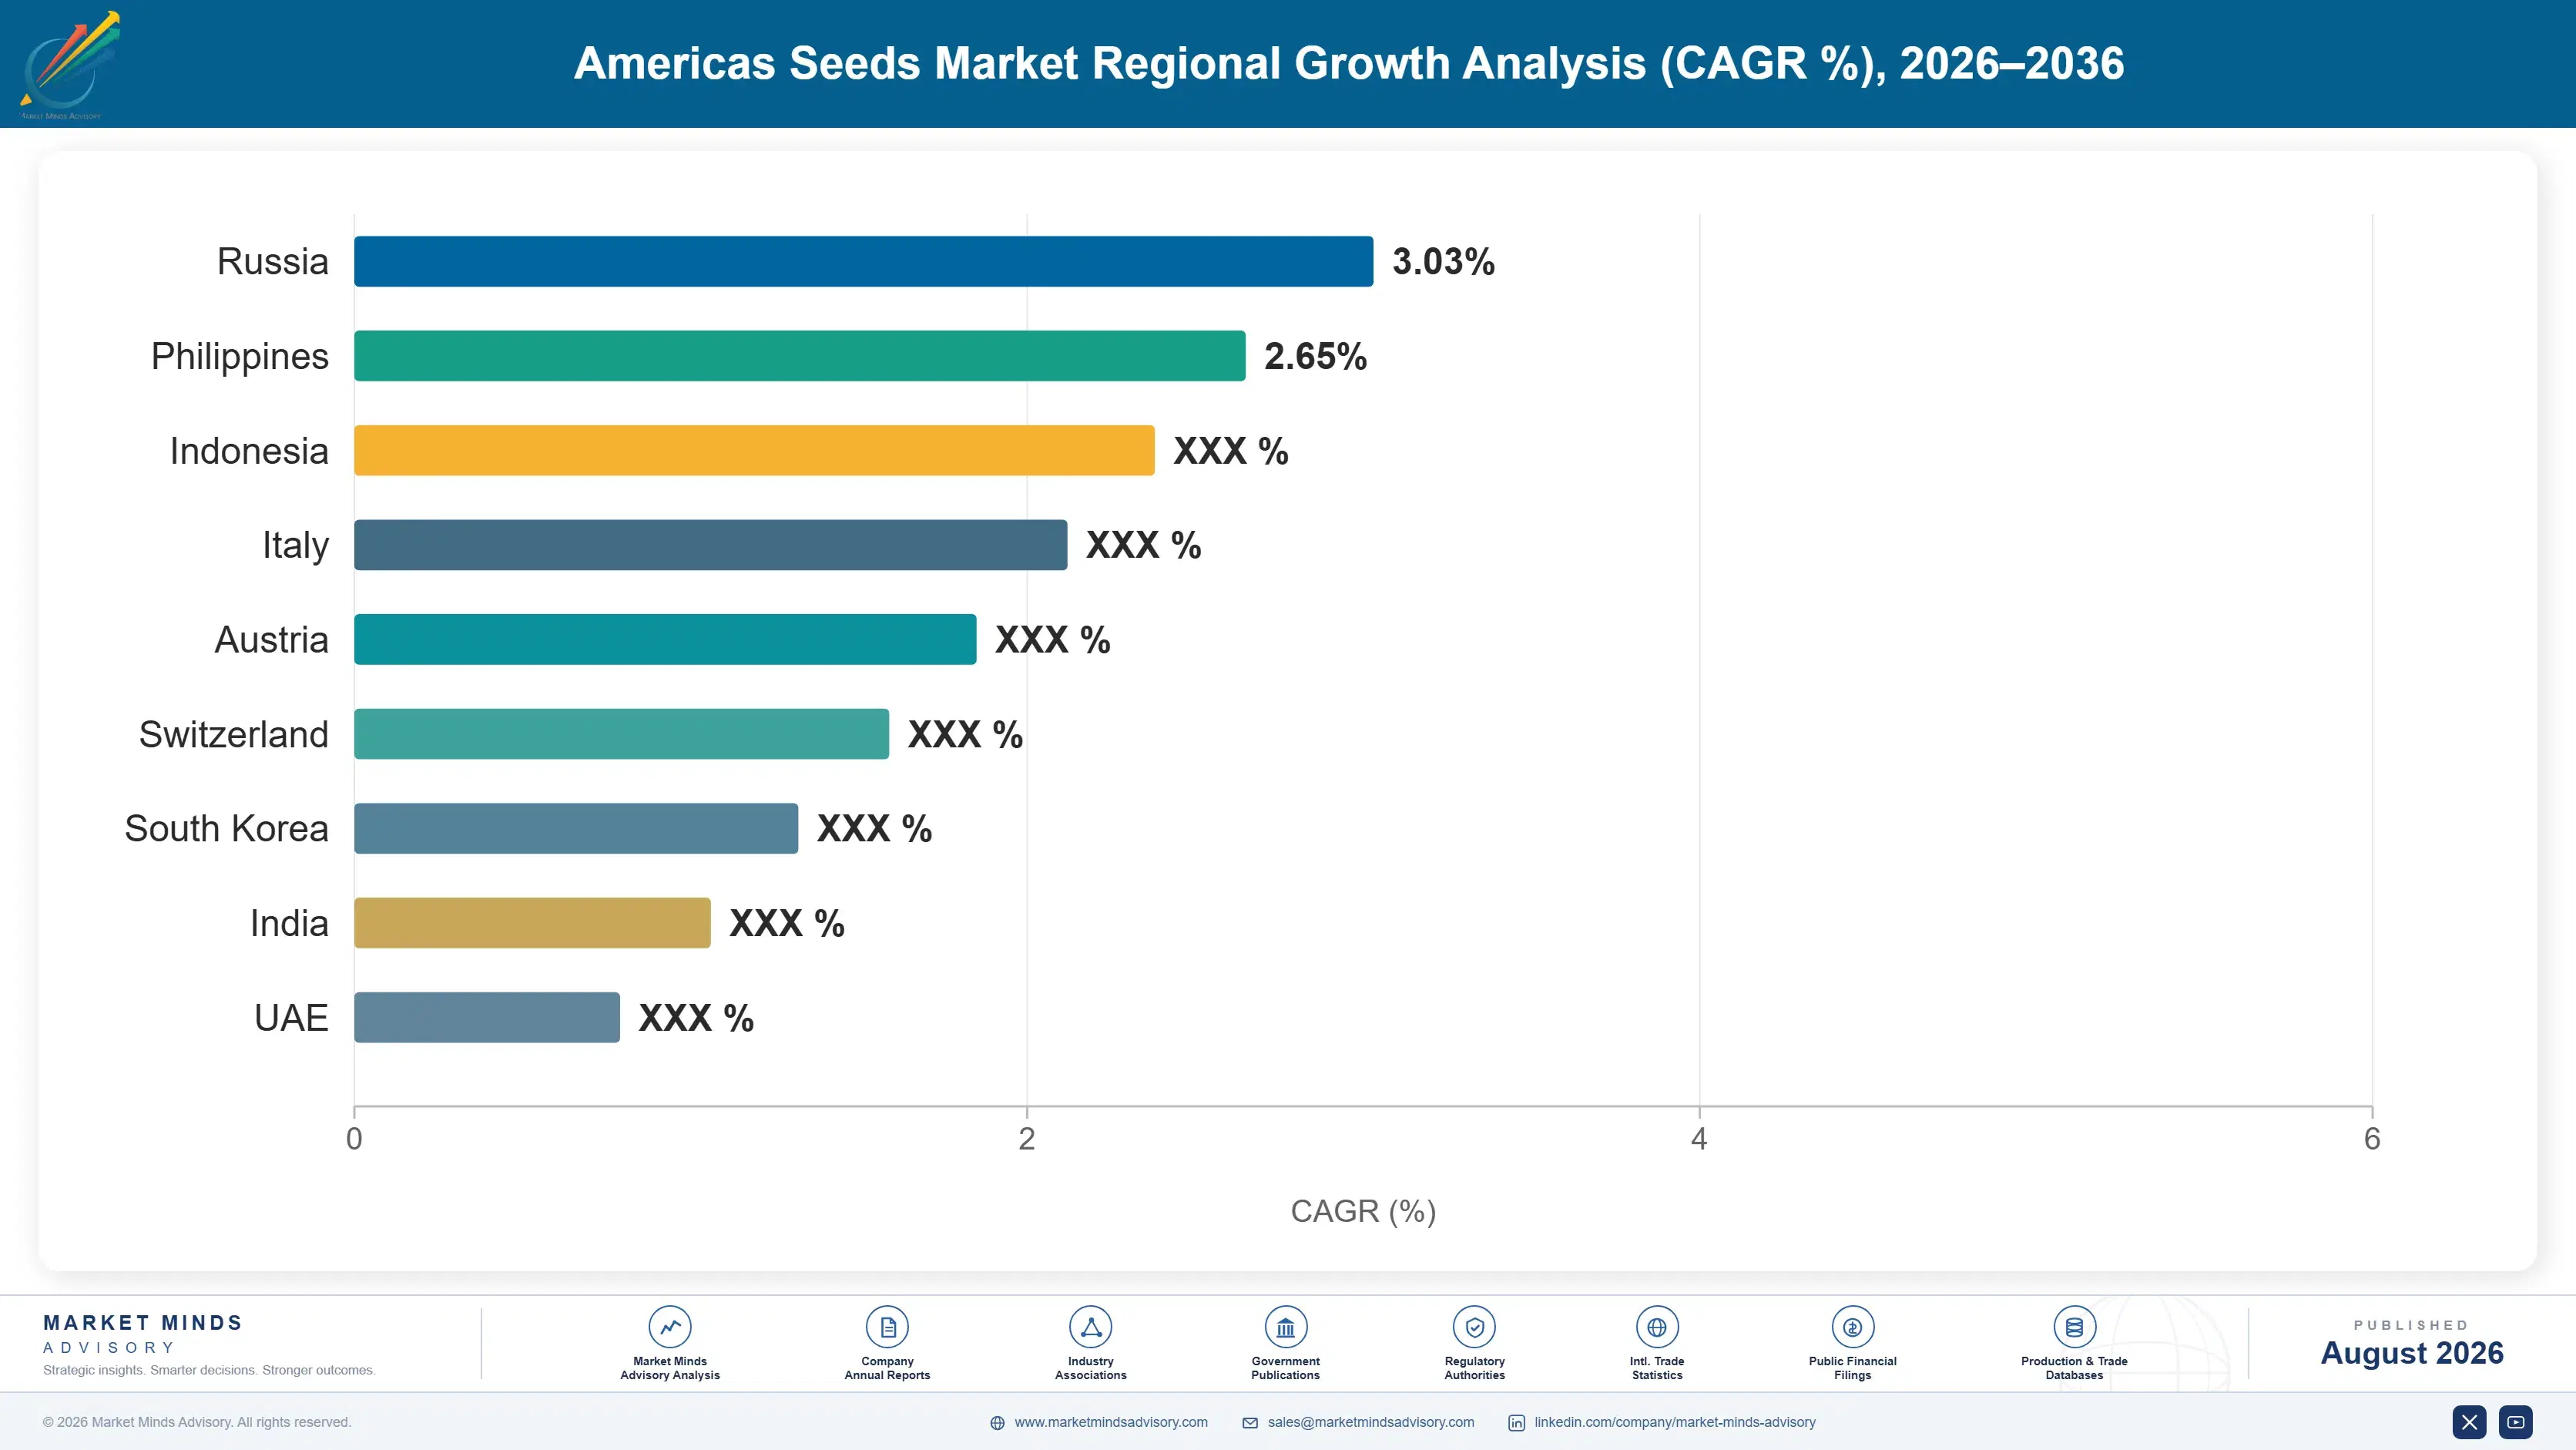
Regional intelligence for 5 additional markets available in the complete report: East Asia, South Asia and Pacific, Latin America, Middle East and Africa, Eastern Europe. Contact sales@marketmindsadvisory.com.
americas-seeds-market-2024-2034-trends-country-cagr-analysis-1787462305980

Where Seed Companies Actually Earn Margin

Breeding better germplasm is necessary and no longer sufficient, because cross-licensing means competitors often sell the same technology. The four moves below shift revenue toward positions rivals cannot licence their way into: collectable royalty structures, edited traits launched under permissive regulation, vegetable genetics protected by hybrid vigour, and agronomic evidence generated where the grower actually farms.

Collect Royalties at Grain Delivery Rather Than Seed Sale

Enforcing technology agreements across thousands of individual farms is impractical, which is why Argentine collection fails and roughly 38% of potential royalty disappears. Point-of-delivery systems, where grain buyers test loads and deduct technology fees on behalf of developers, move enforcement to a few hundred elevators instead. Brazilian implementation shows the mechanism works at scale. Building the testing and settlement infrastructure costs around $12 million per country, which is recovered within two seasons at meaningful adoption and permanently changes what a market is worth. Enforcement moves from thousands of farms to a few hundred counterparties.
Market Impact: Recovers up to 38% of lost royalty income

Launch Edited Traits Where Regulators Treat Them Conventionally

The American SECURE rule and comparable Brazilian, Argentine, Canadian, and Chilean exemptions let gene-edited crops reach market without transgenic approval, cutting development timelines by roughly 60% and cost by an order of magnitude. Sequencing launch strategy to those jurisdictions first, rather than waiting for global harmonisation that shows no sign of arriving, generates revenue years earlier. It also builds field performance data that supports later approvals elsewhere. Companies still designing programmes around simultaneous global launch are funding delay they do not need to accept. Global simultaneous launch is a habit, not an actual requirement anywhere.
Market Impact: Advances commercial launch by roughly 6 full years

Expand Vegetable Genetics Where Hybrid Vigour Blocks Saved Seed

Vegetable seed carries per-hectare spend around forty times row crop levels, grows at 8.9%, and suffers almost no royalty leakage because saved hybrid seed does not perform. Protected cropping expansion across Mexico, the Southwest, and Ontario keeps adding demand at premium pricing. The barrier is germplasm depth, which takes decades and cannot be acquired quickly, so entry usually means acquisition rather than breeding. Specialists including Rijk Zwaan, Enza Zaden, and Sakata have defended these positions against the row crop majors for years, which tells you how durable they are. Nobody has bred a competitive portfolio from scratch recently.
Market Impact: Earns roughly 40x row crop pricing per hectare

Fund Local Yield Trials Where Growers Actually Compare Brands

When cross-licensing means competing brands carry identical traits, the purchase decision turns on local yield trial results and dealer credibility rather than on technology claims. Running dense strip trial networks across a growing region costs roughly $4 million annually and produces the county-level comparison data growers genuinely act on. Companies with the deepest local datasets hold share through poor seasons that damage competitors, because the grower can see performance under conditions matching his own. Technology sells the category; local data sells the bag. Growers trust neighbours and plot results ahead of any brochure claim.
Market Impact: Protects market share across 3 consecutive poor seasons

Who Controls the Margin Pool

The top five hold roughly 58% of commercial seed value, measured consistently as seed revenue at grower purchase price including embedded trait royalties. A decade of consolidation produced Bayer, Corteva, Syngenta, BASF, and Limagrain, and the gap to challengers is trait portfolio depth and cross-licensing position rather than germplasm alone. Regional and vegetable specialists remain competitive precisely where trait technology matters least.
Competition runs along three lines. Trait platform development is the first, now shifting from transgenic events toward gene editing under permissive American regulatory treatment. Germplasm adaptation is the second, particularly tropical maize and soybean breeding for Brazilian conditions that temperate programmes cannot serve. The third is channel control, where dealer relationships and local yield trial data decide purchases between brands carrying identical cross-licensed technology.

Two pressures will reshape positions. Gene editing lowers the cost of trait development enough that mid-sized breeders and start-ups can participate in a game previously reserved for those funding transgenic approval. Meanwhile Chinese domestic seed policy is building national capability that will eventually compete beyond its borders. The exposed position is a mid-sized row crop breeder with licensed traits, no editing programme, and no vegetable or channel advantage to fall back on.
americas-seeds-market-2024-2034-trends-company-positioning-matrix-1787462306498

Competitive Moat and Risk Dimensions

BAYER CROP SCIENCE

Moat: Trait Platform and Licensing Reach

Bayer holds the most widely licensed trait platforms in maize and soybean, earning royalty income from competitors' seed sales as well as its own, which converts market share losses into partial revenue retention. The germplasm library and Brazilian breeding footprint compound that position. Replicating either would take a competitor decades of breeding investment and regulatory work.
BAYER CROP SCIENCE

Risk: Litigation and Registration Exposure

The company carries substantial legal exposure tied to crop protection products, and its seed traits depend on herbicide registrations that American courts have shown willingness to vacate. Dicamba illustrated how quickly a trait platform can lose value through no fault of the genetics. That linkage between chemistry risk and seed revenue is difficult to hedge and hard to explain.
CORTEVA AGRISCIENCE

Moat: Direct Dealer Channel Depth

Corteva reaches American growers through the Pioneer direct sales organisation, which places agronomists in county-level relationships rather than routing through independent retailers. That channel generates local trial data, agronomic credibility, and repurchase behaviour competitors selling through distribution cannot easily match. It also insulates pricing during seasons when growers are trimming input spend.
CORTEVA AGRISCIENCE

Risk: Royalty Dependence on Competitors

A meaningful part of the trait portfolio is licensed in from or cross-licensed with rivals, which limits differentiation when competing brands carry the same technology. As gene editing lowers development barriers, the value of an established licensing web falls. Building independent editing platforms fast enough to replace that position is the central execution question facing the company.

Players Tracked

Prominent Players

Bayer Crop Science
Corteva Agriscience
Syngenta Group
BASF
Limagrain

Other Key Players

KWS SAAT
DLF Seeds
Rijk Zwaan
Enza Zaden
Sakata Seed
Takii and Company
Bejo Zaden
Longping High-Tech
Denghai Seeds
Nuseed
GDM Seeds
Stine Seed Company
Beck's Hybrids
Semillas Fito
Advanta Seeds

Recent Developments

MARCH 2025

Corteva expands Brazilian maize and soybean breeding capability

Corteva extended breeding and testing capacity in Brazil, targeting tropical germplasm adaptation for centre-west soybean and second-crop maize systems. The investment reflects where genuine acreage growth now sits, since Northern Hemisphere planted area has been broadly flat while Brazilian frontier expansion has continued for successive seasons.
Signal: Breeding capacity is now following acreage growth southward, which temperate programmes simply cannot serve from existing stations.
SEPTEMBER 2024

American courts vacate dicamba over-the-top herbicide registrations

Federal court rulings vacated registrations for over-the-top dicamba application, leaving growers who had purchased tolerant soybean seed without a legal herbicide programme for the season. Seed companies reworked trait platform positioning toward stacks tolerant to multiple modes of action rather than depending on any single chemistry.
Signal: Registration risk now sits inside seed revenue, transferring exposure from crop protection into a decade-long breeding cycle.
JUNE 2025

Argentine seed law reform stalls again in congressional process

Proposed reform of Argentine seed legislation intended to strengthen breeders' rights failed to advance through congress once more, leaving royalty collection on self-pollinating crops dependent on contractual and delivery-point mechanisms. Developers continued limiting introduction of newer soybean traits into the market as a direct commercial response.
Signal: Withholding technology from unenforceable markets has now become standard practice rather than an exceptional commercial decision.

Parent Seed, Royalties, and Conditioning

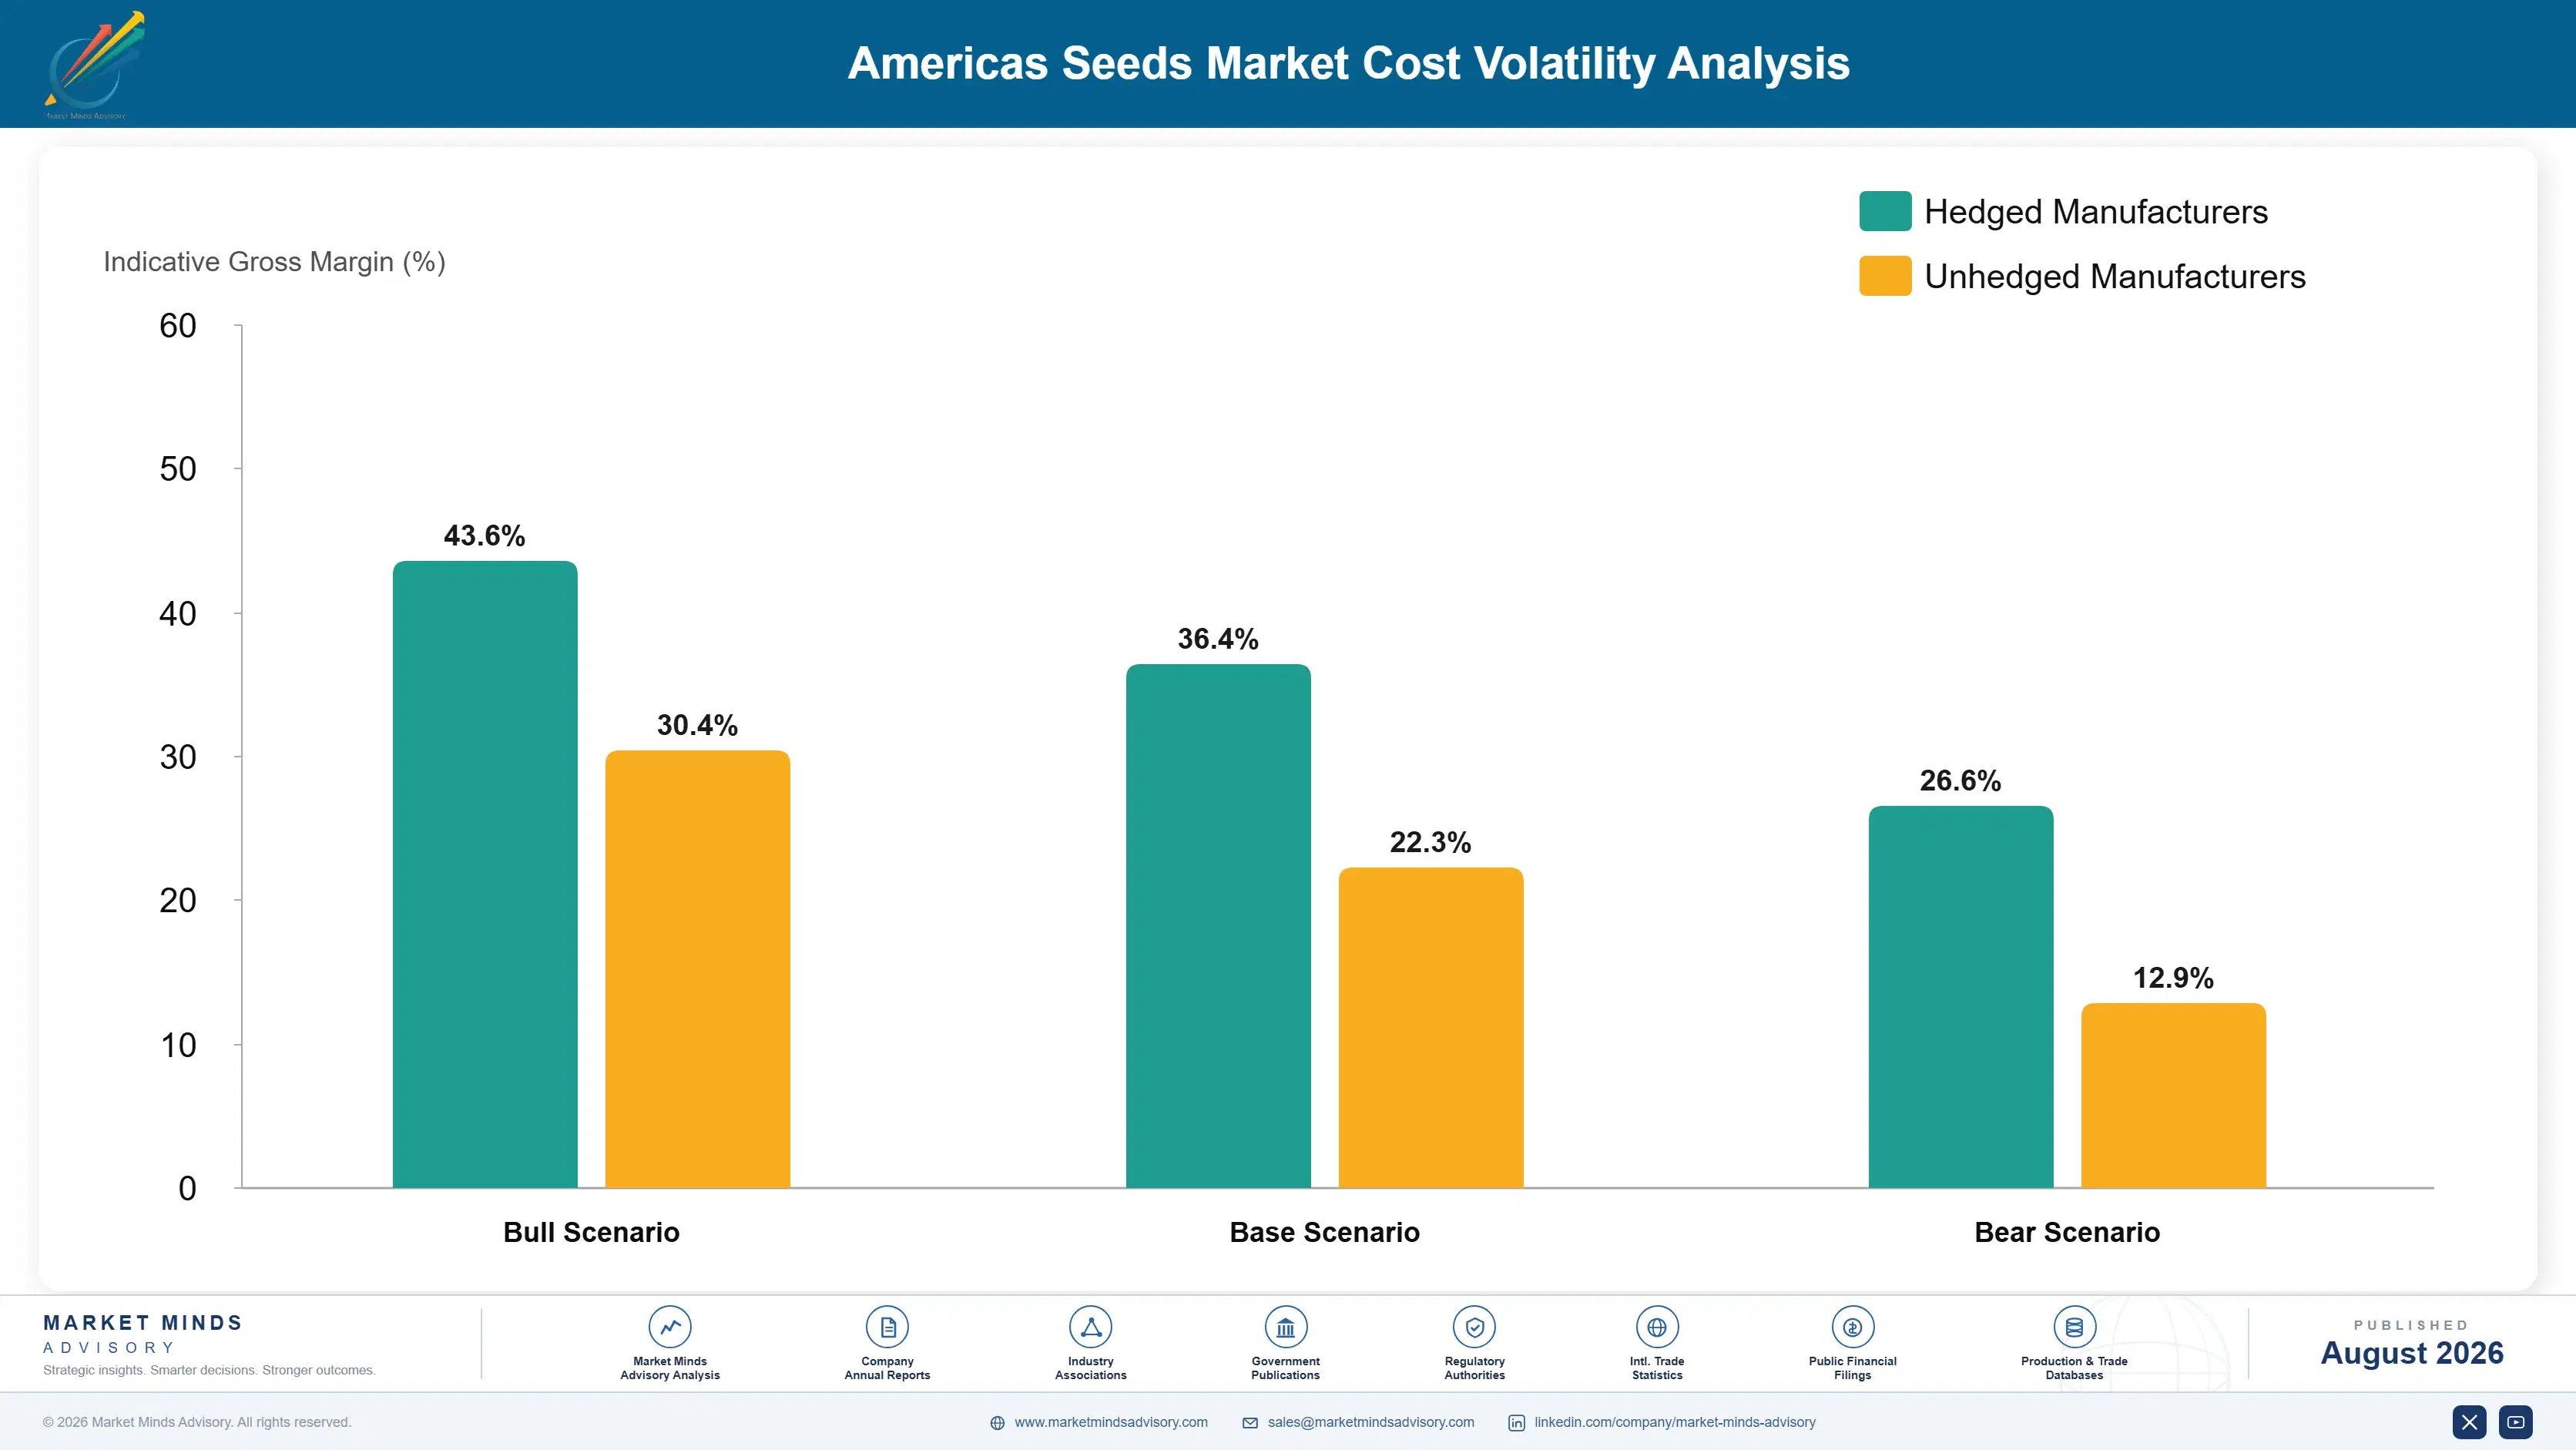
Parent seed production and field multiplication account for roughly 34% of cost, contracted to growers across Iowa, Nebraska, Chile, Argentina, and southern Brazil to exploit counter-seasonal production. Inbound trait royalties on licensed technology take a further 21%. Conditioning, treatment chemistry, and packaging contribute 18%, and breeding and regulatory expense, capitalised across programme life, absorbs most of the remainder.
Production field yields depend on the same weather that affects commercial crops, and drought across Argentina during 2023 cut counter-seasonal multiplication output sharply, forcing companies to ration hybrid volume for the following Northern Hemisphere season. Seed treatment chemistry costs rose alongside general crop protection inflation, and IEA reporting documented the energy movements that lifted manufacturing costs for those actives. Corteva and Bayer both referenced production and input cost pressure across their 2023 and 2024 reporting.

Exposure varies with production footprint rather than with company scale. Companies multiplying across both hemispheres absorbed the Argentine shortfall by shifting volume; those in one production geography rationed customers and lost share. Inbound royalty exposure differs sharply too, since a licensee carries a cost line a platform owner does not. That distinction widens as gene editing lowers the barrier to owning technology.
americas-seeds-market-2024-2034-trends-cost-volatility-analysis-1787462306693

Counter-seasonal multiplication across multiple latitudes and hemispheres

Producing parent and commercial seed across Northern and Southern Hemisphere sites means a drought in one geography meets a crop already growing in another. Spreading across latitudes within each hemisphere adds further protection against localised weather. Companies concentrated in a single production region rationed customers through the 2023 Argentine shortfall and lost share they have not fully recovered since.

Own trait platforms rather than licensing them inbound

Inbound royalties run over a fifth of cost for companies licensing most of their technology, and that line does not exist for platform owners. Gene editing has lowered the cost of developing proprietary traits sufficiently that ownership is now achievable for mid-sized breeders. The saving compounds, because owned platforms also generate outbound royalty income from competitors.

Contract seed treatment chemistry alongside broader input requirements

Treatment actives follow crop protection markets and manufacturing energy costs rather than seed market conditions. Companies buying treatment alongside their wider chemistry requirements secure better terms than those purchasing it as a standalone seed input. Pure seed companies without a chemistry business should aggregate volume across seasons and crops rather than tendering treatment separately each year.

Portfolio Architecture for Margin Defence

Three tiers separate on how well value can be captured rather than on how good the genetics are. Commodity cereal and forage seed sold into markets with statutory saved-seed exemptions earns 18% to 26%, because the grower can legally reuse it. Trait-bearing row crop seed in enforceable jurisdictions earns 34% to 46%, since royalty collection works and repurchase is annual. Vegetable hybrids and proprietary edited traits earn most of all, and that gap keeps widening as editing lowers development cost.
The tension is geographic rather than agronomic. The same soybean bag earns full technology value in Iowa and almost none in Santa Fe province, which means portfolio decisions are really decisions about where to deploy scarce trait introductions. Several developers now withhold newer traits from unenforceable markets entirely, accepting lower volume for protected value. That looks like abandoning growth and is closer to refusing to fund competitors' saved-seed operations.

High-value pools sit where biology or law prevents reuse. Hybrid vegetable seed, hybrid maize, and jurisdictions with functioning delivery-point royalty collection all convert breeding investment into annual recurring revenue, which is exactly what self-pollinating crops in weak-enforcement markets fail to do.

Volume / Commodity-Adjacent Tier

Cereal, rice, and forage seed sold into markets with statutory farm-saved seed exemptions or weak enforcement. Competes on price against saved seed directly. The wide range reflects large differences between certified premium supply and basic commercial multiplication.
Gross Margin: 18%-26%

Premium / Certified Tier

Trait-bearing maize, soybean, and cotton seed sold in jurisdictions where technology agreements are enforceable and repurchase is annual. Range width separates single-trait products from fully stacked platforms carrying multiple herbicide and insect technologies within this tier.
Gross Margin: 34%-46%

Sustainability / Regulatory / Next-Generation Tier

Hybrid vegetable genetics, proprietary gene-edited traits, and disease resistance packages for protected cropping. Hybrid vigour and owned platforms, rather than production economics, sustain the margin structure across this tier throughout the forecast period.
Gross Margin: 52%-68%
americas-seeds-market-2024-2034-trends-portfolio-architecture-1787462307189

High-value Sub-segments and Strategic Watch-out

Hybrid Vegetable Genetics

Highest value in the market at roughly forty times row crop per-hectare spend, growing at 8.9% on protected cropping expansion. Hybrid vigour makes saved seed pointless, so royalty leakage barely exists. Germplasm depth takes decades, which is why entry usually means acquisition. Acquisition is usually the only route.
Gross Margin: 56%-68%

Proprietary Gene-Edited Traits

High value with strong growth, launched under American, Brazilian, and Argentine regulatory treatment that avoids transgenic approval entirely. Development cost falls by an order of magnitude. Range width separates early single-gene edits from stacked packages combining several edited characteristics together. Mid-sized breeders can now participate here.
Gross Margin: 50%-64%

Stacked Row Crop Trait Platforms

The volume core, earning well where enforcement works and nothing where it does not. Cross-licensing means competitors often sell identical technology, so local yield trial data and dealer relationships decide the purchase rather than the trait itself. Enforcement geography, rather than genetics, decides the return entirely.
Gross Margin: 32%-44%

Herbicide-Tolerance Dependent Platforms

The strategic watch-out. A trait tolerant to a herbicide the grower cannot legally apply is worth nothing, as the 2024 dicamba vacatur demonstrated across twenty million hectares. Stack tolerance across multiple modes rather than depending on a single chemistry. Registration risk now sits inside a decade-long breeding cycle.
Gross Margin: 28%-42%

Why Growers Rarely Switch Brands

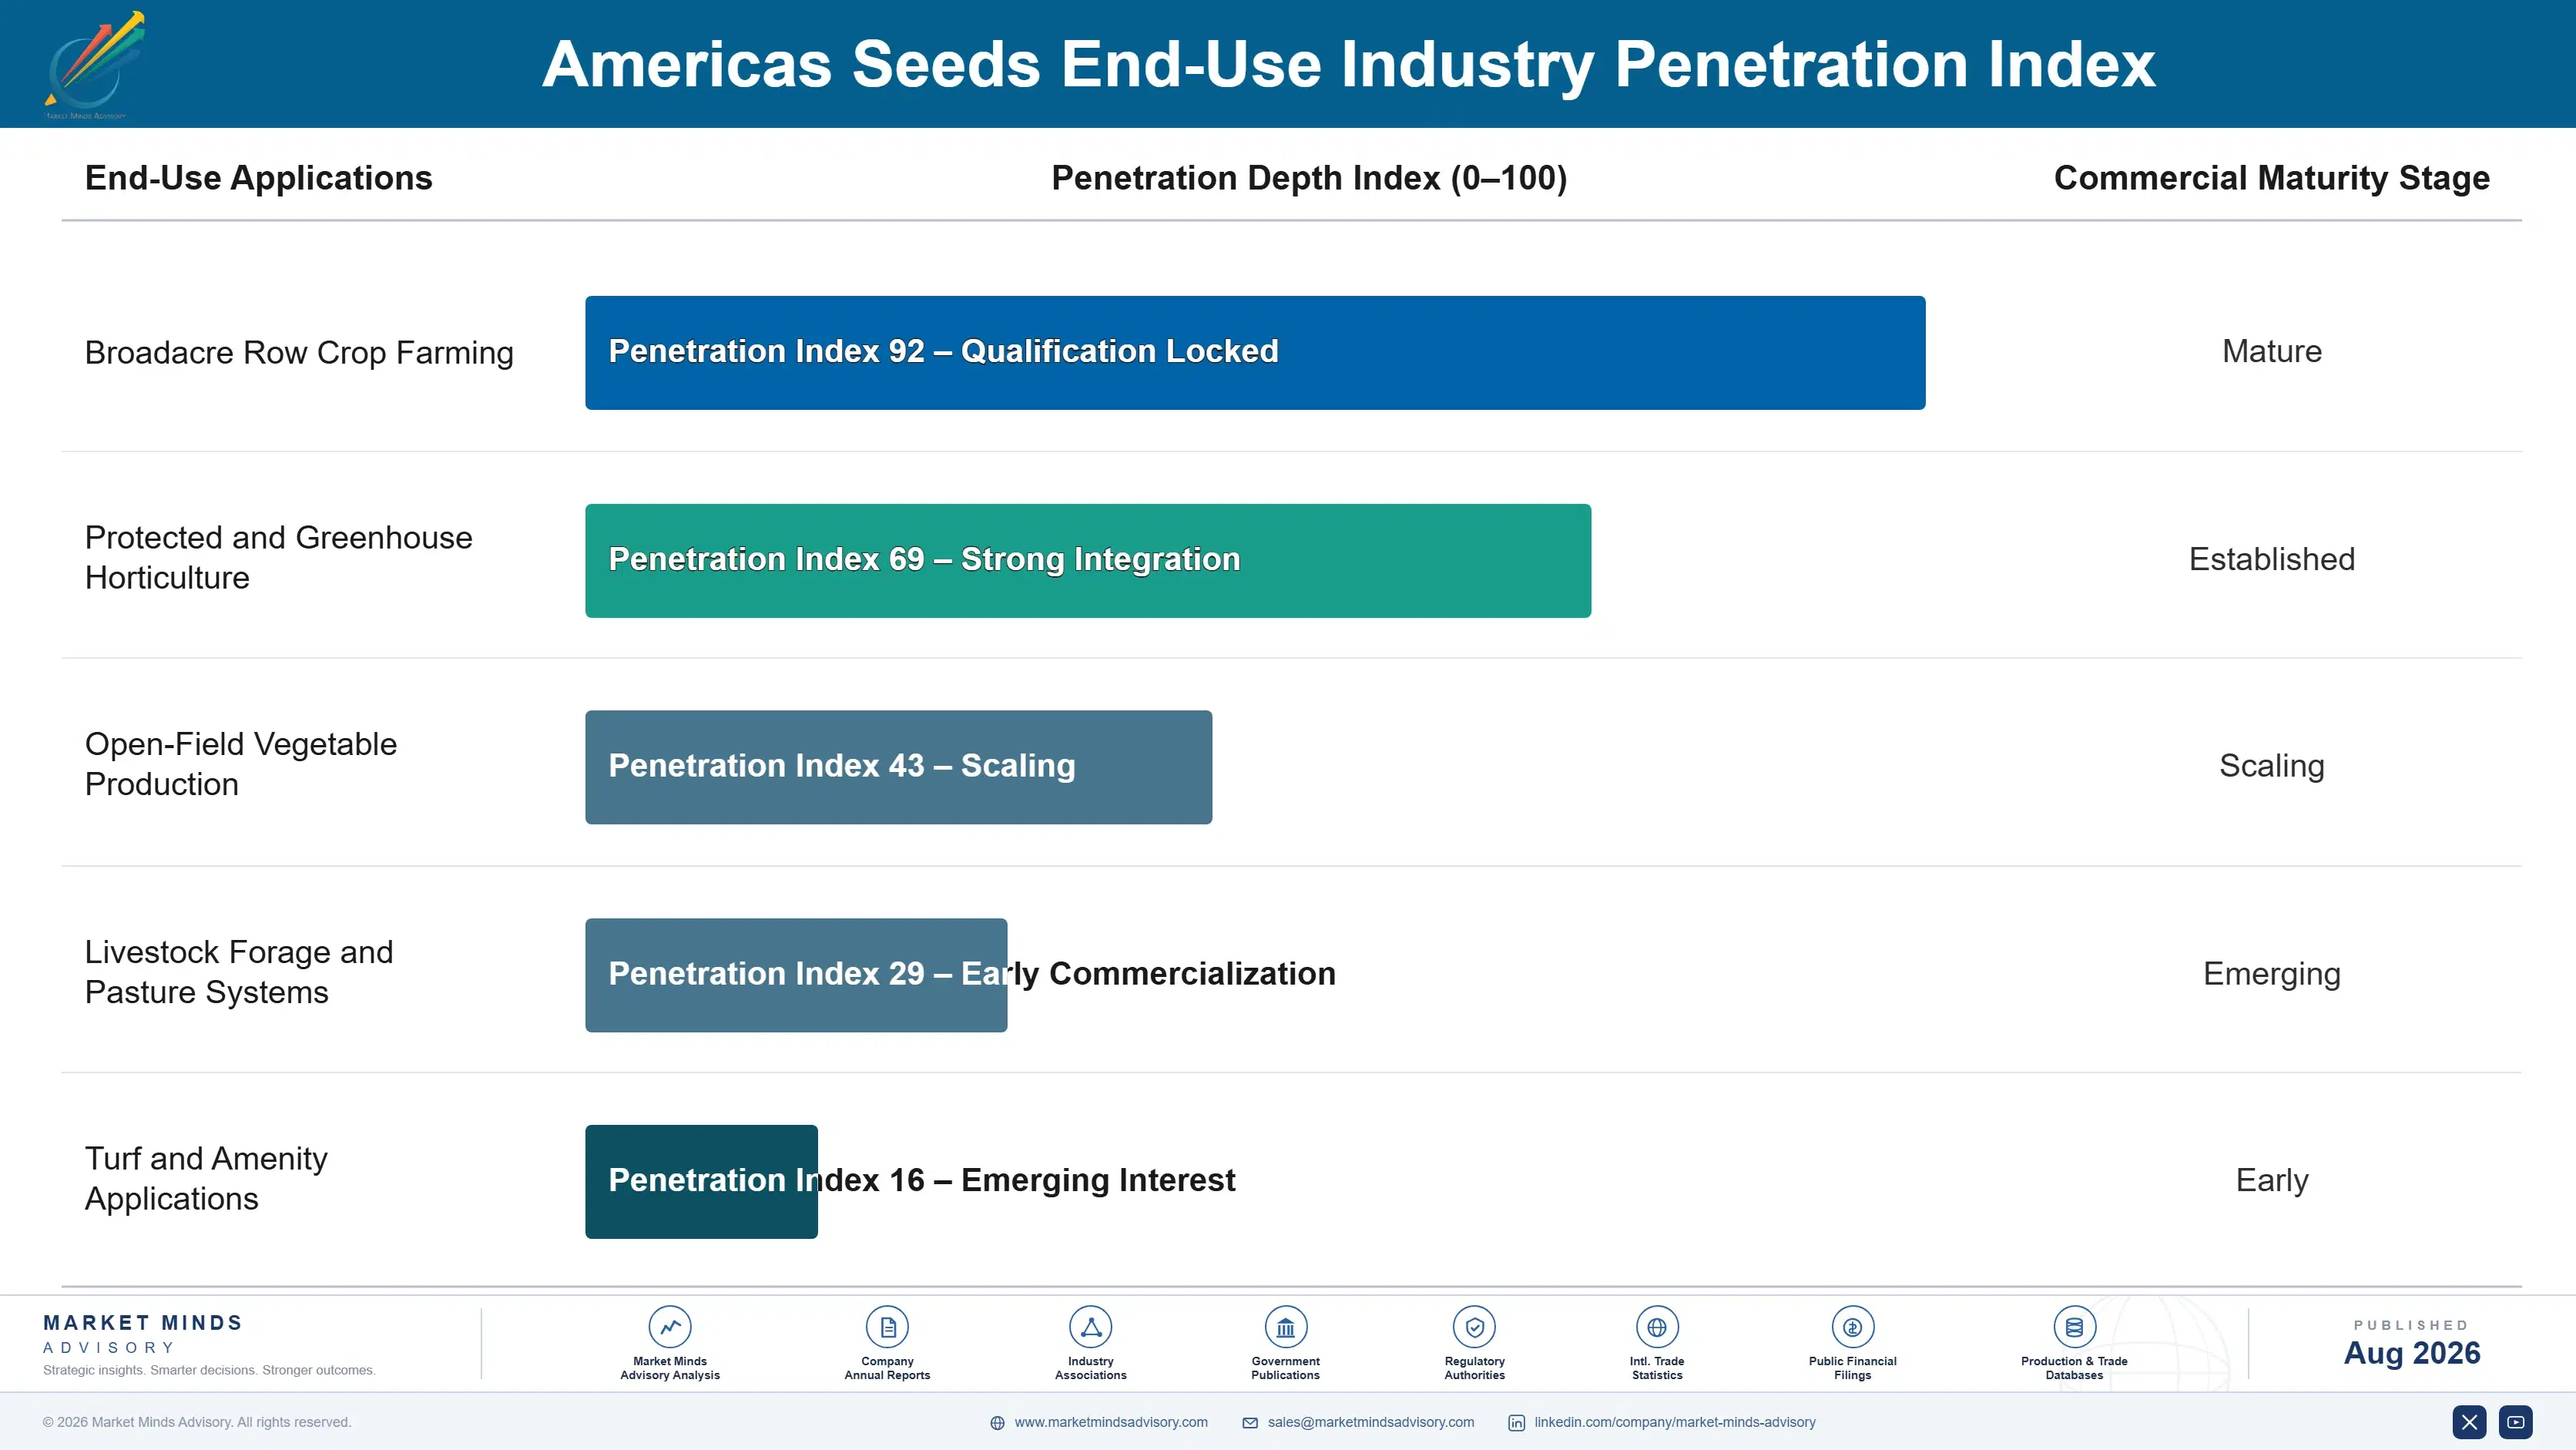
Seed revenue is annuity revenue disguised as an annual transaction. A grower who has run a brand across several seasons has accumulated local yield history, knows how the genetics behave on his own soil types, and has a relationship with an agronomist who understands the operation, and none of that transfers to a competitor's bag. Typical brand tenure with a commercial row crop grower runs seven to eleven years, punctuated by trialling competitor products on a small share of area rather than by wholesale switching.
Stickiness varies considerably by crop and by channel. Hybrid vegetable relationships are the most durable, because a protected cropping operation builds an entire production programme, disease management approach, and buyer specification around specific varieties. Direct-channel row crop relationships come next, protected by agronomist contact and county-level trial data. Cereal and forage seed is the least sticky, competing directly against farm-saved seed and retendered essentially every season on delivered price alone.

Buyer profiles have shifted. Larger operations now run their own trial plots and demand data rather than accepting supplier claims, and succession into younger management has made digital agronomy integration a routine part of the purchase conversation.
americas-seeds-market-2024-2034-trends-end-use-penetration-index-1787462307675

Where Seed Capital Should Go

These are among the four positions where our research anticipates prominent divergence between winners and laggards over the coming forecast period. Each is grounded in the demand model, the regulatory perimeter, and the announced capacity pipeline.
01 / ROYALTY COLLECTION INFRASTRUCTURE

Move enforcement to grain delivery points, not individual farms

Policing technology agreements across thousands of farms is impractical, which is why Argentine collection fails and roughly 38% of potential royalty simply disappears each season. Delivery-point systems, where grain buyers test loads and deduct technology fees for developers, shift enforcement to a few hundred elevators instead, and Brazilian implementation demonstrates the mechanism works at genuine scale. Infrastructure costs around $12 million per country, which is recovered within two seasons and permanently changes what a market is worth to breed for.
02 / EDITED TRAIT SEQUENCING

Launch in permissive jurisdictions first and stop waiting for harmonisation

American, Brazilian, Argentine, Canadian, and Chilean regulators treat most gene-edited crops as conventional where no foreign DNA remains, cutting development timelines by roughly 60% and cost by an order of magnitude against conventional transgenic events. Sequencing launches to those markets first generates revenue several years earlier and builds the field performance record that supports later approvals elsewhere. Companies still designing programmes around simultaneous global launch are funding delay that the European legislative process shows no sign of removing any time soon.
03 / VEGETABLE PORTFOLIO EXPANSION

Buy vegetable germplasm depth, because breeding it takes decades

Vegetable seed carries per-hectare spend around forty times row crop levels, compounds at 8.9%, and suffers almost no royalty leakage because saved hybrid seed simply does not perform in the following season. Protected cropping expansion across Mexico, the American Southwest, and Ontario keeps adding demand at premium pricing that row crop economics never approach. The barrier is germplasm depth accumulated over decades, so entry realistically means acquisition, and specialists have defended these positions against the row crop majors for many years now.
04 / LOCAL TRIAL NETWORK INVESTMENT

Fund county-level yield data where brand choice is actually decided

Cross-licensing means competing brands frequently carry identical trait technology, so the purchase decision turns on local yield trial results and dealer credibility rather than on any technology claim in a brochure. Dense strip trial networks across a growing region cost roughly $4 million annually and produce exactly the county-level comparison data growers act on when choosing. Companies holding the deepest local datasets keep share through poor seasons that damage competitors, because growers can see performance under conditions matching their own operations.

Engagement Snapshot From the Field

A live engagement with an industry participant carrying material or product regulatory and market exposure ahead of a defining policy shift, showing how our research translates into a defensible multi-year portfolio strategy.
MARKET MINDS ADVISORY · CLIENT ENGAGEMENT SUMMARY
Americas Seeds Producer Strategic Portfolio Review and Transition Roadmap 2026·Investment Scenario on Americas Seeds Exposure Evaluation 2025-26
CLIENT PROFILE
A South American seed company breeding and marketing soybean and maize genetics across Brazil, Paraguay, and Argentina, with annual revenue near USD 310 million (client-reported, unverified by MMA). Soybean supplied roughly 62% of volume across the three countries, most trait technology was licensed inbound from two multinational developers, and the company had no visibility of how much of its genetics were being replanted without payment.
STRATEGIC CHALLENGE
Argentine revenue per planted hectare had fallen to roughly a third of Brazilian levels despite comparable genetics and agronomy, inbound royalty costs were rising with each trait stack introduction, and the two licensing partners had begun restricting which newer traits would be made available for Argentine commercialisation at all. Margin was falling in both directions.
MMA APPROACH
MMA estimated genetics replanting rates by country using seed sales against planted area and multiplication records, quantifying uncollected royalty. Delivery-point collection mechanisms were assessed against Brazilian precedent and Argentine elevator structure. Portfolio options were modelled comparing inbound licensing against developing proprietary edited traits under permissive regional regulation, tested through 47 expert interviews during Q4 2025.
KEY FINDINGS
  1. Argentine plantings of the company's soybean genetics exceeded commercial seed sales by an estimated factor of 2.8, meaning most technology use generated no revenue whatsoever.
  2. Inbound trait royalties had risen to 24% of soybean seed cost, and both licensing partners were restricting newer trait availability specifically in the Argentine market.
  3. Delivery-point collection through roughly 140 Argentine elevators would reach an estimated 71% of relevant grain volume, at infrastructure cost recoverable within three seasons.
  4. Two proprietary gene-edited disease resistance traits were achievable in-house within four years under existing Brazilian and Argentine regulatory treatment of edited crops.
CLIENT PROFILE
A South American seed company breeding and marketing soybean and maize genetics across Brazil, Paraguay, and Argentina, with annual revenue near USD 310 million (client-reported, unverified by MMA). Soybean supplied roughly 62% of volume across the three countries, most trait technology was licensed inbound from two multinational developers, and the company had no visibility of how much of its genetics were being replanted without payment.
STRATEGIC CHALLENGE
Argentine revenue per planted hectare had fallen to roughly a third of Brazilian levels despite comparable genetics and agronomy, inbound royalty costs were rising with each trait stack introduction, and the two licensing partners had begun restricting which newer traits would be made available for Argentine commercialisation at all. Margin was falling in both directions.
MMA APPROACH
MMA estimated genetics replanting rates by country using seed sales against planted area and multiplication records, quantifying uncollected royalty. Delivery-point collection mechanisms were assessed against Brazilian precedent and Argentine elevator structure. Portfolio options were modelled comparing inbound licensing against developing proprietary edited traits under permissive regional regulation, tested through 47 expert interviews during Q4 2025.
KEY FINDINGS
  1. Argentine plantings of the company's soybean genetics exceeded commercial seed sales by an estimated factor of 2.8, meaning most technology use generated no revenue whatsoever.
  2. Inbound trait royalties had risen to 24% of soybean seed cost, and both licensing partners were restricting newer trait availability specifically in the Argentine market.
  3. Delivery-point collection through roughly 140 Argentine elevators would reach an estimated 71% of relevant grain volume, at infrastructure cost recoverable within three seasons.
  4. Two proprietary gene-edited disease resistance traits were achievable in-house within four years under existing Brazilian and Argentine regulatory treatment of edited crops.
RECOMMENDED STRATEGY
Phase 1: Phase 1 (months one to eight): pilot delivery-point royalty collection with three Argentine grain buyers covering a defined production region. Phase 2: Phase 2 (months nine to twenty): shift Argentine commercial focus toward maize hybrids, where hybrid vigour prevents replanting, while collection infrastructure scales. Phase 3: Phase 3 (months twenty-one to forty-eight): develop two proprietary edited disease resistance traits to reduce inbound royalty dependence across the portfolio.
OUTCOME
The pilot collection programme reached 63% of grain volume in its region and lifted Argentine revenue per planted hectare by 41% within two seasons (client-reported, unverified by MMA). Maize now supplies a larger share of Argentine volume. Both edited trait programmes are in field trial and one licensing agreement was renegotiated on better terms.

Frequently Asked Questions

Foundational context covering the market sizes, CAGR, scope, country, region and competition that inform every finding below. This section is provided to cover basics and most often pre-purchase conversations, answered from the MMA Primary Research Dataset.

What is the current size of the Americas Seeds Market?

The market was valued at USD 58.4 billion in 2025, rising to an estimated USD 62.0 billion in 2026. North America holds the largest regional share at 32% of global value.

How large will the Americas Seeds Market be by 2036?

MMA forecasts USD 113.2 billion by 2036 under the base case, an expansion multiple of 1.83 times the 2026 level. Incremental value creation across the period reaches USD 51.2 billion.

What is the CAGR for the Americas Seeds Market 2026 to 2036?

The base case CAGR is 6.2%, with a bull case of 7.5% and a bear case of 4.9%. Historical growth between 2020 and 2025 ran at 5.1%, driven almost entirely by price and mix.

Which segment is growing fastest?

Vegetable seed, at 8.9%, roughly 1.44 times the overall market rate. Hybrid vigour prevents saved seed use, so royalty leakage barely exists in this segment at all.

Who are the major companies in the Americas Seeds Market?

Bayer Crop Science, Corteva Agriscience, Syngenta Group, BASF, and Limagrain lead, holding roughly 58% of commercial seed value between them. KWS, Rijk Zwaan, and Sakata follow.

Which country is growing fastest?

Brazil, at 7.8%, driven by continued frontier soybean expansion and second-crop maize following soybean across the centre-west. Royalty collection works reasonably well there through delivery-point mechanisms.

Report Segmentation Architecture

The full report scope spans multiple orthogonal segmentation dimensions, with cross-tabulated demand data provided for each dimension pair. Coverage extends further to regional breakdowns, trend trajectories, and the competitive detail needed to support segment-level decision-making.

By Crop Type

  • Maize Seed
  • Soybean Seed
  • Cereal and Rice Seed
  • Oilseed and Fibre Seed
  • Vegetable Seed
  • Forage and Turf Seed

By End-Use Industry

  • Broadacre Row Crop Farming
  • Protected and Greenhouse Horticulture
  • Open-Field Vegetable Production
  • Livestock Forage and Pasture Systems
  • Turf and Amenity Applications

By Commercial Dimension

  • Direct Sales Force and Agronomy Channel
  • Independent Agricultural Retail Distribution
  • Cooperative and Farmer Association Supply
  • Trait Licensing and Royalty Arrangements

By Region

  • North America
  • Western Europe
  • East Asia
  • South Asia and Pacific
  • Latin America
  • Middle East and Africa
  • Eastern Europe

Scope, Methodology, and Coverage

Every figure in this report is reproducible from documented input assumptions. The scope below maps the historical period, the forecast horizon, the segmentation dimensions, and the countries covered, alongside the underlying primary and qualitative methodology.
Historical Period
2020 to 2025
Forecast Period
2026 to 2036
Base Year
2025 (USD billions; MMA Primary Research Dataset, August 2026)
Market Definition
The market comprises commercial seed sold to growers, covering maize, soybean, cereal and rice, oilseed and fibre, vegetable, and forage and turf seed, valued at grower purchase price including embedded trait royalties and applied seed treatment. Commercial coverage centres on North and South American demand with global supply, pricing, and regulatory context. Farmer-saved and informally traded seed, crop protection chemistry sold separately, fertilisers, digital agronomy subscriptions, and planting equipment fall outside scope.
Quantitative Units
USD billions (current prices); million hectares planted; USD per hectare seed spend
Segmentation Dimensions
By Crop Type; By End-Use Industry; By Commercial Dimension; By Region
Regions Covered
North America, Western Europe, East Asia, South Asia and Pacific, Latin America, Middle East and Africa, Eastern Europe
Countries Covered
USA, China, Germany, France, UK, Japan, South Korea, India, Australia, Canada, Brazil, Mexico, Indonesia, Vietnam, Thailand, Malaysia, UAE, Saudi Arabia, South Africa, Nigeria, Turkey, Poland, Netherlands, Italy, Spain, Sweden, Switzerland, Argentina, Colombia, Singapore, and additional markets relevant to this sector
Key Companies Profiled
Bayer Crop Science, Corteva Agriscience, Syngenta Group, BASF, Limagrain, KWS SAAT, DLF Seeds, Rijk Zwaan, Enza Zaden, Sakata Seed, Takii and Company, Bejo Zaden, Longping High-Tech, Denghai Seeds, Nuseed, GDM Seeds, Stine Seed Company, Beck's Hybrids, Semillas Fito, Advanta Seeds
Quantitative Methodology
Primary survey, n=3,800 respondents, Q4 2025, six countries; demand-side model with trade association cross-validation
Qualitative Methodology
47 expert interviews, Q4 2025; applied to validate demand model assumptions, identify emerging dynamics, and assess competitive positioning
Report Format
PDF and XLSX data workbook (Word format preview document)
Publisher
Market Minds Advisory
Report Code
MMA-2026-AGR-102
Published
August 2026
Contact
sales@marketmindsadvisory.com | www.marketmindsadvisory.com

Purchase the full Americas Seeds Market Report (2026 to 2036).

The full report sizes commercial seed demand across six crop types and seven regions with 2026 to 2036 forecasts under base, bull, and bear cases. It quantifies royalty leakage country by country, comparing commercial seed sales against planted area to show where technology is used without payment. Competitive profiles cover twenty companies assessed consistently on seed revenue at grower purchase price, trait portfolio position, and channel structure. Regulatory analysis maps gene editing treatment, breeders' rights enforcement, and biotechnology approval regimes by jurisdiction. Commercial guidance addresses collection infrastructure, launch sequencing, vegetable expansion, and trial network investment.
Six crop types sized and forecast separately
Royalty leakage quantified by country and crop
Twenty company profiles on consistent revenue basis
Gene editing regulatory treatment mapped across major jurisdictions
Trait platform cross-licensing positions assessed for each leader
Delivery-point collection infrastructure cost and recovery benchmarks

Built For The People Who Decide

From boardroom strategy to bench-side execution, this report is read cover-to-cover by leaders shaping the next decade of their industry, turning demand scenarios, market dynamics and valuation benchmarks into decisions.
CXOs/ Presidents/ VPs/ Managers
M&A and Corporate Development
Strategy Teams and R&D Heads
Procurement and Product Directors
Regulatory and Compliance Leaders
Investor Relations and Equity Analysts