Market Minds Advisory
Alternative Retailing Technologies Market

Alternative Retailing Technologies Market: Alternative Retailing Technologies Market. Cashierless Checkout and Live Commerce Platforms Through 2036

Retailers are deploying cashierless checkout, smart vending, and live commerce platforms to compress the gap between browsing and buying, forcing legacy point-of-sale vendors to compete against venture-backed computer vision startups for the same store footprint.

Lead Analyst

Published

September 2026

Make Smarter Decisions with Customized Research Insights

Request a free sample report and evaluate market opportunities, growth trends, and competitive dynamics relevant to your business needs.

2025 MARKET VALUE$18.5BMarket Size 2025
2036 FORECAST VALUE$58.3BBase Case , 2026 to 2036
CAGR 2026 TO 203611.0 %Bull 12.3% / Bear 9.7%
INCREMENTAL OPPORTUNITY$37.8BNet 10- year value creation
EXPANSION MULTIPLE2.84x2036 value over 2026 base
Strategic Levers
M&A Pipeline
Regional Outlook
Country Rankings
Competitive Intelligence
Segmental Deep-dive
Call-Us : 91 93563 13602

Executive Snapshot and Market Trajectory.

Cashierless checkout and computer vision technology are moving from pilot programs into permanent store deployments faster than most retailers expected, as labor cost pressure and customer convenience expectations converge on the same automated buying experience nationwide across every major retail format, store chain, and banner.
Live commerce and social selling platforms are capturing outsized growth in East Asia before spreading to North America and Europe, blending entertainment and impulse purchasing into a single continuous shopping session across nearly every demographic segment. Self-checkout remains the largest deployed technology by unit count, while cashierless store systems and RFID-based automated kiosks represent the fastest-growing frontier for major retail chains investing heavily in next-generation store formats across nearly every major metropolitan market worldwide today.
Competition splits between legacy point-of-sale giants retrofitting existing hardware with computer vision capability, and venture-backed startups building cashierless systems from scratch for entirely new store formats. Data privacy regulation and in-store camera surveillance concerns are shaping which technologies retailers can deploy in different jurisdictions, forcing vendors to localize compliance approaches market by market rather than deploying one single global solution everywhere at once across every single country worldwide.
Market Definition
The alternative retailing technologies market covers hardware and software systems enabling retail sales outside traditional staffed checkout, including cashierless and autonomous store technology, self-checkout systems, smart vending machines, live commerce and social selling platforms, and RFID-based automated retail kiosks. It excludes traditional staffed point-of-sale terminals, e-commerce websites without live or interactive selling components, and warehouse fulfillment automation.
Base Year Value
$18.5B in 2025 (MMA Primary Research Dataset, September 2026)
Forecast Period
2026 to 2036, eleven discrete annual values
CAGR
11.0% base case. Bull 12.3%. Bear 9.7%.
Fastest Growth Segment
Cashierless and Autonomous Store Technology: 16.0% CAGR
Fastest Growth Country
China: 15.5% CAGR
Fastest Growth Region
South Asia and Pacific: 13.0% CAGR
Largest Region
East Asia: 34% of 2025 global value
Market Leaders
[object Object]
Primary Survey
n=3,800 procurement and R&D decision-makers, Q4 2025, six countries
Methodology
Demand-side build-up, cross-validated against public data, 47 expert interviews

Alternative Retailing Technologies Market Forecast Scenarios

alternative-retailing-technologies-market-size-forecast-scenario-1790006066416
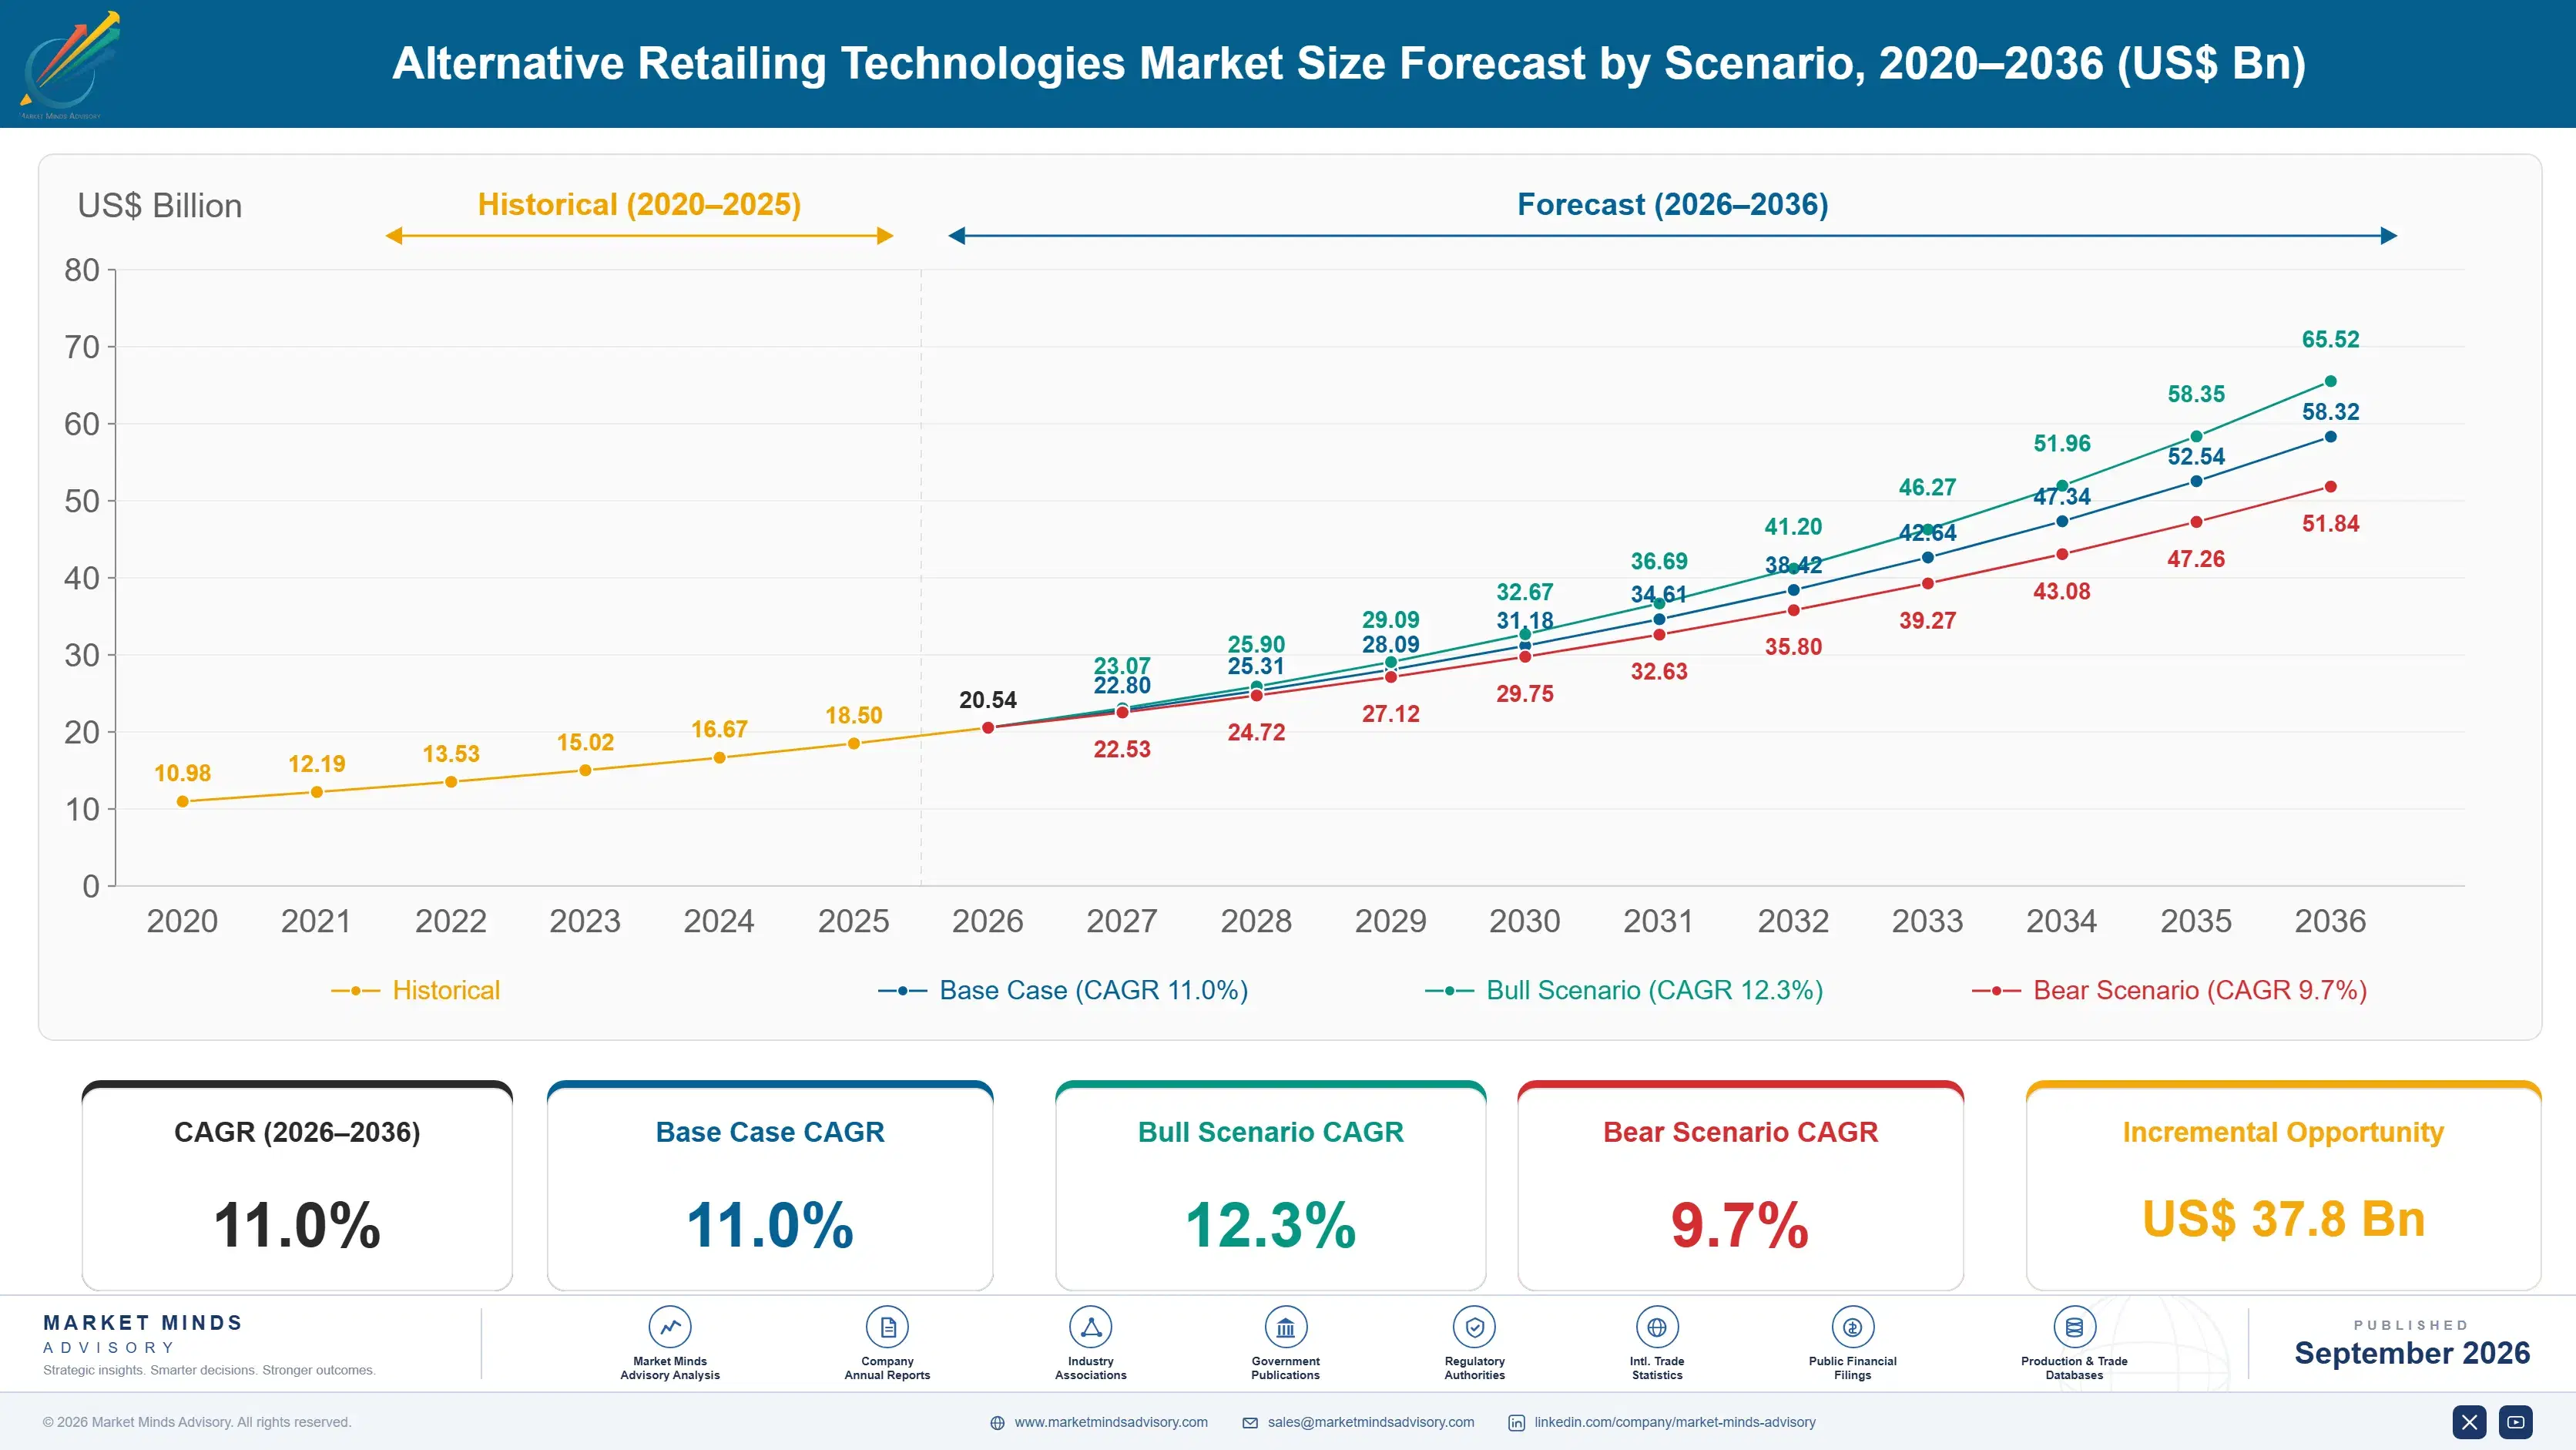
Between 2020 and 2025 alternative retailing technology moved from experimental pilot programs at a handful of flagship stores into mainstream deployment across grocery, convenience, and specialty retail chains worldwide. Historical annual growth ran near nine and a half percent as computer vision costs fell and retailers gained confidence in automated checkout accuracy across nearly every major format tested and deployed at scale.
The base case assumes eleven percent annual growth through 2036, driven by three mechanisms: falling computer vision and sensor hardware costs expanding cashierless deployment well beyond flagship stores into mainstream grocery and convenience formats nationwide, live commerce platforms maturing into a permanent retail channel rather than a passing novelty confined only to niche markets, and rising labor cost pressure in developed markets sustaining automation investment regardless of near-term economic conditions or shifting consumer sentiment.
A bull scenario centers on cashierless technology reaching cost parity with traditional checkout lanes faster than expected, triggering mass retrofit across major grocery chains worldwide within a fairly short span of time. The bear risk is consumer and regulatory pushback against in-store surveillance technology slowing deployment in privacy-sensitive markets including parts of Western Europe and several other certain US states quite specifically.

Computer Vision and Live Commerce Redefine Retail Checkout

Camera and sensor hardware costs set the floor for cashierless system economics, since computer vision infrastructure typically represents more than a third of total deployment cost per store location installed today. Edge computing servers, weight sensors, and software licensing fees make up most of the remaining cost base for a typical mid-size store rollout across the much wider retail estate.
MARKET CONCENTRATIONCR5 38%Top five vendors hold a moderate combined market presence
AVERAGE DEAL SIZE+8% YoYContract values keep climbing as deployments scale much broader
TOP PRODUCING COUNTRYChina 45%One country supplies most global platform transaction volume
CAPACITY UTILISATION71%Deployed systems run well below theoretical maximum throughput capacity
TRADE INTENSITYModerateSoftware crosses borders more freely than physical hardware
SENSOR COST SHARE38% of COGSCamera and sensor hardware remains the largest cost driver
Retailer differentiation increasingly hinges on checkout accuracy rates and integration speed with existing point-of-sale infrastructure rather than raw camera count. Chains comparing vendors now weigh false-charge rates and staff retraining costs as heavily as sticker price, narrowing the room for unproven startups competing purely on cost. Reliability track records across large deployments have also become a meaningful differentiator as chains grow wary of unproven technology failing at scale.
Enterprise sales cycles dominate this category far more than most consumer technology, since major retail chains require extensive pilot testing across multiple store formats before committing to chain-wide rollout decisions. That dynamic keeps sales cycles long and capital requirements high for vendors lacking existing enterprise retail relationships and proven references from comparable retail chains already using the same technology successfully at scale.
"Checkout accuracy, not marketing claims, is quietly deciding which cashierless vendors survive their first chain-wide rollout. The vendors treating pilot data as optional will find their contracts cancelled before the second store opens."
Principal Analyst, Retail Automation and Commerce Platforms Practice · MMA Technology: Retail Automation and Commerce Platforms Practice · September 2026

Market Trends

Computer Vision Accuracy Reaches Full Commercial Deployment Threshold

Computer vision checkout accuracy has crossed the threshold that most major retail chains consider acceptable for chain-wide deployment, with leading systems now matching or exceeding traditional cashier accuracy on typical grocery basket compositions across every tested format. This accuracy milestone has enabled pilot-to-scale decisions that many retail technology executives had delayed for years pending sufficient proof of reliability across diverse product mixes and store formats nationwide. Vendors that achieved this accuracy threshold first are capturing a disproportionate share of new chain-wide contracts, since switching costs discourage retailers from re-evaluating vendors once initial deployment succeeds at scale.
Market Impact: Reduces staffing costs by 30 percent
Live Commerce Platforms Mature Into Permanent Sales Channel

Live commerce, once dismissed as a novelty confined to Chinese social media platforms, has matured into a permanent sales channel that major Western retailers now budget for annually rather than testing opportunistically each quarter. Brands increasingly employ dedicated live commerce hosts and production teams, treating livestream shopping events as a core marketing and sales function rather than an experimental side project confined to niche categories only. Platform providers report meaningfully higher conversion rates from live commerce sessions compared to standard e-commerce browsing, reinforcing continued investment across nearly every major retail category and product vertical worldwide.
Market Impact: Reaches 2 billion social commerce users

Market Opportunities and Growth Drivers

Labor Cost Pressure Sustains Strong Automation Investment Nationwide

Persistent labor shortages and rising minimum wage requirements across major developed retail markets continue driving sustained investment in checkout automation regardless of near-term economic conditions or capital spending caution elsewhere in the business overall. Retailers increasingly calculate automation payback periods against actual realized labor cost inflation rather than theoretical estimates, strengthening the investment case considerably across every major format studied in fine detail. Store formats with chronic staffing difficulty, including late-night convenience locations, report the fastest payback periods and highest satisfaction levels with deployed cashierless systems among all format types studied in this full analysis.
Market Impact: Restricts deployment across 15 US states

Social Commerce Integration Expands Younger Buyer Reach Rapidly

Younger consumers increasingly discover and purchase products directly within social media applications rather than navigating to a separate retailer website or app, driving retailer investment in native social commerce and live selling integration across every major platform available today. Brands that fail to establish a presence within these platforms risk losing an entire generation of buyers who rarely visit traditional e-commerce storefronts directly anymore at all these days. Platform providers continue expanding native checkout capability within their apps, reducing friction between content discovery and completed purchase for retailers willing to integrate deeply across every major channel.
Market Impact: Reports 25 percent consumer discomfort rate

Market Restraints and Challenges

Privacy Regulation Restricts In Store Surveillance Deployment Broadly

In-store computer vision systems rely on continuous camera monitoring that increasingly triggers data privacy regulation in jurisdictions with strict biometric and surveillance laws, particularly across parts of Western Europe and several US states. The root cause is regulatory frameworks written before widespread computer vision retail deployment struggling to classify exactly what data collection qualifies as biometric processing requiring explicit consent. The commercial impact falls hardest on vendors unable to offer privacy-compliant deployment configurations for regulated markets, forcing costly redesigns. Several vendors are now offering anonymized processing modes that avoid storing identifiable customer data as a mitigation approach.
Market Impact: Reaches 99 percent checkout accuracy

Consumer Distrust Slows Cashierless Store Adoption Rates Somewhat

A meaningful share of consumers report discomfort with unstaffed cashierless stores, particularly older shoppers and those concerned about being wrongly charged without a human available to resolve disputes immediately. The root cause is limited consumer familiarity with how computer vision checkout actually works combined with well-publicized early failures at flagship pilot locations that damaged public trust broadly. The commercial impact falls hardest on retailers introducing the technology without adequate customer education, facing higher complaint volumes and slower adoption than projected. Several chains are now offering hybrid staffed and unstaffed lanes side by side to ease the transition.
Market Impact: Generates 500 billion dollars in transactions
3 additional market trends, 4 additional growth drivers, and 2 additional restraints and challenges are covered in the full report. Contact sales@marketmindsadvisory.com to access the complete intelligence.

Segment CAGR and Growth Architecture

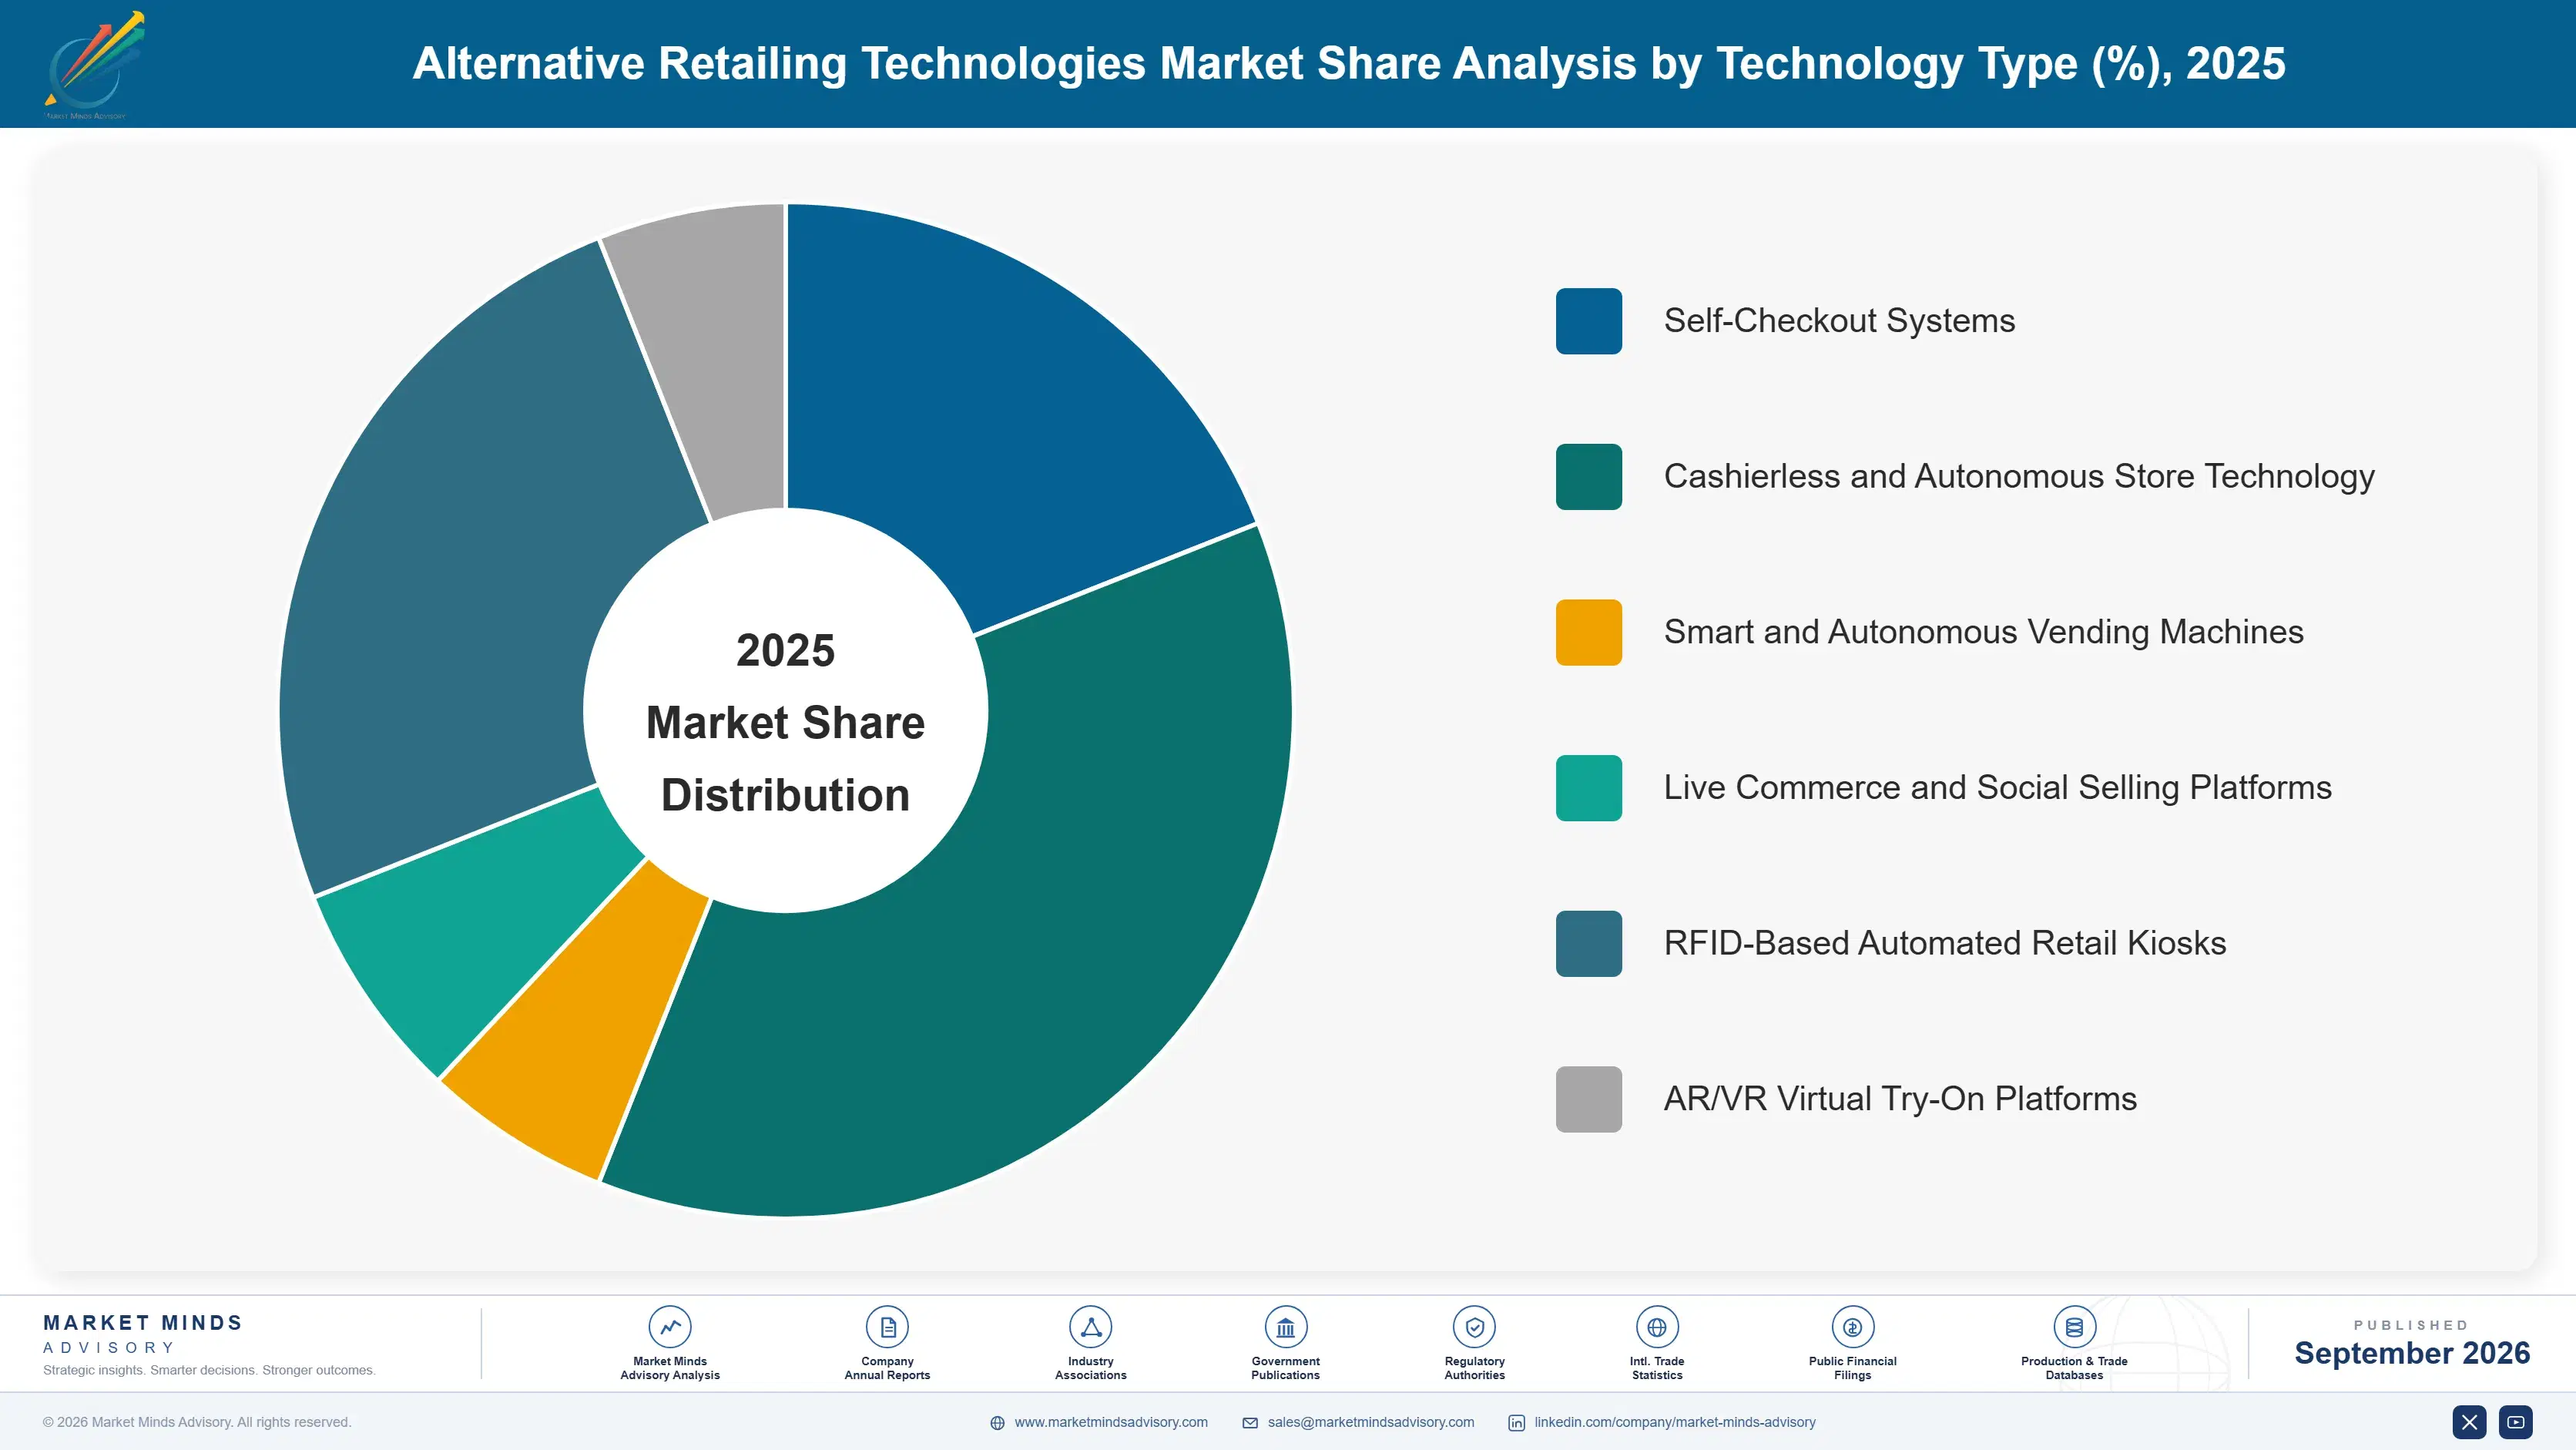
Alternative retailing technologies segment cleanly by automation and interaction method, spanning traditional self-checkout through fully autonomous cashierless stores and live commerce platforms. Each tier serves a distinct retail occasion, from routine grocery trips to entertainment-driven impulse purchasing, with capital intensity and deployment complexity scaling together across the full range of formats retailers actually deploy across stores today.
alternative-retailing-technologies-market-market-share-analysis-1790006066981

Cashierless and Autonomous Store Technology

Cashierless and autonomous store technology uses computer vision, weight sensors, and machine learning to eliminate the traditional checkout process entirely, letting shoppers select items and leave the store while payment processes automatically in the background without any human intervention required at all times whatsoever. Demand concentrates among convenience chains, grocery operators, and airport retail locations facing chronic staffing shortages and long queue complaints during peak hours of daily operation. Deployment costs remain substantially higher than traditional self-checkout lanes, limiting adoption to well-capitalized chains willing to absorb multi-year payback periods in exchange for meaningfully reduced ongoing labor costs and improved customer throughput during busy periods across the entire store network nationwide.
CAGR 16.0%

Live Commerce and Social Selling Platforms

Live commerce and social selling platforms blend entertainment programming with real-time product demonstration and purchasing, letting viewers buy featured items without ever leaving the livestream interface itself at any point during the entire live broadcast session. This format originated in China and has since spread rapidly to Southeast Asia, North America, and Europe as major social platforms add native shopping capability directly within their existing apps and services. Brands increasingly treat live commerce as a core sales channel requiring dedicated production teams and hosts rather than a marketing side project, driving meaningful investment in studio infrastructure and creator partnerships across nearly every major consumer product category and demographic segment worldwide.
CAGR 14.5%
Full segment breakdown across 6 segments available in the complete report.

Regional Architecture and Country Demand Map

Regional demand tracks retail labor costs, digital commerce maturity, and social media shopping culture, with East Asia leading on live commerce scale and North America close behind on cashierless technology investment across nearly every major retail format, store chain, and product category tracked in this full study.

North America

Labor cost pressure and chronic staffing shortages anchor North American demand, where convenience and grocery chains lead cashierless technology adoption to address persistent hourly wage inflation across the sector. Major retailers headquartered here pioneered early cashierless store concepts, giving domestic vendors meaningful reference deployment advantages when selling internationally to other retail chains abroad seeking similar automation gains and efficiency improvements. Self-checkout remains the largest deployed technology by unit count across the entire region, even as cashierless pilots continue expanding steadily each year across multiple major grocery and convenience store chains nationwide today. Live commerce adoption trails East Asia considerably but is accelerating quite rapidly now as major platforms add native shopping features directly within their existing consumer apps.
Share: 26% | CAGR: 11.5% (2026 to 2036)

Western Europe

Data privacy regulation across the European Union shapes deployment more than any other factor regionally, with strict biometric and camera surveillance rules limiting which cashierless technology configurations retailers can legally deploy across member states. Germany and France lead regional adoption of self-checkout and RFID-based inventory systems, while cashierless store pilots remain more limited than in North America due to regulatory caution and compliance complexity. The UK has emerged as Europe most permissive market for cashierless technology trials, attracting disproportionate vendor investment and pilot program activity from across the entire wider continent overall. Live commerce adoption trails East Asia and North America considerably but is beginning to gain meaningful traction among younger digital-native retail brands entering the market steadily.
Share: 18% | CAGR: 9.5% (2026 to 2036)
Regional intelligence for 5 additional markets available in the complete report: East Asia, South Asia and Pacific, Latin America, Middle East and Africa, Eastern Europe. Contact sales@marketmindsadvisory.com.
alternative-retailing-technologies-market-country-cagr-analysis-1790006067508

Monetizing Checkout Data and Platform Integration

Alternative retailing technology margins increasingly depend on recurring software licensing and transaction fees rather than one-time hardware sales alone. Vendors that build deep integration into retailer point-of-sale and inventory systems capture disproportionate lifetime value from every deployed store location they serve over multiple contract renewal cycles spanning many years of continuous ongoing service delivery overall.

Per Transaction Software Licensing Revenue Model

Charging a small per-transaction fee on top of hardware sales converts a single deployment into a recurring revenue stream that scales directly with store traffic and sales volume across every location. Vendors report this model generates meaningfully more lifetime value per store than upfront hardware sales alone, often exceeding the original hardware price within 3 years of active deployment across the store network. Retailers accept this pricing structure because it aligns vendor incentives with actual system uptime and transaction accuracy rather than a single one-time sale with no ongoing accountability built in.
Market Impact: Generates 60 percent more customer lifetime value overall

Data Analytics and Inventory Insight Services

Cashierless and computer vision systems generate rich shopper behavior data that retailers increasingly pay extra to access through dedicated analytics dashboards and inventory optimization services built on top of the core checkout platform infrastructure already in place at each of the 85 locations typically covered under a regional chain contract. This data layer commands premium pricing since it helps retailers make merchandising and staffing decisions beyond the checkout function itself entirely across the wider business. Vendors that built strong analytics capability early are winning contract renewals more easily than pure hardware providers lacking comparable software depth.
Market Impact: Adds a full 15 percent analytics revenue premium

Multi Year Enterprise Contract Bundling Strategy

Bundling hardware, software licensing, and ongoing maintenance into a single multi-year enterprise contract locks in predictable recurring revenue while reducing the retailer procurement burden of managing multiple vendor relationships across different systems and store formats nationwide. These bundled contracts typically run 3 to 5 years, giving vendors meaningful revenue visibility for capital planning purposes well ahead of time each fiscal cycle and budget year across the entire enterprise account. Retailers favor this approach since it simplifies vendor management and provides a single point of accountability for overall system performance and long-term reliability.
Market Impact: Locks in a 5 year average contract term

Who Controls the Margin Pool

Concentration is moderate, with the top five vendors by annual shipment revenue holding roughly 38 percent combined share of a fragmented multi-technology category overall today. NCR Voyix leads by a meaningful margin over the next closest challenger, built on decades of point-of-sale hardware relationships and existing enterprise retail contracts that newer entrants struggle to match at comparable scale, reliability, and overall brand trust.
Current competitive activity centers on cashierless technology retrofit programs, live commerce platform integration, and analytics service bundling with core checkout hardware across nearly every major format tracked here today. Legacy point-of-sale vendors continue acquiring computer vision startups to add capability quickly, while venture-backed challengers compete on faster deployment timelines and lower upfront capital requirements for retailers evaluating multiple vendor proposals simultaneously across several store formats.

Emerging pressure comes from Chinese live commerce platform operators expanding internationally, threatening to reshape competitive dynamics beyond their traditional East Asian stronghold entirely within a few short years ahead. Rankings could shift meaningfully if any top-five vendor secures a dominant enterprise contract with a major North American grocery chain or successfully launches a genuine major new breakthrough cashierless retail product line first.
alternative-retailing-technologies-market-company-positioning-matrix-1790006068037

Competitive Moat and Risk Dimensions

NCR VOYIX

Moat: Enterprise retail relationship depth

NCR Voyix holds decades-long point-of-sale hardware relationships with major grocery and retail chains, letting it cross-sell cashierless and analytics upgrades to an existing installed base at low incremental sales cost. That built-in distribution advantage and existing enterprise trust is difficult for standalone cashierless startups to match without years of comparable relationship building.
NCR VOYIX

Risk: Slower innovation than venture rivals

NCR Voyix moves more cautiously on advanced computer vision innovation than smaller venture-backed specialists solely focused on cashierless technology, since legacy hardware represents a larger share of its overall revenue base. If nimble competitors continue capturing enterprise mindshare through faster feature releases, NCR Voyix could lose share in the fastest-growing segments.
AIFI

Moat: First mover cashierless technology credibility

AiFi built its reputation through some of the earliest large-scale cashierless store deployments globally, giving it meaningful reference customer credibility that newer entrants lack entirely. That early-mover advantage lets it command premium pricing and win enterprise pilot programs more easily than less proven competitors entering the space.
AIFI

Risk: Dependence on continued pilot success

AiFi remains dependent on continued high-profile pilot program success to maintain its reputation, since any well-publicized deployment failure could meaningfully damage broader market confidence in cashierless technology generally. If larger, better-capitalized competitors successfully replicate its technology while offering stronger balance sheet guarantees, AiFi could struggle to defend its current market position.

Players Tracked

Prominent Players

NCR Voyix
Diebold Nixdorf
Toshiba Global Commerce Solutions
Fujitsu
ITAB Shop Concept

Other Key Players

Grabango
AiFi
Zippin
Standard Cognition
Trigo Retail
Cantaloupe
Crane Payment Innovations
Wanzl
Everseen
Pensa Systems
Datalogic
Honeywell
Verifone
PAX Technology
Toast Inc

Recent Developments

FEBRUARY 2026

NCR Voyix: product launch

NCR Voyix announced a new cashierless checkout module compatible with its existing point-of-sale hardware installed base, letting current customers add computer vision capability without full system replacement. The launch targets grocery and convenience chains seeking incremental automation without disrupting existing infrastructure investments already in place.
Signal: Signals legacy point-of-sale vendors racing hard to add cashierless capability to installed hardware bases very quickly
MAY 2026

AiFi: funding round

AiFi raised a new funding round to expand its cashierless technology deployment team and accelerate international expansion beyond its current North American and European customer base entirely. The investment will fund additional engineering headcount and expanded regional support infrastructure for new enterprise customers going forward.
Signal: Signals continued strong investor confidence in cashierless technology despite some mixed early market results and setbacks
SEPTEMBER 2026

Diebold Nixdorf: acquisition

Diebold Nixdorf acquired a smaller live commerce integration startup to add social selling capability to its existing retail technology portfolio for enterprise customers worldwide today and going forward. The deal accelerates Diebold Nixdorf entry into the fastest-growing live commerce segment without years of internal platform development work.
Signal: Signals established retail technology vendors acquiring smaller startups quickly for rapid new capability access very strategically

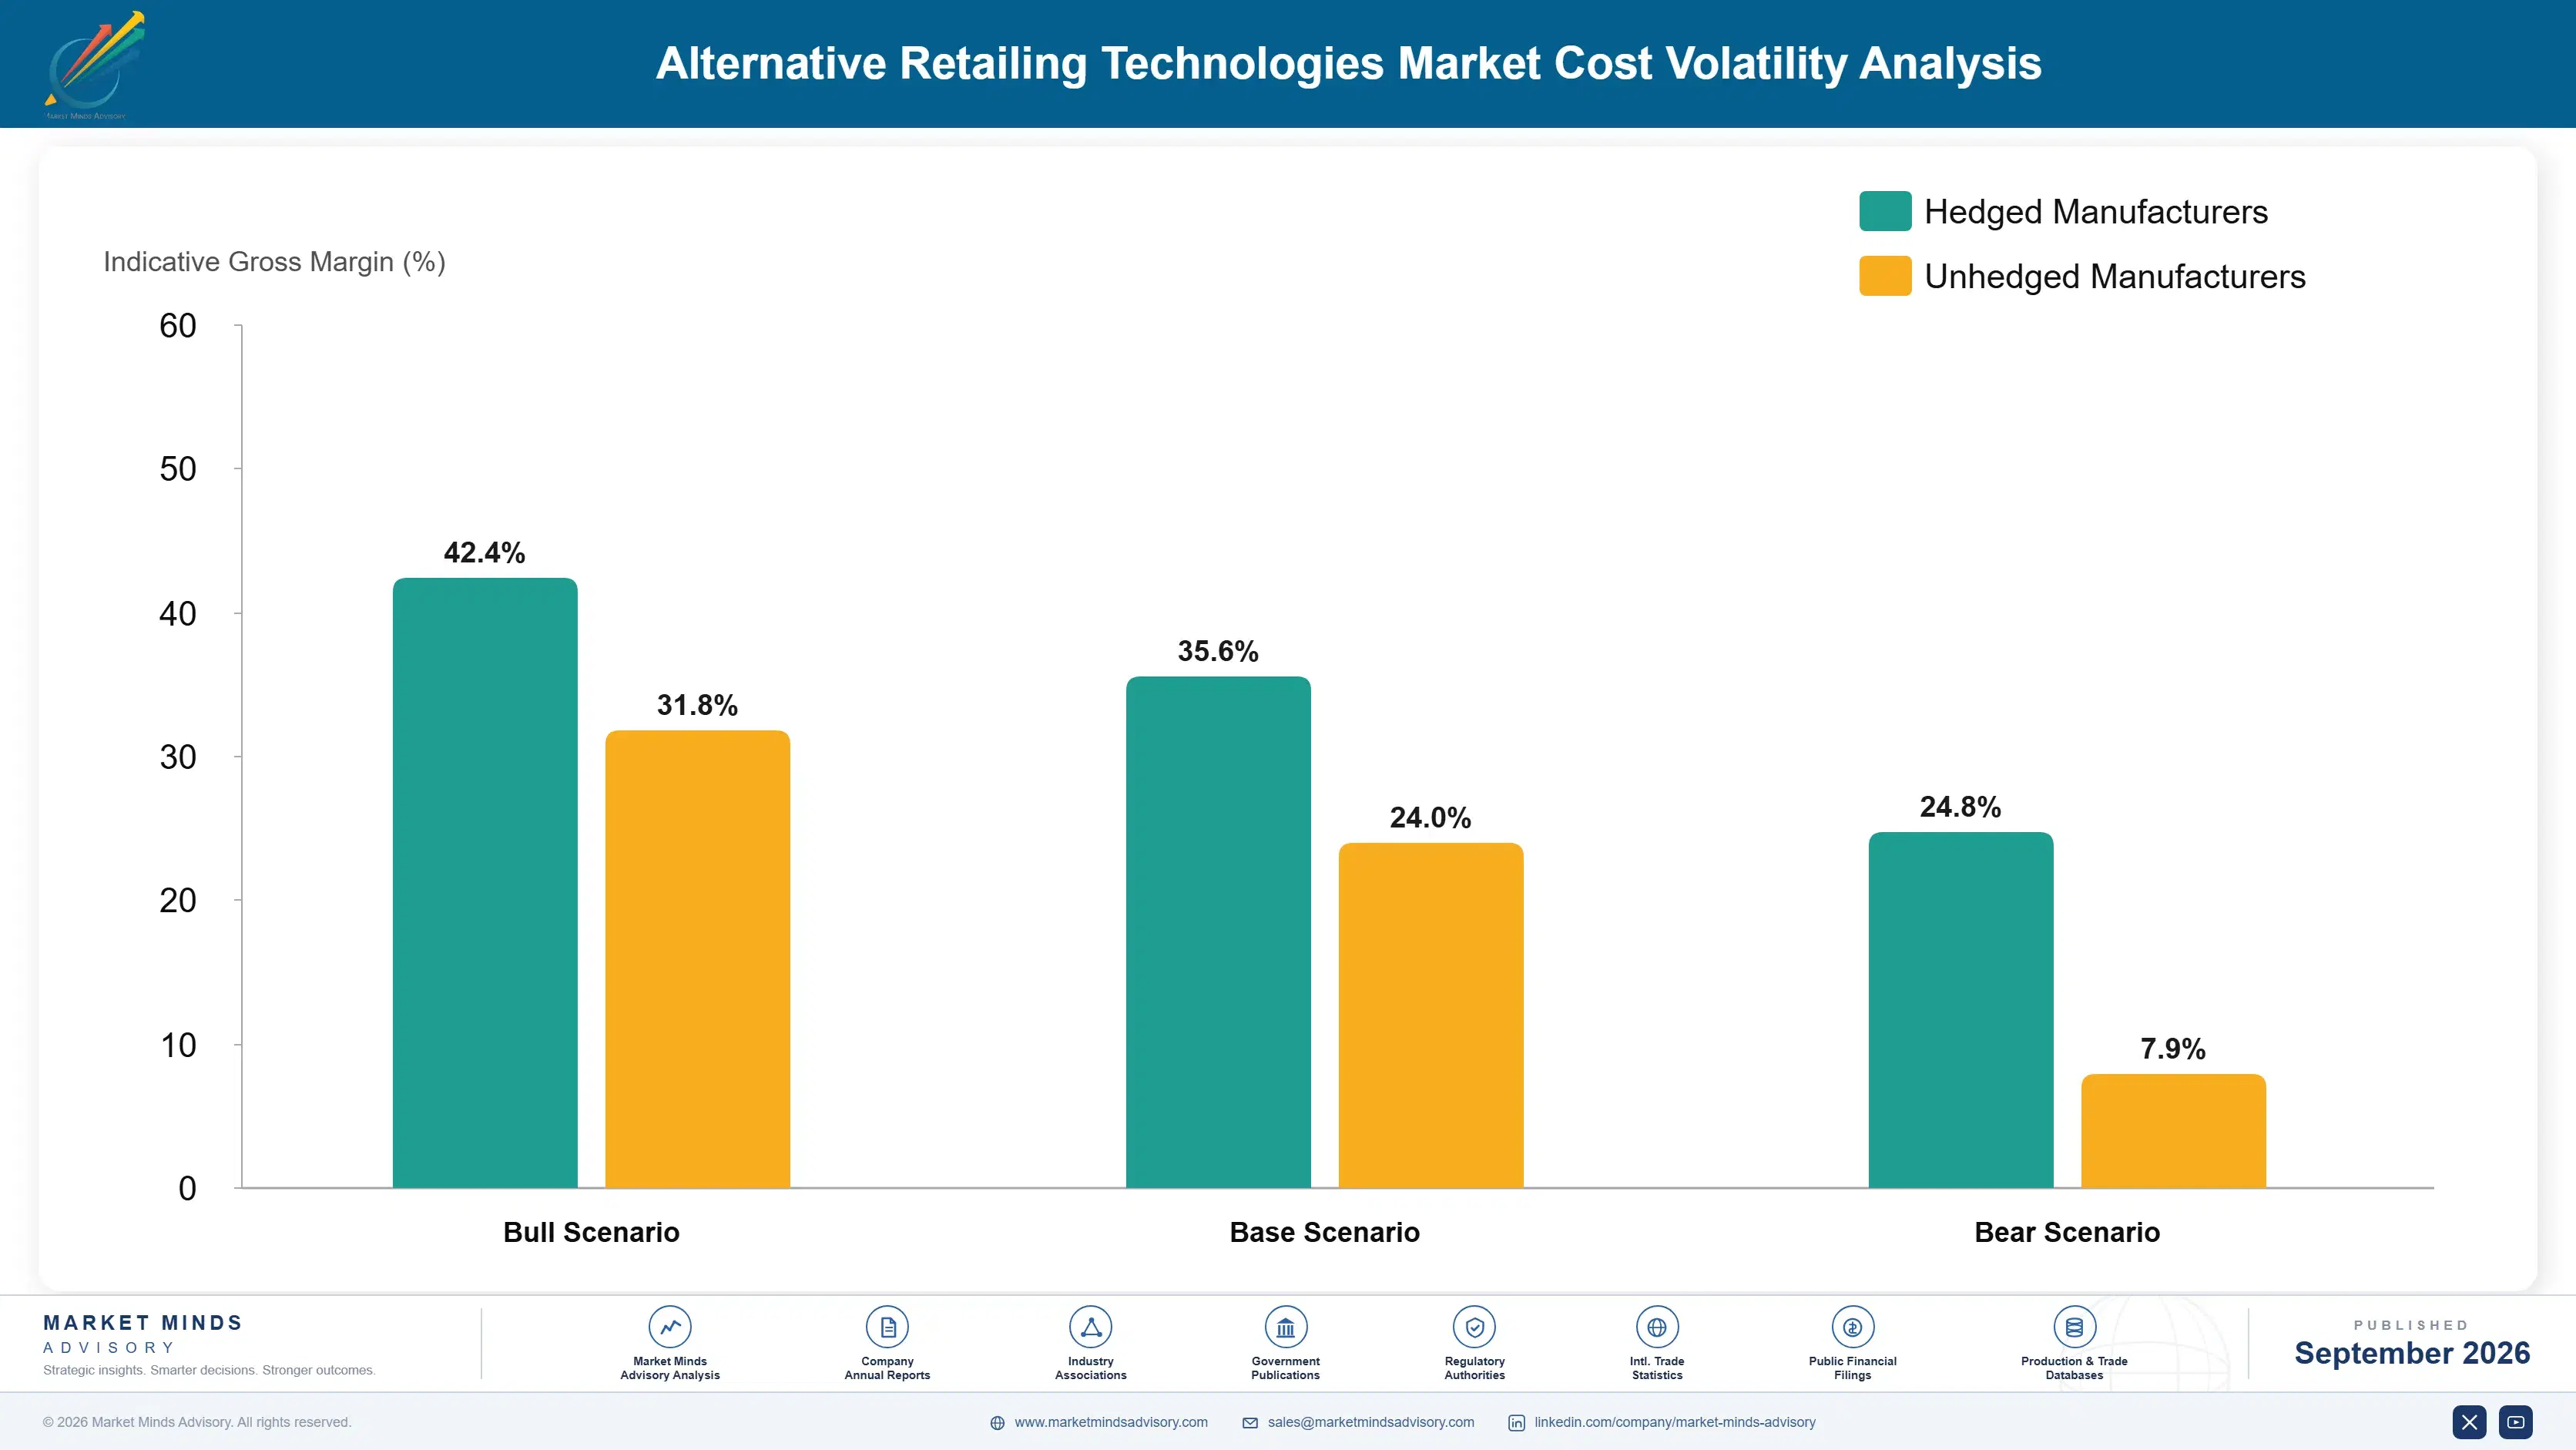
Camera and Sensor Cost Exposure

Computer vision camera arrays and edge computing hardware together represent more than a third of total cashierless deployment cost, sourced predominantly from specialized sensor manufacturers and general purpose semiconductor suppliers who serve broader technology markets beyond retail specifically. Networking equipment, mounting hardware, and installation labor make up most of the remaining deployment cost for a typical mid-size retail store rollout.
Semiconductor and camera sensor prices spiked meaningfully during the 2021 to 2022 global chip shortage, according to a Samsung Electronics annual report, as automotive and consumer electronics demand competed directly with retail technology vendors for the same limited fabrication capacity across shared global manufacturing production lines. Smaller cashierless vendors without long-term component supply agreements faced delivery delays exceeding six months during peak shortage periods, forcing several to delay planned deployments.

Scaled vendors with direct semiconductor manufacturer relationships absorbed that disruption with far less deployment delay than smaller competitors buying components through general electronics distributors at marked-up prices. This exposure gap compounds further since vendors with existing volume purchase agreements received priority allocation ahead of newer entrants lacking established purchasing relationships and long track records with major component suppliers worldwide today and well beyond.
alternative-retailing-technologies-market-cost-volatility-analysis-1790006068236

Multi Year Component Supply Agreements

Locking in semiconductor and camera sensor prices through multi-year supply agreements with major manufacturers shields larger vendors from spot market shortages, though it requires forecasting deployment volume years in advance and carries meaningful penalty exposure if actual demand falls well short of contracted minimums during an unexpected industry slowdown or unforeseen shift in demand.

Component Standardization Across Product Lines

Standardizing camera and sensor components across multiple product lines lets vendors negotiate better volume pricing and simplifies inventory management during supply disruptions across the entire product portfolio and store network overall today. This approach sacrifices some product differentiation flexibility but meaningfully reduces exposure to any single specialized component shortage affecting the broader business overall.

Regional Component Sourcing Diversification

Qualifying alternative component suppliers across multiple geographic regions reduces single-source dependency risk, though it requires additional testing and certification work for each new supplier relationship established over time along with additional money spent each fiscal year. Vendors that diversified sourcing before the last shortage recovered deployment schedules considerably faster than single-source competitors still relying on just one region.

Portfolio Architecture for Margin Defence

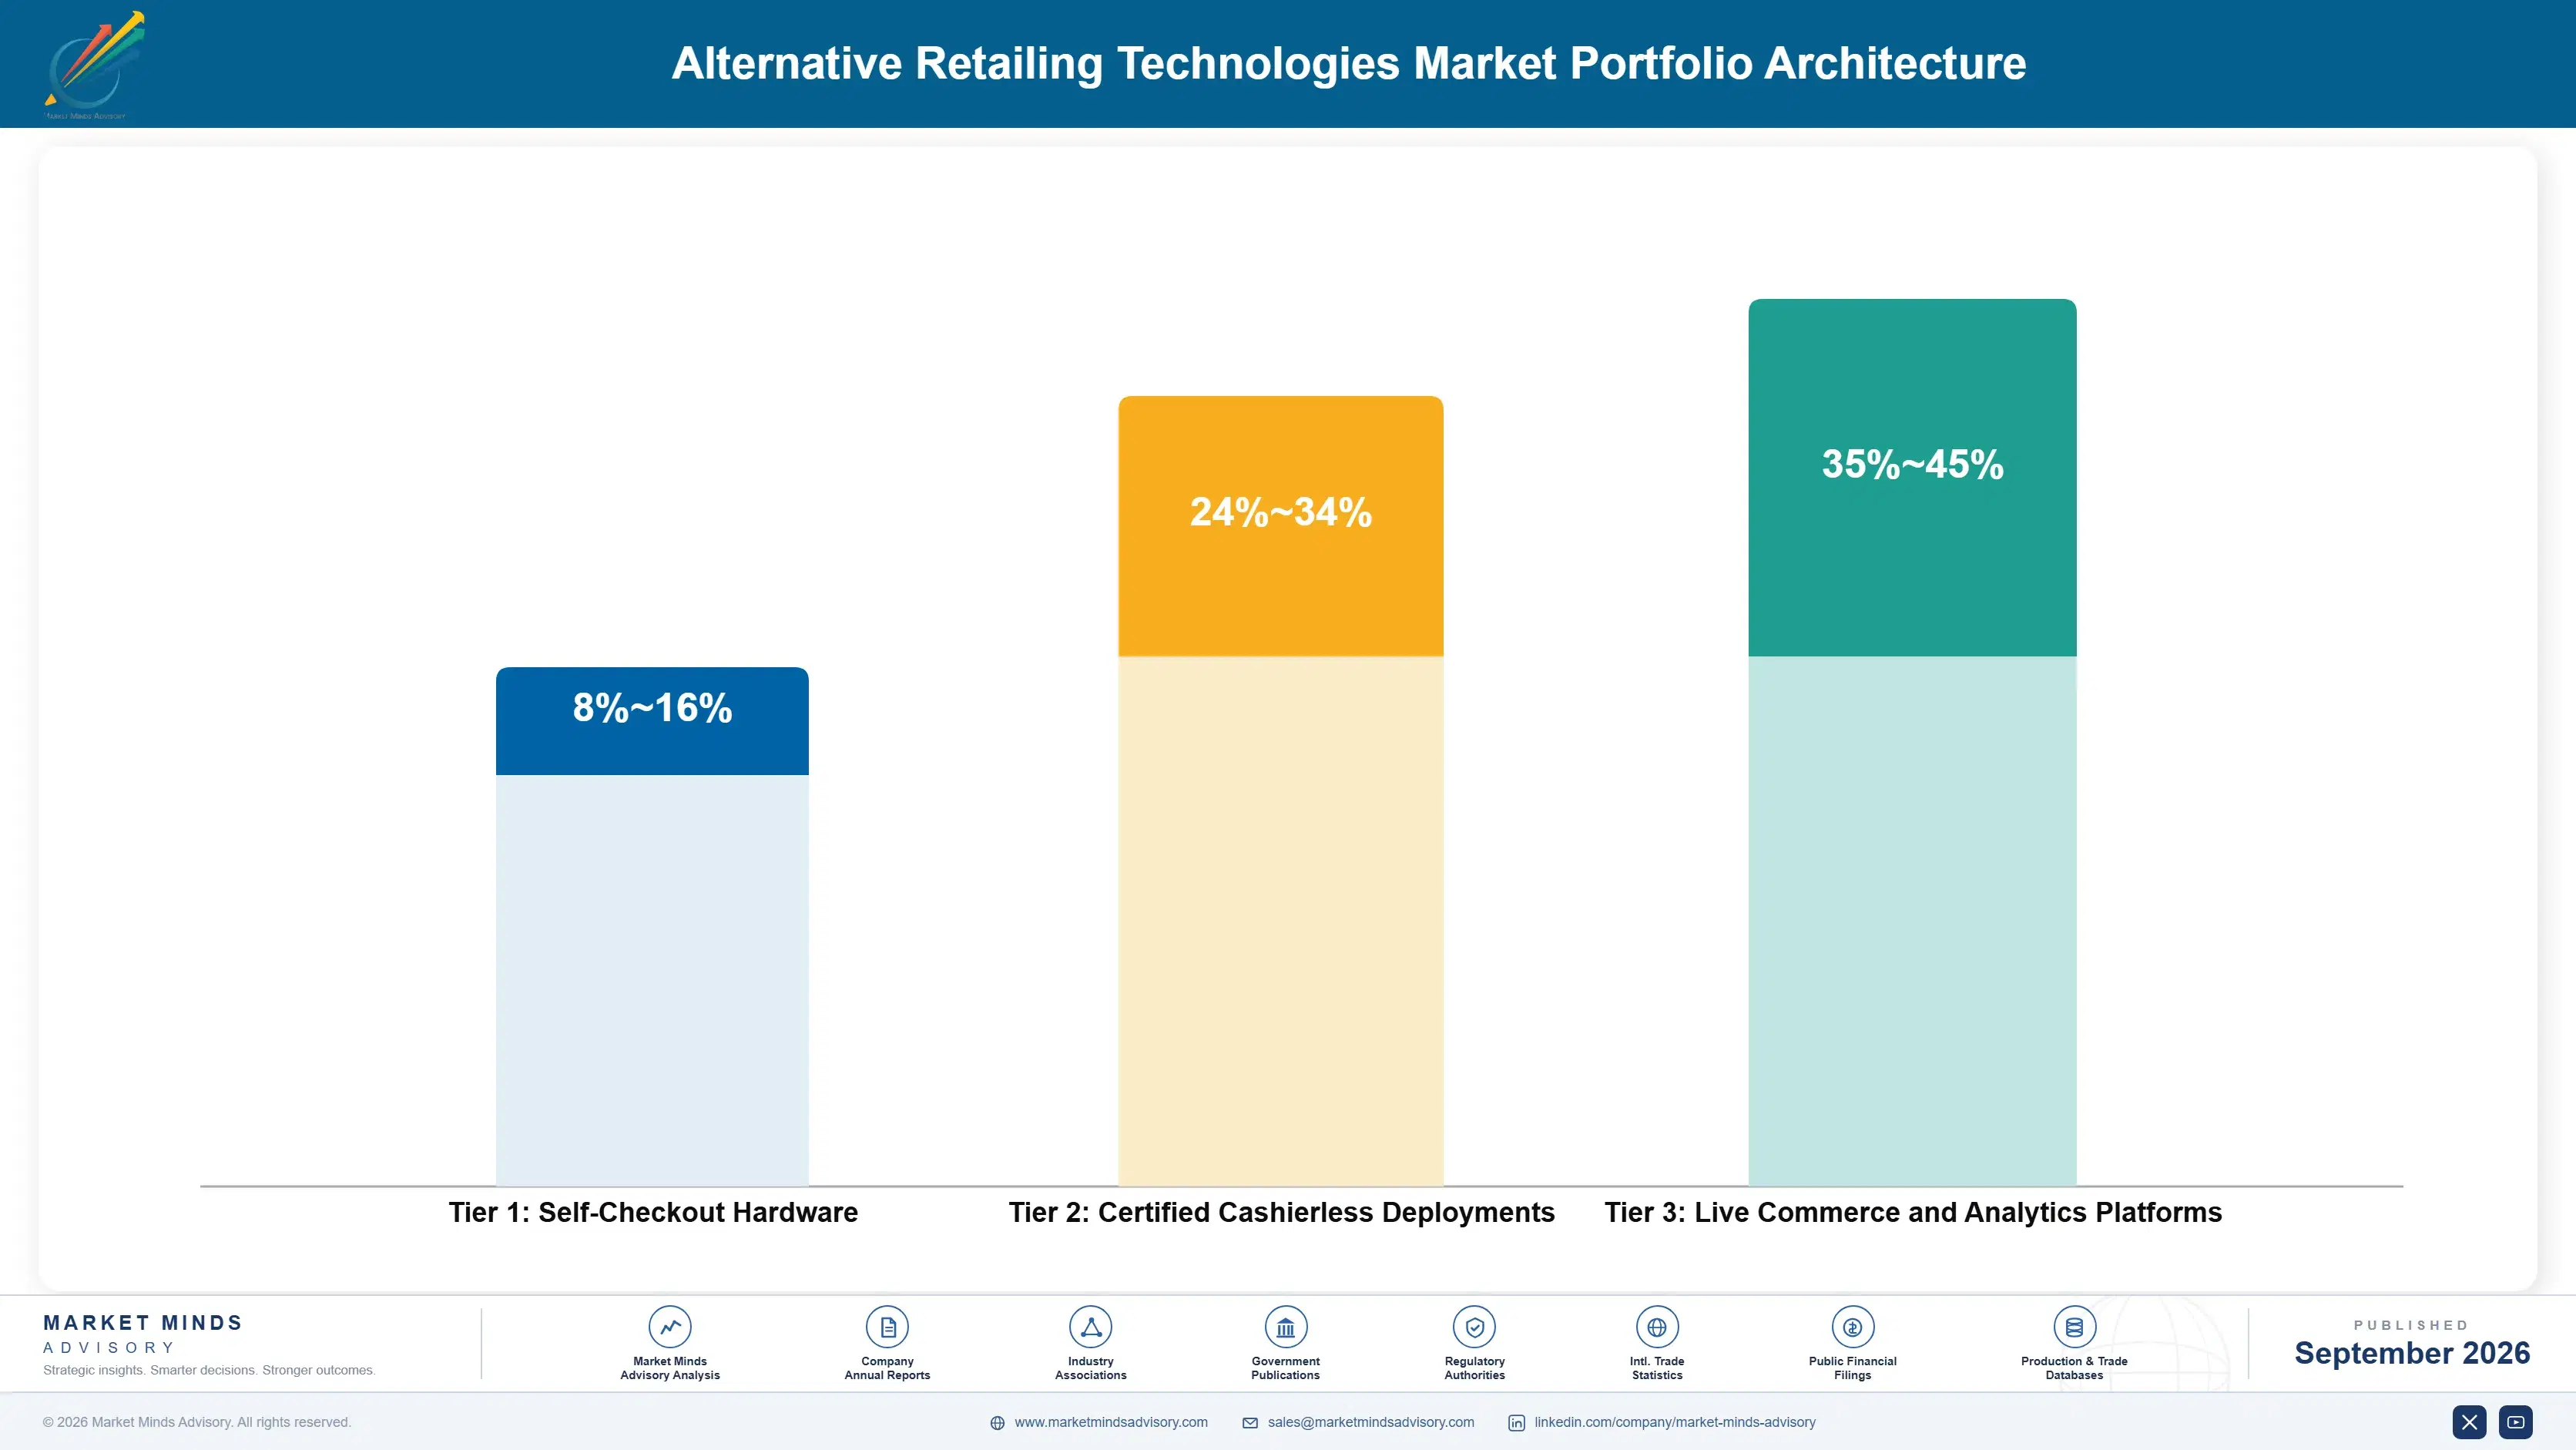
Gross margins vary widely across the portfolio, from thin margins on hardware-only self-checkout sales up to healthy margins on cashierless software licensing and analytics services sold to enterprise retail customers worldwide. Volume sits overwhelmingly in the commodity-adjacent self-checkout tier, but value concentrates in the smaller cashierless and live commerce tiers instead, across nearly every single regional market this full study actually tracks in fine detail.
The tension between chasing hardware volume and protecting margin plays out visibly in vendor sales strategy, where companies must decide how much to discount hardware to win deployment against how much to recoup through recurring software and analytics fees that actually drive long-term profit across the entire full multi-year contract relationship each vendor maintains with its own key enterprise clients.

High-value pools concentrate in cashierless technology and live commerce integration services, where retailers pay for measurable labor savings and incremental sales lift rather than raw hardware specifications alone. That is where most vendors are now directing new product development spend, well ahead of any planned commodity-tier hardware expansion currently under serious boardroom consideration at most enterprise companies right now today.

Self-Checkout Hardware

Thin margin self-checkout hardware sold primarily on price and integration compatibility through enterprise procurement channels, competing almost entirely on unit cost rather than software capability or accuracy performance metrics alone.
Gross Margin: 8-16%

Certified Cashierless Deployments

Certified cashierless technology deployments carrying proven accuracy track records and enterprise support agreements, sold through direct sales relationships at a meaningful premium over basic self-checkout hardware and unproven newer vendors.
Gross Margin: 24-34%

Live Commerce and Analytics Platforms

Advanced live commerce and analytics platforms built around continuous software licensing and per-transaction revenue models, targeting enterprise retailers willing to pay for measurable sales lift and labor savings over time.
Gross Margin: 35-45%
alternative-retailing-technologies-market-portfolio-architecture-1790006068736

High-value Sub-segments and Strategic Watch-out

Cashierless and Autonomous Store Technology

The highest value, fastest growing pocket of the market, driven by cashierless technology adoption and recurring software licensing revenue that extends vendor lifetime value well beyond the initial hardware sale across multiple contract renewal cycles and product generations for many years to come across every major market.
Gross Margin: 35-45%

Certified Cashierless Deployments

A high-value, moderate-growth pocket where certification and enterprise support positioning support durable pricing power even as unit volume growth moderates relative to newer cashierless categories gaining share steadily across every single region tracked worldwide over the entire coming decade and well beyond that particular point.
Gross Margin: 24-34%

Self-Checkout Hardware

The volume core of the market, competing almost entirely on price through enterprise procurement channels, generating thin margins but sustaining the largest absolute deployment base across grocery and convenience chains globally each and every single year without exception across every single major regional market tracked.
Gross Margin: 8-16%

Privacy Regulation and Surveillance Compliance

A strategic watch-out rather than a true revenue segment, where privacy regulation and consumer trust concerns threaten to slow cashierless deployment across multiple regulated jurisdictions worldwide, particularly in Western Europe and several individual US states now enforcing quite strict privacy laws currently already in place.
Gross Margin: n/a

Recurring Software and Expansion Revenue

Alternative retailing technology revenue increasingly resembles annuity revenue through software licensing and per-transaction fees, rather than a one-time hardware sale that concludes the customer relationship for good. Retailers that adopt cashierless checkout typically expand deployment to additional store locations within two years, creating a durable expansion tail beyond the initial pilot contract that compounds meaningfully across the full store network over time.
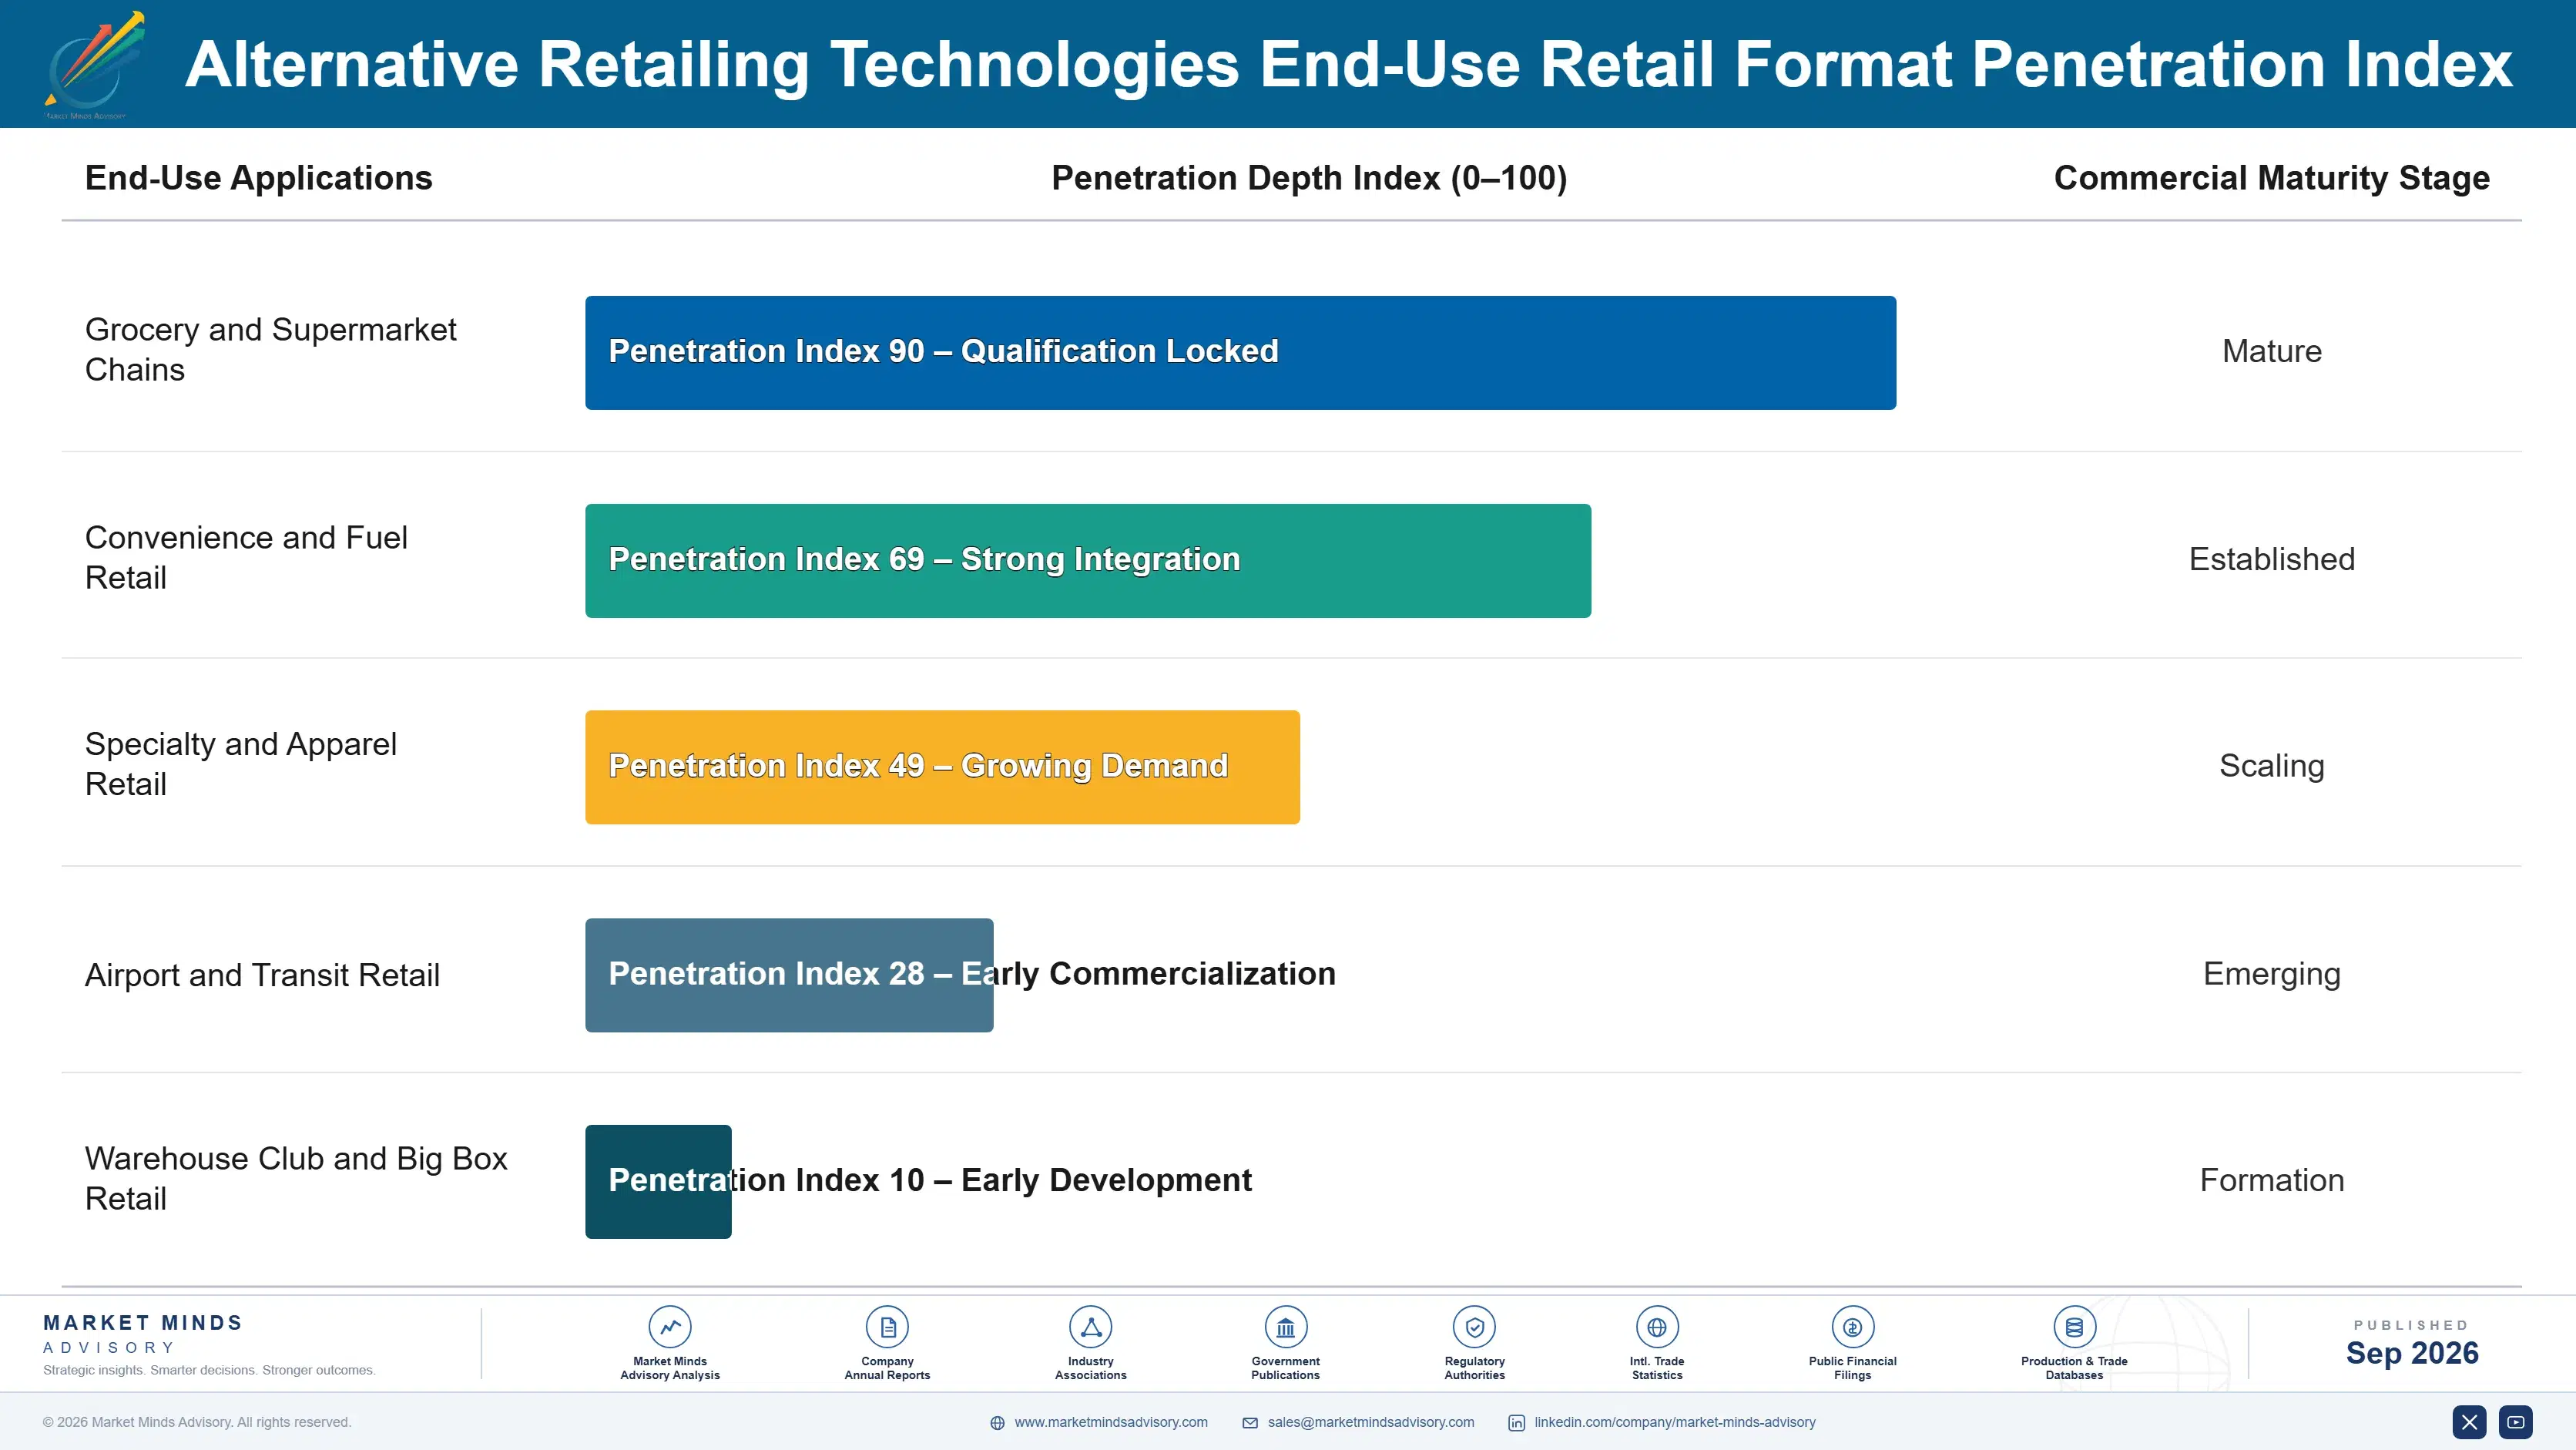
Adoption depth varies sharply by retail format. Grocery and convenience chains adopt self-checkout broadly but cautiously expand cashierless technology store by store as confidence builds over successive fiscal quarters and budget cycles, while specialty and apparel retailers invest more aggressively in live commerce integration to reach younger digital-native shoppers directly through social media platforms, creating a meaningfully different adoption curve within that specific retail vertical entirely each year.

Buyer profiles are shifting as younger retail executives increasingly treat automated checkout and live commerce as standard store infrastructure decisions rather than experimental technology pilots requiring extensive internal justification, broadening the addressable buyer base considerably beyond early flagship store adopters toward much more mainstream regional chains operating on tighter annual capital expenditure budgets overall today.
alternative-retailing-technologies-market-end-use-penetration-index-1790006069233

Where Retail Automation Value Concentrates

These are among the four positions where our research anticipates prominent divergence between winners and laggards over the coming forecast period. Each is grounded in the demand model, the regulatory perimeter, and the announced capacity pipeline.
01 / ACCURACY CERTIFICATION STRATEGY

Accuracy certification separates durable vendors from unproven cashierless challengers

Vendors that invest early in accuracy certification and enterprise reference deployments build a defensible pricing advantage that unproven challengers cannot easily replicate at comparable cost or speed. That advantage compounds as retail chains keep favoring suppliers with proven track records over unproven newer entrants lacking comparable deployment history and reference customers across the industry. Vendors treating certification as optional will find their addressable customer base shrinking steadily as buyer expectations keep rising across nearly every major retail format this study tracks.
02 / RECURRING SOFTWARE REVENUE STRATEGY

Recurring software licensing captures the highest vendor lifetime value overall

Recurring software licensing and per-transaction fees turn a single hardware sale into a multi-year revenue relationship worth substantially more than the initial transaction alone across a comparable ownership period. Vendors committing engineering resources to analytics and data services now will capture disproportionate share of the fastest-growing segment through 2036 as retailers increasingly value the insight layer over raw hardware specifications and unit counts. Competitors relying solely on hardware sales risk losing customers to whichever vendor locks in the software relationship first.
03 / COMPONENT SOURCING DIVERSIFICATION

Component sourcing diversification reduces shortage and disruption exposure meaningfully

Vendors that diversify component sourcing beyond concentrated semiconductor suppliers reduce shortage and disruption exposure that competitors relying on single suppliers cannot absorb as easily during periods of real stress. The 2021 chip shortage demonstrated how quickly deployment timelines can slip for vendors lacking diversified supply relationships across multiple geographic regions and supplier networks worldwide already. Vendors that diversify sourcing earliest will hold a meaningful cost and resilience advantage over slower-moving rivals across the wider industry for years to come ahead.
04 / PRIVACY COMPLIANCE POSITIONING STRATEGY

Privacy compliant deployment configurations determine long term market access

Privacy regulation and consumer trust concerns increasingly determine which cashierless technology configurations retailers can legally and practically deploy across different jurisdictions worldwide today. Vendors investing in privacy-compliant anonymized processing and transparent consumer communication protect deployment flexibility that competitors ignoring these concerns risk losing entirely across regulated markets and jurisdictions worldwide today. This protection becomes more valuable as regulatory scrutiny of biometric and surveillance technology keeps intensifying across multiple major markets worldwide each and every single passing year without any exception whatsoever.

Engagement Snapshot From the Field

A live engagement with an industry participant carrying material or product regulatory and market exposure ahead of a defining policy shift, showing how our research translates into a defensible multi-year portfolio strategy.
MARKET MINDS ADVISORY · CLIENT ENGAGEMENT SUMMARY
Alternative Retailing Technologies Producer Strategic Portfolio Review and Transition Roadmap 2026·Investment Scenario on Alternative Retailing Technologies Exposure Evaluation 2025-26
CLIENT PROFILE
The client is a mid-size regional grocery chain with 85 stores across the entire southeastern United States facing chronic staffing shortages and rising labor costs across nearly every single store location. Annual checkout labor spend was approximately 120 million dollars (client-reported, unverified by MMA) prior to the engagement, with self-checkout representing less than 20 percent of total transaction volume across the chain.
STRATEGIC CHALLENGE
The client faced escalating labor costs and customer complaints about checkout wait times, but leadership remained uncertain whether cashierless technology had matured enough for reliable chain-wide deployment given mixed industry reports and conflicting vendor claims circulating widely online. Leadership needed a credible evaluation framework before committing significant capital to an unproven technology category across the entire store network.
MMA APPROACH
MMA conducted primary interviews with cashierless technology vendors and comparable grocery chains already running pilot programs, benchmarked accuracy and reliability data across multiple vendor proposals, and modeled financial outcomes across three deployment scenarios ranging from limited pilot expansion to full chain-wide rollout spanning multiple future fiscal years and every major store format currently operated nationwide today and beyond.
KEY FINDINGS
  1. Store locations with the highest staffing turnover showed the strongest projected return on cashierless investment, given the highest current labor cost burden relative to sales volume.
  2. Comparable grocery chains running mature cashierless pilots reported checkout accuracy exceeding 98 percent after an initial six-month calibration period at each new store location.
  3. Customer satisfaction scores improved meaningfully at pilot locations once initial skepticism faded, particularly among younger shoppers already comfortable with mobile payment technology.
  4. Hybrid deployment combining cashierless zones alongside traditional staffed lanes tested better than full conversion, preserving customer choice while capturing meaningful labor savings.
CLIENT PROFILE
The client is a mid-size regional grocery chain with 85 stores across the entire southeastern United States facing chronic staffing shortages and rising labor costs across nearly every single store location. Annual checkout labor spend was approximately 120 million dollars (client-reported, unverified by MMA) prior to the engagement, with self-checkout representing less than 20 percent of total transaction volume across the chain.
STRATEGIC CHALLENGE
The client faced escalating labor costs and customer complaints about checkout wait times, but leadership remained uncertain whether cashierless technology had matured enough for reliable chain-wide deployment given mixed industry reports and conflicting vendor claims circulating widely online. Leadership needed a credible evaluation framework before committing significant capital to an unproven technology category across the entire store network.
MMA APPROACH
MMA conducted primary interviews with cashierless technology vendors and comparable grocery chains already running pilot programs, benchmarked accuracy and reliability data across multiple vendor proposals, and modeled financial outcomes across three deployment scenarios ranging from limited pilot expansion to full chain-wide rollout spanning multiple future fiscal years and every major store format currently operated nationwide today and beyond.
KEY FINDINGS
  1. Store locations with the highest staffing turnover showed the strongest projected return on cashierless investment, given the highest current labor cost burden relative to sales volume.
  2. Comparable grocery chains running mature cashierless pilots reported checkout accuracy exceeding 98 percent after an initial six-month calibration period at each new store location.
  3. Customer satisfaction scores improved meaningfully at pilot locations once initial skepticism faded, particularly among younger shoppers already comfortable with mobile payment technology.
  4. Hybrid deployment combining cashierless zones alongside traditional staffed lanes tested better than full conversion, preserving customer choice while capturing meaningful labor savings.
RECOMMENDED STRATEGY
Phase 1: Phase one: deploy cashierless technology at the ten highest-turnover store locations within the first full twelve calendar months of the program. Phase 2: Phase two: expand deployment to fifty additional stores based on phase one accuracy and customer satisfaction results measured very carefully. Phase 3: Phase three: evaluate a full chain-wide rollout based on financial performance across the first sixty five deployed pilot store locations.
OUTCOME
Within eighteen months of initial deployment, the client reported a 12 percent reduction in total checkout labor costs across pilot locations and secured board approval for expanded rollout to fifty additional stores across the chain (client-reported, unverified by MMA), running well ahead of the originally planned rollout schedule.

Frequently Asked Questions

Foundational context covering the market sizes, CAGR, scope, country, region and competition that inform every finding below. This section is provided to cover basics and most often pre-purchase conversations, answered from the MMA Primary Research Dataset.

What is the current size of the Alternative Retailing Technologies Market?

The global alternative retailing technologies market was valued at approximately 18.5 billion dollars in 2025, covering cashierless checkout, smart vending, live commerce platforms, and self-checkout systems worldwide.

How large will the Alternative Retailing Technologies Market be by 2036?

The market is projected to reach approximately 58.32 billion dollars by 2036, up from 20.54 billion dollars in 2026, an incremental gain of roughly 37.78 billion dollars over the forecast period.

What is the CAGR for the Alternative Retailing Technologies Market 2026 to 2036?

The market is expected to grow at a compound annual rate of 11.0 percent between 2026 and 2036, with a bull case near 12.3 percent and a bear case near 9.7 percent annually.

Which segment is growing fastest?

Cashierless and autonomous store technology leads segment growth at 16.0 percent annually, roughly 1.45 times the overall market rate, driven by labor cost pressure and computer vision maturity.

Who are the major companies in the Alternative Retailing Technologies Market?

NCR Voyix, Diebold Nixdorf, Toshiba Global Commerce Solutions, Fujitsu, and ITAB Shop Concept lead the market on annual shipment revenue, together holding roughly 38 percent of combined global share.

Which country is growing fastest?

China leads country-level growth at approximately 15.5 percent annually, driven by massive live commerce platform adoption and very dense urban retail environments found nationwide overall.

Report Segmentation Architecture

The full report scope spans multiple orthogonal segmentation dimensions, with cross-tabulated demand data provided for each dimension pair. Coverage extends further to regional breakdowns, trend trajectories, and the competitive detail needed to support segment-level decision-making.

By Technology Type

  • Self-Checkout Systems
  • Cashierless and Autonomous Store Technology
  • Smart and Autonomous Vending Machines
  • Live Commerce and Social Selling Platforms
  • RFID-Based Automated Retail Kiosks
  • AR/VR Virtual Try-On Platforms

By End-Use Retail Format

  • Grocery and Supermarket Chains
  • Convenience and Fuel Retail
  • Specialty and Apparel Retail
  • Airport and Transit Retail
  • Warehouse Club and Big Box Retail

By Commercial Dimension

  • Direct Enterprise Sales
  • Software Licensing and Subscription
  • System Integrator Partnerships
  • Managed Service Contracts

By Region

  • North America
  • Western Europe
  • East Asia
  • South Asia and Pacific
  • Latin America
  • Middle East and Africa
  • Eastern Europe

Scope, Methodology, and Coverage

Every figure in this report is reproducible from documented input assumptions. The scope below maps the historical period, the forecast horizon, the segmentation dimensions, and the countries covered, alongside the underlying primary and qualitative methodology.
Historical Period
2020 to 2025
Forecast Period
2026 to 2036
Base Year
2025 (USD billions; MMA Primary Research Dataset, September 2026)
Market Definition
The alternative retailing technologies market covers hardware and software systems enabling retail sales outside traditional staffed checkout, including cashierless and autonomous store technology, self-checkout systems, smart vending machines, live commerce and social selling platforms, and RFID-based automated retail kiosks. It excludes traditional staffed point-of-sale terminals, e-commerce websites without live or interactive selling components, and warehouse fulfillment automation.
Quantitative Units
USD Billion, CAGR (%) 2026-2036
Segmentation Dimensions
Technology Type, End-Use Retail Format, Commercial Dimension, Region
Regions Covered
North America, Western Europe, East Asia, South Asia and Pacific, Latin America, Middle East and Africa, Eastern Europe
Countries Covered
US, Canada, Germany, UK, France, China, Japan, South Korea, India, Australia, Brazil, Mexico, UAE, South Africa, Poland
Key Companies Profiled
20
Quantitative Methodology
Primary survey, n=3,800 respondents, Q4 2025, six countries; demand-side model with trade association cross-validation
Qualitative Methodology
47 expert interviews, Q4 2025; applied to validate demand model assumptions, identify emerging dynamics, and assess competitive positioning
Report Format
PDF and XLSX data workbook (Word format preview document)
Publisher
Market Minds Advisory
Report Code
MMA-2026-TEC-702
Published
September 2026
Contact
sales@marketmindsadvisory.com | www.marketmindsadvisory.com

Purchase the full Alternative Retailing Technologies Market Report (2026 to 2036).

The full report delivers a complete strategic assessment of the alternative retailing technologies market, spanning detailed segment-level forecasts, regional demand modeling, and competitive benchmarking across the top twenty market participants. It includes proprietary primary survey data covering three thousand eight hundred respondents and forty-seven expert interviews conducted in the fourth quarter of 2025. Buyers receive access to editable data tables alongside the narrative analysis for internal strategic planning use across technology, operations, and merchandising teams. The analysis is designed to support decisions on vendor selection, deployment sequencing, and capital investment over the coming decade.
Segment level revenue forecasts through the year 2036
Regional market sizing across seven world regions
Competitive benchmarking of twenty key market participants
Editable data tables for internal strategic planning
Primary survey data from 3,800 global respondents
Expert interview insights from 47 industry practitioners

Built For The People Who Decide

From boardroom strategy to bench-side execution, this report is read cover-to-cover by leaders shaping the next decade of their industry, turning demand scenarios, market dynamics and valuation benchmarks into decisions.
CXOs/ Presidents/ VPs/ Managers
M&A and Corporate Development
Strategy Teams and R&D Heads
Procurement and Product Directors
Regulatory and Compliance Leaders
Investor Relations and Equity Analysts