Market Minds Advisory
Alternative Financing Market

Alternative Financing Market: Built By Capital Rules, Not By Demand

Banks did not choose to stop lending to the middle market. Capital rules made it expensive, the loans moved to funds facing no such charge, and roughly 94% are now valued by whoever owns them.

Lead Analyst

Published

September 2026

Make Smarter Decisions with Customized Research Insights

Request a free sample report and evaluate market opportunities, growth trends, and competitive dynamics relevant to your business needs.

2025 MARKET VALUE$46.5BMarket Size 2025
2036 FORECAST VALUE$152.5BBase Case , 2026 to 2036
CAGR 2026 TO 203611.4 %Bull 12.6% / Bear 10.2%
INCREMENTAL OPPORTUNITY$100.7BNet 10- year value creation
EXPANSION MULTIPLE2.94x2036 value over 2026 base
Strategic Levers
M&A Pipeline
Regional Outlook
Country Rankings
Competitive Intelligence
Segmental Deep-dive
Call-Us : 91 93563 13602

Executive Snapshot and Market Trajectory

Nobody designed this category deliberately. Capital rules made mid-market corporate lending expensive on a bank balance sheet, so it migrated to funds carrying no equivalent charge, and the largest reallocation of lending in modern finance followed. Nobody involved expressed any preference at all here.
North America holds 40% of revenue, above the usual regional band, because private credit assets concentrate there more heavily than in any other market. Revenue-based and recurring revenue financing grows at 17.1%, half again the market rate of 11.4%, since repayment taken as a share of monthly turnover suits businesses that fixed instalments never fitted properly at all. Fixed instalments were always simply the wrong shape for that particular kind of business entirely.
Concentration reaches only 29% across managers competing on origination rather than on capital, which everybody now has. Around 94% of these loans are valued by the manager collecting the fee on them, and the rising share of interest accrued rather than paid in cash is what everybody watches most nervously. A loan accruing rather than paying still reports as performing on every statement anybody ever produces about it anywhere.
Market Definition
The market covers management, origination and net interest revenue earned by non-bank providers of business financing, spanning private credit and direct lending, asset-based lending and structured facilities, revenue-based and recurring revenue financing, trade and supply chain finance funds, merchant cash advance and receivables purchase, and marketplace and crowdfunded lending. Bank corporate lending revenue, private equity and venture capital management fees, public bond underwriting, consumer lending of every form, and residential mortgage finance are excluded.
Base Year Value
$46.5B in 2025 (MMA Primary Research Dataset, August 2026)
Forecast Period
2026 to 2036, eleven discrete annual values
CAGR
11.4% base case. Bull 12.6%. Bear 10.2%.
Fastest Growth Segment
Revenue-Based and Recurring Revenue Financing: 17.1% CAGR
Fastest Growth Country
India: 13.4% CAGR
Fastest Growth Region
South Asia and Pacific: 13.6% CAGR
Largest Region
North America: 40% of 2025 global value
Market Leaders
Blackstone Credit, Ares Management, Apollo Global Management, Blue Owl Capital, HPS Investment Partners. Source: MMA Analysis based on disclosed private credit and alternative financing management and net interest revenue, company annual reports 2025.
Primary Survey
n=3,800 procurement and R&D decision-makers, Q4 2025, six countries
Methodology
Demand-side build-up, cross-validated against public data, 47 expert interviews

Alternative Financing Market Forecast Scenarios

alternative-financing-market-size-forecast-scenario-1787914656196
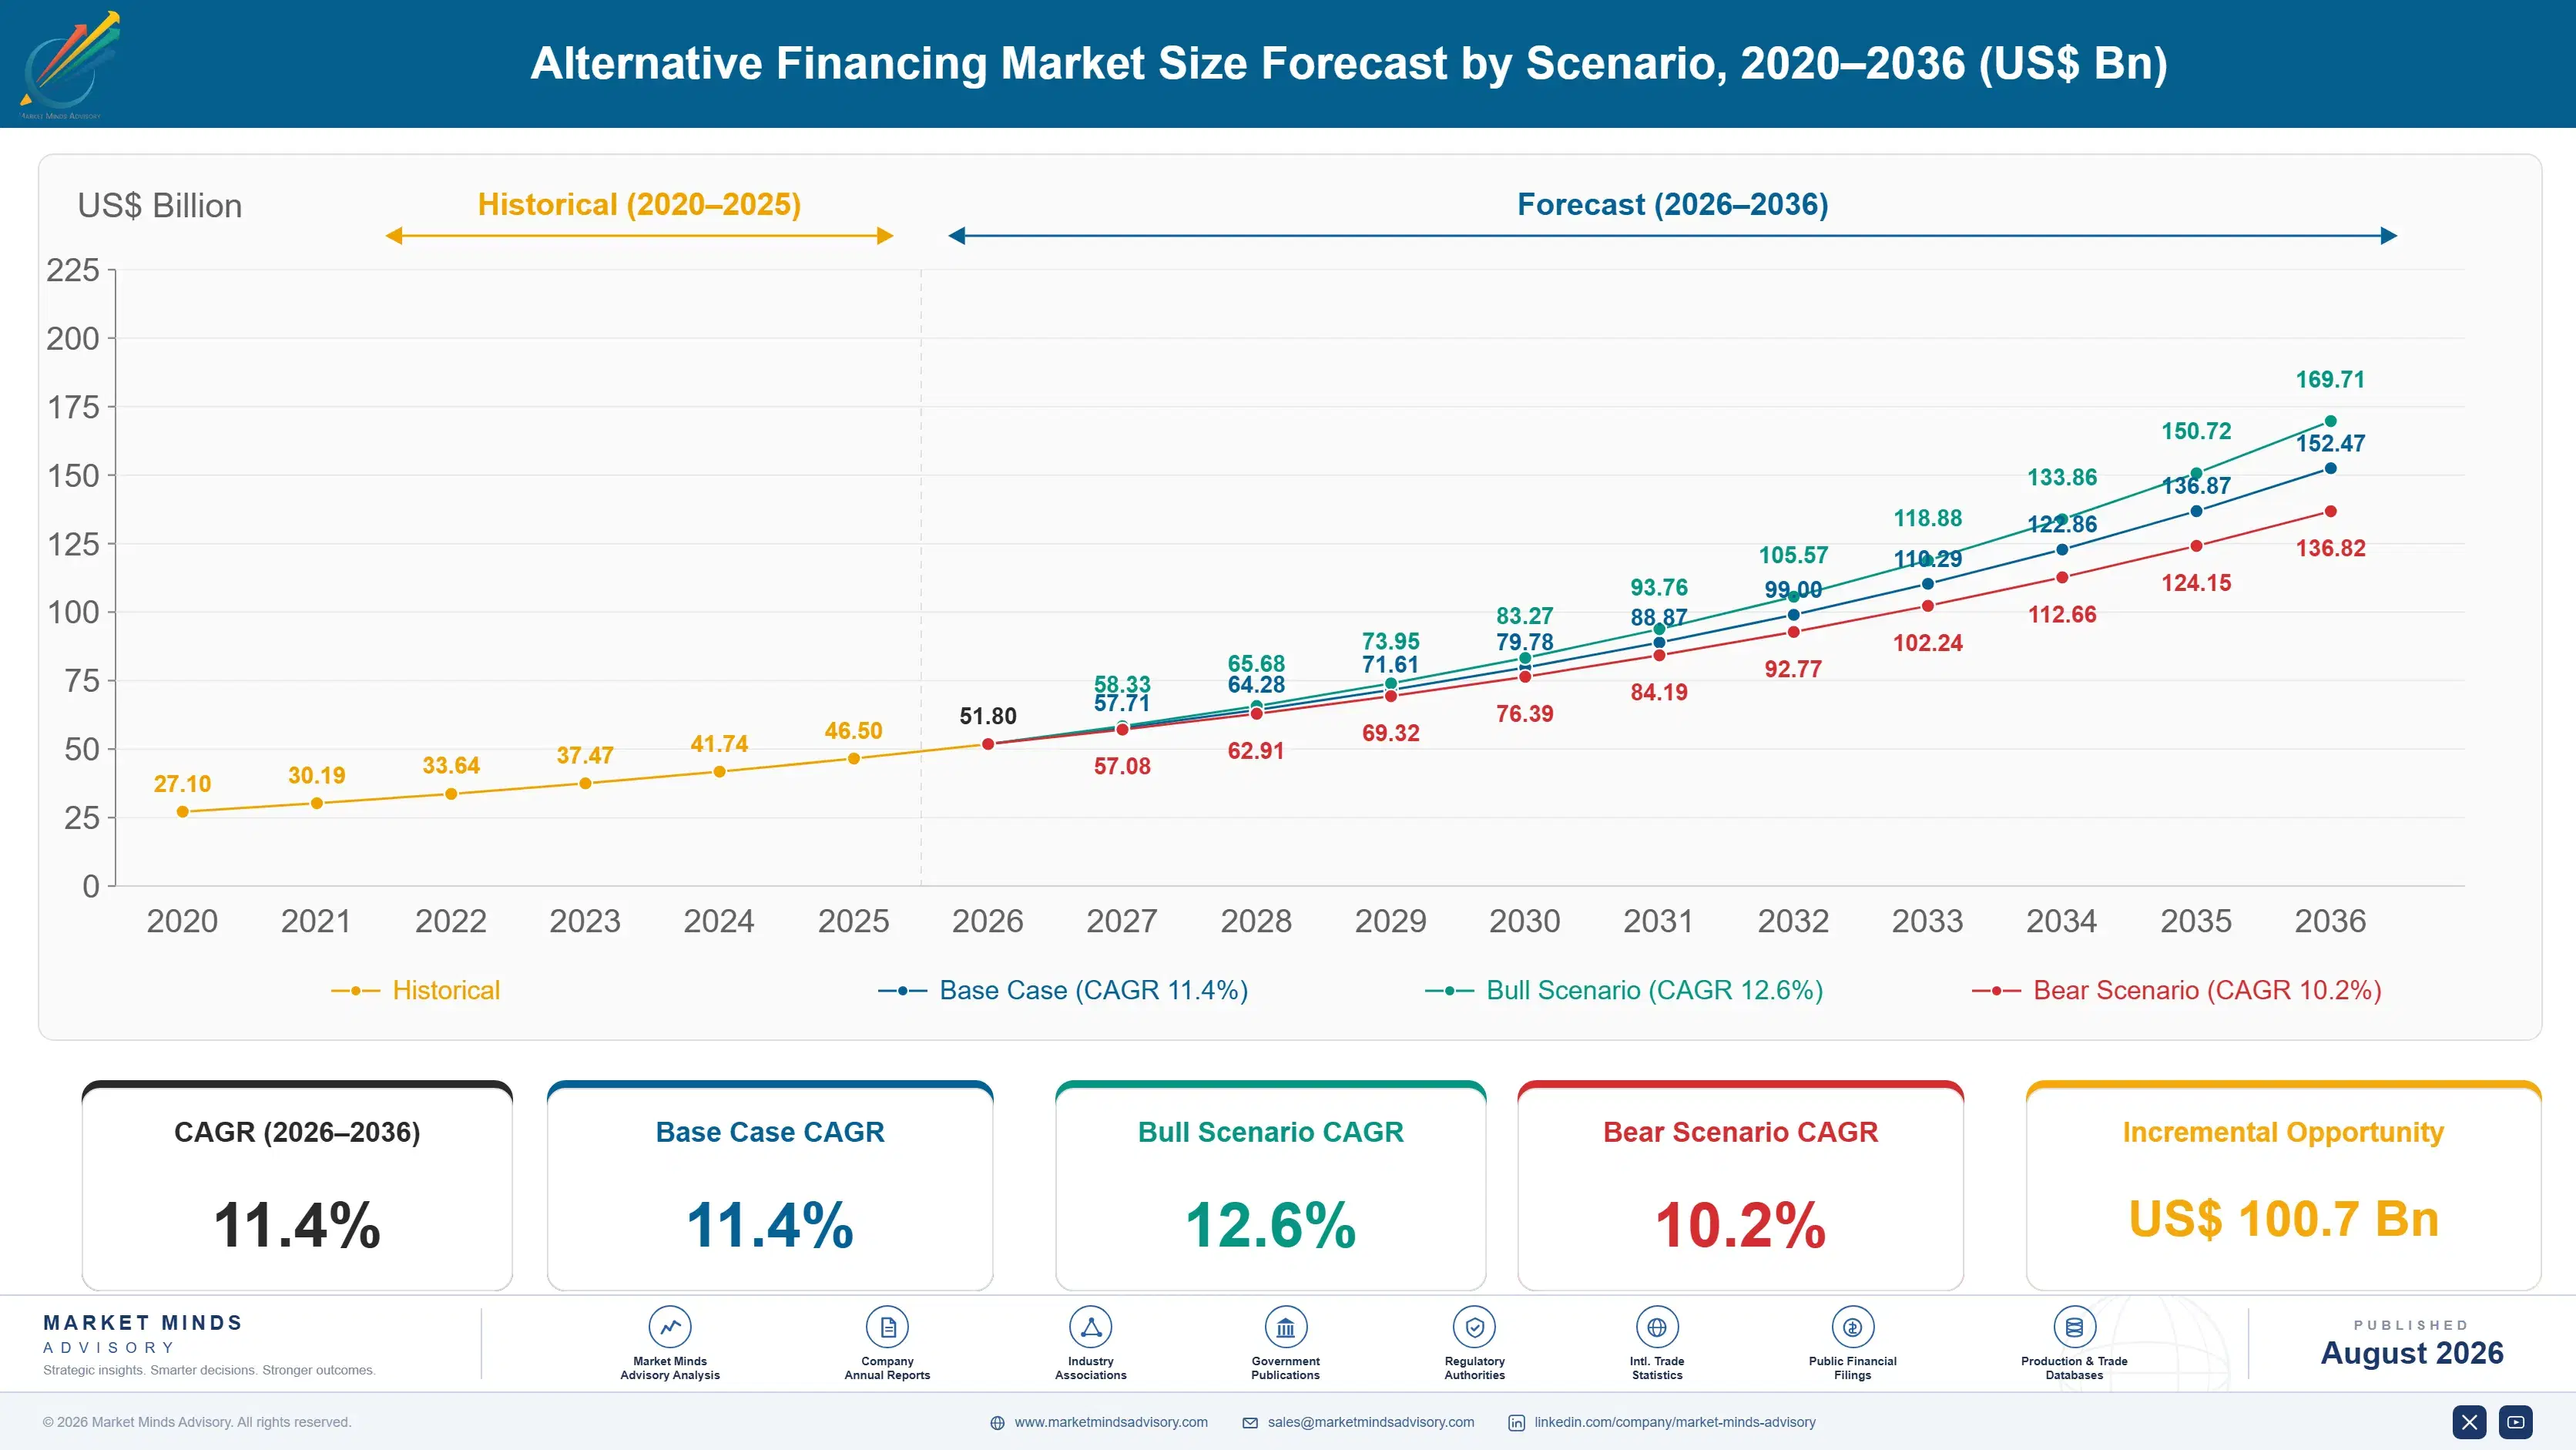
Growth from 2020 to 2025 ran at 10.2% and two quite different things happened inside it. Institutional allocators moved enormous sums into private credit while rates were low and yields elsewhere were not. Then rates rose, floating coupons repriced upward and the asset looked excellent, right up until borrowers began accruing interest rather than paying it. The retail-funded marketplace model failed almost entirely over the same period.
The 11.4% base case rests on three mechanisms. Revenue-based financing keeps growing because repayment linked to turnover suits recurring revenue businesses that fixed instalments never fitted. Trade and supply chain finance funds keep recovering as investors return with considerably better questions than they asked before. And Indian private credit keeps expanding into gaps domestic banks decline for their own reasons. None of the three depends on rates going anywhere at all.
The bull case at 12.6% assumes bank capital treatment stays unchanged and the asset class keeps absorbing lending that regulation prices out of banking. The bear case at 10.2% is a credit cycle exposing manager valuations that nobody independent has tested, since around 94% of these loans are marked by the party earning fees on them and payment-in-kind interest is already climbing.

Who Marks The Loan Book

This entire category exists because of a capital rule. Holding a mid-market corporate loan obliges a bank to set aside roughly 8% more capital than a fund faces holding the identical asset, which made the same lending uneconomic in one place and attractive in another. The borrowers did not change and the credit did not change. Regulation moved a trillion dollars of lending and called it market development.
FIVE-FIRM CONCENTRATION29%Share of category revenue held by the largest credit managers
PAYMENT-IN-KIND SHARE12%Loan income accrued rather than actually received in cash
BANK CAPITAL DIFFERENTIAL8%Additional capital a bank holds against equivalent lending
REVENUE REPAYMENT MULTIPLE1.35Total repaid against the amount originally advanced here
MERCHANT ADVANCE COST72%Annualised charge on a receivables purchase arrangement here
MANAGER MARKED ASSETS94%Loan values set by the manager rather than any market
Nobody independent values these loans. Around 94% of private credit assets carry marks set by the manager earning fees on them, since the loans never trade and no observable price exists. Auditors review methodology rather than price. The honest defence is that no better mechanism exists for illiquid assets. The honest concern is that whoever marks the book is paid on the mark.
Payment-in-kind interest is the tell everybody watches. When a borrower stops paying cash interest and accrues it instead, the loan looks entirely performing while producing no cash. That share now sits near 12% and has been climbing. Some of it is deliberate structuring agreed at origination. Some of it is a borrower that cannot pay, dressed as structuring by everybody with an interest in saying so.
"Ask a credit manager how the book is performing and you get a default rate. Ask what proportion of interest arrived as cash last quarter and the conversation changes character entirely. Only one of those two numbers is difficult to arrange."
Director, Private Credit Practice · MMA Private Credit and Non-Bank Finance Practice · August 2026

Market Trends

Repayment Linked To Turnover Rather Than Calendar

Revenue-based financing takes a fixed percentage of monthly turnover until a multiple of around 1.35 times has been repaid, with no fixed maturity and no equity given up, which suits recurring revenue businesses that fixed instalments never fitted properly. That segment grows at 17.1%. It fails badly for anything seasonal or lumpy, since a quiet quarter simply extends the term rather than triggering any default that anybody has to acknowledge. Nobody defaults on a revenue-linked facility in a bad quarter, which is either its greatest merit or its most convenient feature.
Market Impact: Reflects an 8% capital differential
Accrued Interest Rises Faster Than Anybody Discusses

Payment-in-kind interest now represents around 12% of income across private credit books and has been climbing steadily, which matters because a loan accruing rather than paying still counts as performing on every report anybody produces. Some of that was structured deliberately at origination for genuinely good reasons. Some of it is a borrower unable to pay cash, and telling those two apart from outside a manager's own reporting is close to impossible. Nobody outside the manager can distinguish the two, and everybody inside has quite good reasons not to try.
Market Impact: Grows Indian lending at 13.4%

Market Opportunities and Growth Drivers

Capital Rules Keep Pushing Lending Out Of Banks

A bank holding a mid-market corporate loan sets aside roughly 8% more capital than a fund holding the identical exposure, which makes the same credit uneconomic on one balance sheet and attractive on another without anything about the borrower changing at all. That differential has not narrowed and shows no sign of doing so. Every tightening of bank capital treatment enlarges this category by exactly the amount it removes from banking. Nobody in banking chose this outcome at all and nobody in credit funds engineered any of it either originally.
Market Impact: Covers 94% of held assets

Indian Corporate Credit Gaps Attract Direct Lenders

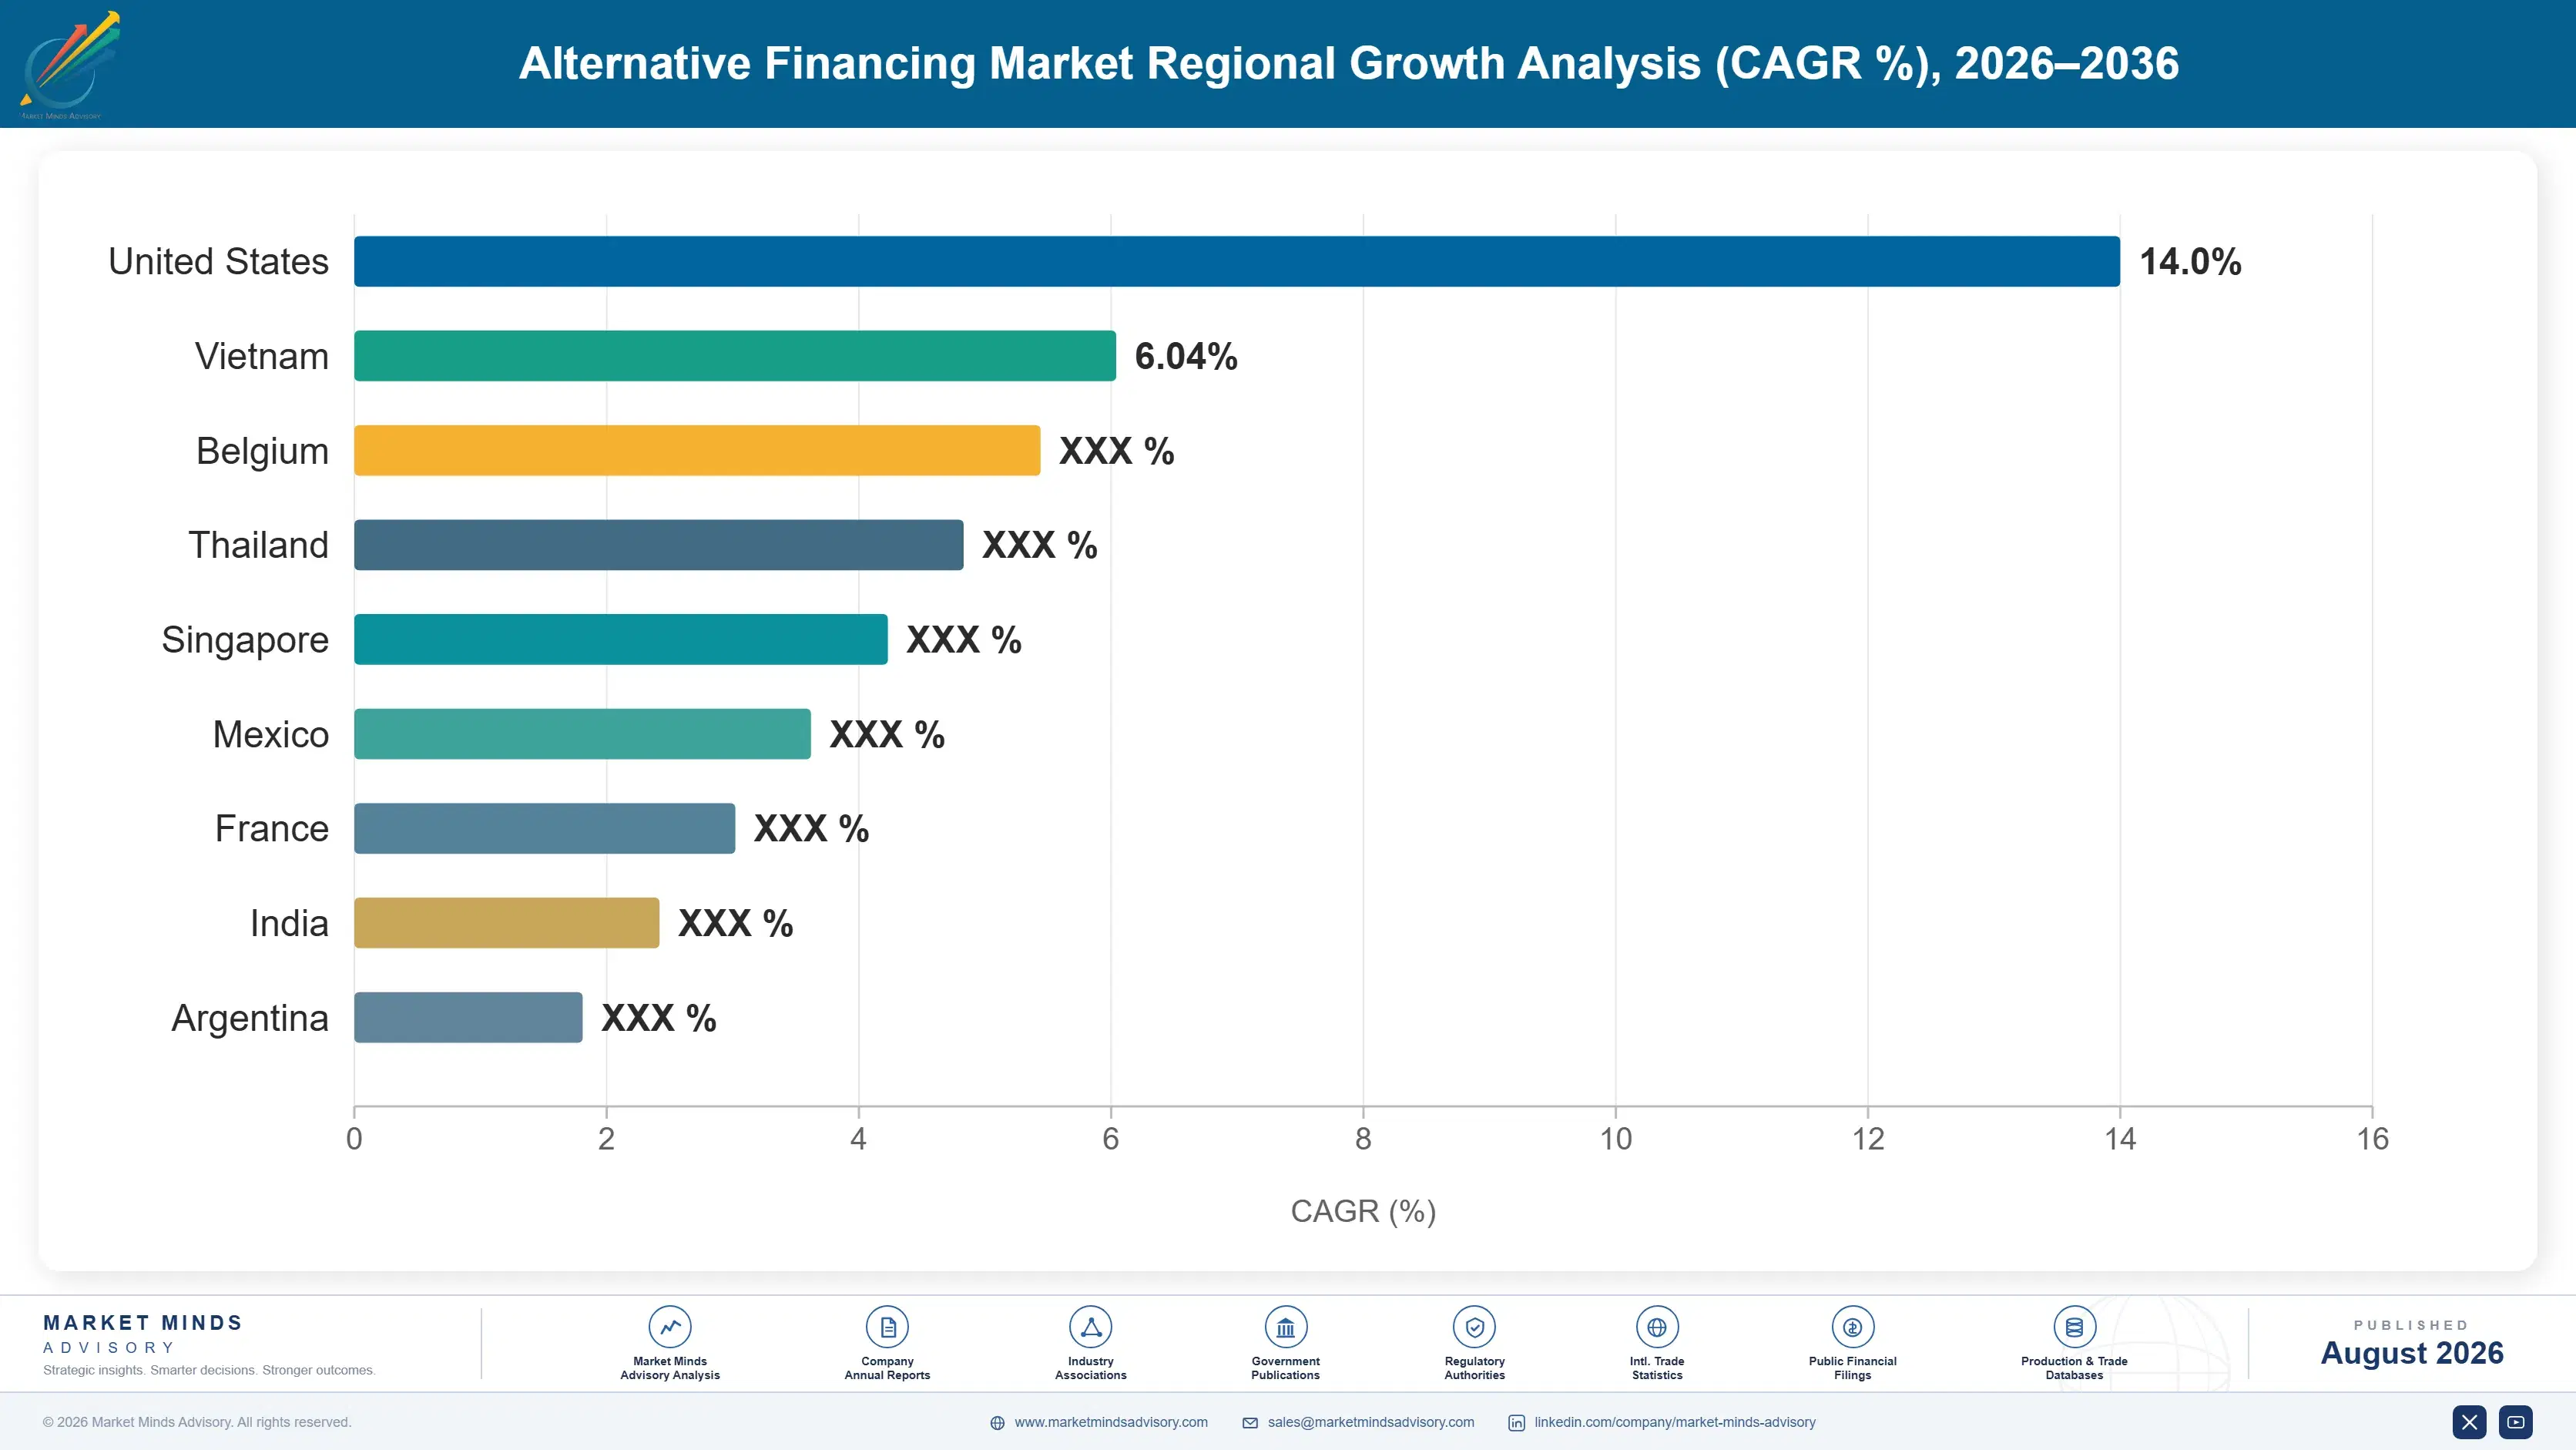
Domestic banks across India continue declining categories of corporate and mid-market credit for reasons of concentration, sector policy and legacy caution rather than any assessment of the individual borrower, which leaves genuine businesses unable to fund growth. India grows fastest at 13.4%. Enforcement timelines have improved considerably under insolvency reform, which is what made the risk assessable for international managers in the first place. Enforcement predictability rather than borrower quality was always the obstacle, and reform addressed exactly that rather than anything about the companies wanting to borrow the money.
Market Impact: Charges 72% annualised effective cost

Market Restraints and Challenges

The Person Marking The Book Collects The Fee

Around 94% of these loans carry valuations set by the manager earning fees on them, because no observable price exists and the assets never trade. Root cause is genuine illiquidity rather than any bad faith. Commercial impact is that reported performance has not been tested against a market in this cycle. Mitigation involves third-party valuation, cash yield disclosure and secondary transaction evidence, none of which allocators have demanded consistently. No independent process has priced this book through a genuine downturn anywhere, which is a sentence that will read very differently in three years.
Market Impact: Repays 1.35 times capital advanced

Merchant Advances Sit Outside Lending Rules Deliberately

Purchasing future receivables at a discount is legally a purchase rather than a loan, which has kept effective costs near 72% annualised outside interest rate regulation in most jurisdictions for decades. Root cause is the legal form rather than the economic substance. Commercial impact is reputational contamination across the whole category. Mitigation has arrived as state disclosure laws requiring annualised cost figures, which several providers fought hard and lost. The legal form held for decades and the disclosure requirement arrived anyway, which is generally how all these arguments eventually end.
Market Impact: Reaches 12% of loan income
3 additional market trends, 4 additional growth drivers, and 2 additional restraints and challenges are covered in the full report. Contact sales@marketmindsadvisory.com to access the complete intelligence.

Segment CAGR and Growth Architecture

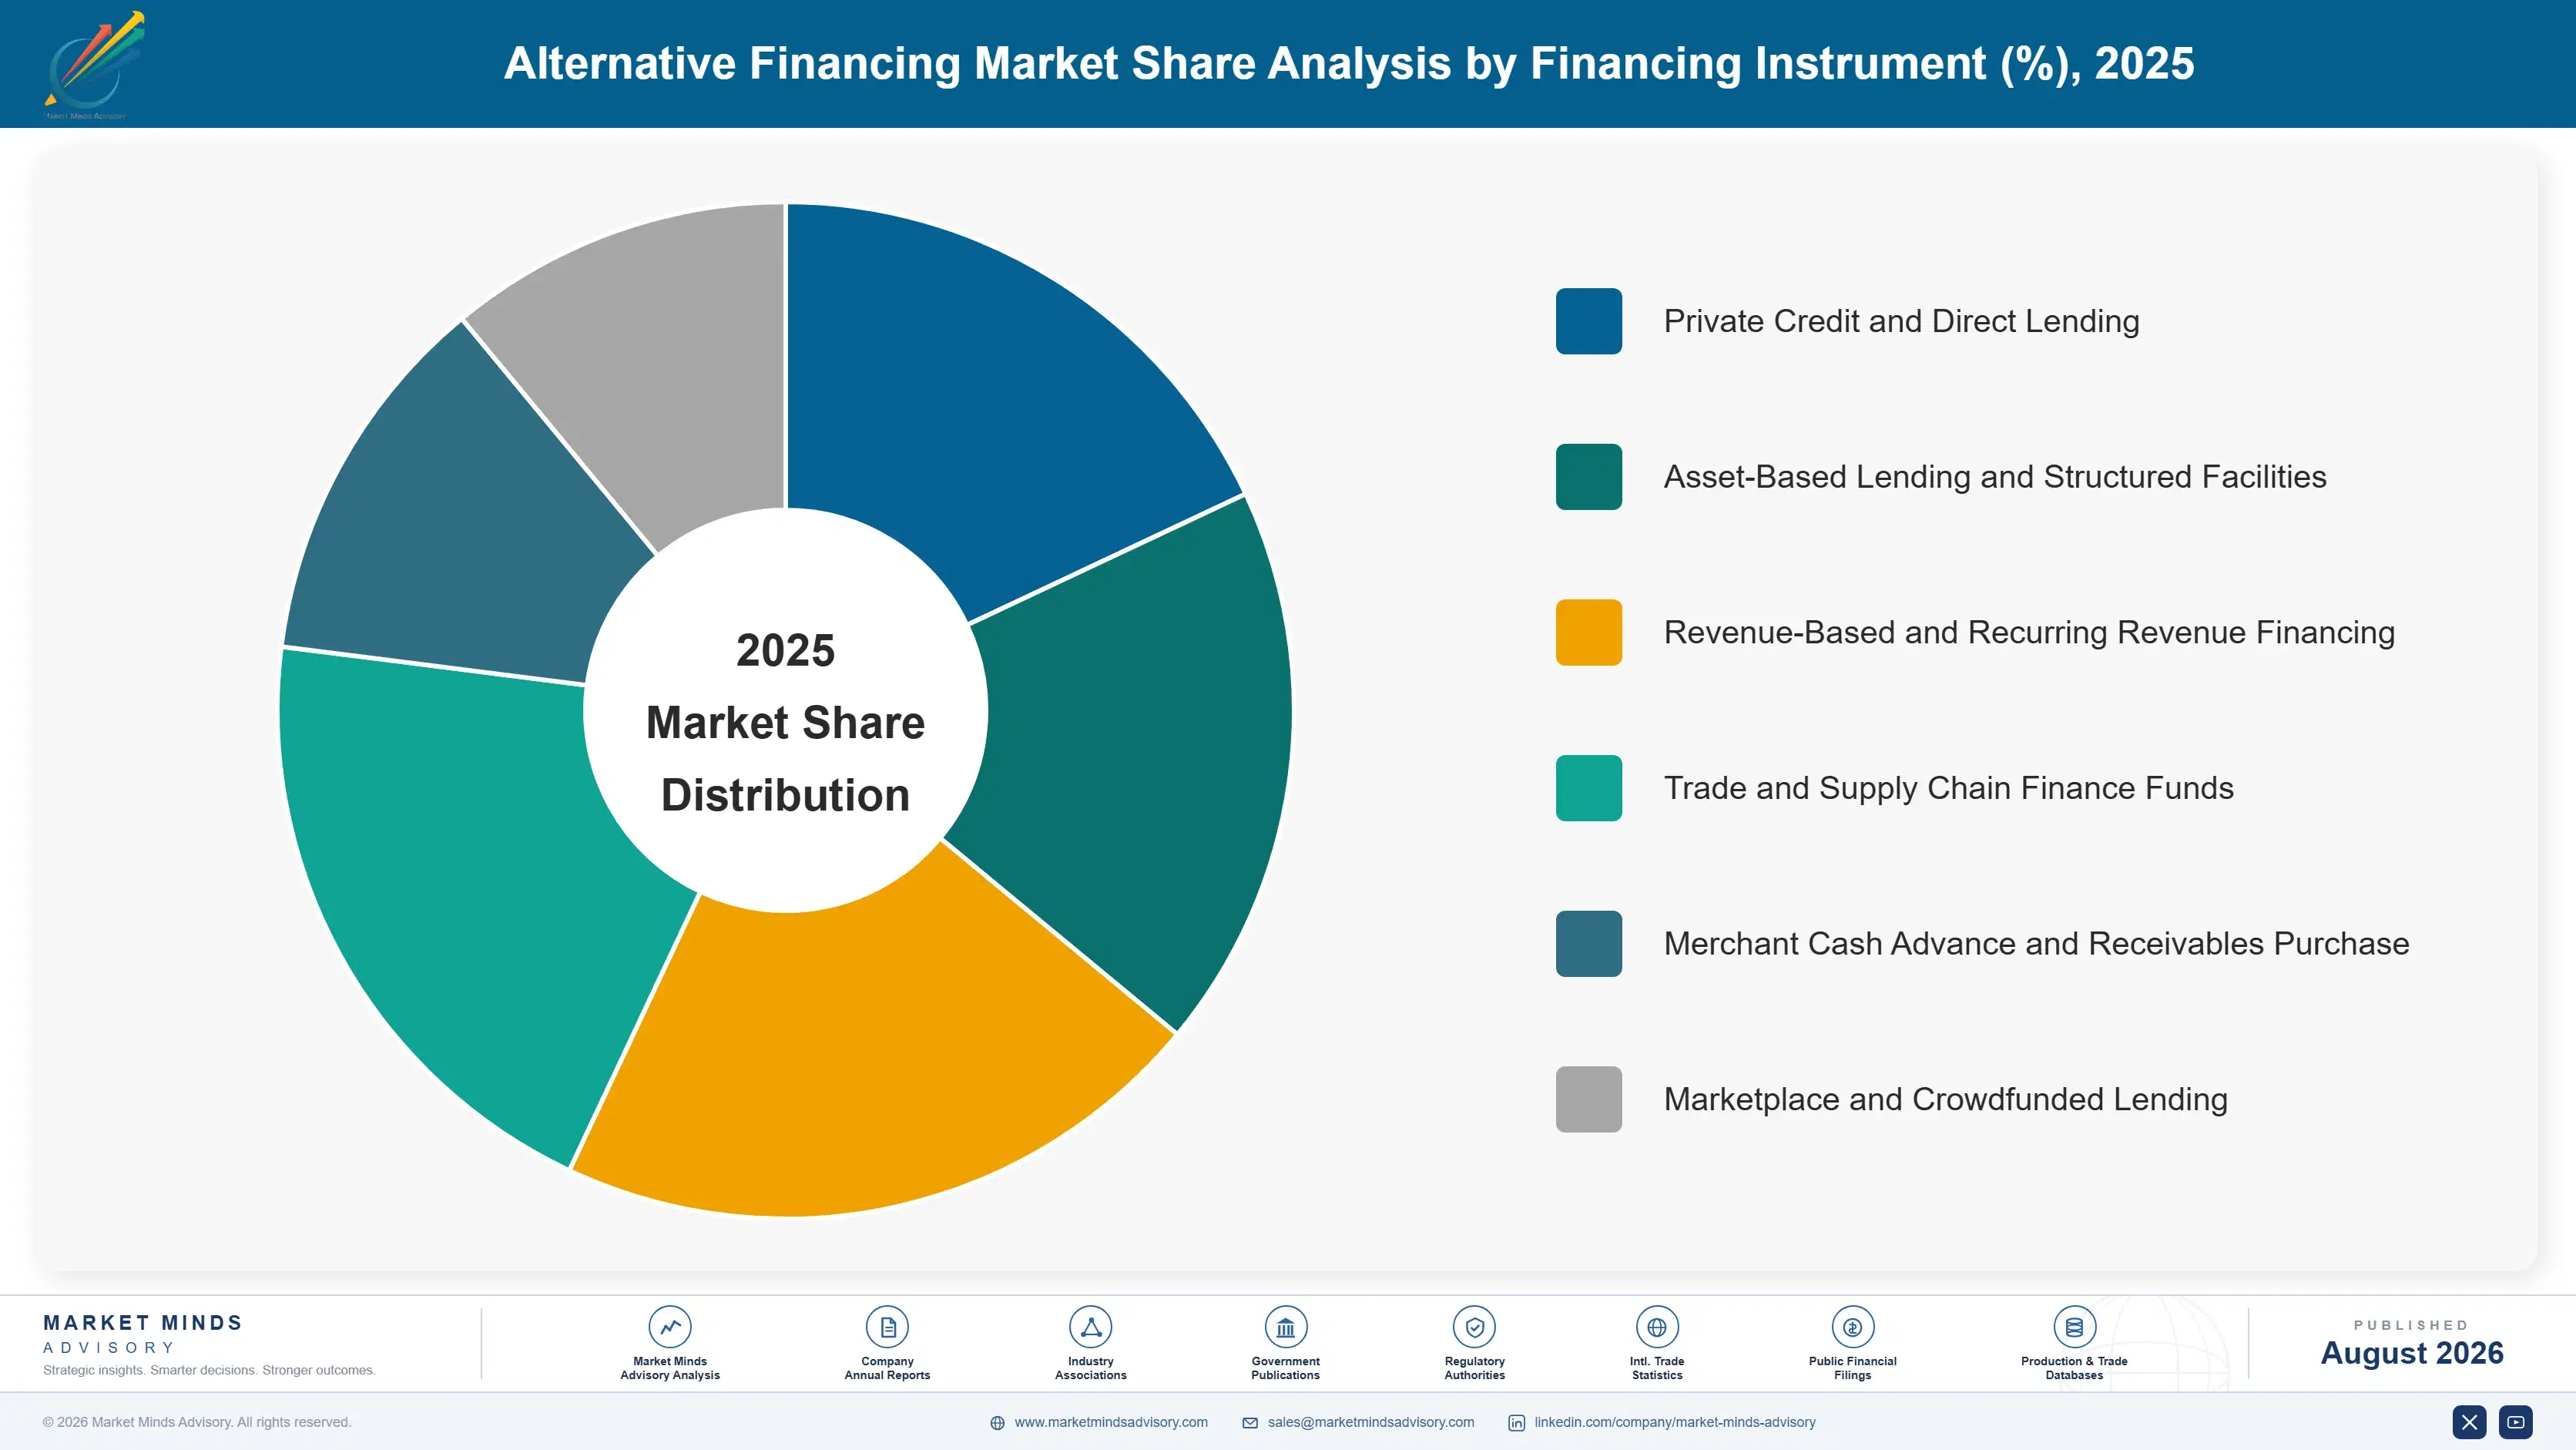
Segmentation follows financing instrument, since risk profile, capital requirement and regulatory treatment all differ by instrument rather than by borrower industry or size. Six categories cover the market without overlap. Borrower sector, deal size and investor type are treated as separate commercial dimensions throughout this report rather than as segmentation logic in their own right here.
alternative-financing-market-market-share-analysis-1787914656733

Revenue-Based and Recurring Revenue Financing

Revenue-linked financing grows at 17.1%, half again the market rate of 11.4%, by taking a fixed share of monthly turnover until roughly 1.35 times the advance has been repaid, with no fixed maturity date and no equity surrendered by the borrower at all. Recurring revenue businesses fit that shape well. Seasonal or lumpy businesses fit it terribly, since a quiet quarter simply extends the term instead of triggering any default that would force somebody to acknowledge a problem exists. Managers screening borrowers on revenue predictability rather than on absolute size are underwriting the variable that genuinely decides outcomes, and a good many competitors are still screening on entirely the wrong one.
CAGR 17.1%

Trade and Supply Chain Finance Funds

Trade and supply chain finance funds grow at 14.4% as institutional investors return to an asset class that taught them an expensive lesson when a large provider failed and the self-liquidating receivables behind it turned out to be neither self-liquidating nor, in several cases, receivables. Investors now ask about obligor concentration, receivable verification and whether the underlying trade actually occurred. Managers who welcomed those questions early have raised capital considerably more easily than those who did not. Obligor concentration, receivable verification and evidence that the underlying trade actually took place are now standard diligence questions rather than the unusual ones they were before anybody had lost any money here at all.
CAGR 14.4%
Full segment breakdown across 6 segments available in the complete report.

Regional Architecture and Country Demand Map

Assets follow where bank retreat was sharpest and where enforcement is predictable enough to lend against, which explains the distribution better than economic size ever does. Capital rules in one place and court timetables in another together decide very nearly all of it here anyway.

North America

Share sits at 40%, above the standard regional band, because private credit assets concentrate here more heavily than in any other market and the bank retreat from mid-market lending went furthest. That justification reflects genuine asset concentration rather than any modelling preference. Payment-in-kind usage is highest here too, and the disclosure debate is most advanced. State laws requiring annualised cost figures on merchant advances arrived here first and other jurisdictions are watching what follows. Direct origination away from sponsor auctions is more developed here than anywhere else, largely because the market is deep enough to support managers covering industries and regions rather than simply waiting for advisers to send them processes.
Share: 40% | CAGR: 10.2% (2026 to 2036)

Western Europe

Direct lending established itself here almost as early as in North America, and the market is now genuinely mature with established managers, workable documentation standards and enforcement that is predictable within each jurisdiction if not across them. Insolvency regimes differ enough between countries that a pan-European fund carries recovery assumptions varying by more than most investors realise. Trade finance fund recovery has been slower here, since the failure that damaged the category was substantially European. Direct origination is considerably harder here than in North America, since the borrower base is fragmented across languages, legal systems and business cultures that no single coverage team spans, which keeps more volume flowing through sponsor processes than anybody would choose.
Share: 26% | CAGR: 9.8% (2026 to 2036)
Regional intelligence for 5 additional markets available in the complete report: East Asia, South Asia and Pacific, Latin America, Middle East and Africa, Eastern Europe. Contact sales@marketmindsadvisory.com.
alternative-financing-market-country-cagr-analysis-1787914657253

Show The Cash, Not The Mark

Capital differentials run near 8%, payment-in-kind reaches 12% of income, 94% of assets are manager marked and revenue financing repays 1.35 times. Four levers here work on cash yield disclosure, instrument design, enforcement geography and valuation credibility rather than on raising more capital, which almost everybody operating in this market already has plenty of.

Disclose Cash Yield Before Anybody Demands It

Payment-in-kind interest now reaches around 12% of income and rising, and a loan accruing rather than paying still reports as performing on every statement produced. Managers publishing cash yield alongside accrual differentiate themselves before an allocator forces the question on everybody at once. It is uncomfortable when the number is weak and it is the single clearest signal of confidence available in a market where 94% of marks are self-assessed. Two competing managers have already started publishing it, and consultants are now using those disclosures as the comparison standard everywhere.
Market Impact: Separates the cash yield from 12% accrual income

Match Instrument Shape To Revenue Shape

Revenue-linked repayment taking a share of turnover until roughly 1.35 times is repaid suits recurring revenue businesses and fails badly for seasonal ones, where a quiet quarter extends the term instead of surfacing any problem. That segment grows at 17.1%. Managers screening for revenue predictability rather than for absolute size are underwriting the variable that actually determines outcomes, and most competitors are still screening on the wrong one. A quiet quarter extends the term instead of surfacing a problem, which is comfortable for everybody involved and informative for absolutely nobody at all.
Market Impact: Prices carefully toward the 1.35 times repayment multiple

Underwrite Enforcement Timelines By Every Jurisdiction

Recovery in a default depends on how long enforcement takes and how predictable it is, and those vary enormously between jurisdictions that otherwise look comparable on paper. Indian insolvency reform made a whole market assessable at 13.4% growth by changing exactly that. Managers modelling enforcement duration explicitly price recovery honestly, while those assuming Western timelines in unfamiliar jurisdictions discover the difference only during a workout. Two borrowers of identical quality in adjacent jurisdictions can produce recovery outcomes years apart, and nothing in the credit file tells you which is which.
Market Impact: Opens whole markets now growing at 13.4% annually

Buy Independent Valuation Before The Cycle Turns

Around 94% of these loans are marked by the manager collecting fees on them, and no independent test has been applied through a genuine credit cycle anywhere. Third-party valuation costs money and occasionally produces uncomfortable results. Managers commissioning it voluntarily hold credibility that competitors cannot manufacture once a downturn arrives and everybody's marks are being questioned simultaneously by the same allocators. Credibility of that kind costs very little to establish in advance and cannot be assembled at all once scepticism has already arrived for everybody in the market all simultaneously.
Market Impact: Independently tests that 94% self-marked loan book properly

Who Controls the Margin Pool

Measured on disclosed private credit and alternative financing management and net interest revenue, the five largest managers hold a CR5 of just 29%, which is low for a market where capital has been abundant and reflects competition on origination capability rather than on funding. Blackstone Credit and Ares Management carry the largest platforms, Apollo Global Management holds substantial origination breadth, and Blue Owl Capital and HPS Investment Partners hold strong direct lending franchises. Nobody outside that group commands both the capital to underwrite alone and the coverage to originate directly.
Three contests define activity. Large sponsor-backed lending competes on speed and certainty of execution. Mid-market lending competes on origination reach into companies without sponsors. Specialist instruments compete on structuring capability entirely. The three reward completely different organisations, and very few managers compete convincingly in more than one of them.

Pressure builds from banks returning to leveraged lending as capital treatment stabilises and balance sheets recover. Rankings shift toward whoever originates directly rather than whoever raised the most capital. Assets under management stopped being a useful comparison once capital became abundant, since raising it is no longer the hard part of anything here.
alternative-financing-market-company-positioning-matrix-1787914657774

Competitive Moat and Risk Dimensions

BLACKSTONE CREDIT

Moat: Capital Scale And Sponsor Access

Commanding capital large enough to underwrite an entire financing alone gives the manager certainty of execution that sponsors value above pricing on any competitive process. Relationships across private equity firms produce deal flow that smaller managers see later or not at all. Assembling comparable scale and sponsor coverage has defeated almost every competitor.
BLACKSTONE CREDIT

Risk: Sponsor Concentration Through A Cycle

A book weighted toward sponsor-backed borrowers concentrates exposure to leveraged capital structures that deteriorate together when conditions turn, since they were all underwritten on similar assumptions by similar people. Diversification across many sponsors provides considerably less protection than the count suggests. The correlation is in the structures rather than in the industries.
ARES MANAGEMENT

Moat: Direct Origination Without Sponsors

Sourcing borrowers directly rather than only through private equity processes reaches companies that never appear in a competitive auction, which produces both better pricing and better documentation terms than any intermediated process delivers. Building that origination network took decades of relationship work across regions and industries. It is the one advantage abundant capital cannot purchase.
ARES MANAGEMENT

Risk: Valuation Scrutiny At Scale

Scale in an asset class where roughly 94% of holdings are manager marked attracts proportionate attention to how those marks are set, particularly as payment-in-kind interest rises across the industry. Methodology is auditable and the underlying judgement is not. A large book converts any general scepticism about valuations into a specific question about this one.

Players Tracked

Prominent Players

Blackstone Credit
Ares Management
Apollo Global Management
Blue Owl Capital
HPS Investment Partners

Other Key Players

KKR Credit
Oaktree Capital Management
Golub Capital
Antares Capital
Barings
Arcmont Asset Management
Park Square Capital
Tikehau Capital
Hayfin Capital Management
Muzinich
Pemberton Asset Management
Bain Capital Credit
Carlyle Group
Sixth Street
Churchill Asset Management

Recent Developments

FEBRUARY 2025

Manager publishes cash yield alongside accrual income voluntarily

A private credit manager began publishing the proportion of interest income received in cash alongside total accrued income across its funds. This was a voluntary disclosure decision rather than any regulatory requirement, and allocators immediately began asking every single competitor for the identical breakdown afterwards.
Signal: One voluntary disclosure here turns very quickly into an expectation right across the whole market instead.
JUNE 2025

State disclosure law extends annualised cost requirements to receivables purchase

A further state extended commercial financing disclosure requirements to receivables purchase arrangements, obliging providers to state annualised equivalent costs. This was a legislative development rather than any enforcement action, and providers had argued for years that these products were purchases rather than any kind of loan.
Signal: The legal form held for decades and the disclosure requirement simply arrived regardless of any of it.
OCTOBER 2025

Bank returns to leveraged lending as capital treatment settles

A large bank resumed underwriting leveraged corporate loans at scale following clarity on capital treatment and balance sheet recovery. This was a strategic re-entry rather than any acquisition, and it competed directly with direct lenders on transactions they had grown accustomed to winning entirely uncontested.
Signal: The bank retreat that created this whole category was never guaranteed to remain permanent for anybody.

Capital, Losses, Origination

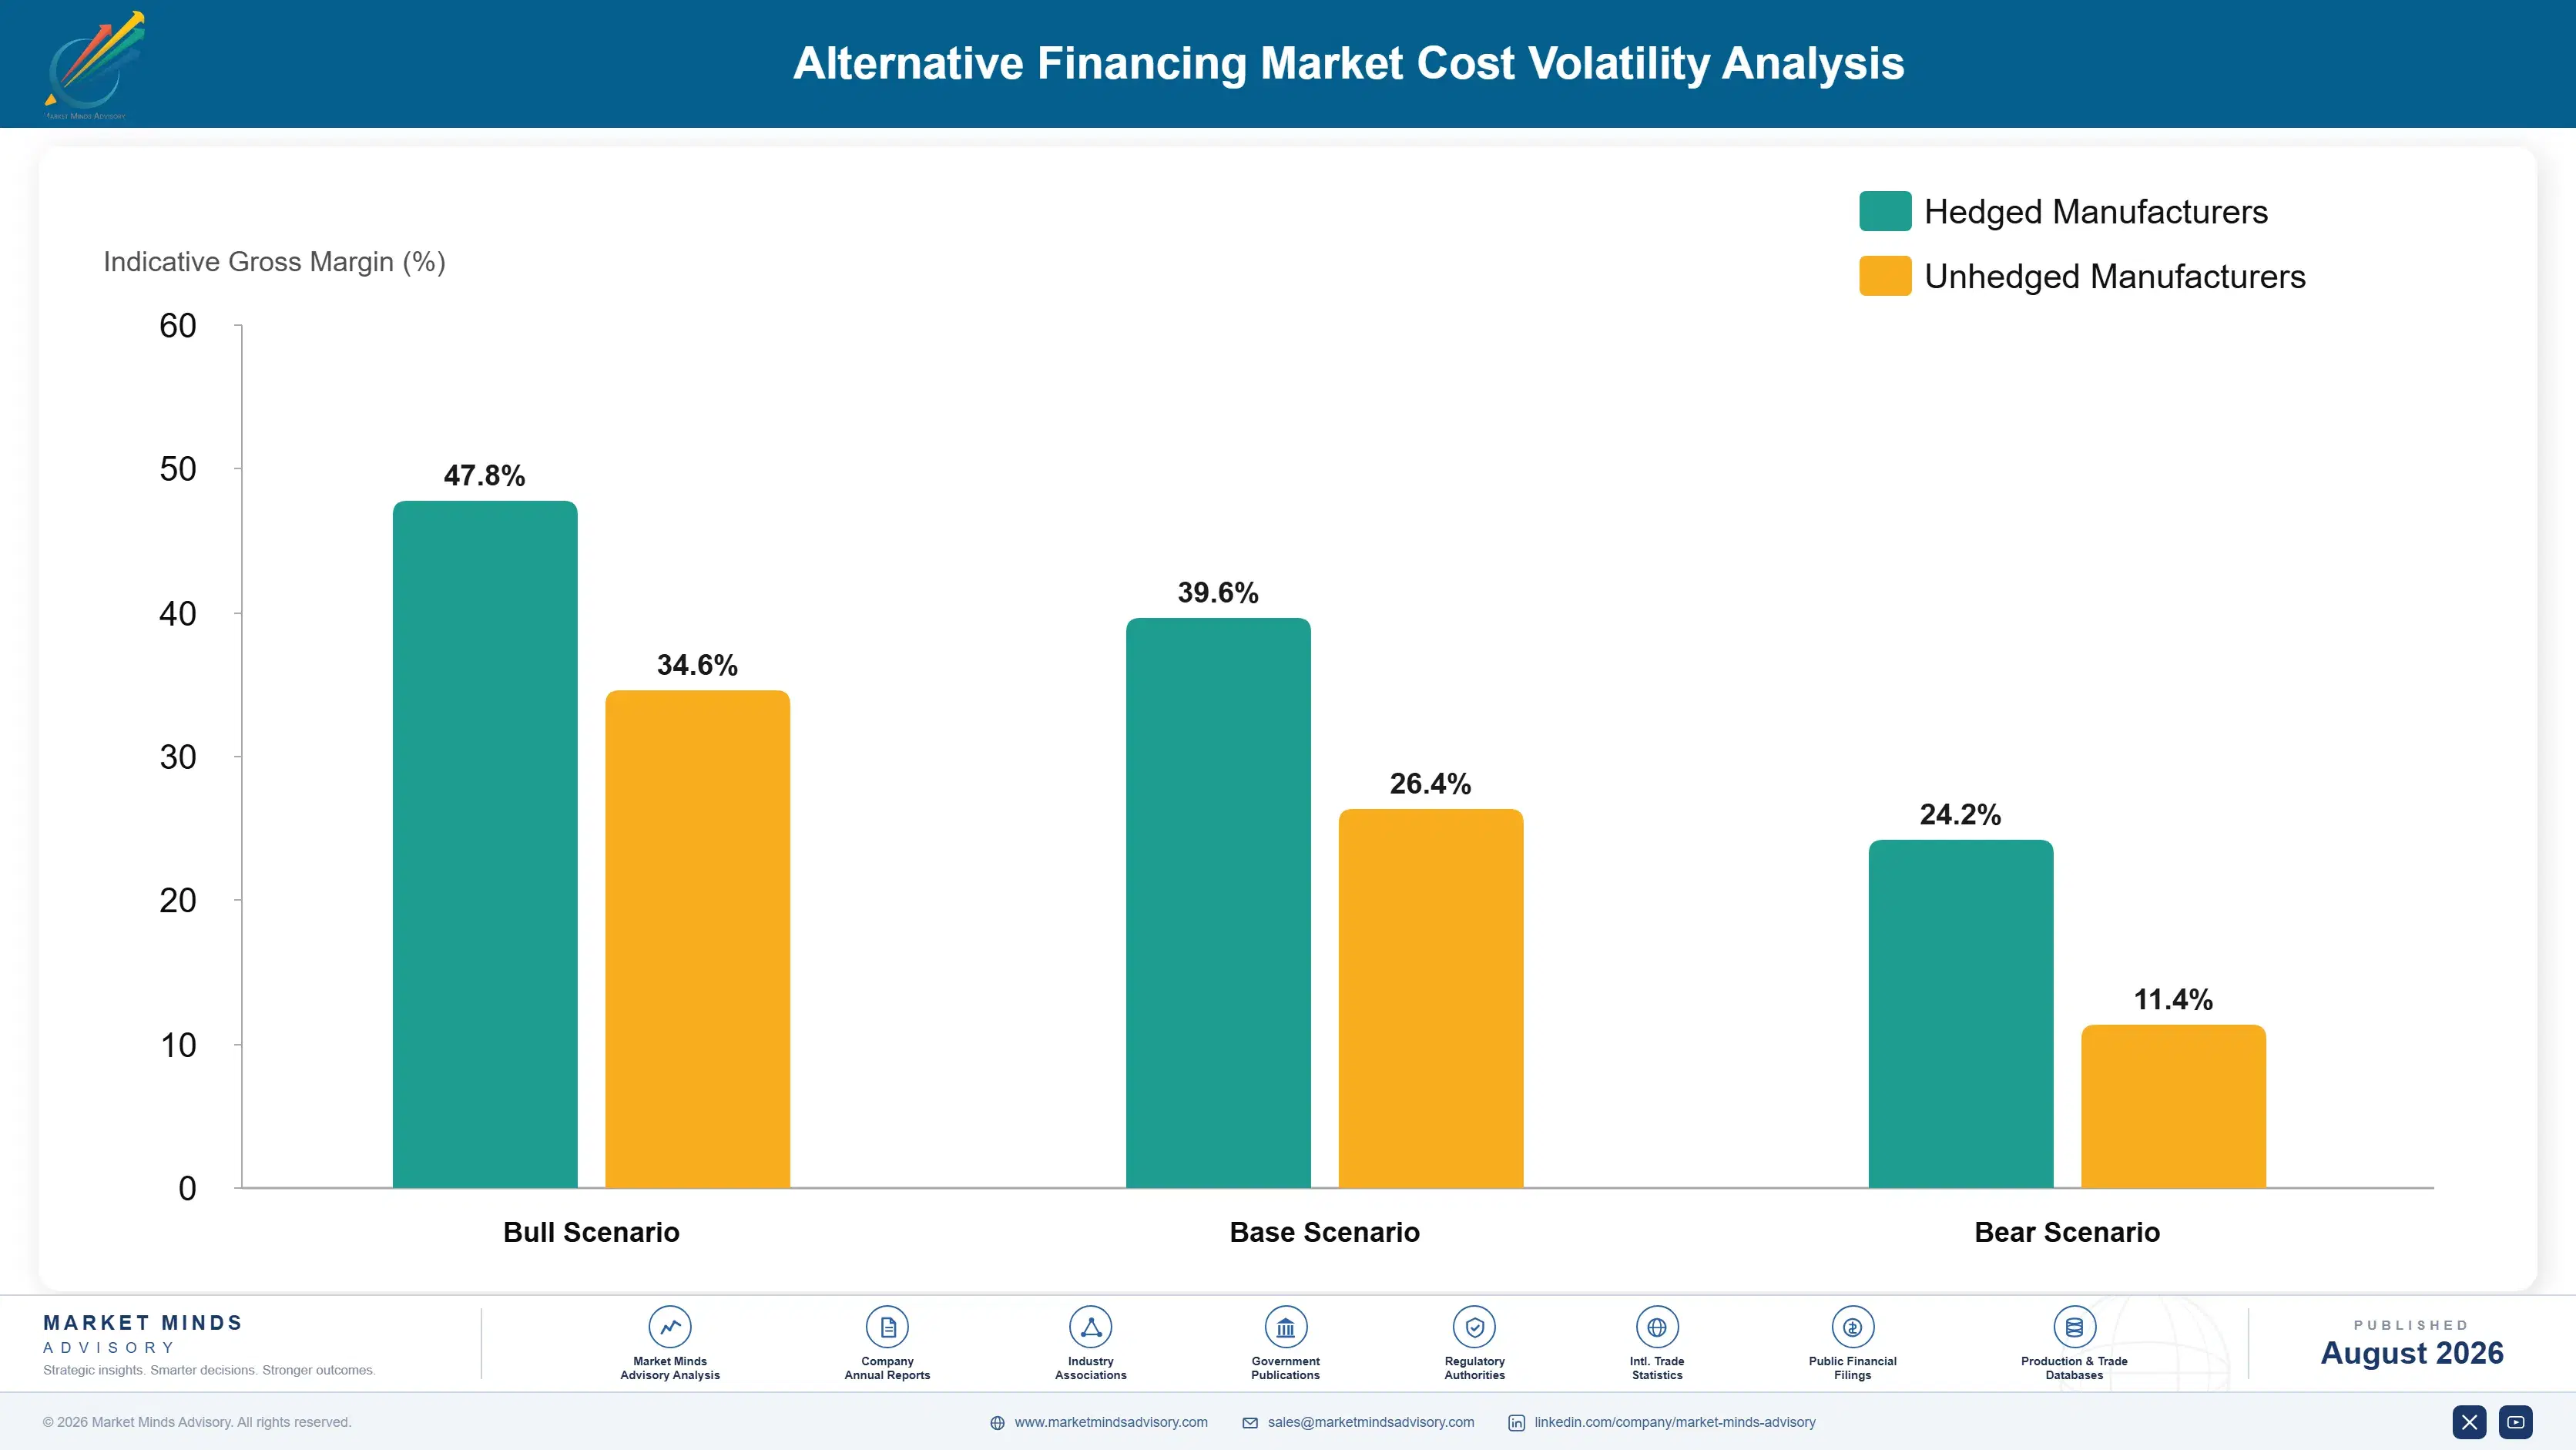
Three costs sit against gross yield. Cost of capital across fund and leverage structures, credit losses net of recoveries, and origination with monitoring and compliance together account for 56 to 72% of gross revenue at a typical manager. Capital cost dominates, since institutional allocators expect returns commensurate with illiquidity and fund-level leverage adds a further layer priced by lenders who watch the same credit indicators everybody else does.
Rates changed the arithmetic in both directions at once. Policy rates rose sharply through 2022 and 2023, which IMF data documents, lifting floating-rate coupons and making the asset class look excellent while simultaneously straining the borrowers paying those coupons. Payment-in-kind usage climbed in response. Blackstone Annual Report 2024 and Ares Management Annual Report 2024 disclosures describe both effects across their credit platforms during the period.

Exposure divides by origination source rather than by fund size. Managers sourcing directly from borrowers hold documentation and pricing advantages that intermediated processes never deliver. Those relying on sponsor-led auctions compete on terms set by an adviser running a competitive process specifically to compress them. That difference appears in recovery rates during a workout far more visibly than it ever does in reported yield beforehand.
alternative-financing-market-cost-volatility-analysis-1787914657969

Publish cash yield alongside total accrued income

Payment-in-kind interest reaching around 12% of income means reported yield increasingly describes accrual rather than cash actually received by anybody. Disclosing the split voluntarily is uncomfortable when the number disappoints and it is the clearest credibility signal available. Allocators are beginning to ask, and answering first is considerably better than answering last of everybody.

Commission third-party valuation before allocators require it

Roughly 94% of holdings are marked by the manager collecting fees on them, which no independent process has tested through a genuine credit cycle anywhere. Third-party valuation costs money and sometimes produces results nobody enjoys reading. It manufactures credibility that cannot be assembled quickly once general scepticism has already arrived for absolutely everybody involved.

Build direct origination away from sponsor auctions

Sponsor-led processes are designed by advisers specifically to compress pricing and loosen documentation, which is exactly what a competitive auction is for. Direct borrower relationships take years of coverage effort across regions and industries to establish properly. They produce both better terms and better recoveries, and abundant capital cannot ever purchase them from anybody.

Portfolio Architecture for Margin Defence

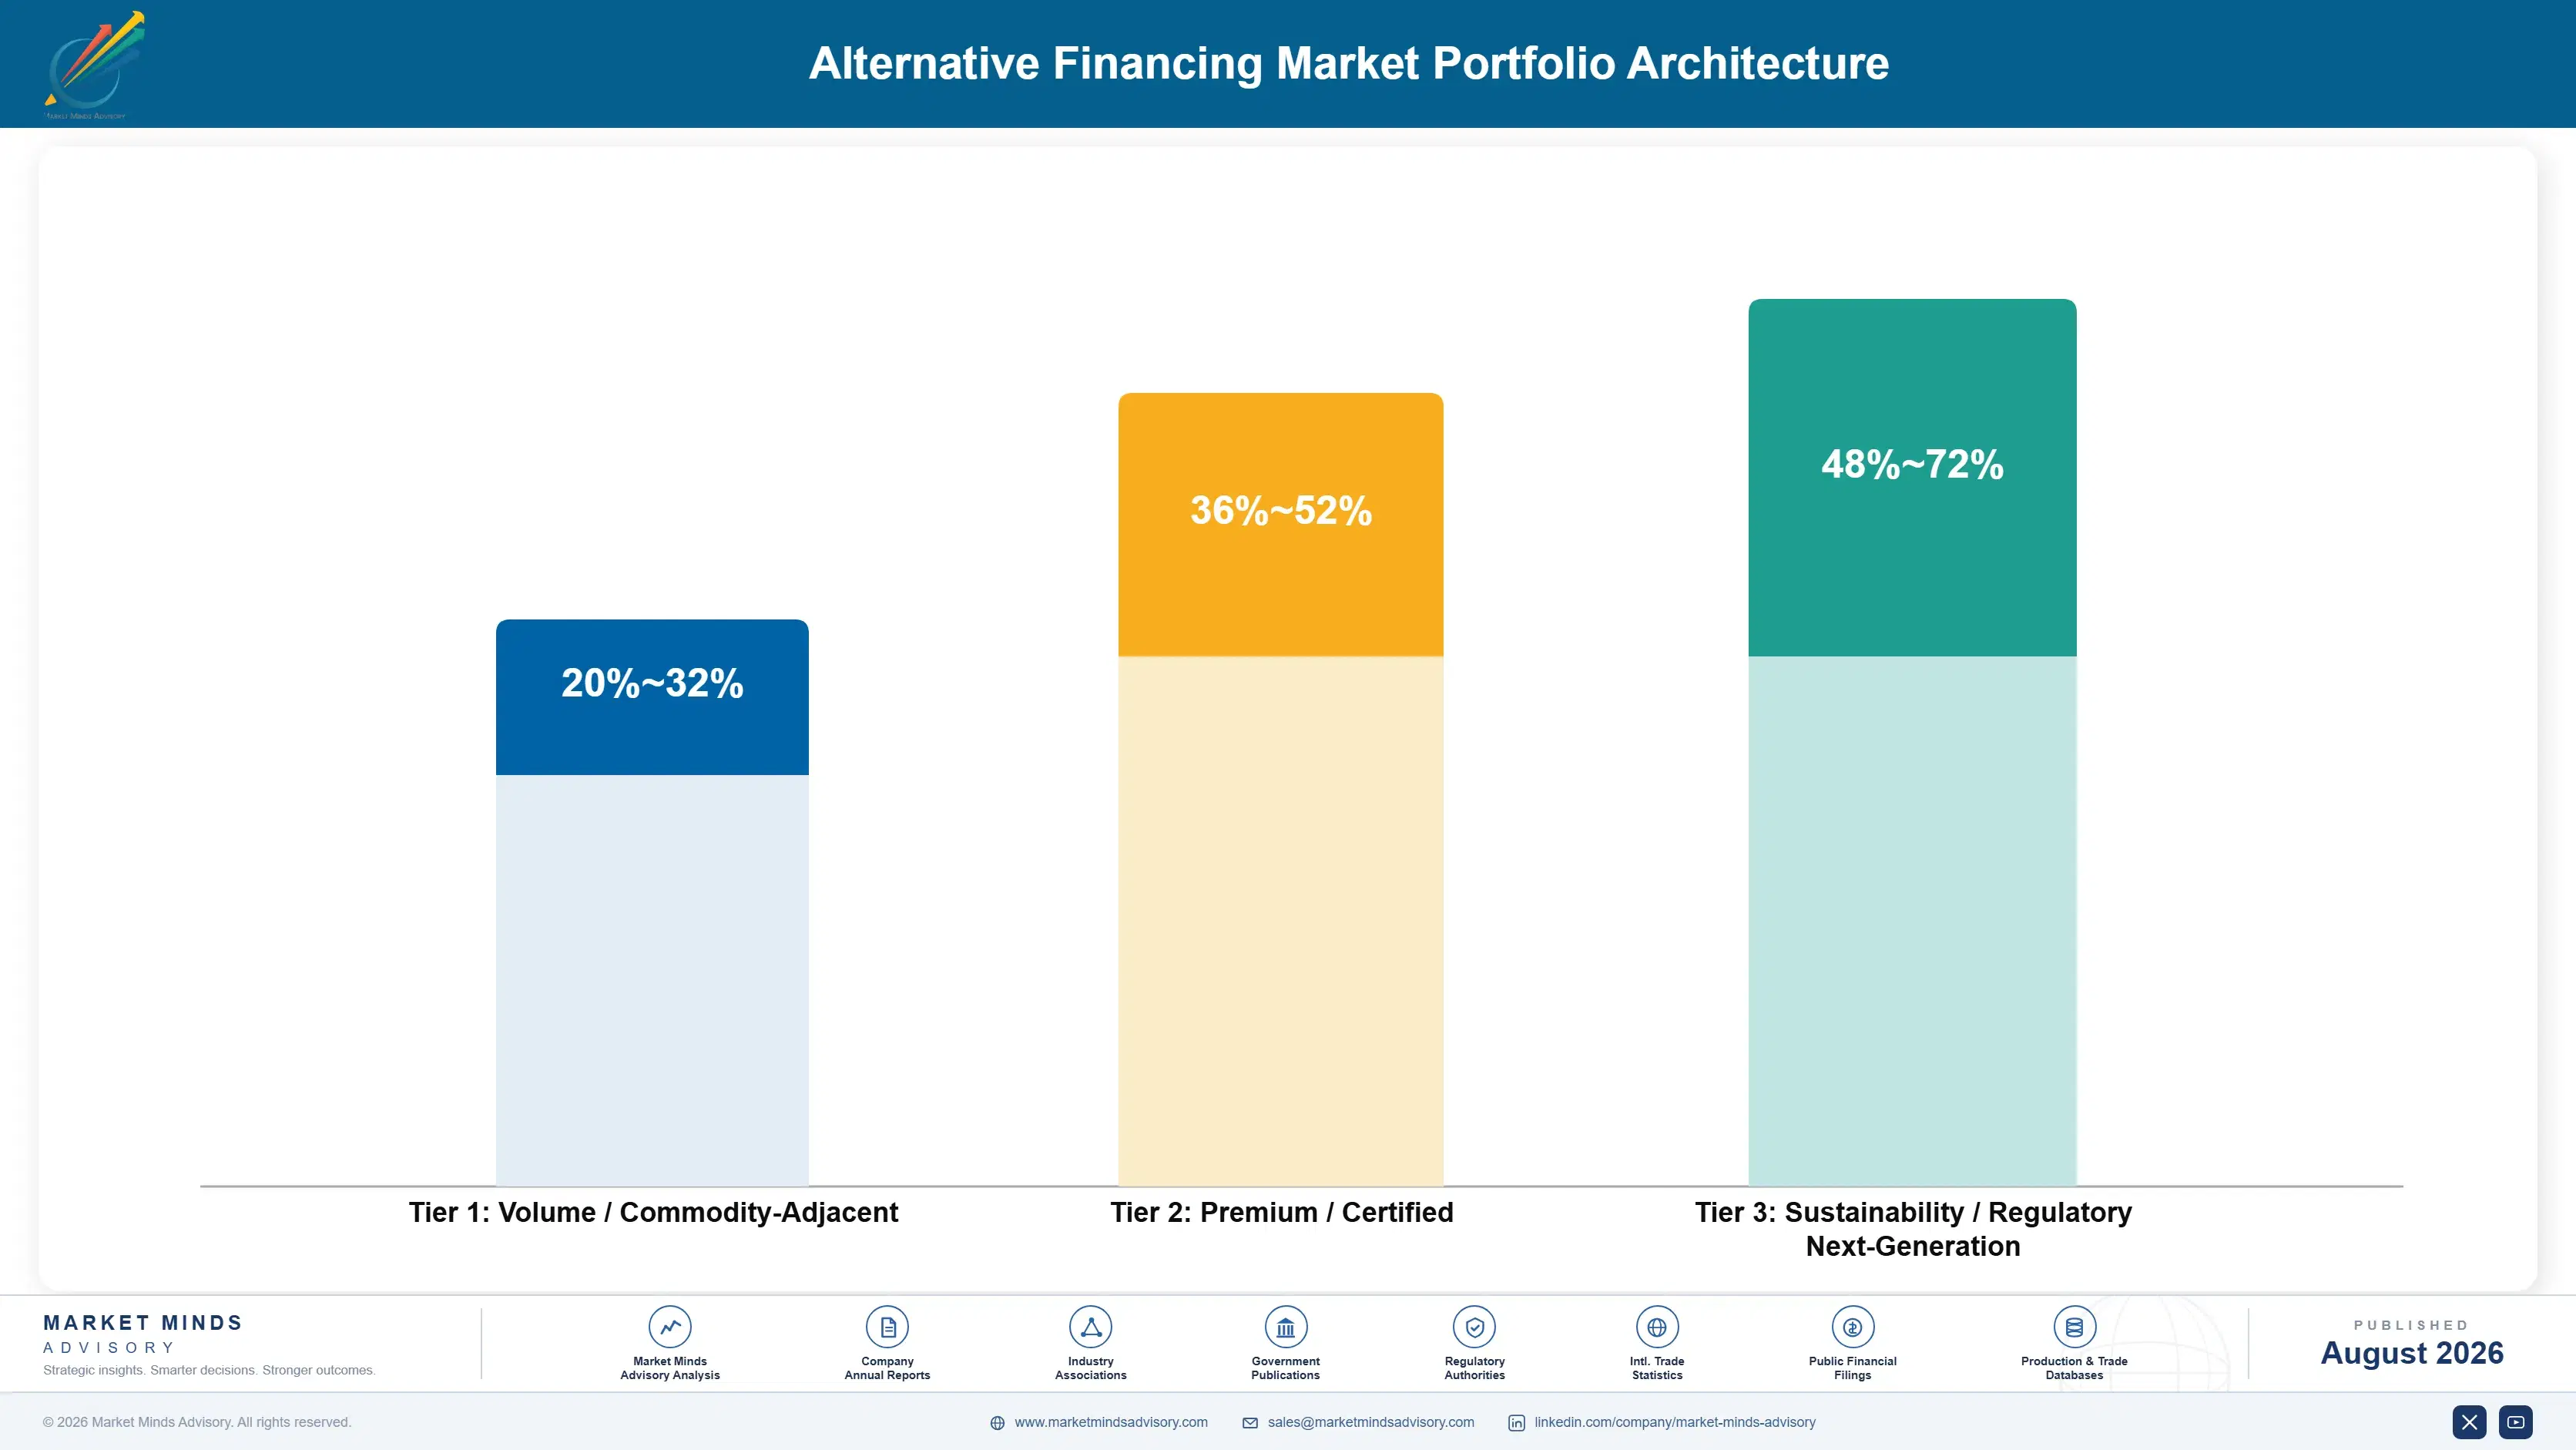
Margin follows origination difficulty rather than assets under management. Marketplace and crowdfunded lending earns thinly on a model that largely failed and survives only where institutionally funded. Merchant cash advance earns high gross returns against reputational cost nobody prices. Asset-based lending earns modestly with collateral limiting both loss and yield. Private credit earns well at scale. Trade finance funds earn better on structuring difficulty. Revenue-based financing earns best, on instrument design few managers understand properly.
The tension is that the most attractive returns sit in instruments that are hardest to raise capital against. Allocators understand senior direct lending and fund it readily at compressed spreads. Revenue-linked structures, trade receivables and specialty facilities all require explaining, and several of them carry the memory of a failure that investors have not forgotten. Managers therefore raise easily for the crowded product and struggle for the other.

High-value pools sit in three places. Direct origination away from sponsor auctions, which no amount of capital purchases. Revenue-linked instrument design, where matching repayment shape to revenue shape decides outcomes and most competitors screen on size instead. And valuation credibility, which costs almost nothing to build in advance and cannot be assembled once a cycle turns.

Volume / Commodity-Adjacent

Marketplace lending and asset-based facilities where collateral or platform structure limits both risk and available return. The 12-point range separates institutionally funded platforms from those still carrying retail funding costs and flight risk.
Gross Margin: 20-32%

Premium / Certified

Private credit and direct lending at scale, competing on execution certainty and origination reach into sponsor and non-sponsor borrowers. The 16-point spread reflects how differently auction-won and directly originated loans perform through a workout.
Gross Margin: 36-52%

Sustainability / Regulatory / Next-Generation

Revenue-linked financing and trade finance structures requiring instrument design capability that very few managers genuinely hold. The 24-point range is wide because revenue-linked returns and trade receivable structures behave in entirely different ways.
Gross Margin: 48-72%
alternative-financing-market-portfolio-architecture-1787914658469

High-value Sub-segments and Strategic Watch-out

Revenue-Linked Instrument Design

Highest returns and fastest growth at 17.1%, protected by design capability that decides outcomes while most competitors still screen borrowers on absolute size instead. The risk is that seasonal borrowers fit this shape terribly and nobody finds out quickly. And nobody finds that out at all quickly.
Gross Margin: 58-72%

Direct Origination Capability

Strong economics from reaching borrowers who never appear in a competitive auction, which produces better pricing and considerably better documentation terms. The risk is that building the coverage network takes decades and cannot be accelerated with capital. Capital by itself simply cannot accelerate any of it.
Gross Margin: 44-58%

Senior Direct Lending Volume

The volume core, easily explained to allocators and therefore easily funded, which is precisely why spreads on it have compressed. Managers hold it because capital raises against it, not because returns justify the attention. Fundraising rather than any actual return is what keeps it there.
Gross Margin: 36-48%

Self-Marked Valuation Exposure

The strategic watch-out. Around 94% of holdings are valued by the party earning fees on them, untested through any real cycle. The risk is that scepticism arrives for everybody simultaneously and nobody can answer it afterwards. And everybody gets asked in exactly the same quarter.
Gross Margin: 24-36%

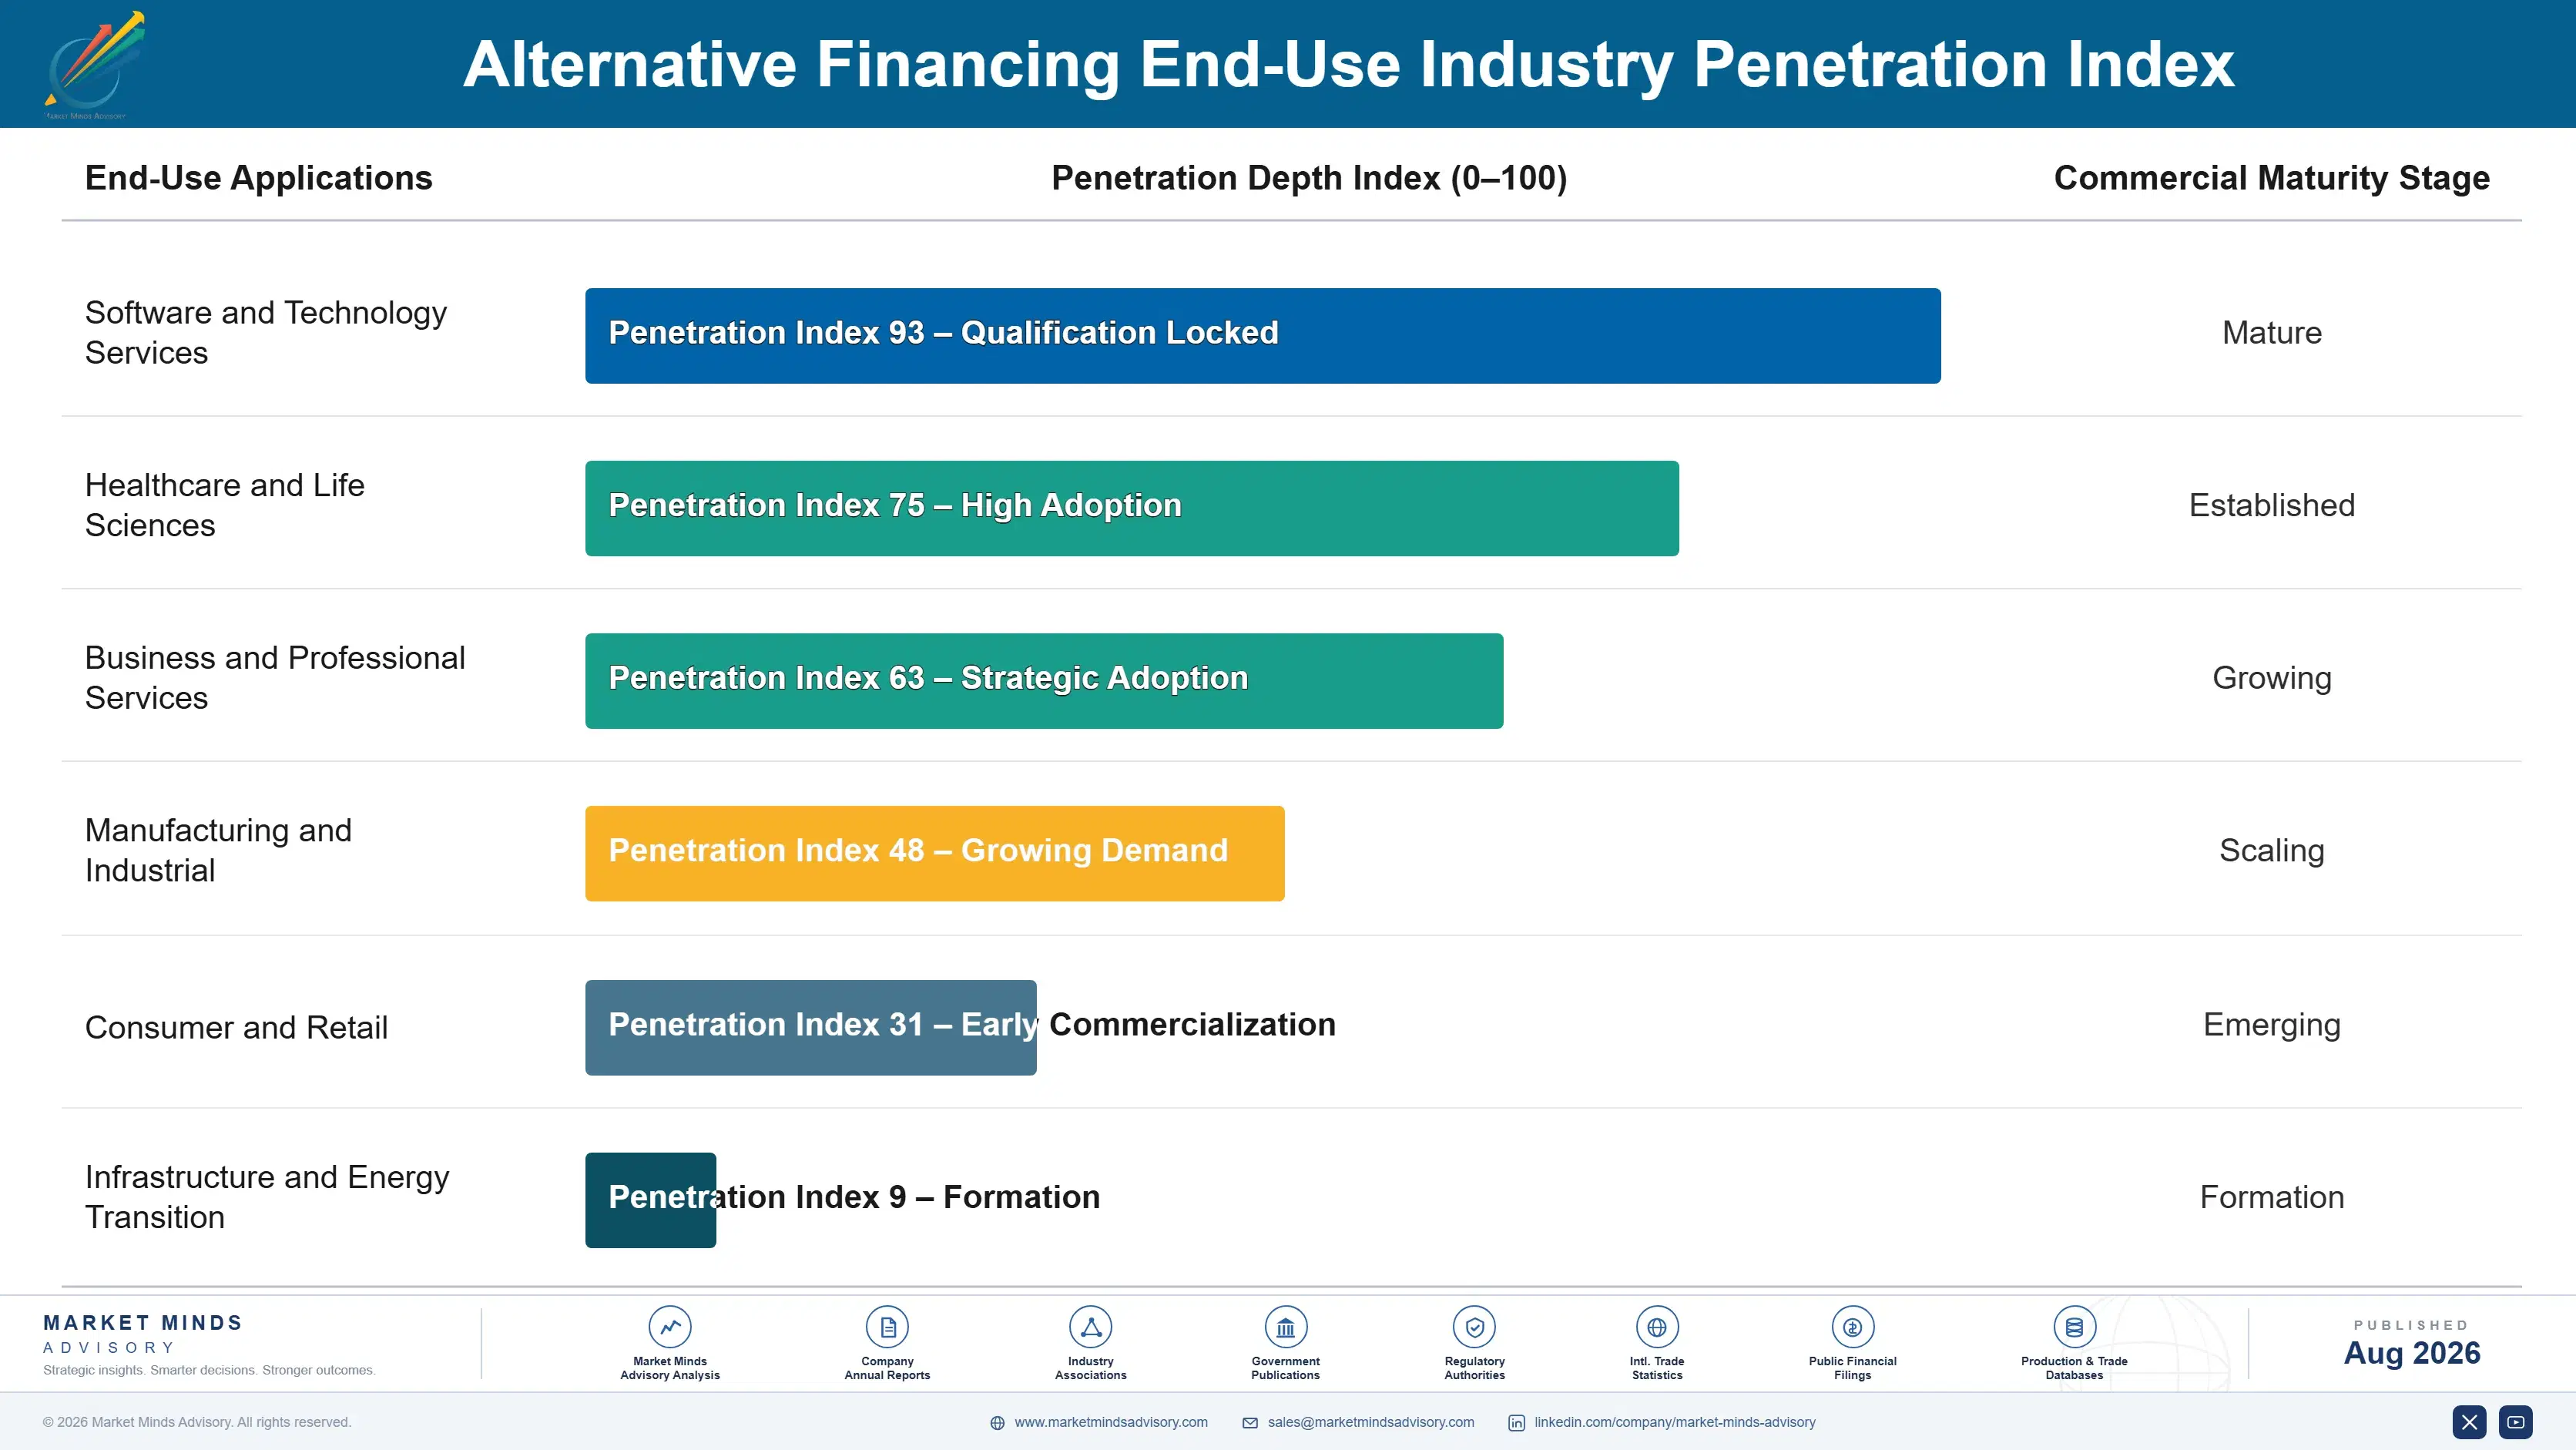
Locked Capital, Renewed Borrowers

Annuity characteristics here are unusually strong on the funding side and weak on the asset side. Committed fund capital is locked for years and generates management fees whether or not anything is deployed, which is about as dependable as revenue becomes anywhere in finance. The loans themselves mature, repay and must be replaced continuously. A manager's stability therefore depends on fundraising rather than on any individual borrower relationship.
Stickiness sits with allocators rather than with borrowers, and managers frequently confuse the two. An institutional investor who has completed diligence once re-ups into successive funds with far less friction than the first commitment required. A borrower refinances at maturity and shops the market thoroughly, since refinancing is precisely the moment competition is invited. Sponsor relationships behave differently again, recurring through deal flow rather than through any single credit.

The allocator has become considerably more demanding across five years. Early institutional entrants bought yield and diversification and asked comparatively little. Those same investors now ask about cash yield versus accrual, valuation methodology, payment-in-kind proportion and enforcement assumptions by jurisdiction. Consultants advising them have become considerably better informed, which has raised the standard of question any manager must answer properly.
alternative-financing-market-end-use-penetration-index-1787914658956

Cash Yield Is The Question

These are among the four positions where our research anticipates prominent divergence between winners and laggards over the coming forecast period. Each is grounded in the demand model, the regulatory perimeter, and the announced capacity pipeline.
01 / CASH YIELD TRANSPARENCY

A loan can perform without paying anybody anything

Payment-in-kind interest now reaches around 12% of total income across private credit books everywhere and has been climbing steadily, which matters because a loan accruing rather than paying still reports as fully performing on every single statement anybody produces about it. Managers who publish cash yield alongside accrual differentiate themselves before allocators force the same question on everybody at once. It is uncomfortable when that number disappoints anybody and it remains the clearest confidence signal available anywhere in this market.
02 / INSTRUMENT SHAPE MATCHING

Repayment should follow revenue, not the calendar

Revenue-linked financing simply takes a share of the monthly turnover until roughly 1.35 times the original advance has been repaid, which suits any recurring revenue business well and fails badly for seasonal ones, where a quiet quarter merely extends the term rather than surfacing any problem at all. That whole segment now grows at 17.1% a year. Managers who screen for revenue predictability rather than for absolute borrower size are underwriting the one variable that genuinely determines the outcomes here.
03 / ENFORCEMENT GEOGRAPHY UNDERWRITING

Recovery depends on courts, not on credit quality

What a lender actually recovers in any default depends on how long the enforcement takes and on how predictable it proves to be, and both of those vary enormously between jurisdictions that all look entirely comparable on paper beforehand. Indian insolvency reform made an entire market assessable and it now grows fastest of anywhere at 13.4%. Managers who model enforcement duration explicitly price their recovery honestly, while those assuming familiar timelines discover the difference during a workout instead of beforehand.
04 / VALUATION CREDIBILITY BUILDING

Nobody independent has priced this book yet

Roughly 94% of all these loans carry valuations set by the very manager collecting fees on them, and no independent process has genuinely tested any of those marks through a real credit cycle anywhere in this whole asset class. Third-party valuation costs a lot of real money and it occasionally produces results that nobody at all enjoys reading afterwards. Managers who commission it voluntarily hold a credibility that their competitors simply cannot manufacture at all once a downturn has already arrived everywhere.

Engagement Snapshot From the Field

A live engagement with an industry participant carrying material or product regulatory and market exposure ahead of a defining policy shift, showing how our research translates into a defensible multi-year portfolio strategy.
MARKET MINDS ADVISORY · CLIENT ENGAGEMENT SUMMARY
Alternative Financing Producer Strategic Portfolio Review and Transition Roadmap 2026·Investment Scenario on Alternative Financing Exposure Evaluation 2025-26
CLIENT PROFILE
A mid-market private credit manager operating two direct lending funds across North American and European borrowers, with reported management and net interest revenue of 128 million dollars (client-reported, unverified by MMA). Roughly 76% of origination arrived through sponsor-led processes. Valuations were entirely internal and cash yield had never been reported separately from accrual to anybody.
STRATEGIC CHALLENGE
Fundraising for a third vehicle had slowed noticeably while allocators asked questions the previous two raises had never attracted, particularly about payment-in-kind proportion and valuation methodology. Management proposed reducing headline fees to restart momentum. That answered a pricing question nobody had actually asked while leaving the disclosure questions allocators were genuinely raising entirely unaddressed.
MMA APPROACH
MMA analysed the portfolio separating cash-paying from accruing positions, then compared recovery and documentation outcomes between sponsor-sourced and directly originated loans. Twenty-six expert interviews with allocators, consultants, workout advisers and competing managers established what is actually being asked in diligence now. The analysis treated cash yield disclosure and origination mix as the routes available forward.
KEY FINDINGS
  1. Accruing positions had grown to a materially larger share of income than management had assumed, and no report produced internally had ever separated the two figures.
  2. Directly originated loans carried better documentation terms and better modelled recoveries than sponsor-sourced ones, and the manager had never quantified that difference.
  3. Every allocator interviewed asked about cash yield and valuation methodology in current diligence, and none of them mentioned headline fee levels at all.
  4. Two competing managers had already begun publishing cash yield voluntarily, and consultants were using those disclosures as the comparison standard in diligence now.
CLIENT PROFILE
A mid-market private credit manager operating two direct lending funds across North American and European borrowers, with reported management and net interest revenue of 128 million dollars (client-reported, unverified by MMA). Roughly 76% of origination arrived through sponsor-led processes. Valuations were entirely internal and cash yield had never been reported separately from accrual to anybody.
STRATEGIC CHALLENGE
Fundraising for a third vehicle had slowed noticeably while allocators asked questions the previous two raises had never attracted, particularly about payment-in-kind proportion and valuation methodology. Management proposed reducing headline fees to restart momentum. That answered a pricing question nobody had actually asked while leaving the disclosure questions allocators were genuinely raising entirely unaddressed.
MMA APPROACH
MMA analysed the portfolio separating cash-paying from accruing positions, then compared recovery and documentation outcomes between sponsor-sourced and directly originated loans. Twenty-six expert interviews with allocators, consultants, workout advisers and competing managers established what is actually being asked in diligence now. The analysis treated cash yield disclosure and origination mix as the routes available forward.
KEY FINDINGS
  1. Accruing positions had grown to a materially larger share of income than management had assumed, and no report produced internally had ever separated the two figures.
  2. Directly originated loans carried better documentation terms and better modelled recoveries than sponsor-sourced ones, and the manager had never quantified that difference.
  3. Every allocator interviewed asked about cash yield and valuation methodology in current diligence, and none of them mentioned headline fee levels at all.
  4. Two competing managers had already begun publishing cash yield voluntarily, and consultants were using those disclosures as the comparison standard in diligence now.
RECOMMENDED STRATEGY
Phase 1: Phase one: publish cash yield alongside accrual income immediately, since allocators are already asking and competitors have already started doing it. Phase 2: Phase two: commission third-party valuation on the existing book before the next raise rather than defending internal marks under questioning. Phase 3: Phase three: build direct origination coverage deliberately, since the outcome difference against sponsor-sourced loans is already clearly measurable internally today.
OUTCOME
Cash yield disclosure was published and appeared repeatedly in subsequent allocator conversations (client-reported, unverified by MMA). Third-party valuation was commissioned ahead of the next raise. Direct origination coverage was funded in two regions. The fee reduction was cancelled, having proposed answering a question that no allocator anywhere had actually raised.

Frequently Asked Questions

Foundational context covering the market sizes, CAGR, scope, country, region and competition that inform every finding below. This section is provided to cover basics and most often pre-purchase conversations, answered from the MMA Primary Research Dataset.

What is the current size of the Alternative Financing Market?

The market was worth 46.5 billion dollars in provider revenue in 2025, comprising management, origination and net interest income. It reaches 51.80 billion dollars in 2026.

How large will the Alternative Financing Market be by 2036?

MMA forecasts 152.46 billion dollars by 2036, an increase of 100.66 billion dollars over the 2026 base. That represents an expansion multiple of 2.94 times across the forecast period.

What is the CAGR for the Alternative Financing Market 2026 to 2036?

The base case compounds at 11.4% annually. The bull case reaches 12.6% if bank capital treatment stays unchanged, while the bear case sits at 10.2% on a credit cycle testing valuations.

Which segment is growing fastest?

Revenue-based and recurring revenue financing, at 17.1%, half again the market rate of 11.4%. Repayment linked to turnover suits businesses that fixed instalments never fitted properly.

Who are the major companies in the Alternative Financing Market?

Blackstone Credit, Ares Management, Apollo Global Management, Blue Owl Capital and HPS Investment Partners lead on disclosed revenue. Concentration is only 29% despite abundant capital.

Which country is growing fastest?

India at 13.4%, where domestic banks continue declining corporate credit categories and insolvency reform improved enforcement timelines enough to make the risk genuinely assessable for everybody.

Report Segmentation Architecture

The full report scope spans multiple orthogonal segmentation dimensions, with cross-tabulated demand data provided for each dimension pair. Coverage extends further to regional breakdowns, trend trajectories, and the competitive detail needed to support segment-level decision-making.

By Financing Instrument

  • Private Credit and Direct Lending
  • Asset-Based Lending and Structured Facilities
  • Revenue-Based and Recurring Revenue Financing
  • Trade and Supply Chain Finance Funds
  • Merchant Cash Advance and Receivables Purchase
  • Marketplace and Crowdfunded Lending

By End-Use Industry

  • Software and Technology Services
  • Healthcare and Life Sciences
  • Business and Professional Services
  • Manufacturing and Industrial
  • Consumer and Retail
  • Infrastructure and Energy Transition

By Commercial Dimension

  • Sponsor-Led Transaction Processes
  • Direct Borrower Origination
  • Institutional Fund Commitments
  • Separately Managed Account Mandates
  • Bank Partnership and Forward Flow
  • Secondary Portfolio Purchases

By Region

  • North America
  • Western Europe
  • East Asia
  • South Asia and Pacific
  • Latin America
  • Middle East and Africa
  • Eastern Europe

Scope, Methodology, and Coverage

Every figure in this report is reproducible from documented input assumptions. The scope below maps the historical period, the forecast horizon, the segmentation dimensions, and the countries covered, alongside the underlying primary and qualitative methodology.
Historical Period
2020 to 2025
Forecast Period
2026 to 2036
Base Year
2025 (USD billions; MMA Primary Research Dataset, August 2026)
Market Definition
Scope covers management, origination and net interest revenue earned by non-bank providers of business financing worldwide, spanning private credit and direct lending to corporate borrowers, asset-based lending and structured facilities secured on receivables inventory or equipment, revenue-based and recurring revenue financing repaid as a share of turnover, trade and supply chain finance funds, merchant cash advance and receivables purchase arrangements, and marketplace and crowdfunded lending platforms. Bank corporate and commercial lending revenue, private equity and venture capital management and performance fees, public bond and equity underwriting, all forms of consumer lending including instalment and card products, residential and commercial mortgage finance, and insurance premium finance are excluded from the market size and all derived figures.
Quantitative Units
USD billions of provider revenue (current prices); assets under management in USD trillions; payment-in-kind share of income; repayment multiple against advance; share of assets marked by manager
Segmentation Dimensions
By Financing Instrument; By End-Use Industry; By Commercial Dimension; By Region
Regions Covered
North America, Western Europe, East Asia, South Asia and Pacific, Latin America, Middle East and Africa, Eastern Europe
Countries Covered
USA, UK, Germany, France, India, Canada, Australia, Netherlands, Japan, Singapore, Spain, Italy, Brazil, UAE, Poland
Key Companies Profiled
Blackstone Credit, Ares Management, Apollo Global Management, Blue Owl Capital, HPS Investment Partners, KKR Credit, Oaktree Capital Management, Golub Capital, Antares Capital, Barings, Arcmont Asset Management, Park Square Capital, Tikehau Capital, Hayfin Capital Management, Muzinich, Pemberton Asset Management, Bain Capital Credit, Carlyle Group, Sixth Street, Churchill Asset Management
Quantitative Methodology
Primary survey, n=3,800 respondents, Q4 2025, six countries; demand-side model with trade association cross-validation
Qualitative Methodology
47 expert interviews, Q4 2025; applied to validate demand model assumptions, identify emerging dynamics, and assess competitive positioning
Report Format
PDF and XLSX data workbook (Word format preview document)
Publisher
Market Minds Advisory
Report Code
MMA-2026-TEC-271
Published
August 2026
Contact
sales@marketmindsadvisory.com | www.marketmindsadvisory.com

Purchase the full Alternative Financing Market Report (2026 to 2036).

The full report runs to 195 pages and covers all six financing instruments, seven regions and 20 profiled managers in detail. It includes the complete segment CAGR set, analysis of bank capital treatment as the origin of the category, and payment-in-kind and valuation practice examined across the industry. Company profiles carry evaluation on disclosed private credit and alternative financing management and net interest revenue, with moat and risk assessment for the top five managers. The competitive section extends to 15 tracked disclosure, regulatory and competitive developments across 2024 and 2025. Primary research inputs include a quantitative survey of 3,800 respondents and 47 expert interviews conducted in Q4 2025.
Six financing instruments with individual CAGR forecasts
Seven regional markets compared on bank retreat and enforcement
Twenty manager profiles on consistent revenue evaluation basis
Fifteen tracked disclosure and regulatory developments with commercial interpretation
Payment-in-kind and cash yield examined across the whole industry
Enforcement timelines quantified by jurisdiction against recovery assumptions

Built For The People Who Decide

From boardroom strategy to bench-side execution, this report is read cover-to-cover by leaders shaping the next decade of their industry, turning demand scenarios, market dynamics and valuation benchmarks into decisions.
CXOs/ Presidents/ VPs/ Managers
M&A and Corporate Development
Strategy Teams and R&D Heads
Procurement and Product Directors
Regulatory and Compliance Leaders
Investor Relations and Equity Analysts