Market Minds Advisory
Alternative Credit Scoring Market

Alternative Credit Scoring Market: Four Different Things Sold As One

Bank transaction data predicts default well. Social and device signals barely predict it at all. The category sells both under one name, and only one of them survives a fair lending review.

Lead Analyst

Published

September 2026

Make Smarter Decisions with Customized Research Insights

Request a free sample report and evaluate market opportunities, growth trends, and competitive dynamics relevant to your business needs.

2025 MARKET VALUE$4.6BMarket Size 2025
2036 FORECAST VALUE$20.2BBase Case , 2026 to 2036
CAGR 2026 TO 203614.4 %Bull 15.6% / Bear 13.2%
INCREMENTAL OPPORTUNITY$14.9BNet 10- year value creation
EXPANSION MULTIPLE3.84x2036 value over 2026 base
Strategic Levers
M&A Pipeline
Regional Outlook
Country Rankings
Competitive Intelligence
Segmental Deep-dive
Call-Us : 91 93563 13602

Executive Snapshot and Market Trajectory

Accuracy is not the constraint anybody thinks it is. A lender denying credit must state the principal reasons in plain language, so a model that cannot produce four defensible reasons cannot be used at all, however well it predicts. Accuracy is the second question.
East Asia holds 28% of value on lending platforms that built alternative underwriting because bureau coverage was thin when they started, with North America at 27% behind. Cash flow and transaction data underwriting grows at 21.6%, half again the market rate of 14.4%, because 24 months of bank data predicts default far better than anything else in the category. Nothing else in the category comes close to that on either measure at all here.
Concentration reaches 31% across bureaus, model vendors and data aggregators competing on quite different parts of the same decision. Around 26 million adults in one market alone hold no scoreable file, and a further group cannot be scored on the records that do exist for them. Every provider competes on a different part of the same lending decision, which is why buyers keep comparing offers that are not comparable.
Market Definition
The market covers revenue earned by providers of alternative credit scoring data, models and decisioning services, spanning cash flow and transaction data underwriting, rental and housing payment scoring, telecom and utility payment scoring, payroll and employment verification scoring, device and digital footprint scoring, and psychometric and survey-based assessment. Traditional bureau credit files and scores built on tradeline data, loan origination software, debt collection analytics, identity verification and fraud detection, and lending capital itself are excluded.
Base Year Value
$4.6B in 2025 (MMA Primary Research Dataset, August 2026)
Forecast Period
2026 to 2036, eleven discrete annual values
CAGR
14.4% base case. Bull 15.6%. Bear 13.2%.
Fastest Growth Segment
Cash Flow and Transaction Data Underwriting: 21.6% CAGR
Fastest Growth Country
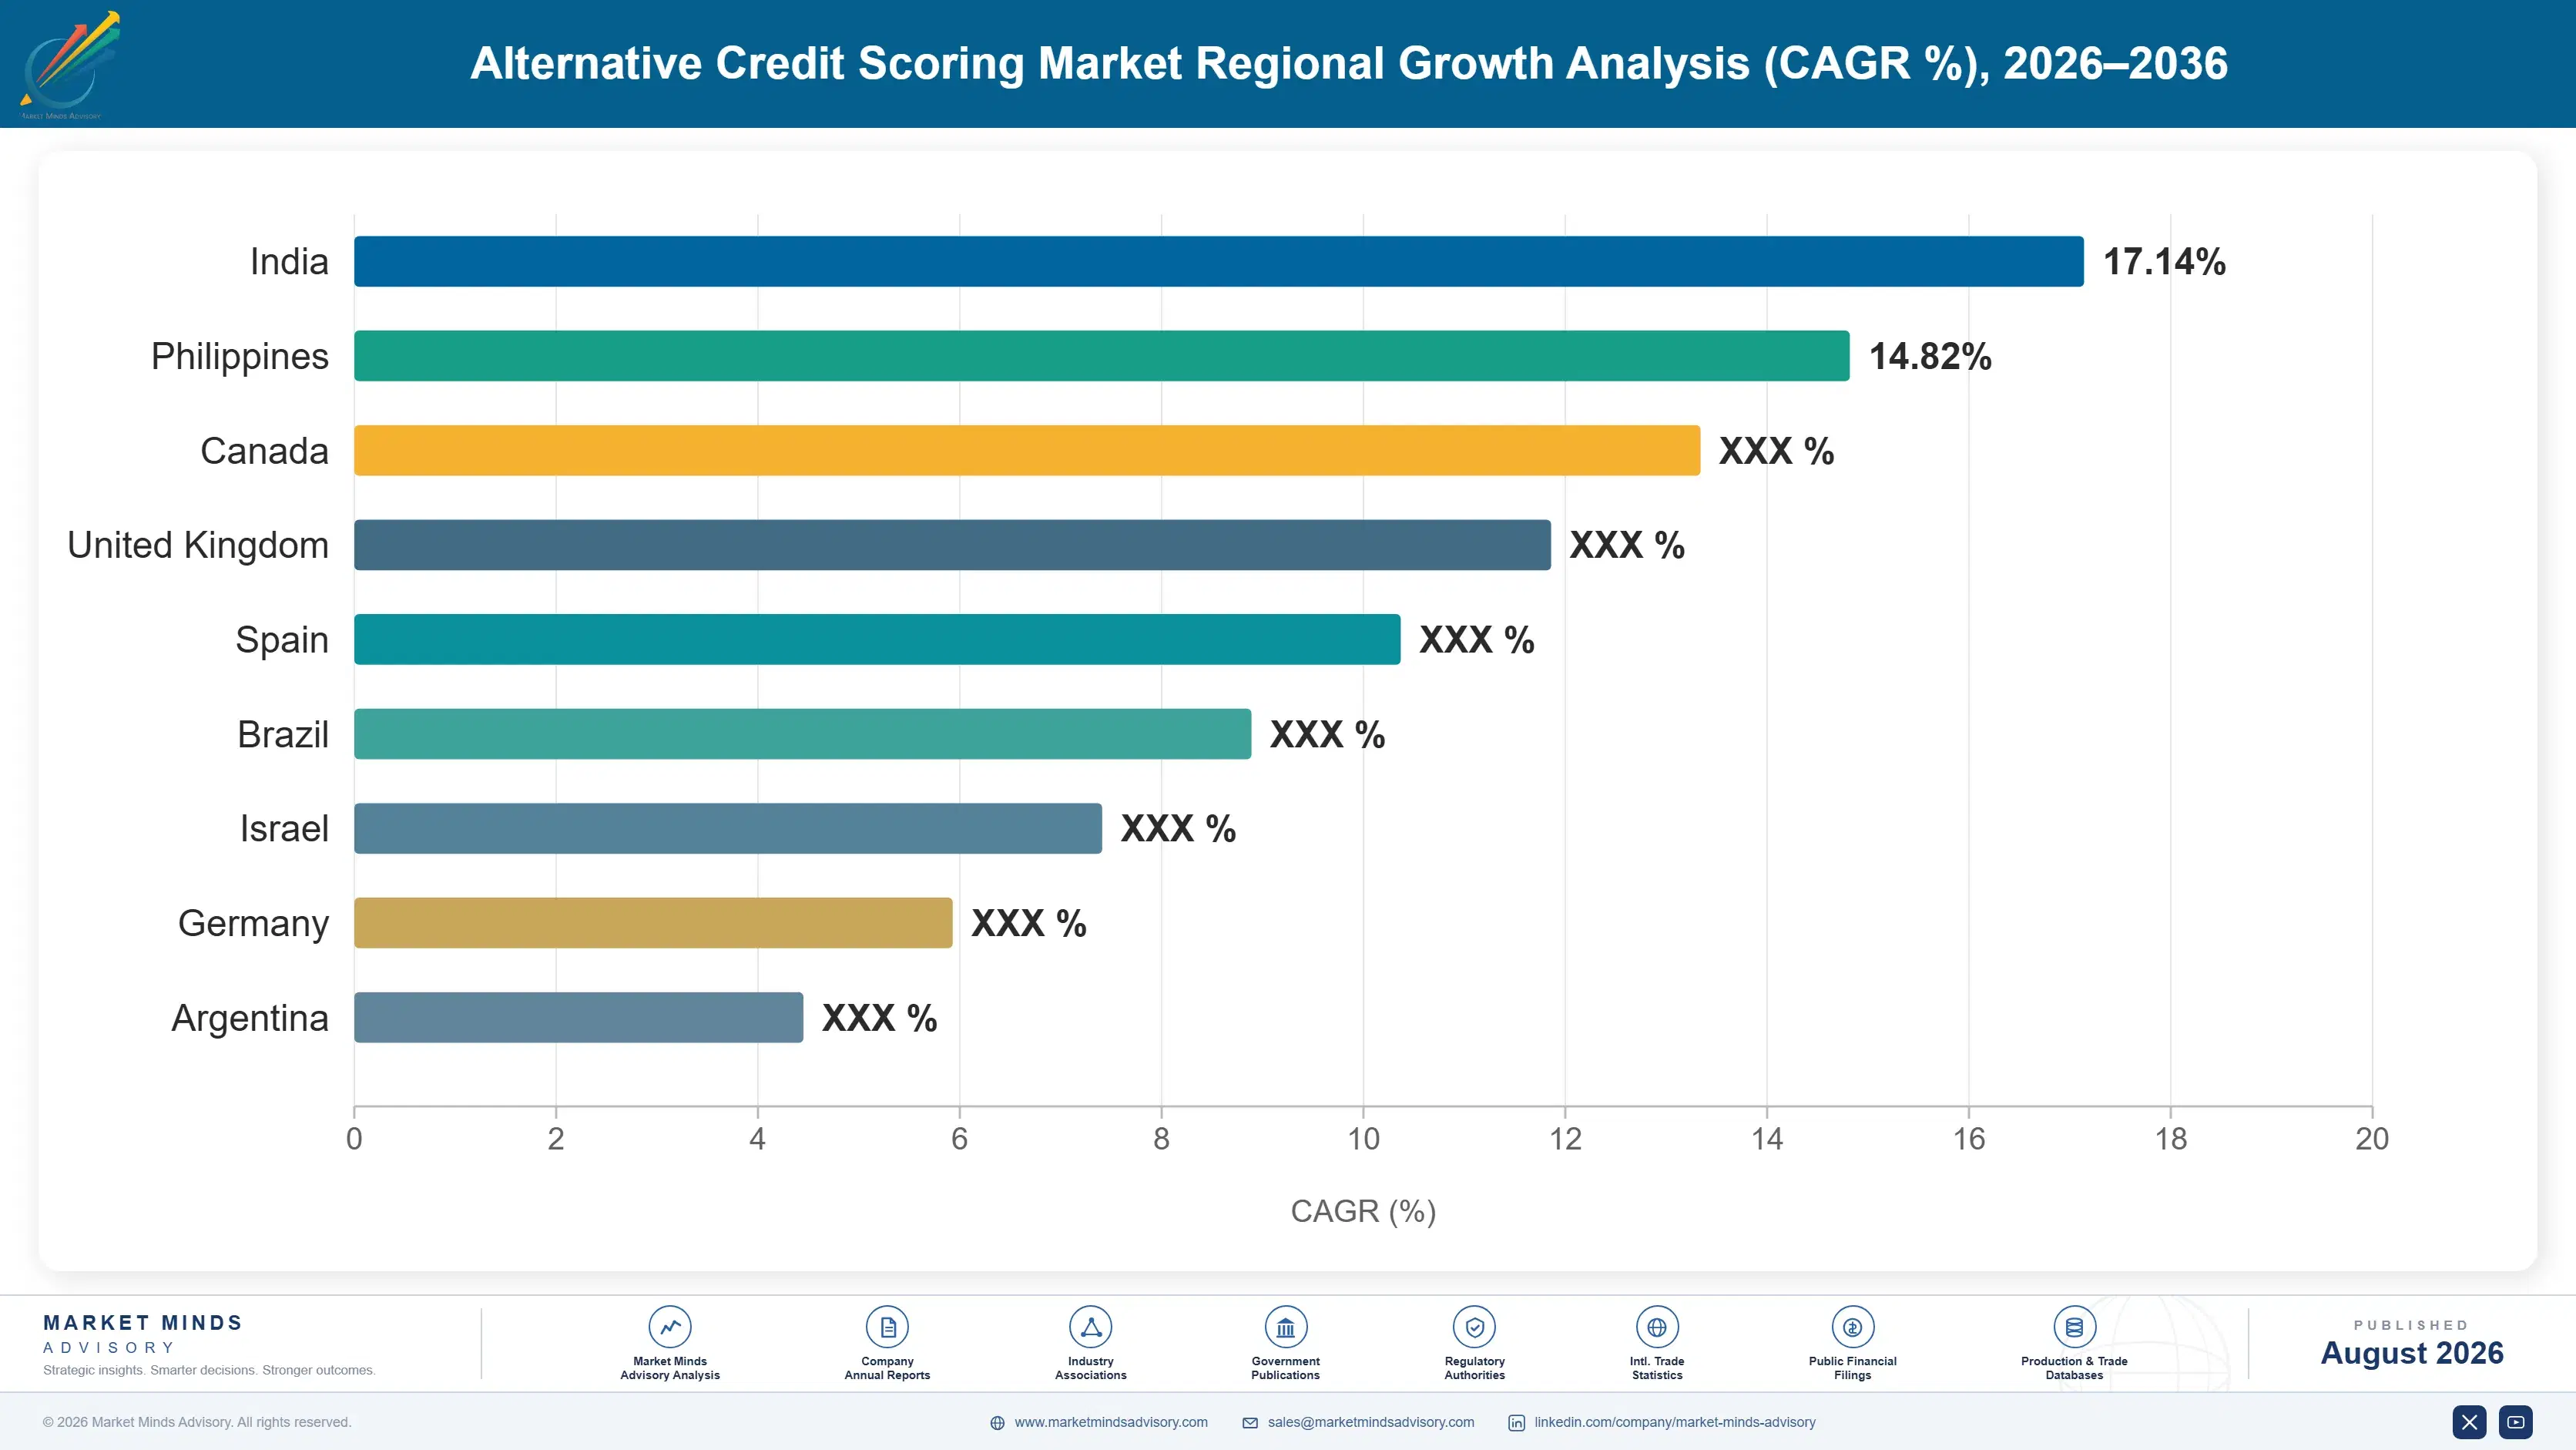
India: 16.4% CAGR
Fastest Growth Region
South Asia and Pacific: 16.6% CAGR
Largest Region
East Asia: 28% of 2025 global value
Market Leaders
FICO, TransUnion, Equifax, Plaid, LexisNexis Risk Solutions. Source: MMA Analysis based on disclosed credit decisioning and alternative data services revenue, company annual reports 2025.
Primary Survey
n=3,800 procurement and R&D decision-makers, Q4 2025, six countries
Methodology
Demand-side build-up, cross-validated against public data, 47 expert interviews

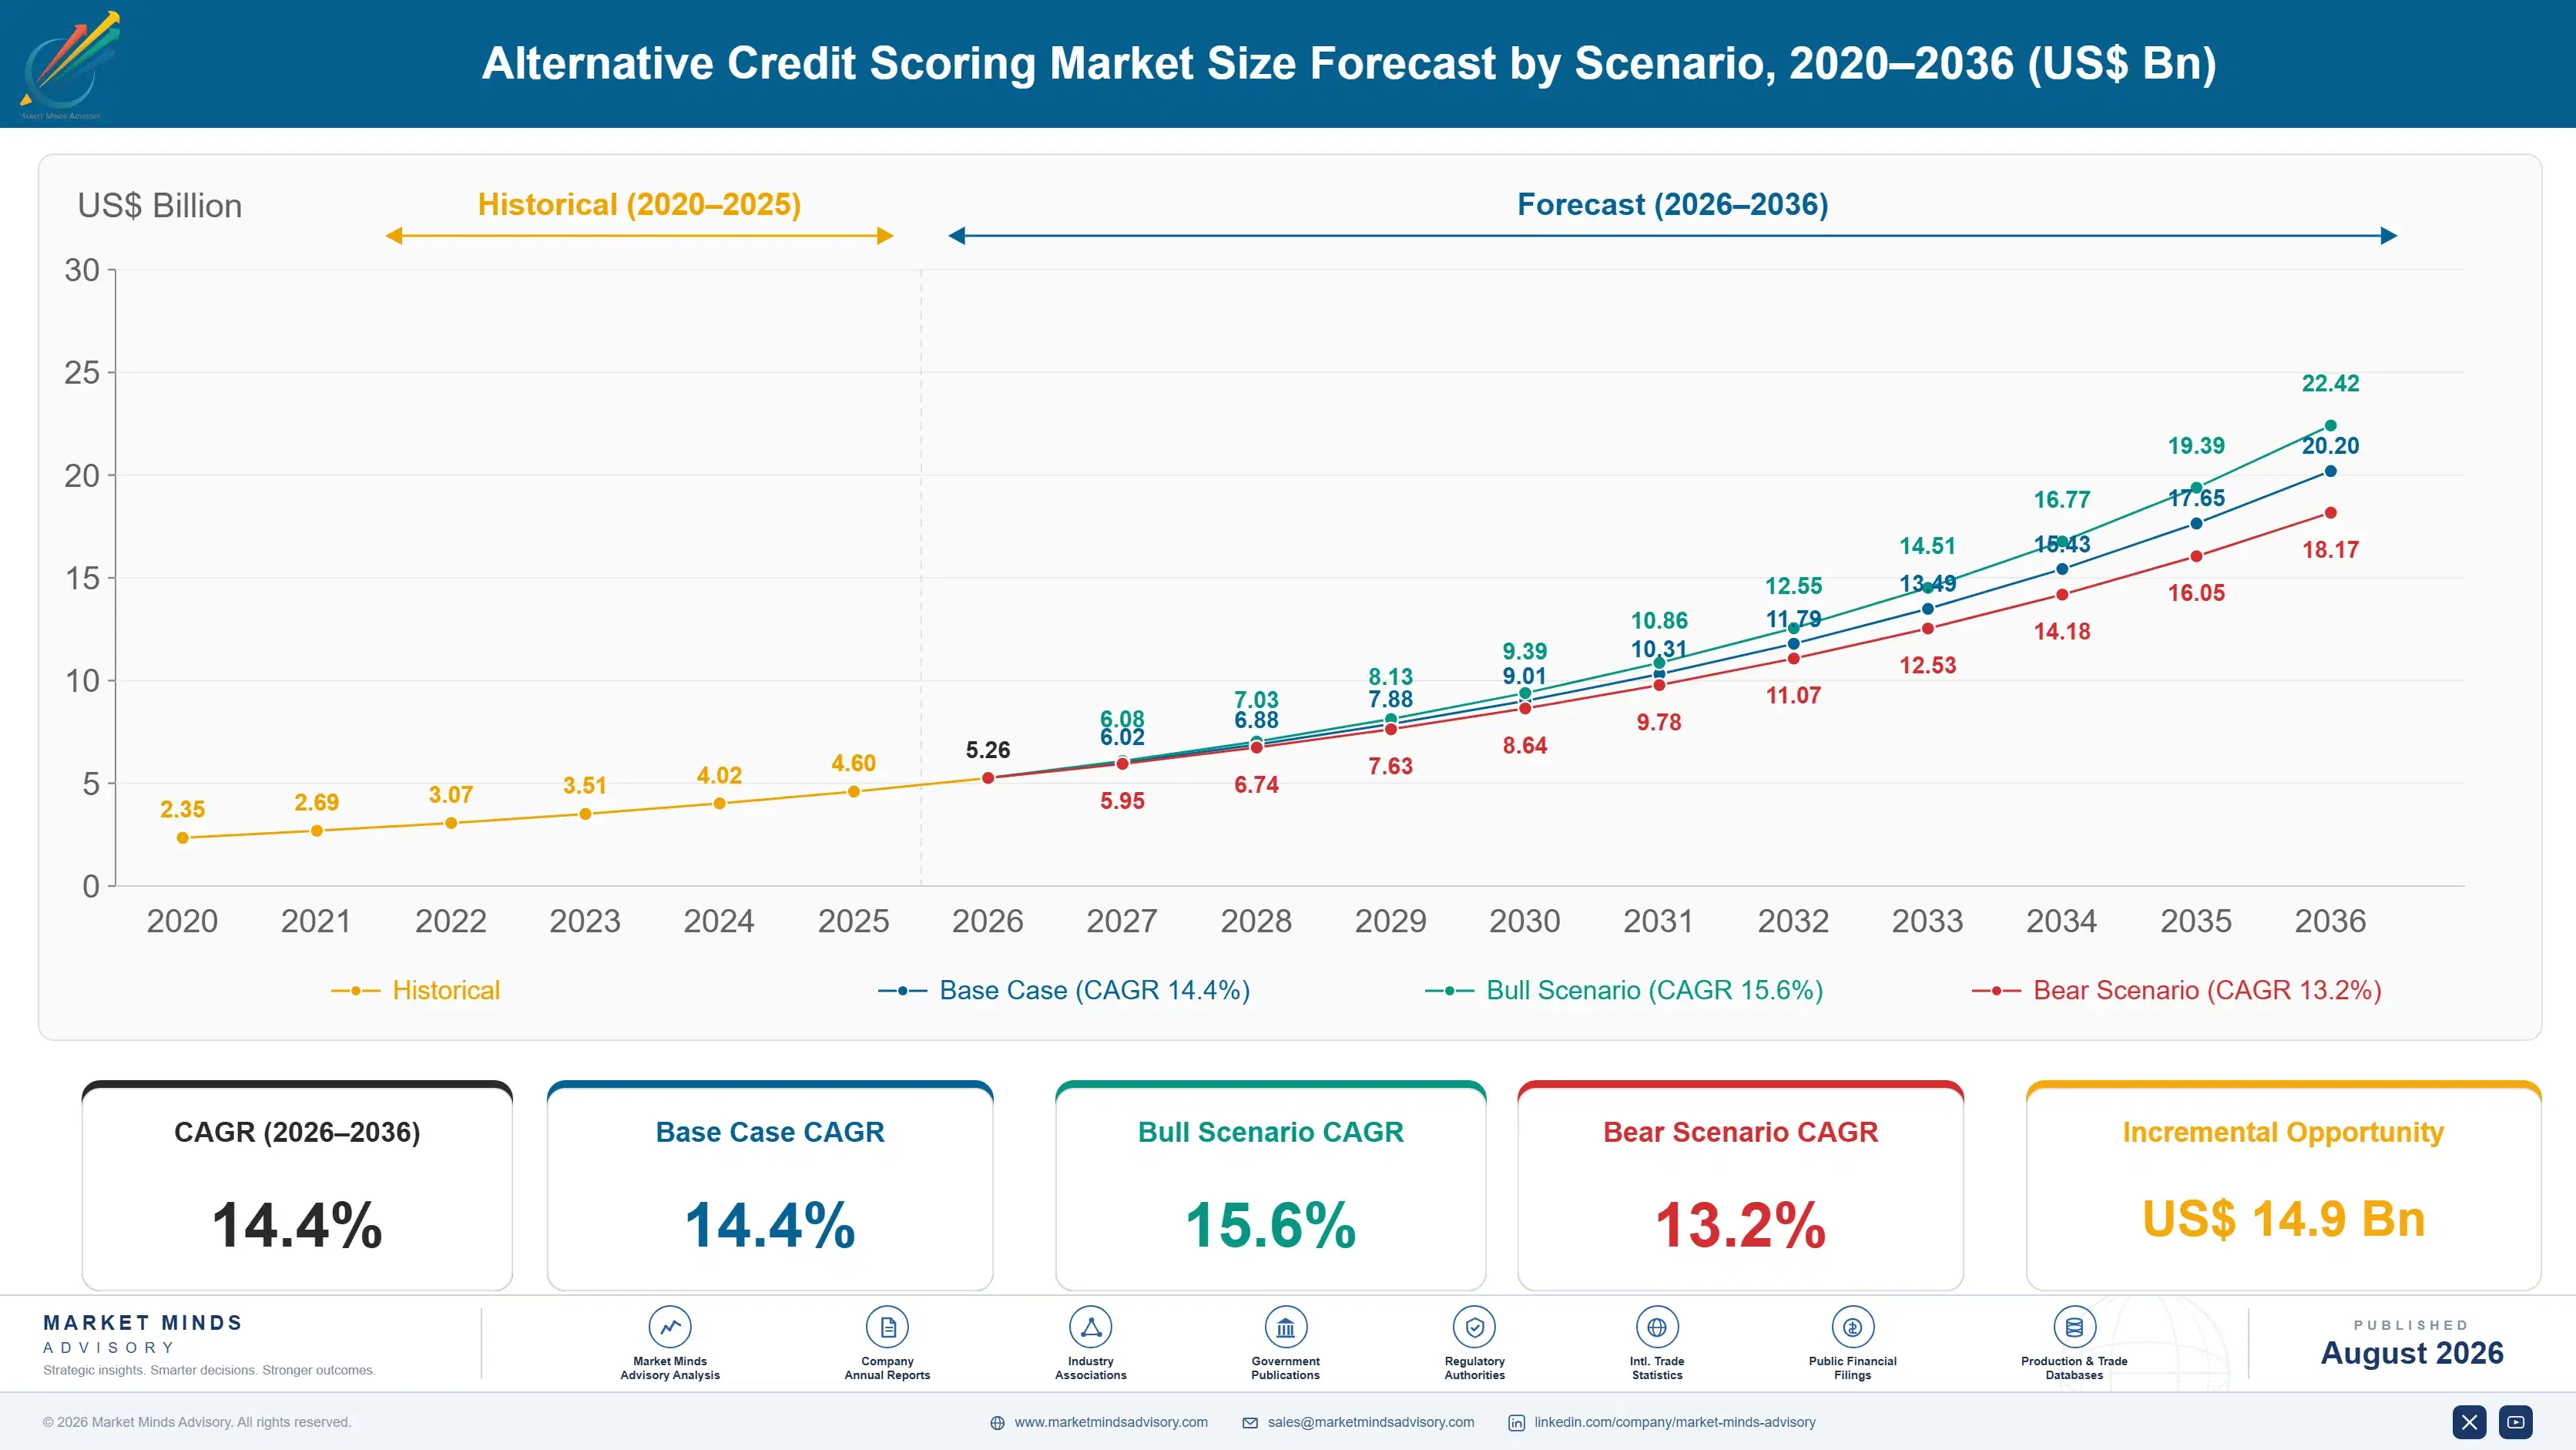
Alternative Credit Scoring Market Forecast Scenarios

alternative-credit-scoring-market-size-forecast-scenario-1787913331253
Growth from 2020 to 2025 ran at 13.2% and the composition shifted underneath it. Early enthusiasm for social, device and psychometric signals faded once fair lending reviews began asking what those variables actually proxied for. Cash flow underwriting took their place, encouraged by supervisory statements and made practical by open banking access. Digital lending in several emerging markets grew fast, defaulted badly and attracted regulation that reshaped it.
The 14.4% base case rests on three mechanisms. Consented bank data access keeps widening as data rights rules take effect across major jurisdictions. Rent reporting keeps expanding, since housing payment is the largest recurring obligation most thin-file consumers actually have. And Indian account aggregator infrastructure keeps maturing into the most usable consented data rail anybody has built. None of the three requires any new modelling technique of any kind at all.
The bull case at 15.6% assumes data access rules settle into workable standards and lenders adopt cash flow underwriting across mainstream portfolios rather than only thin-file segments. The bear case at 13.2% is fair lending enforcement tightening around proxy variables, which would push lenders back toward bureau data they already know how to defend when a regulator asks about it.

Explain The Denial Or Do Not Lend

Four quite different things get sold under one label and the differences matter enormously. Bank transaction data predicts default well and improves on a traditional file by around 18%. Rent, telecom and utility payment records predict moderately and are increasingly accepted. Device and digital footprint signals predict weakly. Psychometric assessment predicts weakly and embarrasses everybody involved. A buyer treating these as interchangeable is buying on the label.
FIVE-FIRM CONCENTRATION31%Share of category revenue held by the largest decisioning providers
CREDIT INVISIBLE ADULTS26Millions in one market alone without any scoreable file
TRANSACTION HISTORY DEPTH24 monthsBank data window typically used for cash flow assessment
ADVERSE ACTION REASONS4Principal reasons a lender must give for any denial
CASH FLOW LIFT18%Improvement in default prediction against traditional file alone
THIN FILE APPROVAL UPLIFT27%Additional applicants approved without raising expected loss rates
The binding constraint is explainability, not accuracy, which surprises technologists and never lenders. Denying credit requires stating the principal reasons, usually up to four, in language a consumer can act on. A model producing an accurate score it cannot decompose into defensible reasons cannot lawfully drive that decision. Regulators have said so explicitly about complex algorithms. Accuracy without explanation is unusable in regulated lending.
Fair lending is the second gate and it catches things nobody intended. A variable that correlates with a protected characteristic creates exposure even where nobody selected it for that reason, and postcode, device type and educational history all do exactly that. Model validation means every variable has to survive that review. Cash flow data survives comfortably, because income and expense behaviour is what lenders always tried to infer.
"Every vendor in this category will show you a lift chart. Ask them instead to write the four adverse action reasons their model produces for a declined applicant, and watch how quickly the conversation moves to what they call the roadmap."
Principal Analyst, Credit Risk Analytics Practice · MMA Credit Risk Analytics and Decisioning Practice · August 2026

Market Trends

Cash Flow Data Displaces Every Other Alternative Signal

Twenty-four months of bank transaction data yields income stability, expense volatility, overdraft frequency and balance patterns, which improves default prediction by roughly 18% over a traditional file and survives fair lending review without difficulty. That segment grows at 21.6%. Social, device and psychometric signals have been quietly dropped by most serious lenders, not because they were prohibited but because nobody could defend what those variables were actually measuring. The variables were dropped for being indefensible rather than for being inaccurate, which is a distinction the category still struggles to explain.
Market Impact: Grows Indian demand at 16.4%
Rent Reporting Reaches The Largest Missing Obligation

Housing payment is the biggest recurring commitment most thin-file consumers hold and historically it appeared nowhere in any credit file, which meant years of reliable payment counted for nothing at all. Rent reporting into bureaus and into scoring models has expanded quickly. That segment grows at 16.8%. Coverage remains patchy because it depends on landlords and property managers participating, and most small landlords have no reason whatsoever to bother. Institutional landlords report and individual ones do not, which skews coverage toward exactly the tenants least likely to need it at all.
Market Impact: Approves 27% more applicants

Market Opportunities and Growth Drivers

Consented Data Rails Make Access Practical And Lawful

Personal financial data rights rules across major jurisdictions oblige institutions to share customer data on consented request, which converts bank transaction access from a screen-scraping workaround into a supervised arrangement lenders can actually rely on. India grows fastest at 16.4% on account aggregator infrastructure that is arguably the most usable consented rail anybody has built. Access becomes a compliance question rather than an engineering one, which changes who can compete. An institution can no longer simply block access one morning and leave a lender's underwriting broken by that lunchtime instead.
Market Impact: Requires 4 defensible denial reasons

Thin File Approval Uplift Is Now Measurable

Lenders applying cash flow assessment to previously declined applicants report approving around 27% more of them without any increase in expected loss rates, which is a genuinely unusual result and the strongest commercial argument this category has. Around 26 million adults in one market alone hold no scoreable file at all. Growth without added risk is the only proposition that reliably moves a chief risk officer who has heard every other pitch already. Nothing else this category sells produces a number a board will actually act upon at all here.
Market Impact: Removes 3 variables per model

Market Restraints and Challenges

A Model That Cannot Explain Itself Cannot Lend

Denying credit requires stating principal reasons, usually up to four, in language a consumer can act upon, so a model producing an accurate score it cannot decompose into defensible reasons is unusable regardless of performance. Root cause is consumer protection law rather than any technical limitation. Commercial impact is that complex approaches stall in procurement. Mitigation runs through constrained model forms and reason code generation, both of which cost predictive performance in practice. Predictive performance is simply not the thing a compliance function is being asked to approve at all.
Market Impact: Improves default prediction by 18%

Proxy Variables Create Exposure Nobody Intended

A variable correlating with a protected characteristic creates fair lending exposure even where nobody selected it for that purpose, and postcode, device type and educational history all correlate in exactly that way. Root cause is that useful predictors and protected characteristics share underlying causes. Commercial impact is variables removed late in validation after models are built around them. Mitigation involves disparate impact testing throughout development rather than as a final compliance gate. Nobody selects postcode intending it as a proxy, and the exposure arrives regardless of anybody's actual intention anyway.
Market Impact: Grows rent scoring at 16.8%
3 additional market trends, 2 additional growth drivers, and 4 additional restraints and challenges are covered in the full report. Contact sales@marketmindsadvisory.com to access the complete intelligence.

Segment CAGR and Growth Architecture

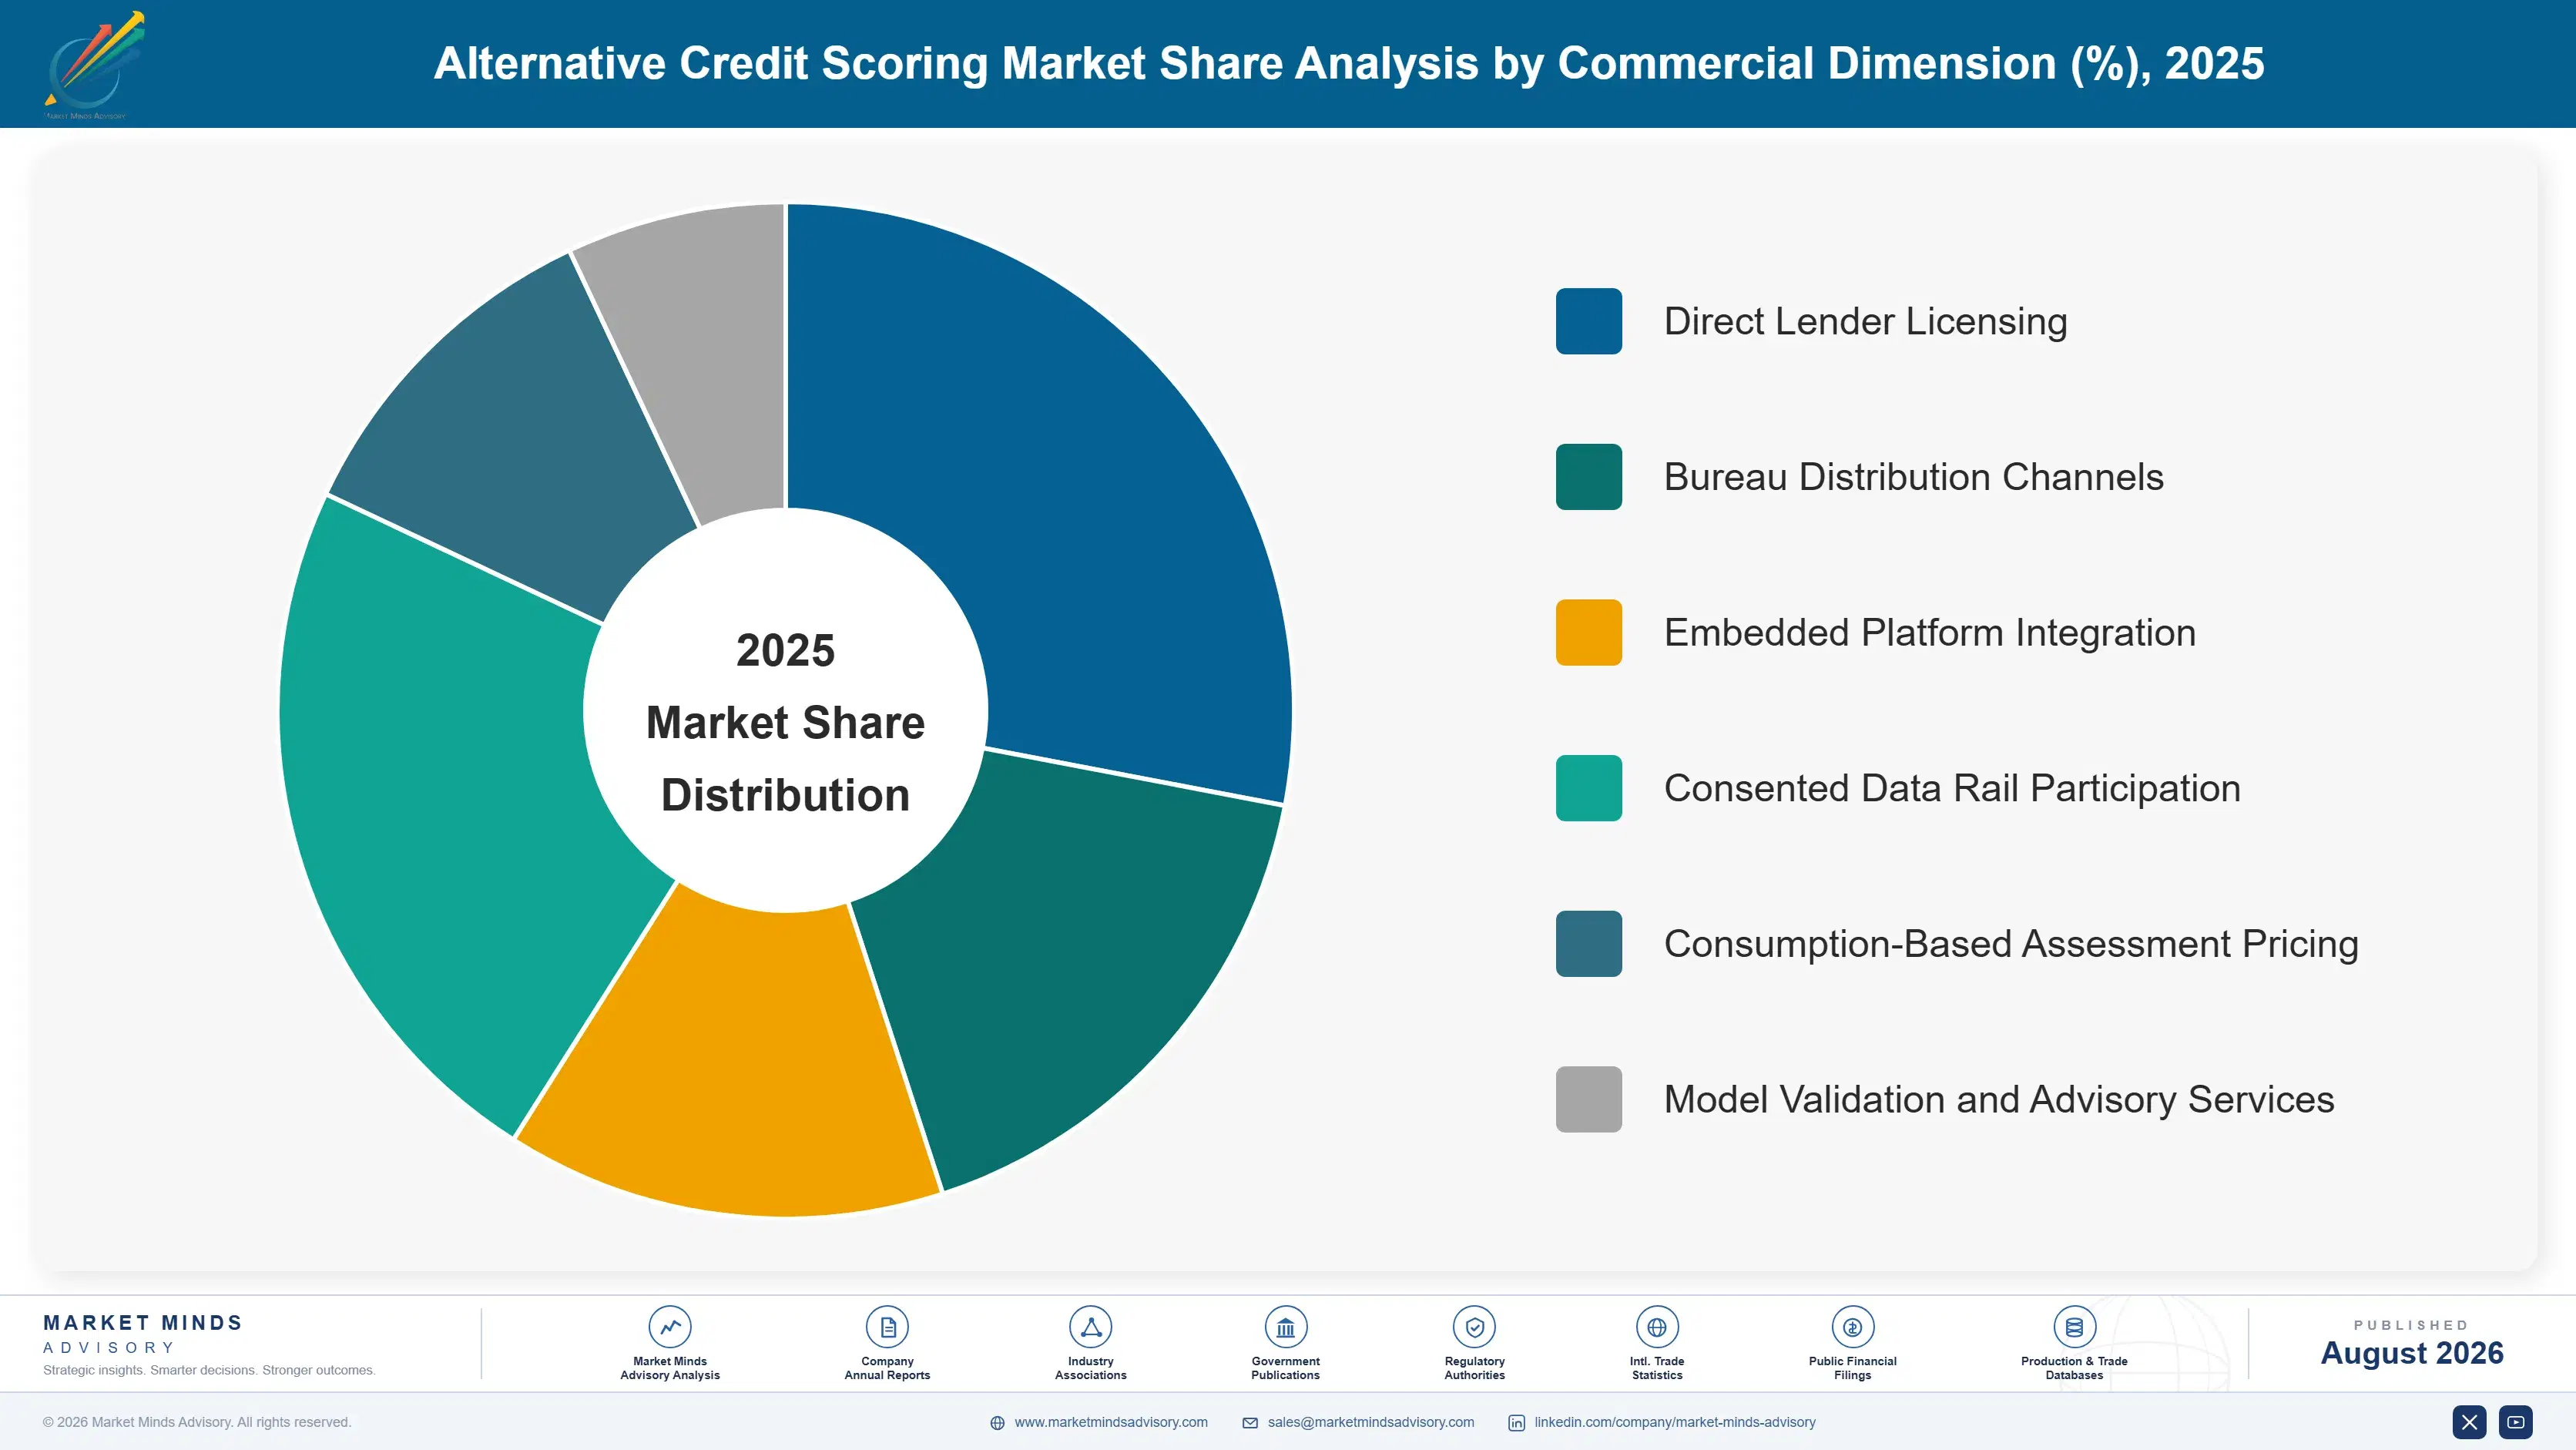
Segmentation follows data source and assessment type, since predictive power, regulatory acceptability and acquisition cost all differ by source rather than by lender or product. Six categories cover the market without overlap. Lending product, borrower segment and delivery model are treated as separate commercial dimensions throughout this report rather than as segmentation logic here.
alternative-credit-scoring-market-market-share-analysis-1787913331825

Cash Flow and Transaction Data Underwriting

Transaction-based assessment grows at 21.6%, half again the market rate of 14.4%, because 24 months of bank data yields income stability, expense volatility and overdraft behaviour that improve default prediction by roughly 18% over a traditional file alone. It also survives fair lending review comfortably, since income and expense patterns are precisely what every lender was always trying to infer from proxies. The constraint is data access cost, which has risen sharply as institutions moved from tolerated scraping toward paid interfaces. Institutions have moved from tolerating screen scraping toward paid interfaces within about three years, and per-call charges now scale directly with assessment volume in a way flat vendor contracts never anticipated.
CAGR 21.6%

Rental and Housing Payment Scoring

Rent-based scoring grows at 16.8% by capturing the single largest recurring obligation most thin-file consumers actually hold, which historically appeared in no credit file anywhere and therefore counted for nothing despite years of reliable payment. Coverage depends entirely on landlords and property managers choosing to report, and small landlords have no incentive at all to participate. That leaves the data concentrated among institutional property owners, which skews coverage toward exactly the tenants who need it least. Years of reliable rent payment still count for nothing at all wherever the landlord simply cannot be bothered to report, and no amount of consumer demand has yet changed that in any meaningful way.
CAGR 16.8%
Full segment breakdown across 6 segments available in the complete report.

Regional Architecture and Country Demand Map

Adoption follows the thinness of existing bureau coverage rather than the size of the lending market, which is why several wealthy markets have moved considerably slower than poorer ones. Regulatory tolerance for proxy variables then explains a good part of the rest of the pattern.

North America

Regulatory structure shapes everything here, since adverse action requirements and fair lending testing set the boundary within which any model has to operate before accuracy becomes relevant at all. Supervisory statements encouraging cash flow underwriting gave lenders cover to adopt it, and personal financial data rights rules have moved access from tolerated scraping toward supervised interfaces. Around 26 million adults hold no scoreable file. Bureaus, model vendors and aggregators all compete for parts of the same decision. Cash flow assessment has moved beyond thin-file populations into mainstream affordability testing at several large lenders, which is the adoption step the whole category needed and which nobody outside the region has yet matched at comparable scale.
Share: 27% | CAGR: 13.2% (2026 to 2036)

Western Europe

Open banking arrived here first and produced less lending innovation than anybody expected, largely because bureau coverage was already reasonably comprehensive and the thin-file problem is genuinely smaller. Data protection requirements impose consent and purpose limitation obligations that constrain reuse considerably. Cash flow assessment is used mainly for affordability verification rather than for scoring previously unscoreable applicants. Nordic markets, with near-complete public income data, have the least need for any of it. Rent reporting has developed considerably slower here than in North America, partly because tenancy structures differ and partly because the credit files most consumers already hold are comprehensive enough that housing payment history adds relatively little predictive value on top of them.
Share: 18% | CAGR: 12.8% (2026 to 2036)
Regional intelligence for 5 additional markets available in the complete report: East Asia, South Asia and Pacific, Latin America, Middle East and Africa, Eastern Europe. Contact sales@marketmindsadvisory.com.
alternative-credit-scoring-market-country-cagr-analysis-1787913332349

Sell The Reason Codes First

Cash flow data improves prediction by 18%, thin-file approval rises 27% without added loss, denials require four principal reasons and 24 months of history sets the assessment window. Four levers work on explainability, measured uplift, data access economics and consented rails rather than on model accuracy, which is never the thing that stalls a deal.

Lead With Reason Codes Rather Than Lift Charts

A lender cannot use a score it cannot decompose into 4 defensible principal reasons, which makes explainability the first question in every serious procurement and the last thing most vendors prepare for. Demonstrating reason code generation on declined applications answers the objection that stalls deals. Vendors leading with predictive lift are answering a question the buyer will only reach after the compliance function has already approved or rejected them entirely. Compliance approves or rejects a vendor before credit risk has ever once opened the 18% lift chart at all anyway.
Market Impact: Generates all 4 defensible adverse action reason codes

Quantify Approval Uplift At Constant Loss Rates

Cash flow assessment approves around 27% more previously declined applicants without raising expected losses, which is the only proposition in this category that moves a chief risk officer rather than merely interesting them. Growth without added risk is rare enough to command attention. Vendors describing capability rather than proving uplift on the lender's own declined population are asking for trust that nobody in credit risk extends to a new supplier. Running the model against their own historic decline population takes only a few weeks and it settles the argument permanently afterwards.
Market Impact: Proves a 27% approval uplift at constant loss

Price Around Rising Data Access Cost Deliberately

Institutions have moved from tolerated screen scraping toward paid interfaces, and per-call data costs now represent a material share of what a cash flow assessment actually costs to produce. Vendors who priced when access was effectively free are discovering margins they cannot hold. Restructuring toward consumption-based pricing that passes access cost through protects the model, and doing it before renewal is considerably easier than doing it afterwards. Access charges now run to roughly 30% of what an assessment costs to produce, which is not a rounding error anybody can absorb quietly.
Market Impact: Passes through around 30% of total access cost

Build On Consented Rails Rather Than Around Them

Account aggregator and data rights frameworks convert access from an engineering problem into a compliance arrangement, which favours vendors positioned inside those rails and disadvantages anybody still maintaining scraping infrastructure. India grows fastest at 16.4% on precisely this basis. Building against a supervised rail costs integration effort and removes the recurring risk that an institution simply blocks access one morning without any notice at all. A supervised rail cannot be withdrawn at commercial whim, which is a different kind of dependency from the one every scraping-based provider currently carries on its books.
Market Impact: Follows Indian demand now growing at 16.4% annually

Who Controls the Margin Pool

Measured on disclosed credit decisioning and alternative data services revenue, the five largest providers hold a CR5 of 31%, reflecting a market where bureaus, model vendors and data aggregators supply quite different parts of the same lending decision. FICO holds the deepest scoring and regulatory credibility, TransUnion and Equifax carry bureau distribution alongside alternative data assets, Plaid holds substantial consented access infrastructure, and LexisNexis Risk Solutions brings broad data breadth. No single provider supplies the whole decision, and buyers routinely compare offers that address entirely different parts of it.
Three contests run at once. Data access competes on institutional coverage and reliability. Model supply competes on explainability and validation support. Bureau distribution competes on being already integrated into every lending workflow. The three reward different capabilities and almost nobody holds more than one of them convincingly.

Pressure builds from rising data access costs squeezing vendors who priced when access was free. Rankings shift toward whoever sits inside consented rails rather than whoever holds the widest scraping coverage. Predictive lift has become the least interesting thing anybody in this market sells, which nobody selling it has yet accepted.
alternative-credit-scoring-market-company-positioning-matrix-1787913332871

Competitive Moat and Risk Dimensions

FICO

Moat: Regulatory Credibility And Model Acceptance

Decades of models accepted by supervisors, examiners and lender compliance functions creates a presumption of defensibility that a new vendor cannot manufacture at any price. Credit risk officers are cautious buyers and a name that has survived examination repeatedly shortens every internal approval. That acceptance covers explainability and validation practice as much as performance.
FICO

Risk: Incumbency Slows Data Adoption

A position built on established scoring creates real reluctance to move quickly on data sources that might cannibalise it, and newer entrants have moved faster on consented transaction access. Regulatory credibility does not confer data access, and the institutions controlling that access have their own commercial views about who should hold it.
PLAID

Moat: Institutional Coverage And Connection Reliability

Broad coverage across financial institutions with connections that actually work is genuinely hard to build and continuously expensive to maintain, since every institution changes interfaces on its own schedule. Lenders will not deploy an assessment that fails for a meaningful share of applicants. That reliability is far more defensible than anything in the analytics layer above it.
PLAID

Risk: Access Economics Shifting Against Aggregators

Institutions moving from tolerated access toward paid interfaces changes the cost base fundamentally, and the largest ones hold considerable negotiating power over terms. An intermediary sitting between data holders and data users is exposed whenever either side decides the intermediary captures more value than it contributes.

Players Tracked

Prominent Players

FICO
TransUnion
Equifax
Plaid
LexisNexis Risk Solutions

Other Key Players

Nova Credit
Zest AI
Provenir
Prism Data
MX Technologies
Finicity
Envestnet Yodlee
Tink
TrueLayer
CRIF
Creditinfo
Trust Science
Aire
Pagaya
Perfios

Recent Developments

JANUARY 2025

Large institution moves data access onto paid interface pricing

A major financial institution completed migration of third-party data access onto a paid interface with per-call pricing, ending the tolerated arrangement that had preceded it. This was a commercial and technical change rather than any restriction on customer data rights, and aggregator cost bases moved immediately.
Signal: Free data access is ending, and every vendor who priced around it must now reprice quite quickly.
JUNE 2025

Lender publishes approval uplift results from cash flow assessment

A consumer lender published results from applying cash flow assessment to a previously declined applicant population, reporting materially higher approval rates at unchanged expected loss levels. This was an internal programme result rather than any vendor claim, and it gave the category evidence it had lacked.
Signal: Published lender results carry a weight that vendor lift charts have never once managed to match.
SEPTEMBER 2025

Supervisor issues guidance on adverse action reasons from complex models

A financial supervisor issued further guidance on producing specific adverse action reasons where credit decisions rely on complex algorithmic models. This was interpretive guidance rather than any new rule, and it confirmed that accuracy provides no exemption at all from the explanation requirement whatsoever anywhere.
Signal: Explainability remains the gate here, and no amount of predictive performance ever opens it for anybody.

Data Access, Validation, Compliance

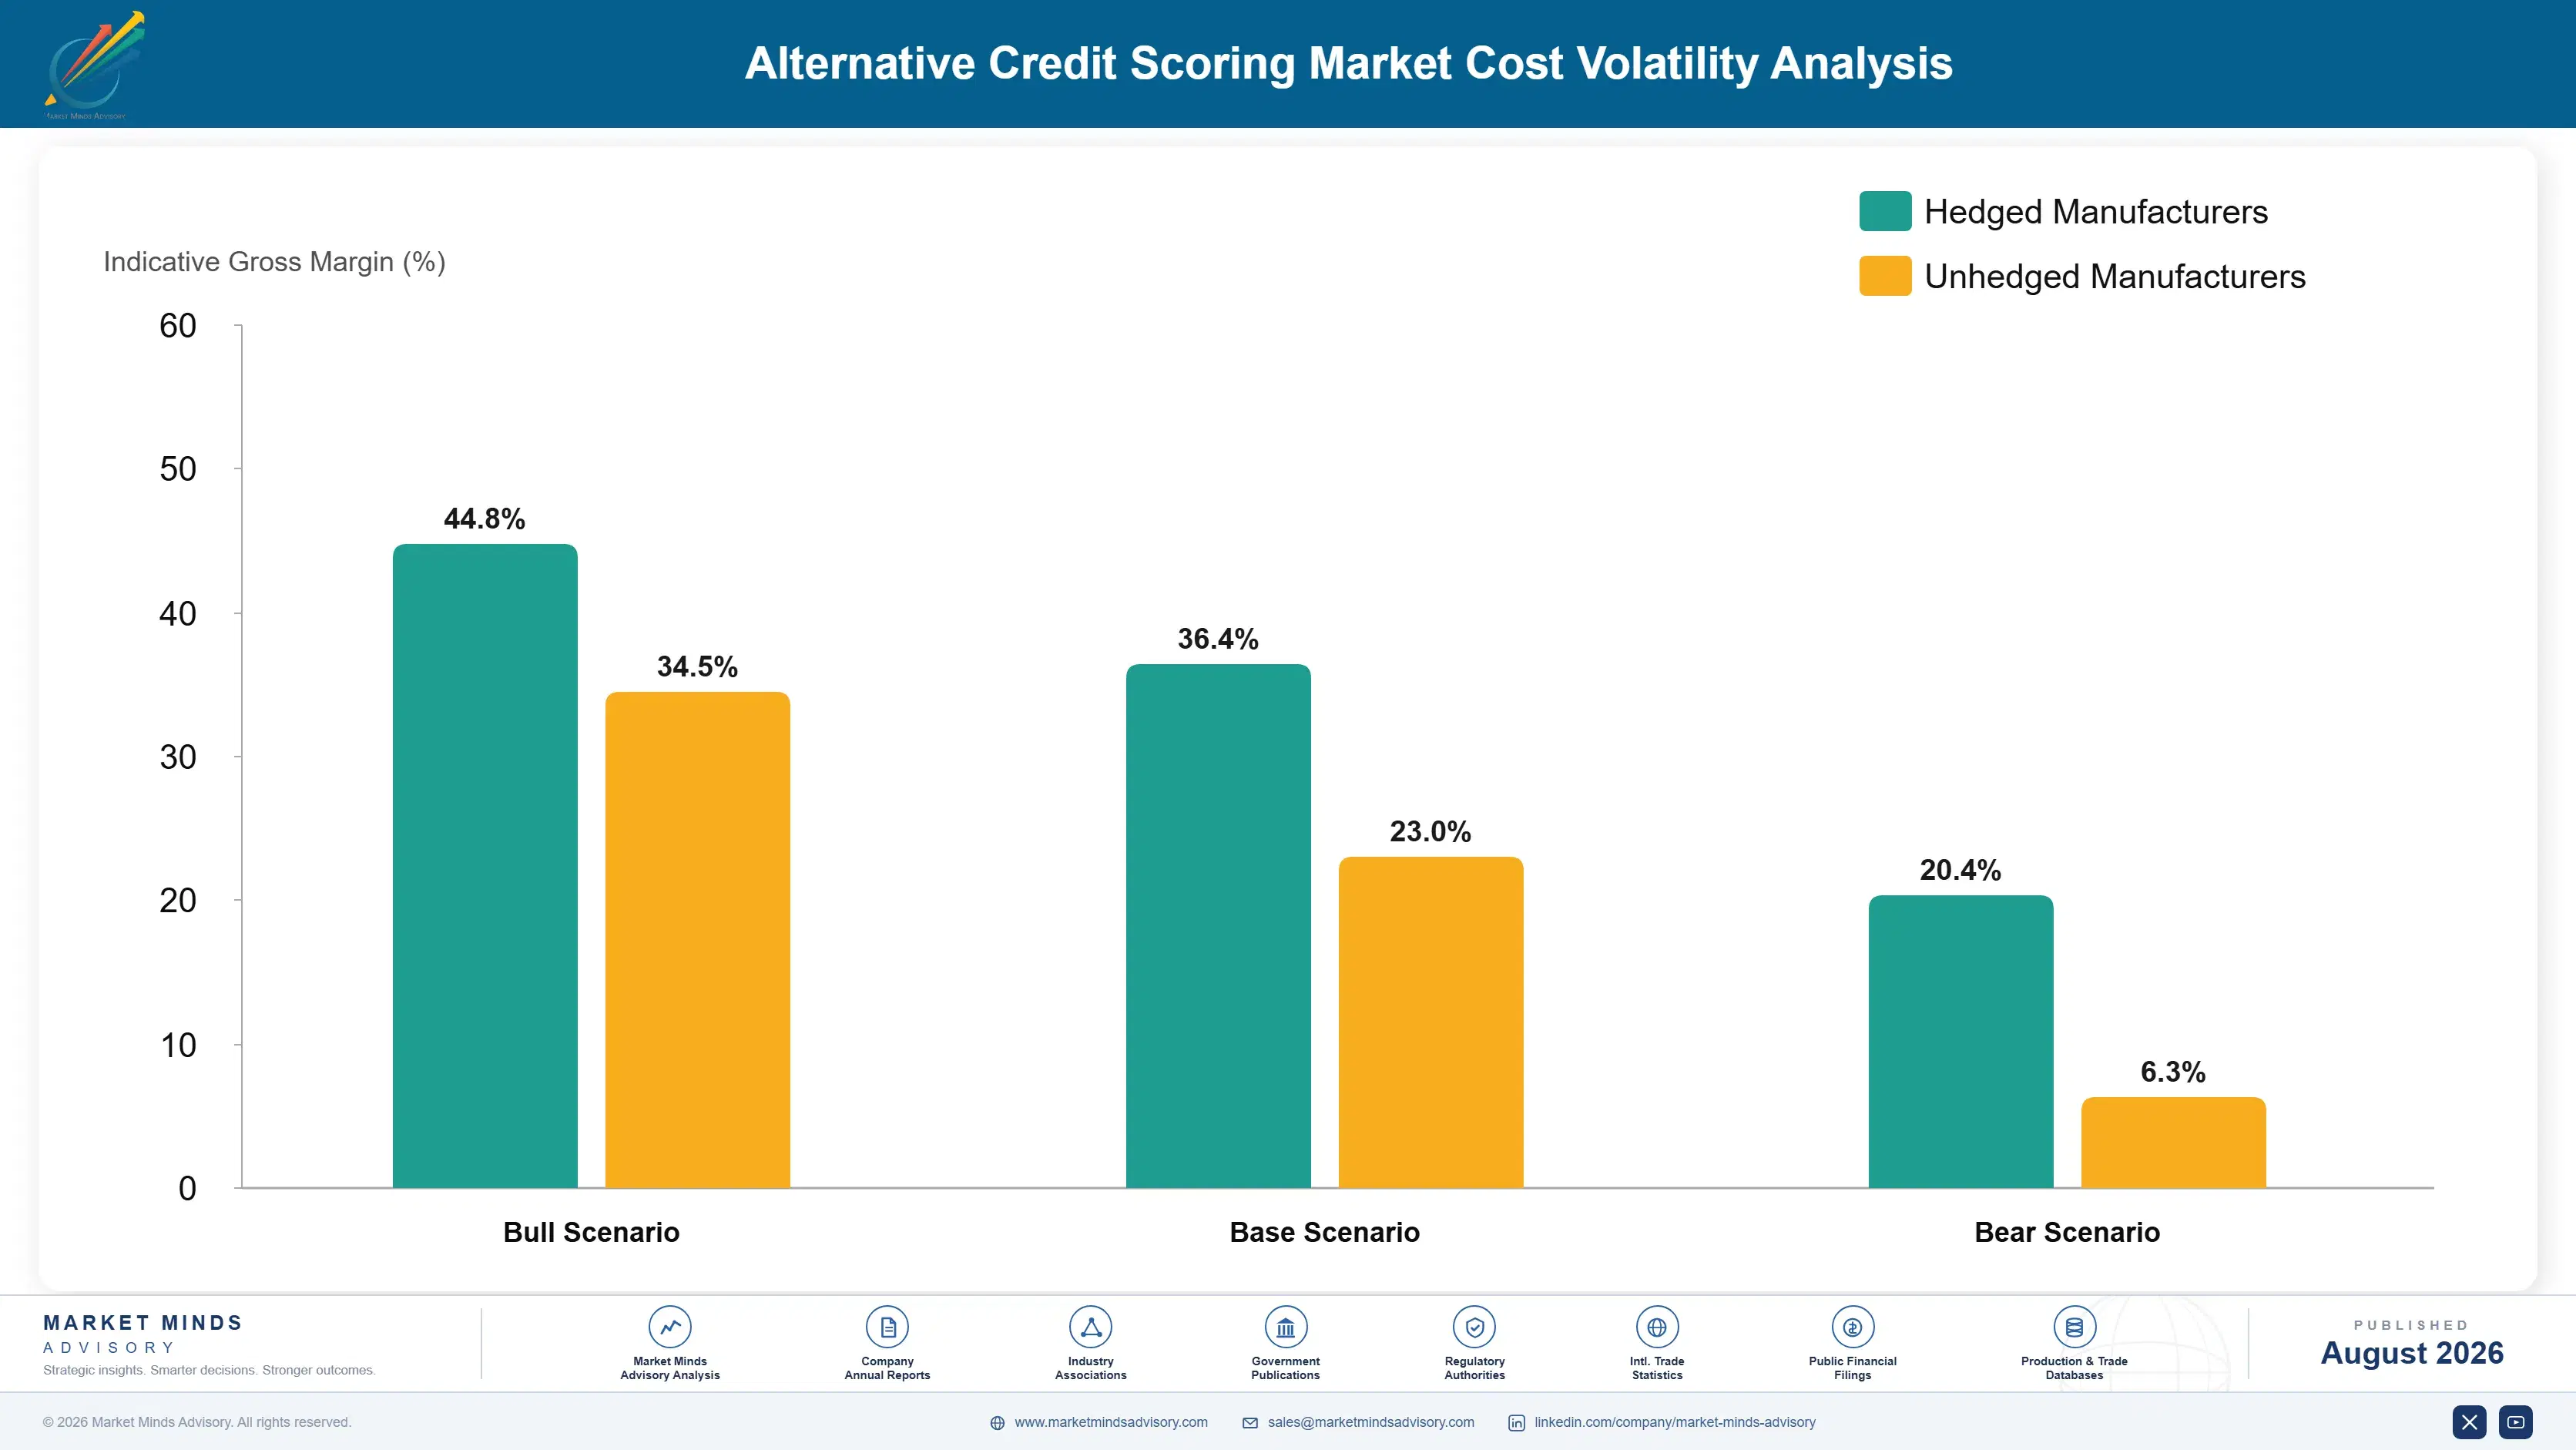
Three costs dominate provider economics. Data acquisition and access fees, model development with independent validation, and fair lending testing and compliance operations together account for 58 to 72% of revenue at a typical provider. Data access is the item that has moved most, since institutions have shifted from tolerating screen scraping toward paid interfaces with per-call pricing, which converts a fixed engineering cost into a variable one scaling with volume.
Two regulatory movements reset the position. Personal financial data rights rules finalised by the Consumer Financial Protection Bureau established consented access obligations while permitting reasonable cost recovery. European Commission frameworks moved in a comparable direction for financial data access. The Reserve Bank of India account aggregator structure built a consent rail with regulated intermediaries. FICO Annual Report 2024 disclosures describe the resulting decisioning cost environment.

Exposure divides by position in the chain rather than by scale. Providers holding direct institutional relationships negotiate access terms; those buying through aggregators absorb whatever is passed down to them. Bureaus with existing lender integration recover cost through pricing power that pure model vendors do not have. Vendors who priced when access was free carry margins they cannot defend, and renewal makes that visible.
alternative-credit-scoring-market-cost-volatility-analysis-1787913333067

Restructure pricing toward consumption before the next renewal

Per-call data access costs now scale directly with assessment volume while many contracts were priced flat when access cost nothing. Moving to consumption-based pricing that passes access cost through requires renegotiating terms customers currently like. Doing it at renewal is far easier than doing it after margins have already gone, and the arithmetic only worsens with waiting.

Build disparate impact testing into development, not the end

Variables correlating with protected characteristics are routinely removed late in validation, after models have been built around them and considerable work has been wasted. Testing throughout development costs discipline and slows early iteration noticeably. It avoids rebuilding models that a compliance function was always going to reject at the very final approval gate anyway.

Negotiate access directly with the largest institutions

Providers buying data through aggregators absorb whatever access costs get passed down and hold no ability to negotiate them at all. Direct institutional relationships require commercial and technical effort per institution and take considerable time to establish. They convert an uncontrollable input cost into a negotiated one across the institutions that matter most by volume.

Portfolio Architecture for Margin Defence

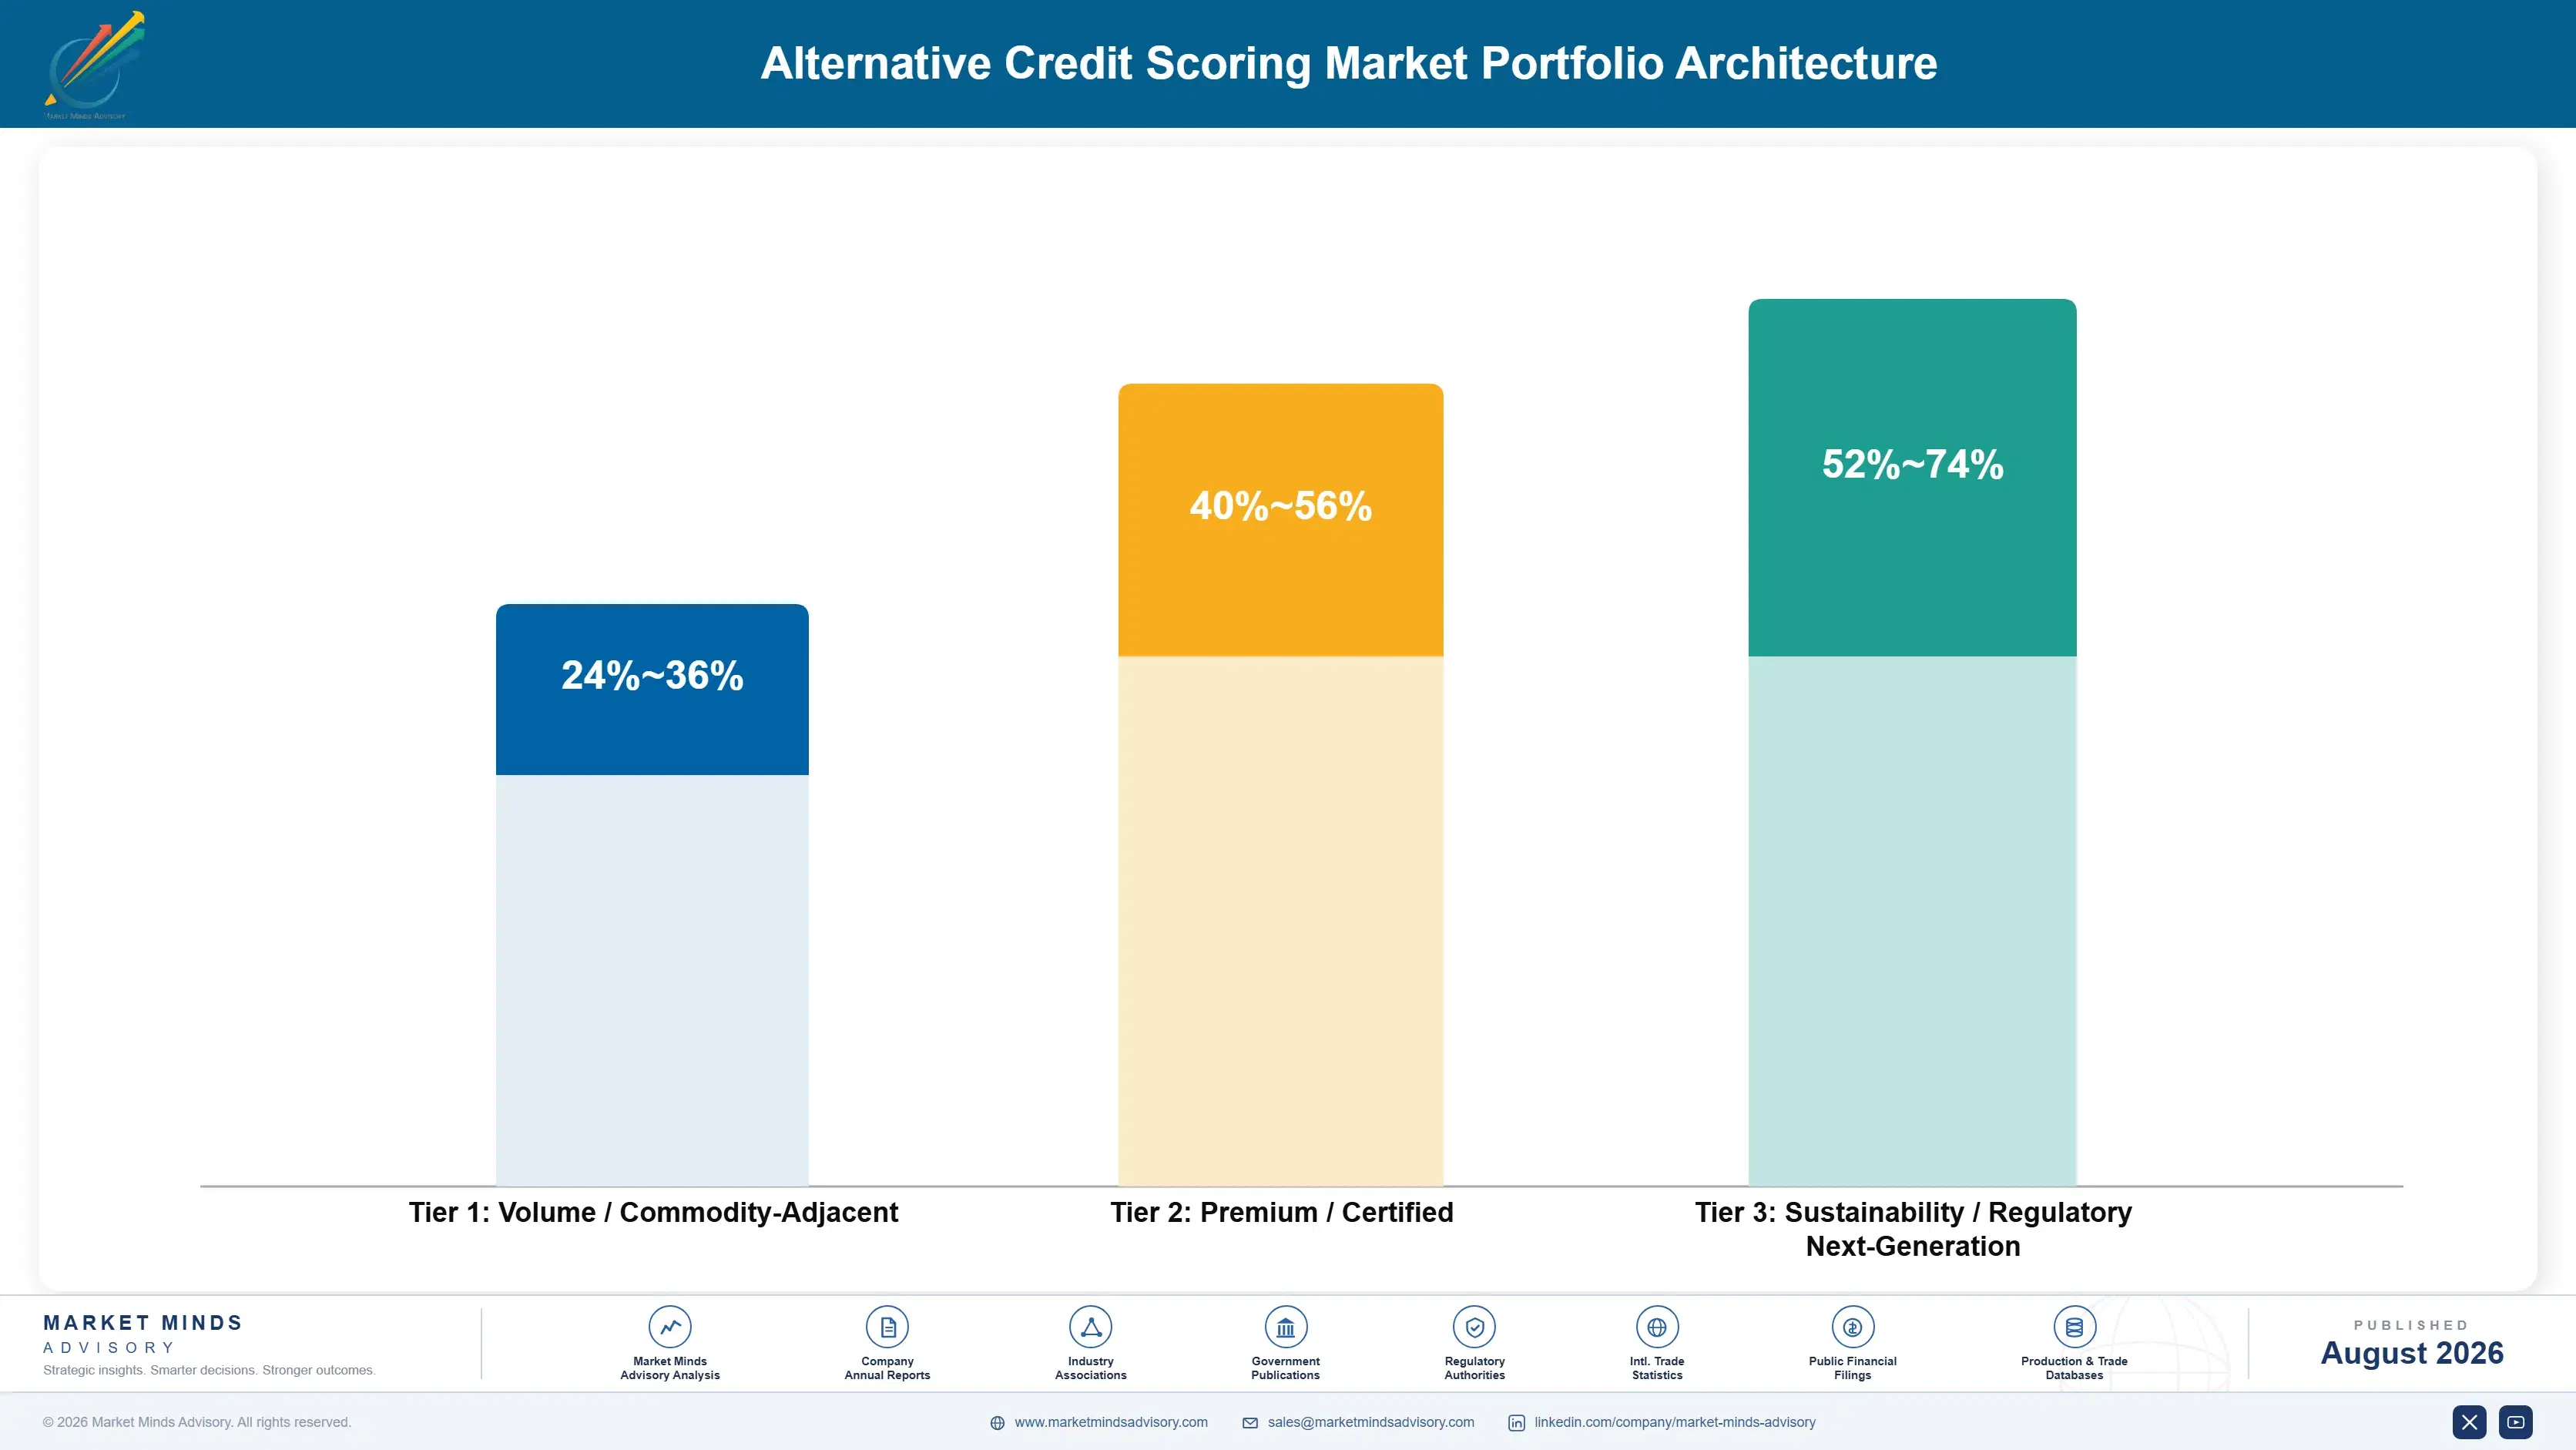
Margin follows regulatory defensibility rather than predictive novelty, which is the opposite of what the category's own marketing implies. Psychometric assessment earns thinly and has largely lost its buyers. Device and digital footprint scoring earns modestly against fair lending scepticism. Telecom and utility scoring earns reasonably where reporting coverage exists. Rental payment scoring earns well on genuine coverage scarcity. Payroll verification earns better on data exclusivity. Cash flow underwriting earns best, on defensibility and measured uplift together.
The tension is that the strongest product carries the fastest rising input cost. Cash flow assessment depends on institutional data access that has moved from free to paid within three years, and per-call pricing scales directly with volume in a way flat contracts never anticipated. Providers growing cash flow volume on legacy pricing are growing revenue and shrinking margin simultaneously, which several have yet to notice properly.

High-value pools sit in three places. Explainability and reason code capability, which gates every regulated deployment regardless of accuracy. Payroll and employment data, where exclusivity is genuine and substitutes are poor. And positions inside consented data rails, which convert access from a recurring commercial risk into a supervised arrangement nobody can withdraw arbitrarily.

Volume / Commodity-Adjacent

Device footprint and psychometric assessment sold into buyers who have largely moved on to better predictors. The 12-point range separates providers with residual emerging market demand from those competing in regulated lending markets that no longer buy.
Gross Margin: 24-36%

Premium / Certified

Telecom, utility and rental payment scoring where coverage depends on reporting participation that nobody controls fully. The 16-point spread reflects how differently patchy rental coverage and established utility reporting perform commercially across markets.
Gross Margin: 40-56%

Sustainability / Regulatory / Next-Generation

Cash flow underwriting and payroll verification carrying defensible explainability alongside measured approval uplift. The 22-point range is wide because rising data access cost affects transaction-based products far more than payroll-based ones.
Gross Margin: 52-74%
alternative-credit-scoring-market-portfolio-architecture-1787913333555

High-value Sub-segments and Strategic Watch-out

Cash Flow Underwriting Capability

Highest margin and fastest growth at 21.6%, protected by explainability that survives fair lending review and by measured uplift lenders can verify themselves. The risk is data access cost rising faster than pricing has been restructured to absorb it. And that gap widens every single quarter.
Gross Margin: 58-74%

Payroll And Employment Data

Strong economics from data exclusivity and poor substitutes, since employment and income verification cannot be inferred reliably from anything else available. The risk is concentration among a small number of payroll processors controlling access terms entirely. Those processors know exactly what it is they hold.
Gross Margin: 48-62%

Utility And Telecom Scoring

The steady core, established in markets where reporting coverage exists and accepted by lenders who understand exactly what it measures. Providers hold it because coverage took years to build, not because growth is remarkable. Coverage is really the asset here, and not the growth rate.
Gross Margin: 38-50%

Unexplainable Model Approaches

The strategic watch-out. Accuracy provides no exemption from stating four principal reasons for a denial. The risk is investing in approaches that a compliance function will reject before predictive performance is ever discussed. The lift chart very often never even gets opened at all there.
Gross Margin: 20-32%

Scored Once, Billed Forever

Annuity economics here are genuinely strong once deployment happens. Every credit application generates an assessment call, application volumes are steady, and a lender that has validated a model through model risk management has no appetite whatsoever to repeat that exercise for a marginal price improvement. Revenue scales with origination volume automatically. The difficulty is entirely in the first sale, since deployment requires validation, compliance review and integration before a single decision runs.
Stickiness varies enormously by where the provider sits in the decision. Data access is comparatively switchable, since one transaction feed resembles another once coverage is adequate. Models are extremely sticky, because revalidating a replacement means repeating documentation, testing and examiner explanation that nobody enjoys. Reason code and explainability capability is stickiest of all, since it is embedded directly in consumer-facing adverse action processes.

The buying centre has widened considerably and slowed accordingly. Credit risk once decided alone on predictive performance. Compliance and fair lending now hold effective veto, and model risk management governs validation independently. Procurement arrived last and asks about data access cost escalation. A vendor selling only to credit risk is addressing one of four functions that all have to agree before anything is deployed.
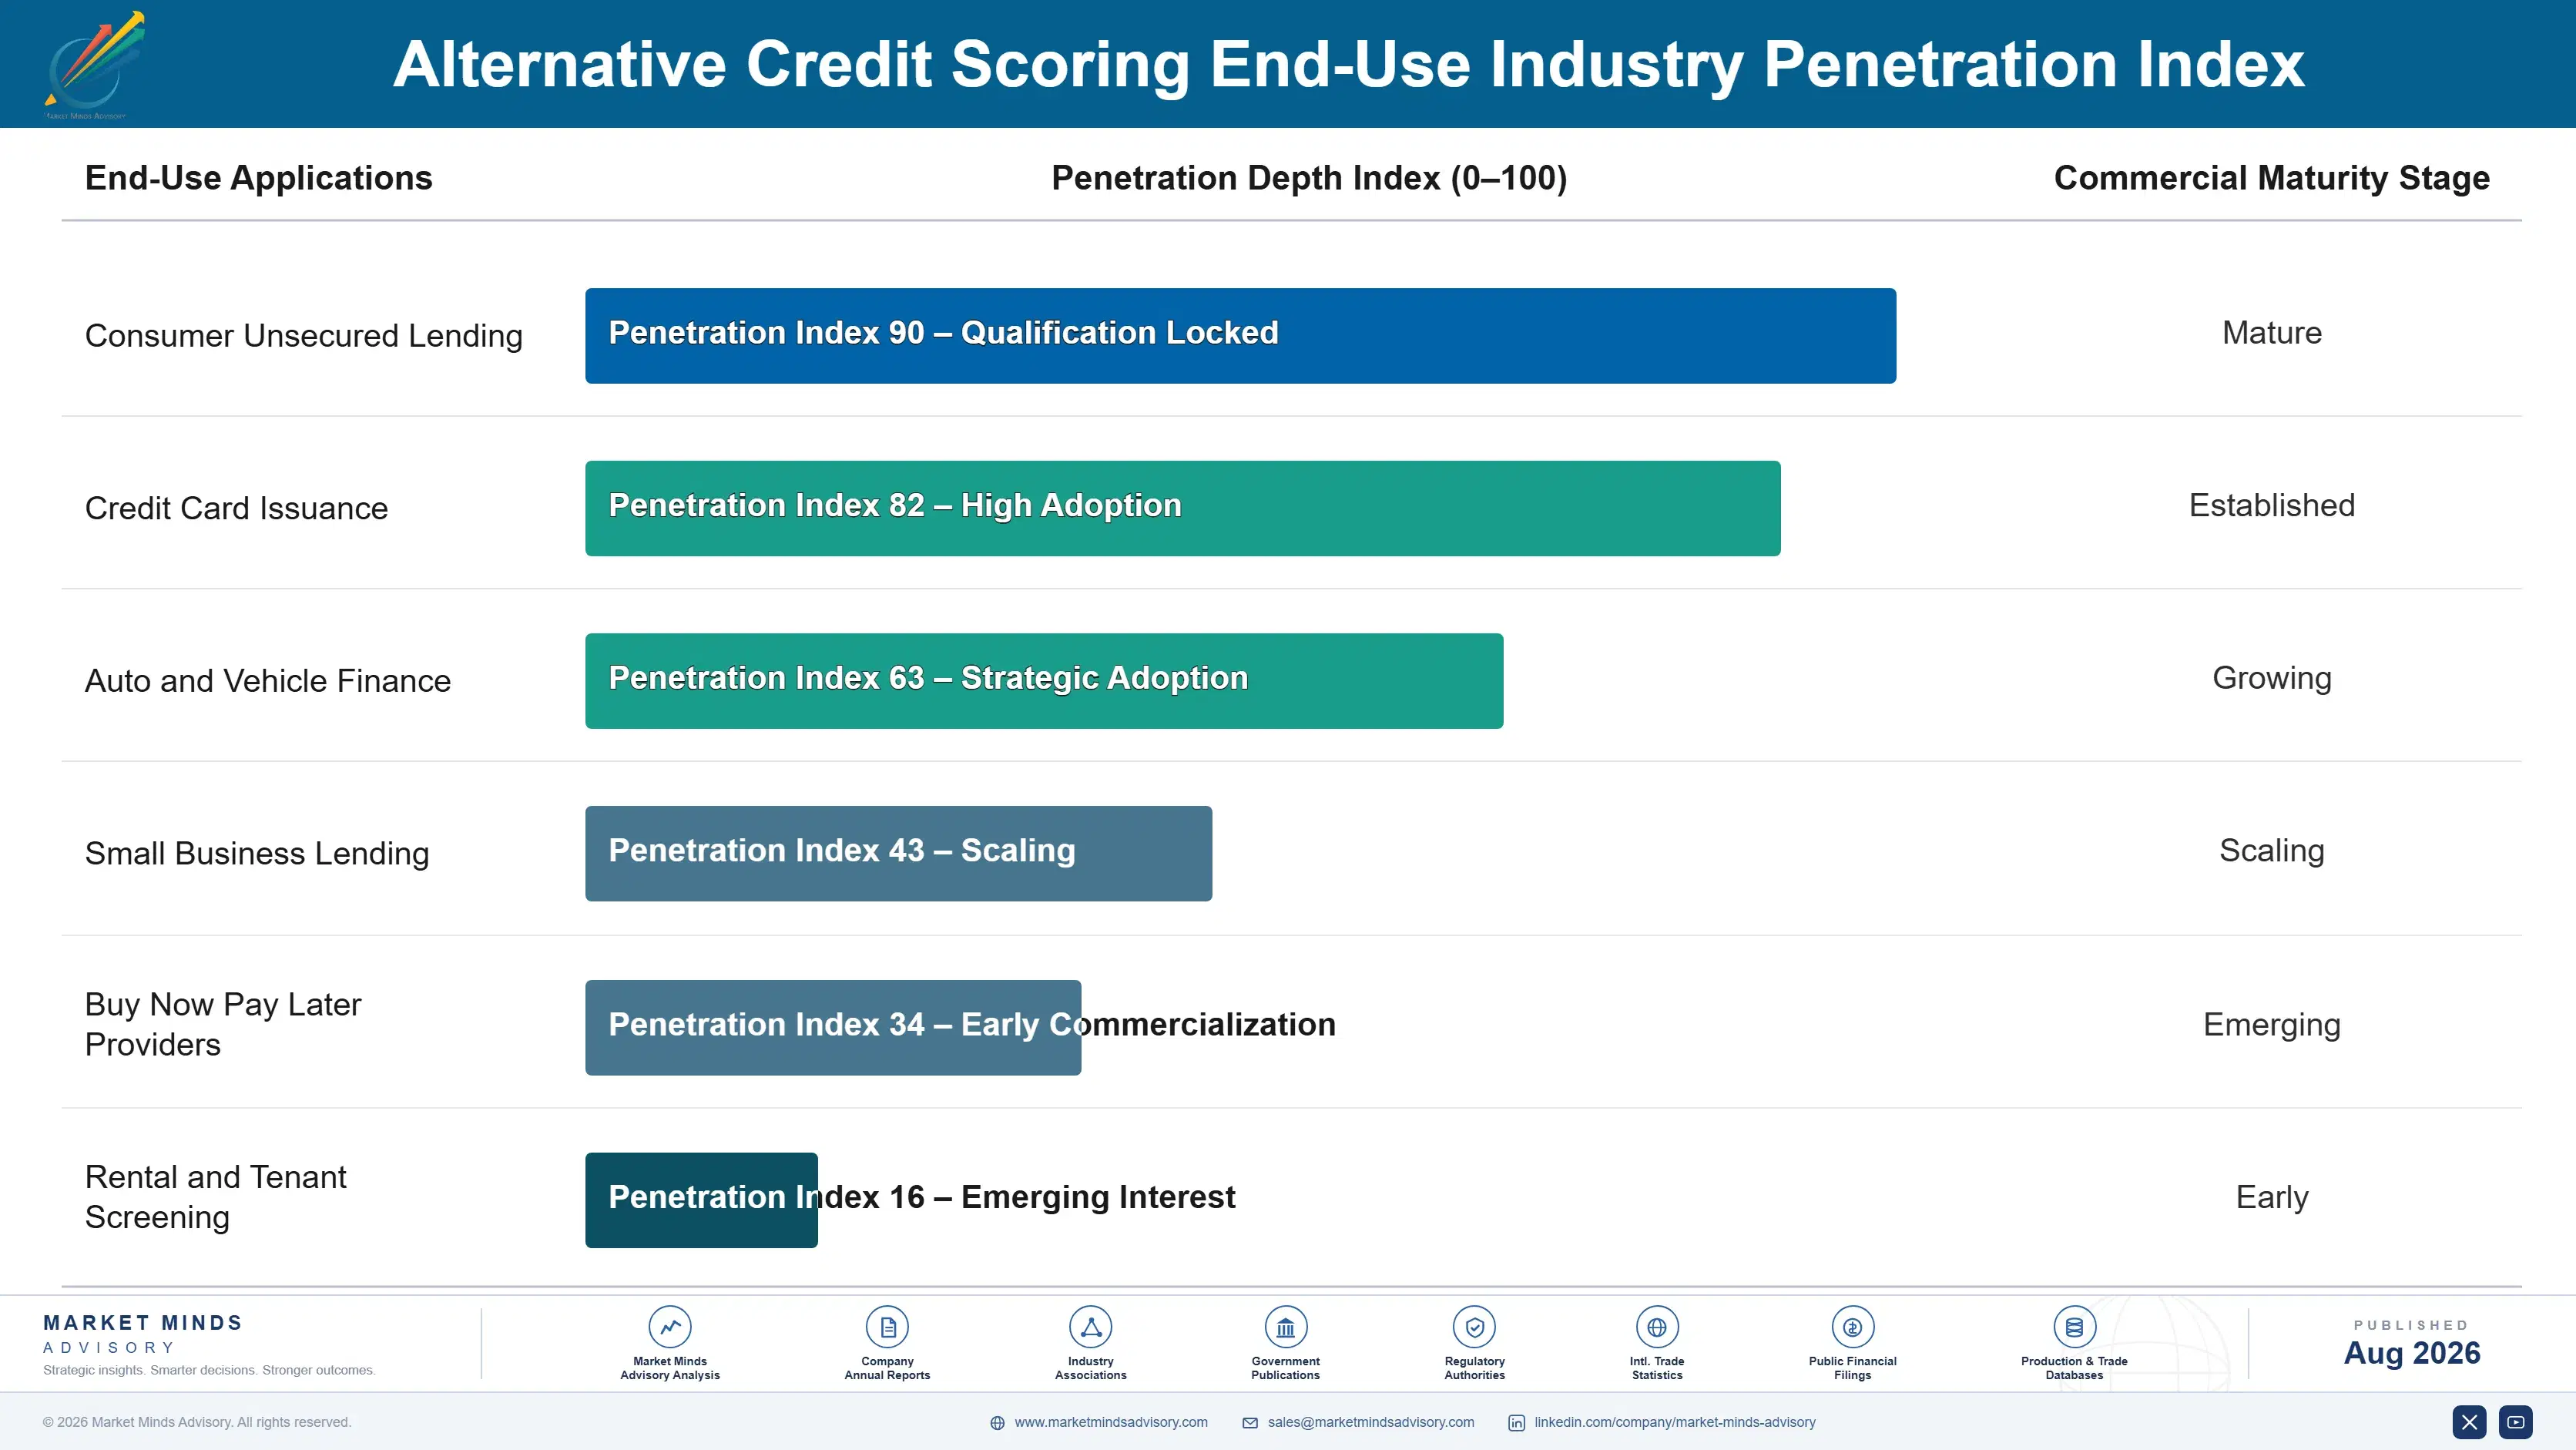
alternative-credit-scoring-market-end-use-penetration-index-1787913334042

Defensible Beats Accurate

These are among the four positions where our research anticipates prominent divergence between winners and laggards over the coming forecast period. Each is grounded in the demand model, the regulatory perimeter, and the announced capacity pipeline.
01 / EXPLAINABILITY FIRST POSITIONING

A score you cannot explain cannot decline anybody

Denying anybody credit requires stating the principal reasons, usually up to four of them, in language a consumer can actually act upon, so a model producing accurate scores that it cannot decompose into defensible reasons simply cannot be used to drive that decision at all. Supervisors have now confirmed that complex algorithms receive no exemption from this whatsoever. Vendors who lead with predictive lift are answering a question that buyers only reach once compliance has already approved or rejected them entirely.
02 / UPLIFT PROOF DISCIPLINE

Prove it on their declines, not your data

Cash flow assessment approves roughly 27% more previously declined applicants without raising expected loss rates at all anywhere. Growth without any added risk is the only proposition in this whole category that genuinely moves a chief risk officer rather than merely interesting them for a while. Vendors describing capability instead of proving that uplift on the lender's own declined population are asking for a degree of trust that credit risk functions simply never extend to any new supplier at all.
03 / ACCESS COST REPRICING

Free data ended and the contracts have not

Institutions have now shifted from merely tolerating screen scraping toward paid interfaces where the per-call charges scale directly with assessment volume, while a great many vendor contracts were priced flat back when that access had cost effectively nothing at all. Providers who grow cash flow volume on legacy pricing are growing revenue and shrinking their margin at exactly the same time. Restructuring at the renewal point is considerably easier than attempting the same thing once the margin has already gone entirely.
04 / CONSENTED RAIL POSITIONING

Build inside the rail, not around it

Account aggregator and personal data rights frameworks together convert access from an engineering problem into a supervised compliance arrangement instead, which strongly favours providers already positioned inside those rails over anybody who is still maintaining scraping infrastructure around them. Indian demand grows fastest of anywhere at all at 16.4% on precisely this foundation. Integration costs real engineering effort and it removes the recurring risk that an institution simply blocks off all access one morning with no notice given at all.

Engagement Snapshot From the Field

A live engagement with an industry participant carrying material or product regulatory and market exposure ahead of a defining policy shift, showing how our research translates into a defensible multi-year portfolio strategy.
MARKET MINDS ADVISORY · CLIENT ENGAGEMENT SUMMARY
Alternative Credit Scoring Producer Strategic Portfolio Review and Transition Roadmap 2026·Investment Scenario on Alternative Credit Scoring Exposure Evaluation 2025-26
CLIENT PROFILE
An alternative credit scoring vendor supplying consumer lenders across North American and European markets, with reported revenue of 54 million dollars (client-reported, unverified by MMA). Roughly 58% came from cash flow assessment sold on flat annual contracts. Data access ran entirely through aggregators and reason code capability had been described in the roadmap for two consecutive years.
STRATEGIC CHALLENGE
Deal cycles were lengthening and several late-stage opportunities had stalled without any stated reason, while gross margin had fallen for six consecutive quarters as aggregator access charges rose. Management proposed increasing sales headcount to shorten cycles. That added cost to a funnel where deals were stalling at compliance review rather than anywhere the sales team could reach.
MMA APPROACH
MMA traced every stalled opportunity to the function that had blocked it, then rebuilt unit economics separating data access cost from assessment revenue by contract. Twenty-six expert interviews with credit risk officers, fair lending counsel, model validation leads and procurement established how these decisions are actually made. The analysis treated explainability capability and access cost pass-through as the routes available.
KEY FINDINGS
  1. Every stalled late-stage deal had halted at compliance or model validation over reason code generation, and the sales team had recorded all of them as pricing objections instead.
  2. Aggregator access charges had risen sharply across two years while flat annual contracts held revenue constant, and four accounts were now being served below direct cost.
  3. Reason code capability existed partially in the product but had never been documented or demonstrated to any buyer at any stage of any sales process.
  4. Credit risk buyers interviewed said predictive lift mattered only after compliance had cleared a vendor, which reversed the entire order of the client's sales narrative.
CLIENT PROFILE
An alternative credit scoring vendor supplying consumer lenders across North American and European markets, with reported revenue of 54 million dollars (client-reported, unverified by MMA). Roughly 58% came from cash flow assessment sold on flat annual contracts. Data access ran entirely through aggregators and reason code capability had been described in the roadmap for two consecutive years.
STRATEGIC CHALLENGE
Deal cycles were lengthening and several late-stage opportunities had stalled without any stated reason, while gross margin had fallen for six consecutive quarters as aggregator access charges rose. Management proposed increasing sales headcount to shorten cycles. That added cost to a funnel where deals were stalling at compliance review rather than anywhere the sales team could reach.
MMA APPROACH
MMA traced every stalled opportunity to the function that had blocked it, then rebuilt unit economics separating data access cost from assessment revenue by contract. Twenty-six expert interviews with credit risk officers, fair lending counsel, model validation leads and procurement established how these decisions are actually made. The analysis treated explainability capability and access cost pass-through as the routes available.
KEY FINDINGS
  1. Every stalled late-stage deal had halted at compliance or model validation over reason code generation, and the sales team had recorded all of them as pricing objections instead.
  2. Aggregator access charges had risen sharply across two years while flat annual contracts held revenue constant, and four accounts were now being served below direct cost.
  3. Reason code capability existed partially in the product but had never been documented or demonstrated to any buyer at any stage of any sales process.
  4. Credit risk buyers interviewed said predictive lift mattered only after compliance had cleared a vendor, which reversed the entire order of the client's sales narrative.
RECOMMENDED STRATEGY
Phase 1: Phase one: document and demonstrate reason code generation in the first meeting, since compliance decides before credit risk ever evaluates lift. Phase 2: Phase two: move renewing contracts onto consumption pricing that passes data access cost through rather than continuing to absorb it entirely. Phase 3: Phase three: negotiate direct access with the four institutions covering most assessment volume rather than routing all of it through aggregators.
OUTCOME
Reason code documentation moved two stalled deals to signature within a quarter (client-reported, unverified by MMA). Consumption pricing was applied at three renewals and lost one account. Direct access negotiations opened with two institutions. The headcount increase was deferred, having proposed selling harder into a gate the sales function could not open at all.

Frequently Asked Questions

Foundational context covering the market sizes, CAGR, scope, country, region and competition that inform every finding below. This section is provided to cover basics and most often pre-purchase conversations, answered from the MMA Primary Research Dataset.

What is the current size of the Alternative Credit Scoring Market?

The market was worth 4.6 billion dollars in provider revenue in 2025, covering cash flow, rental, telecom, payroll, device and psychometric assessment. It reaches 5.26 billion dollars in 2026.

How large will the Alternative Credit Scoring Market be by 2036?

MMA forecasts 20.19 billion dollars by 2036, an increase of 14.93 billion dollars over the 2026 base. That represents an expansion multiple of 3.84 times across the forecast period.

What is the CAGR for the Alternative Credit Scoring Market 2026 to 2036?

The base case compounds at 14.4% annually. The bull case reaches 15.6% if data access rules settle and mainstream adoption follows, while the bear case sits at 13.2% on fair lending tightening.

Which segment is growing fastest?

Cash flow and transaction data underwriting, at 21.6%, half again the market rate of 14.4%. Twenty-four months of bank data improves default prediction by around 18%.

Who are the major companies in the Alternative Credit Scoring Market?

FICO, TransUnion, Equifax, Plaid and LexisNexis Risk Solutions lead on disclosed decisioning and alternative data revenue. Nova Credit, Zest AI and Prism Data hold specialist positions.

Which country is growing fastest?

India at 16.4%, supported by account aggregator infrastructure that is arguably the most usable consented financial data rail that anybody anywhere has actually yet built.

Report Segmentation Architecture

The full report scope spans multiple orthogonal segmentation dimensions, with cross-tabulated demand data provided for each dimension pair. Coverage extends further to regional breakdowns, trend trajectories, and the competitive detail needed to support segment-level decision-making.

By Data Source and Assessment Type

  • Cash Flow and Transaction Data Underwriting
  • Rental and Housing Payment Scoring
  • Telecom and Utility Payment Scoring
  • Payroll and Employment Verification Scoring
  • Device and Digital Footprint Scoring
  • Psychometric and Survey-Based Assessment

By End-Use Industry

  • Consumer Unsecured Lending
  • Credit Card Issuance
  • Auto and Vehicle Finance
  • Small Business Lending
  • Buy Now Pay Later Providers
  • Rental and Tenant Screening

By Commercial Dimension

  • Direct Lender Licensing
  • Bureau Distribution Channels
  • Embedded Platform Integration
  • Consented Data Rail Participation
  • Consumption-Based Assessment Pricing
  • Model Validation and Advisory Services

By Region

  • North America
  • Western Europe
  • East Asia
  • South Asia and Pacific
  • Latin America
  • Middle East and Africa
  • Eastern Europe

Scope, Methodology, and Coverage

Every figure in this report is reproducible from documented input assumptions. The scope below maps the historical period, the forecast horizon, the segmentation dimensions, and the countries covered, alongside the underlying primary and qualitative methodology.
Historical Period
2020 to 2025
Forecast Period
2026 to 2036
Base Year
2025 (USD billions; MMA Primary Research Dataset, August 2026)
Market Definition
Scope covers revenue earned by providers of alternative credit scoring data, models, scores and decisioning services used to assess consumer or small business creditworthiness from sources beyond traditional bureau tradeline history, spanning cash flow and transaction data underwriting from consented bank data, rental and housing payment scoring, telecom and utility payment scoring, payroll and employment verification scoring, device and digital footprint scoring, and psychometric or survey-based assessment. Traditional bureau credit files and scores built on tradeline repayment history, loan origination and servicing software, debt collection analytics, identity verification and fraud detection products, tenant background screening unconnected to payment history, and the lending capital itself are excluded from the market size and all derived figures.
Quantitative Units
USD billions of provider revenue (current prices); assessments performed in millions; predictive lift over bureau file as percentage; approval uplift at constant loss rate; transaction history depth in months
Segmentation Dimensions
By Data Source and Assessment Type; By End-Use Industry; By Commercial Dimension; By Region
Regions Covered
North America, Western Europe, East Asia, South Asia and Pacific, Latin America, Middle East and Africa, Eastern Europe
Countries Covered
USA, China, India, UK, Brazil, Germany, Japan, Mexico, Indonesia, Kenya, Canada, France, Australia, Nigeria, Poland
Key Companies Profiled
FICO, TransUnion, Equifax, Plaid, LexisNexis Risk Solutions, Nova Credit, Zest AI, Provenir, Prism Data, MX Technologies, Finicity, Envestnet Yodlee, Tink, TrueLayer, CRIF, Creditinfo, Trust Science, Aire, Pagaya, Perfios
Quantitative Methodology
Primary survey, n=3,800 respondents, Q4 2025, six countries; demand-side model with trade association cross-validation
Qualitative Methodology
47 expert interviews, Q4 2025; applied to validate demand model assumptions, identify emerging dynamics, and assess competitive positioning
Report Format
PDF and XLSX data workbook (Word format preview document)
Publisher
Market Minds Advisory
Report Code
MMA-2026-TEC-181
Published
August 2026
Contact
sales@marketmindsadvisory.com | www.marketmindsadvisory.com

Purchase the full Alternative Credit Scoring Market Report (2026 to 2036).

The full report runs to 175 pages and covers all six data source segments, seven regions and 20 profiled providers in detail. It includes the complete segment CAGR set, regional analysis of bureau coverage against alternative assessment adoption, and comparison of predictive lift against regulatory defensibility across every data type. Company profiles carry evaluation on disclosed credit decisioning and alternative data services revenue, with moat and risk assessment for the top five providers. The competitive section extends to 13 tracked regulatory, commercial and access developments across 2024 and 2025. Primary research inputs include a quantitative survey of 3,800 respondents and 47 expert interviews conducted in Q4 2025.
Six data source segments with individual CAGR forecasts
Seven regions compared on bureau coverage and adoption depth
Twenty provider profiles on consistent decisioning revenue basis
Thirteen tracked regulatory and access developments with commercial interpretation
Predictive lift compared against regulatory defensibility by source
Data access cost escalation modelled against contract pricing structures

Built For The People Who Decide

From boardroom strategy to bench-side execution, this report is read cover-to-cover by leaders shaping the next decade of their industry, turning demand scenarios, market dynamics and valuation benchmarks into decisions.
CXOs/ Presidents/ VPs/ Managers
M&A and Corporate Development
Strategy Teams and R&D Heads
Procurement and Product Directors
Regulatory and Compliance Leaders
Investor Relations and Equity Analysts