Market Minds Advisory
Alternative Accommodation Market

Alternative Accommodation Market: Alternative Accommodation Market: Regulatory Caps, The Professional Host Takeover and What Cleaning Fees Really Signal

Cities that once welcomed short-term rentals are now capping nights and requiring registration, and the hosts who survive those rules are professional operators rather than people letting a spare room.

Lead Analyst

Published

September 2026

Make Smarter Decisions with Customized Research Insights

Request a free sample report and evaluate market opportunities, growth trends, and competitive dynamics relevant to your business needs.

2025 MARKET VALUE$148.0BMarket Size 2025
2036 FORECAST VALUE$359.3BBase Case , 2026 to 2036
CAGR 2026 TO 20368.4 %Bull 9.7% / Bear 7.1%
INCREMENTAL OPPORTUNITY$198.9BNet 10- year value creation
EXPANSION MULTIPLE2.24x2036 value over 2026 base
Strategic Levers
M&A Pipeline
Regional Outlook
Country Rankings
Competitive Intelligence
Segmental Deep-dive
Call-Us : 91 93563 13602

Executive Snapshot and Market Trajectory.

The spare room is largely gone from this market. Professional operators running multiple listings now supply the majority of nights booked in most major cities, and the sharing premise the category was built on has quietly become a property management business. Cities worked that out long ago and legislated accordingly.
Serviced apartments and aparthotels grow at 12.6%, half again the market rate of 8.4%, because they satisfy registration and licensing rules that whole-home short lets increasingly cannot. Vacation rental homes follow at 9.8%. Shared and private room listings grow slowest at 3.1%, squeezed out by the same city regulations that professional supply was built to survive. The casual host is being regulated out rather than competed out.
Regulation is now the principal variable in this market and it moves city by city rather than nationally. Registration requirements, night caps and primary-residence rules have reshaped supply in Amsterdam, Barcelona, New York and Paris. Concentration is moderate at 44% held by the top five platforms, and that figure understates how much booking demand two of them actually command. Travellers searching this kind of stay start at one brand and mostly finish there.
Market Definition
This market covers paid accommodation booked outside traditional hotel inventory, spanning whole-home vacation rentals, urban short-term apartment lets, serviced apartments and aparthotels, shared and private room listings, cabins, glamping and unique stays, and extended-stay corporate housing. Sizing is at gross booking value. Hotel rooms distributed through online travel agencies, timeshare and fractional ownership, campsites without managed accommodation, and long-term residential leasing are excluded.
Base Year Value
$148.0B in 2025 (MMA Primary Research Dataset, September 2026)
Forecast Period
2026 to 2036, eleven discrete annual values
CAGR
8.4% base case. Bull 9.7%. Bear 7.1%.
Fastest Growth Segment
Serviced Apartments And Aparthotels: 12.6% CAGR
Fastest Growth Country
Vietnam: 14.1% CAGR
Fastest Growth Region
South Asia and Pacific: 10.6% CAGR
Largest Region
North America: 33% of 2025 global value
Market Leaders
Airbnb, Booking Holdings, Expedia Group, Sonder Holdings, Tujia. Source: MMA Primary Research Dataset, July 2026.
Primary Survey
n=3,800 procurement and R&D decision-makers, Q4 2025, six countries
Methodology
Demand-side build-up, cross-validated against public data, 47 expert interviews

Alternative Accommodation Market Forecast Scenarios

alternative-accommodation-market-size-forecast-scenario-1790023870894
Growth of 7.2% between 2020 and 2025 conceals the sharpest collapse and recovery any travel category has recorded. Bookings fell close to nothing through 2020, then returned faster than hotels because travellers wanted private space and kitchens rather than lobbies and lifts. Longer stays became normal as remote work removed the requirement to be anywhere on a Monday, and that change proved durable rather than temporary.
Three mechanisms carry the base case. Serviced apartments grow at 12.6% because purpose-built and licensed inventory satisfies city registration rules that whole-home lets increasingly fail. Southeast Asian supply expands rapidly, with Vietnam growing at 14.1% on domestic travel and inbound recovery together. Extended stays above seven nights now account for roughly 38% of nights booked, which changes both the operating model and the cleaning economics substantially. All three are visible in booking data already.
The bull case is regulatory clarity. Cities that replaced outright bans with workable registration regimes saw compliant supply grow rather than disappear, and that template is spreading. The bear case is enforcement without a compliant pathway. A large city removing non-primary-residence listings would take out supply professional operators built at scale, and the capital behind it has nowhere to go.

Who Actually Owns The Listings

The premise this category was founded on has largely stopped being true. Around 68% of nights are now booked through hosts managing more than one property, and in the most regulated cities that figure is considerably higher, because compliance costs more than a casual host will absorb. What was framed as people sharing homes is a property management industry operating at scale, and the regulatory response has been shaped by that reality rather than by the original story.
TOP FIVE CONCENTRATION44%Combined gross booking value share held by the largest platforms
PROFESSIONAL HOST SHARE68%Nights booked through hosts managing more than one property
AVERAGE NIGHTLY RATEUSD 174Weighted global rate across all accommodation types covered
EXTENDED STAY SHARE38%Portion of nights booked for longer than a week
CLEANING FEE PROPORTION19%Share of total guest payment charged as cleaning
REGISTERED SUPPLY SHARE57%Listings in regulated cities holding a valid registration
Cleaning fees are the clearest signal of what the category has become. They average roughly 19% of the total guest payment and exist because nightly rates are what a guest compares while fees are revealed at checkout. Guests responded by staying longer to amortise them, and extended stays above seven nights now represent about 38% of nights. A pricing tactic reshaped the demand pattern.
Regulation now varies so sharply between neighbouring cities that national analysis is close to useless. Registration schemes, night caps and primary-residence requirements apply in some municipalities and not at all in the next one. Around 57% of listings in regulated cities hold valid registration.
"This industry spent a decade insisting it was about sharing and is now run by operators with revenue management systems and cleaning contracts. Cities worked that out before the platforms admitted it, which is why the rules arrived the way they did."
Director, Travel and Hospitality Practice · MMA Travel and Hospitality Services Practice · September 2026

Market Trends

Professional Operators Displace The Casual Host Entirely

Around 68% of nights now come from hosts managing more than one property, and the share climbs further in cities with registration requirements because compliance carries a fixed cost a casual host will not absorb. Professional operators run revenue management, contracted cleaning and dedicated guest communication, which produces measurably better reviews and higher occupancy. The trade-off is that the category lost the supply elasticity it once had: professional inventory does not appear and disappear with demand the way spare rooms did, and cities noticed. The category no longer flexes with demand the way it once did.
Market Impact: Serviced apartments grow 4.2 points faster

Extended Stays Reshape Operating And Cleaning Economics

Stays longer than seven nights now account for roughly 38% of nights booked, up substantially since remote work removed the need to be physically present on a weekday. Longer stays cut turnover cost per night dramatically, since cleaning is the largest variable expense and it is incurred once regardless of length. They also change what guests require: kitchen quality, workspace and laundry matter far more than they did, and properties equipped for short breaks convert poorly against purpose-fitted ones. Most inventory was furnished before any of this happened, and the refit is cheap. Very few operators have made it yet.
Market Impact: Vietnam grows at 14.1% yearly

Market Opportunities and Growth Drivers

Serviced Apartment Formats Satisfy City Registration Rules

Serviced apartments and aparthotels grow at 12.6% against 8.4% for the market because purpose-built licensed inventory meets the requirements that whole-home lets increasingly fail. A building consented for short-stay use, with a front desk and fire compliance, sits outside the primary-residence and night-cap regimes that constrain apartment lets in Amsterdam, Barcelona and New York. Developers and institutional capital have noticed, and the format attracts investment on terms that scattered apartment portfolios cannot obtain from lenders. Purpose-built stock is being consented specifically for this use in several European cities. That is a different asset class from a converted apartment portfolio.
Market Impact: Only 57% of listings registered

Southeast Asian Supply Expands On Domestic Travel

Vietnam grows fastest of any country covered at 14.1%, and the demand is domestic as much as inbound, which is a change from the decade when the category there served foreign visitors almost exclusively. Rising domestic incomes, low-cost regional air capacity and comparatively light regulation have combined to expand supply quickly. Thailand, Indonesia and the Philippines follow similar patterns. Purpose-built condominium inventory in those markets is frequently designed for short-let use from the outset. Regulation there is lighter than in European cities and shows no sign of tightening quickly, which gives operators a planning horizon they lack elsewhere.
Market Impact: Fees reach 19% of payment

Market Restraints and Challenges

City Regulation Removes Supply Faster Than It Replaces It

Registration requirements, annual night caps and primary-residence rules have cut listing counts substantially in Amsterdam, Barcelona, New York and Paris, and roughly 57% of listings in regulated cities hold valid registration. The root cause is housing: cities concluded that whole-home short lets removed long-term rental stock from constrained markets. Commercially this strands capital in apartment portfolios acquired for a use that is no longer permitted. Operators responding well have shifted toward licensed serviced apartment formats instead. Capital trapped in a leased portfolio has nowhere to go once permitted use disappears.
Market Impact: Professional hosts supply 68% of nights

Cleaning Fees Damage Conversion At The Final Step

Cleaning charges average around 19% of the guest's total payment and appear after the nightly rate has done the comparison work, which produces abandonment at checkout that platforms measure and dislike. The root cause is competitive: a host showing an all-in nightly rate ranks below one that does not, so the incentive runs the wrong way for everybody. Platforms have responded by displaying total prices by default in several markets, which shifts the pressure back onto hosts to justify the fee. Hosts who moved first on all-in pricing found conversion improved more than ranking fell.
Market Impact: Extended stays reach 38% of nights
3 additional market trends, 4 additional growth drivers, and 3 additional restraints and challenges are covered in the full report. Contact sales@marketmindsadvisory.com to access the complete intelligence.

Segment CAGR and Growth Architecture

Segmentation follows accommodation type, the dimension on which regulatory treatment, operating model, stay length and rate all divide together. Six types are assessed at gross booking value. Hotel rooms distributed through online travel agencies, timeshare and fractional ownership, unmanaged campsites, and long-term residential leasing sit outside the defined scope here. Regulatory treatment differs more across the six than anything else.
alternative-accommodation-market-market-share-analysis-1790023871460

Serviced Apartments And Aparthotels

Serviced apartments and aparthotels grow at 12.6%, half again the market rate of 8.4%, and regulation is the reason rather than guest preference. A building consented for short-stay use, with fire compliance and a front desk, sits outside the primary-residence rules and night caps that constrain apartment lets across Amsterdam, Barcelona, New York and Paris. That makes the format financeable in a way scattered apartment portfolios are not, because a lender can underwrite a permitted use rather than a regulatory risk. Institutional capital has moved accordingly, and the format also serves the extended-stay demand that now represents around 38% of nights. Hotel groups have entered the format with balance sheets independents cannot match.
CAGR 12.6%

Vacation Rental Homes

Whole-home vacation rentals in leisure destinations grow at 9.8% and face far lighter regulation than urban apartment lets, because the housing argument that drove city rules does not apply in the same way to coastal and mountain markets. Demand is group-driven and seasonal, with rates that peak sharply and occupancy that does not, which makes revenue management the difference between a good return and a poor one. Professional management has consolidated this segment faster than any other, since scattered owners cannot match the pricing systems, cleaning logistics and guest response times that multi-property operators run as standard. Owners who resist management arrangements find their calendars filling later and at worse rates than professionally run comparables on the same street.
CAGR 9.8%
Full segment breakdown across 6 segments available in the complete report.

Regional Architecture and Country Demand Map

Shares record where the accommodation is located rather than where the guest originates. North America sits above its standard band on vacation rental depth, and Eastern Europe below on supply that remains largely informal and unmeasured. Both deviations carry a stated reason in the paragraph concerned.

North America

At 33% this sits above the standard band, carried by a vacation rental sector with genuine depth that has no equivalent elsewhere. Coastal Florida, the Carolinas, Gulf Coast beaches and the mountain west support whole-home inventory built for group leisure travel over decades, much of it predating the platforms entirely. Urban supply tells the opposite story, with New York effectively removing non-primary-residence short lets and other cities following. Growth of 7.4% reflects mature leisure markets and a contracting urban segment moving in opposite directions simultaneously. Canadian cities including Vancouver and Toronto have adopted primary-residence rules of their own. Extended-stay demand from remote workers is strongest in the mountain west and in smaller cities with lower living costs.
Share: 33% | CAGR: 7.4% (2026 to 2036)

Western Europe

The 25% position sits inside the standard band and this is where regulation has been most aggressive and most varied. Amsterdam caps nights, Barcelona has moved to eliminate tourist apartment licences entirely, and Paris enforces registration with real penalties, while other cities in the same countries impose nothing at all. That variation makes national strategy nearly impossible and pushes operators toward licensed aparthotel formats. Growth of 6.9% is the slowest of the seven regions, reflecting supply constraint rather than any weakness in travel demand. Institutional capital has responded by moving into consented aparthotel stock rather than leaving the region, which is why licensed formats grow here faster than the regional average despite the constraint.
Share: 25% | CAGR: 6.9% (2026 to 2036)
Regional intelligence for 5 additional markets available in the complete report: East Asia, South Asia and Pacific, Latin America, Middle East and Africa, Eastern Europe. Contact sales@marketmindsadvisory.com.
alternative-accommodation-market-country-cagr-analysis-1790023871988

Four Moves Worth Making Now

These four address a market where regulation decides what inventory is even permitted, professional operators supply most nights, and the fee structure that boosted rate comparison now damages conversion. Each has been executed by at least one operator or platform with measured results rather than asserted ones. Two of the four cost nothing beyond a decision and a settings change.

Shift Urban Inventory Toward Licensed Aparthotel Formats

Registration rules, night caps and primary-residence requirements have cut urban apartment supply substantially, and roughly 57% of listings in regulated cities hold valid registration. Purpose-consented aparthotel inventory sits outside those regimes entirely and finances on different terms, since a lender underwrites permitted use rather than regulatory risk. Operators who converted urban portfolios toward licensed formats report occupancy roughly 1.4 times their unlicensed apartment inventory, and they hold the asset through rule changes that strand everybody else. Hotel groups entering the same format is confirmation rather than a warning. The capital is moving for the same reason.
Market Impact: Occupancy reaches roughly 1.4 times unlicensed inventory levels

Price All-In And Abandon The Cleaning Fee

Cleaning charges average around 19% of total guest payment and arrive after the nightly rate has done the comparison, producing abandonment that platforms measure directly. Folding the cost into the nightly rate loses ranking position on rate-sorted search and gains it back on conversion. Operators who moved to all-in pricing report booking conversion rising roughly 27% with total revenue per night effectively unchanged, which makes this a presentation decision rather than a pricing one. Platforms are moving toward default total pricing anyway, which removes the ranking penalty entirely. Moving first captures the conversion gain before that happens.
Market Impact: Booking conversion rises roughly 27% overall at checkout

Equip Properties For Stays Beyond One Week

Extended stays above seven nights now represent about 38% of nights and cut cleaning cost per night sharply, since turnover is incurred once regardless of duration. Properties fitted for weekend breaks convert poorly against those with proper kitchens, dedicated workspace and in-unit laundry. Operators who refitted for longer stays report revenue per available night rising roughly 22% on lower operating cost, because occupancy improves and turnover frequency falls at the same time. Guests booking weeks evaluate kitchens, desks and laundry rather than photographs of a view. The refit costs little and most inventory has never had it.
Market Impact: Revenue per available night rises roughly 22% overall

Build Registration Compliance As An Operating Function

City rules now differ between neighbouring municipalities and change on a timescale shorter than a lease, which makes compliance an ongoing function rather than a one-time filing. Operators treating it as an administrative afterthought lose listings to delisting enforcement without warning. Those who built dedicated regulatory monitoring report compliant listing rates above 94% against a market average near 57%, and they acquire distressed portfolios from operators who did not. Rules now change faster than a lease term runs, so monitoring has to be continuous rather than annual. The capability also becomes an acquisition advantage when competitors are forced to sell.
Market Impact: Compliant listings exceed 94% against a 57% average

Who Controls the Margin Pool

Concentration is moderate at 44% held by the top five, measured consistently on gross booking value rather than on listing count, which would overstate platforms carrying large volumes of inactive inventory. The leader to challenger gap is wide in demand aggregation and narrow in supply, because a property can list on several platforms at once while guest demand concentrates heavily on the two largest brands.
Competition runs on three dimensions currently. Demand aggregation decides platform position, since hosts list where guests already search and that advantage compounds. Operating capability decides the professional host segment, where revenue management, cleaning logistics and guest response separate multi-property operators from scattered owners. Regulatory permanence decides which inventory is financeable at all, and lenders increasingly underwrite permitted use rather than trailing revenue.

Pressure is building from two directions and rankings will shift on both. Hotel groups have entered with licensed apartment formats that carry no regulatory question, competing directly for extended-stay demand with balance sheets the independent operators cannot match. Meanwhile city enforcement is consolidating supply toward operators with compliance capability, which favours scale over the local knowledge that once defined good hosting.
alternative-accommodation-market-company-positioning-matrix-1790023872517

Competitive Moat and Risk Dimensions

AIRBNB

Moat: Demand Aggregation And Brand

Guest search behaviour concentrates on the brand to a degree that makes listing elsewhere optional rather than necessary for most hosts, and that position compounds because supply follows demand and demand follows supply. Replicating it would require both sides of a market that already resolved.
AIRBNB

Risk: Urban Regulatory Supply Exposure

Inventory weighted toward urban whole-home lets carries direct exposure to registration regimes, night caps and primary-residence rules that vary by municipality and change frequently. Each city that restricts supply removes listings the platform cannot replace locally, and the affected cities are the highest-rate markets. Substitution takes years to arrive.
BOOKING HOLDINGS

Moat: Combined Hotel Alternative Inventory

Holding hotel and alternative accommodation inventory in one booking flow lets the group capture a traveller regardless of which they choose, and it gives commercial weight with property owners who want access to the same demand pool for both kinds of asset. That dual position is difficult to build from either side alone.
BOOKING HOLDINGS

Risk: Alternative Category Brand Position

Travellers searching specifically for alternative accommodation still default to the category-defining brand, which means the group competes for consideration rather than starting with it. Converting hotel-first guest habits into alternative bookings requires spending that the incumbent does not have to match. The gap narrows slowly and expensively.

Players Tracked

Prominent Players

Airbnb
Booking Holdings
Expedia Group
Sonder Holdings
Tujia

Other Key Players

Vacasa
Sykes Holiday Cottages
Awaze
Interhome
Oyo Vacation Homes
Plum Guide
Numa Group
Limehome
Cycas Hospitality
The Ascott
Frasers Hospitality
Blueground
Landing
Tripadvisor Rentals
Agoda Homes

Recent Developments

MAY 2025

Numa Group expands licensed aparthotel portfolio across Europe

The operator added consented aparthotel properties in several European cities, extending inventory that sits outside short-let registration regimes. This was organic expansion through new leases and management agreements rather than an acquisition, merger or joint venture with any party. Existing properties continued trading unchanged throughout the expansion.
Signal: Licensed formats are where European urban capital is going. Consented use is what lenders now buy.
NOVEMBER 2024

Airbnb displays total pricing by default in additional markets

The platform extended default total-price display, showing cleaning and service charges within the headline figure across further national markets. This was a product and policy change implemented internally with no partnership, acquisition or regulatory settlement behind the decision. Host-set fee structures remain available beneath the displayed total.
Signal: Fee-heavy pricing is being removed by the platform rather than by hosts. The ranking penalty is disappearing.
FEBRUARY 2025

The Ascott acquires extended-stay operator in Southeast Asia

The serviced residence group completed the acquisition of a regional extended-stay operator, adding managed inventory across several Southeast Asian markets. This was a completed acquisition rather than a merger or joint venture, with operations integrated under existing brands. Existing management contracts continued under the original terms.
Signal: Hotel-adjacent groups are buying into the fastest-growing regional supply. They are buying growth rather than building it.

What A Night Actually Costs

Property cost dominates and everything else is small beside it. Rent or mortgage service on leased and owned inventory runs roughly 46% of operating cost for professional operators. Cleaning and turnover take about 17%, which is why stay length matters so much to the model. Platform commission absorbs a further 14%, utilities around 8%, and compliance, insurance and maintenance take the remainder between them.
European energy costs rose steeply through 2022 and utilities moved from a minor line to a visible one for operators holding whole properties rather than rooms, a movement the IEA records across its European electricity and gas reporting for that period. Operators on fixed nightly rates agreed months in advance could not pass it through at all. Several European aparthotel operators reported margin compression in their 2022 disclosures.

Exposure divides by whether inventory is leased, owned or managed, which matters more than scale. Operators holding long leases carry fixed property cost against variable occupancy, which is the most exposed position when demand softens. Management-agreement operators carry almost none of it and earn less in good conditions. Owners sit between the two. Regulatory risk falls hardest on leaseholders, who cannot exit when a city restricts permitted use.
alternative-accommodation-market-cost-volatility-analysis-1790023872714

Shift from fixed leases toward management agreements

A long lease converts occupancy risk into a fixed obligation that continues whether guests arrive or not, and it also traps the operator when a city changes permitted use. Management agreements move both risks to the owner in exchange for lower upside. The trade is real: less money in good conditions, considerably more survivability in poor ones.

Lengthen average stay to reduce turnover cost per night

Cleaning and turnover run around 17% of operating cost and are incurred once per booking regardless of duration, which means a seven-night stay costs a fraction per night of two separate three-night ones. Minimum stay settings and length-of-stay discounts move the mix directly. The constraint is that longer stays suit some locations far better than others.

Contract energy supply across owned and leased inventory

Utilities sit near 8% of operating cost and rose sharply in Europe through 2022, and an operator quoting nightly rates months ahead cannot pass a movement through mid-season. Contracting supply across a portfolio stabilises the line and preserves published pricing. Smaller operators rarely have the volume to obtain terms worth having. Aggregating across operators is possible but rare.

Portfolio Architecture for Margin Defence

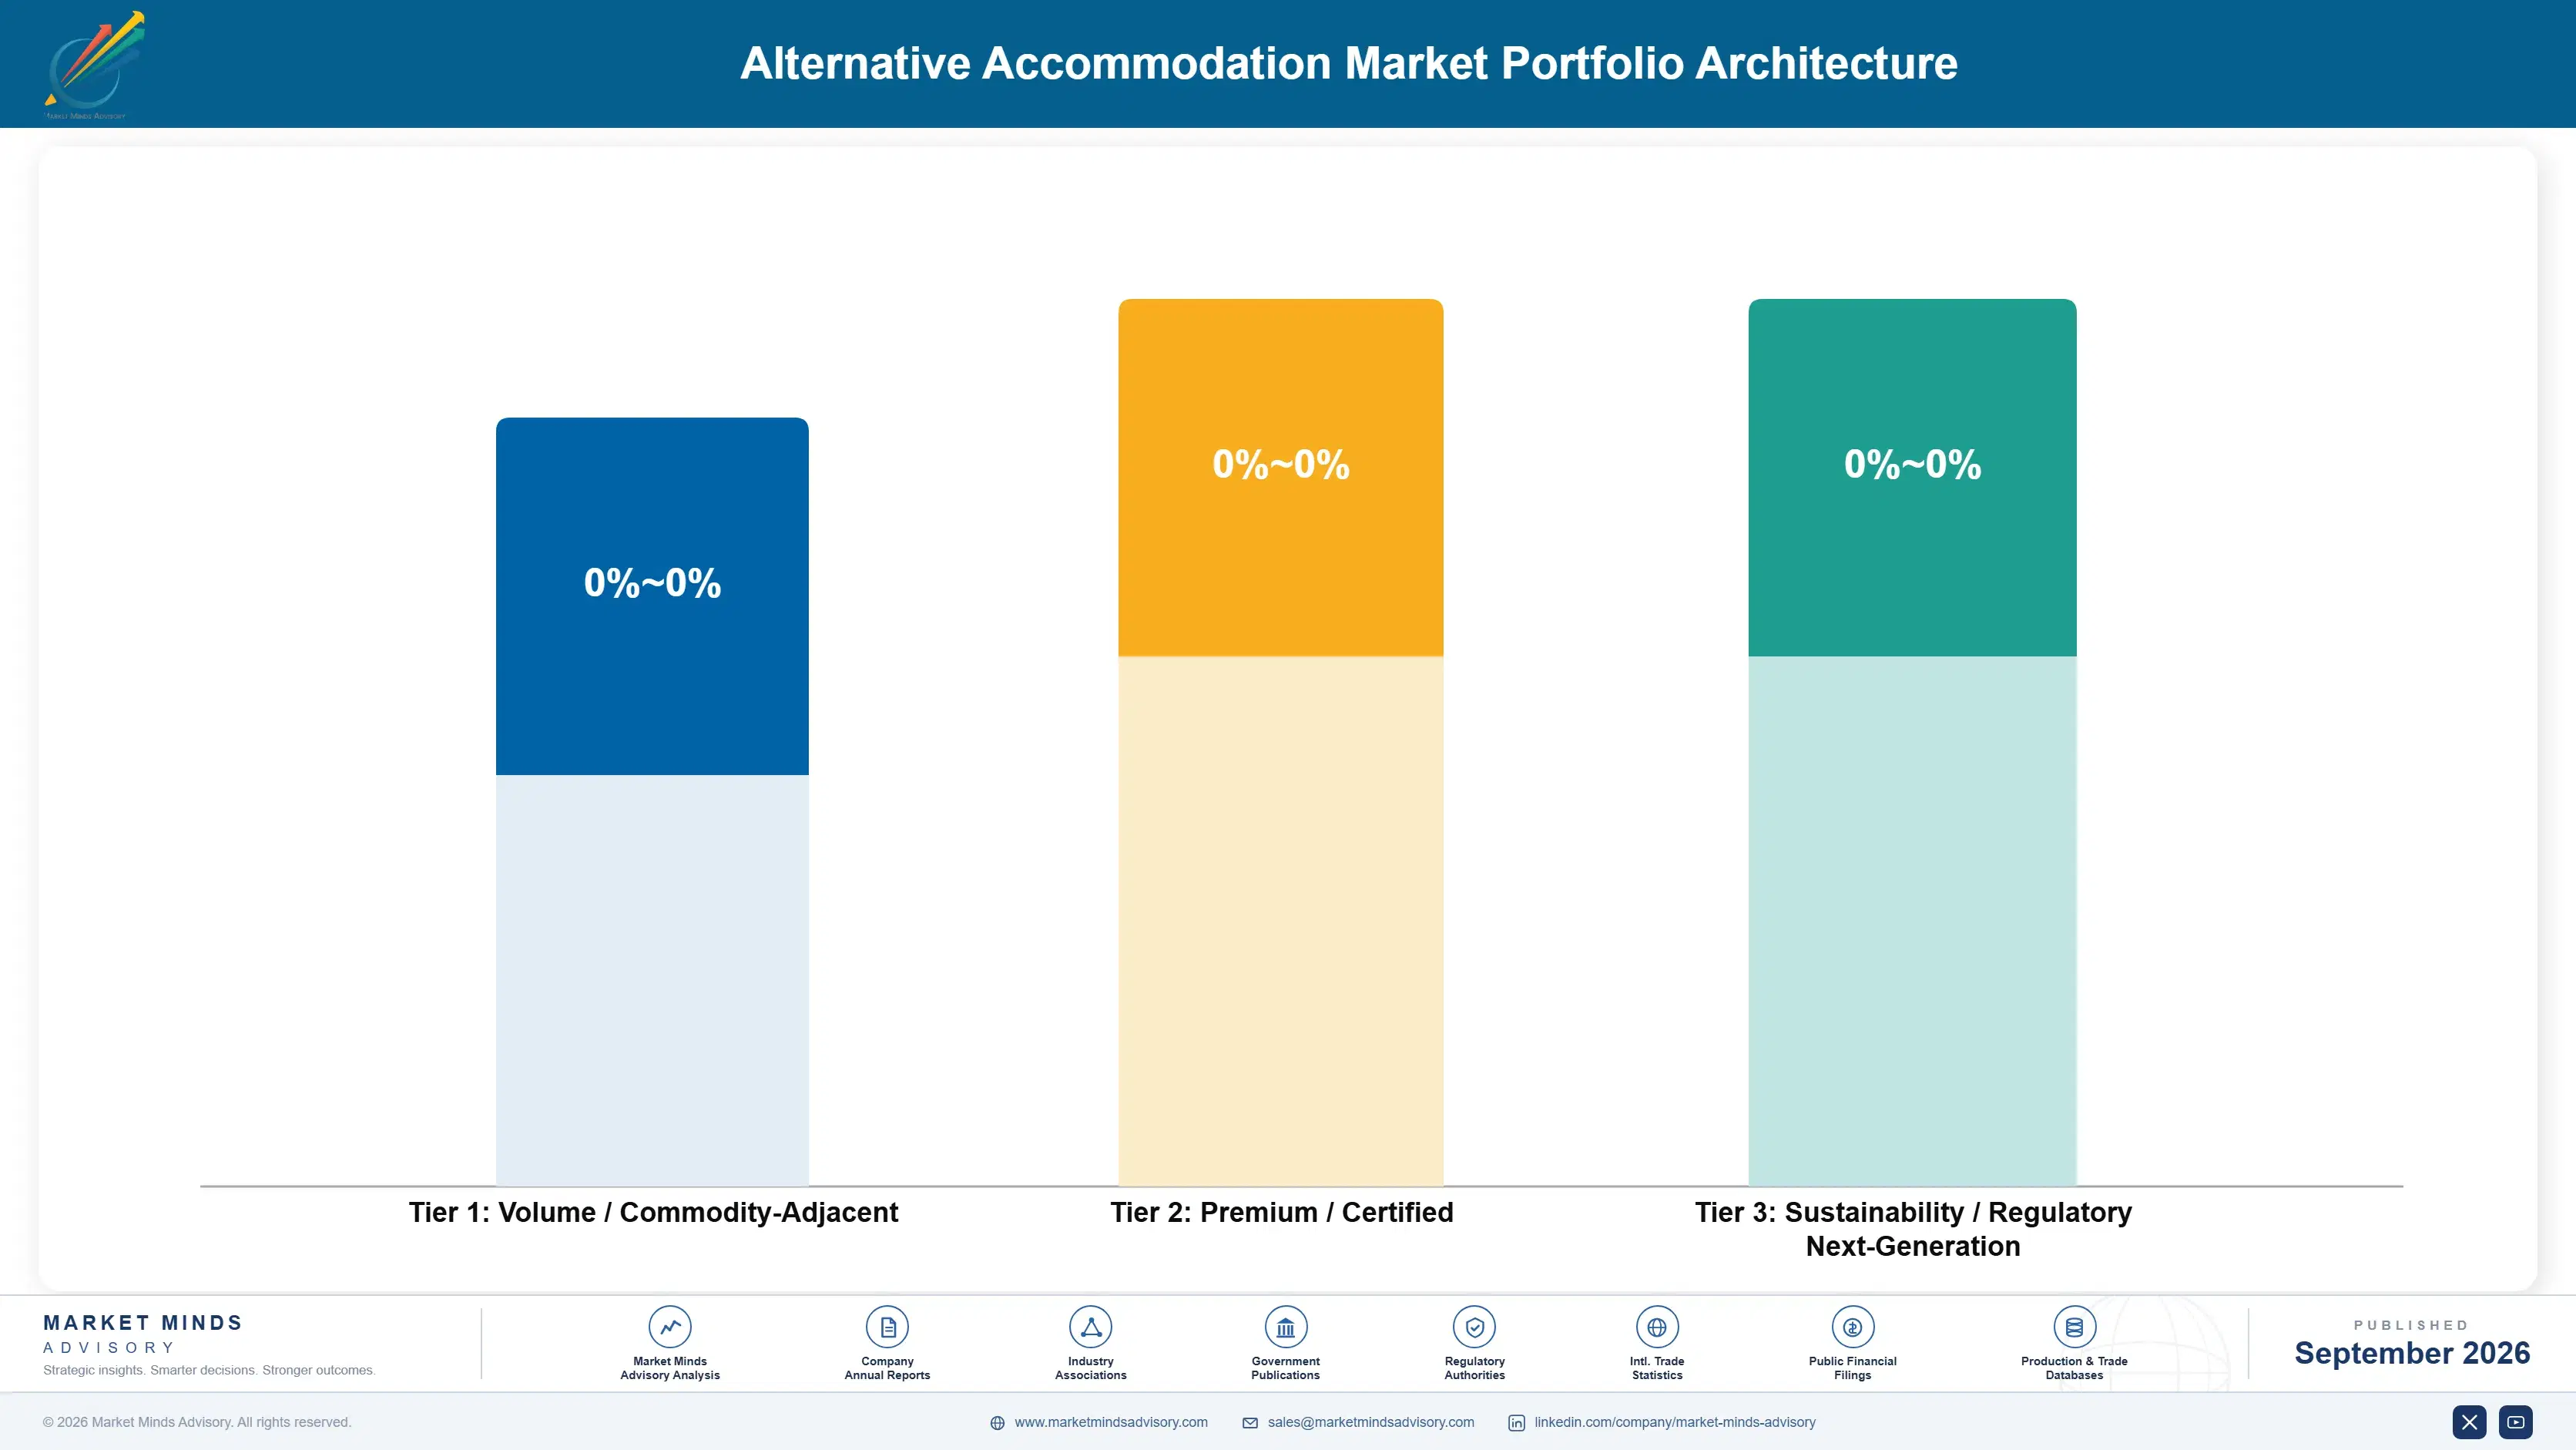
Margin architecture divides by regulatory permanence rather than by nightly rate, which is not what a rate card would suggest. Unlicensed urban apartment lets run at gross margins in the high twenties to high thirties, carrying full property cost against inventory that a municipal decision can remove entirely without notice or compensation of any kind. That risk is not priced into nightly rate anywhere in the market.
Licensed serviced apartments and managed vacation rentals hold gross margins in the high thirties to high forties. The spread reflects how differently leased and managed inventory carry property cost. Licensed inventory also finances at lower rates, because a lender underwrites a permitted use rather than a regulatory risk, and that difference compounds across a portfolio over time.

The highest-value pool is extended-stay corporate housing and premium unique stays, at margins in the high forties to high fifties. Corporate housing books longer, pays reliably and needs far less turnover. Premium unique stays command rates that bear little relation to their cost base. Unlicensed urban apartments fill the calendar and generate volume. They are not an asset anybody can defend. Volume and defensibility are different things, and the industry has spent a decade confusing them.

Volume / Commodity-Adjacent

Unlicensed urban apartment lets carrying full property cost against inventory a municipal decision can remove without compensation. The ten point range reflects how differently leased and owned positions carry that cost.
Gross Margin: 28 to 38%

Premium / Certified

Licensed serviced apartments and professionally managed vacation rentals. Licensed inventory finances at lower rates because a lender underwrites a permitted use rather than a regulatory risk, and that difference compounds.
Gross Margin: 38 to 48%

Sustainability / Regulatory / Next-Generation

Extended-stay corporate housing and premium unique stays. Corporate housing books longer and needs far less turnover; unique stays command rates bearing little relation to their underlying cost base. Both require capability most short-let operators never built.
Gross Margin: 47 to 58%
alternative-accommodation-market-portfolio-architecture-1790023873212

High-value Sub-segments and Strategic Watch-out

Licensed Serviced Apartments

High value and fastest growth at 12.6%. Purpose-consented inventory sits outside registration regimes and night caps entirely, which makes it financeable on terms that scattered apartment portfolios cannot obtain from any lender, and hotel groups have now entered the same format with balance sheets independents cannot match.
Gross Margin: 44 to 52%

Extended-Stay Corporate Housing

High value and moderate growth. Bookings run long, payment is reliable and turnover cost per night falls sharply, though the segment requires corporate procurement capability that most short-let operators have never built. Procurement relationships replace search entirely, which makes renewal administrative rather than discretionary each year.
Gross Margin: 48 to 56%

Urban Apartment Short Lets

Volume core, generating substantial booking value while carrying registration, night cap and primary-residence exposure in every regulated city. It fills calendars but it is not an asset anybody can defend. A municipal decision can remove the permitted use without notice or any compensation at all.
Gross Margin: 28 to 36%

Shared And Private Room Listings

Strategic watch-out. Growing slowest at 3.1% and squeezed by the same city rules professional supply was built to survive. The eighteen point range reflects how differently owner-occupied and managed rooms carry cost. The premise the whole category was founded on now sits in its slowest segment.
Gross Margin: 26 to 44%

How Bookings Actually Repeat

Repeat behaviour here attaches to the platform rather than to the property, which is the central commercial fact and the one operators most dislike. A guest who had an excellent stay returns to the search box, not to the host. That makes the platform the owner of the relationship and leaves operators competing on ranking and review score rather than on any loyalty they have earned themselves.
Stickiness varies sharply by trip purpose and by stay length. Corporate extended-stay bookings are the most durable, because a procurement relationship replaces a search and renewal becomes administrative rather than discretionary. Leisure vacation rental guests return to destinations rather than to properties, though a specific well-regarded home in a returning-family market does build genuine repeat demand. Urban short-break guests are the least attached to anything at all.

Buyer profiles have shifted decisively since 2020 and the supply has followed slowly. Remote and hybrid work produced a cohort booking weeks rather than nights, and that group evaluates kitchens, desks, connection speed and laundry rather than location and photographs. Properties furnished for weekend breaks lose those bookings to purpose-fitted inventory. The refit is inexpensive and most operators still have not made it.
alternative-accommodation-market-end-use-penetration-index-1790023873710

Where The Position Holds

These are among the four positions where our research anticipates prominent divergence between winners and laggards over the coming forecast period. Each is grounded in the demand model, the regulatory perimeter, and the announced capacity pipeline.
01 / REGULATORY FORMAT MIGRATION

Move urban inventory into licensed formats

Registration requirements, annual night caps and primary-residence rules have cut urban apartment supply sharply, and only about 57% of listings in regulated cities hold valid registration today. Purpose-consented aparthotel inventory sits outside those regimes entirely and finances on better terms, because a lender underwrites permitted use rather than regulatory risk. Operators who converted report occupancy roughly 1.4 times their unlicensed apartment inventory and hold the asset through rule changes that strand competitors, and the capital moving into the format confirms the reasoning independently.
02 / TOTAL PRICE PRESENTATION

Fold the cleaning fee into the rate

Cleaning charges average around 19% of total guest payment and appear after the nightly rate has already done the comparison work, producing measurable abandonment at the checkout step. Folding the cost into the nightly rate costs ranking position on rate-sorted search and recovers considerably more on conversion. Operators who moved to all-in pricing report booking conversion rising roughly 27% with revenue per night effectively unchanged, making this presentation rather than pricing, and platforms are removing the ranking penalty on their own anyway.
03 / EXTENDED STAY FITTING

Furnish for weeks, not for weekends

Stays beyond seven nights now account for about 38% of nights booked and reduce cleaning cost per night sharply, since turnover is incurred once regardless of how long somebody stays. Properties fitted for short breaks convert poorly against those offering proper kitchens, dedicated workspace and in-unit laundry to the same searchers. Operators who refitted report revenue per available night rising roughly 22% while operating cost per night actually fell, because occupancy improved while turnover frequency fell at the same time.
04 / COMPLIANCE OPERATING CAPABILITY

Treat registration as an ongoing function

City rules now differ between neighbouring municipalities and change faster than a typical lease term, which makes compliance a continuous operating function rather than a filing completed once. Operators treating it as administrative overhead lose listings to enforcement without any warning at all. Those running dedicated regulatory monitoring report compliant listing rates above 94% against a market average near 57%, and they acquire distressed portfolios from operators who did not, which turns a compliance function into an acquisition advantage quite directly.

Engagement Snapshot From the Field

A live engagement with an industry participant carrying material or product regulatory and market exposure ahead of a defining policy shift, showing how our research translates into a defensible multi-year portfolio strategy.
MARKET MINDS ADVISORY · CLIENT ENGAGEMENT SUMMARY
Alternative Accommodation Producer Strategic Portfolio Review and Transition Roadmap 2026·Investment Scenario on Alternative Accommodation Exposure Evaluation 2025-26
CLIENT PROFILE
A European short-let operator managing 640 urban apartments across six cities under long leases, with gross booking value near USD 74 million (client-reported, unverified by MMA). Around 71% of inventory sat in cities with active registration regimes. Cleaning fees averaged 21% of guest payment and average stay length ran at 2.8 nights across the portfolio.
STRATEGIC CHALLENGE
Occupancy had fallen for five consecutive quarters while lease obligations stayed fixed, and management attributed the decline to competitive supply growth. A marketing spend increase had been approved. Nobody had separated performance between registered and unregistered listings, or examined why conversion fell at checkout. Neither question had been asked in five quarters.
MMA APPROACH
MMA separated occupancy, rate and conversion by registration status and by city regime rather than reporting the portfolio as one. Checkout abandonment was measured against fee proportion. Lease obligations were mapped against regulatory exposure city by city, and stay-length economics were rebuilt from turnover cost. Draft municipal legislation was reviewed city by city.
KEY FINDINGS
  1. Unregistered listings ran occupancy 23 points below registered ones in the same cities, and 38% of the portfolio was unregistered, which explained most of the decline attributed to competition.
  2. Checkout abandonment rose steeply above a fee proportion of 18%, and the portfolio averaged 21%, costing an estimated 9% of potential bookings outright.
  3. Turnover cost per night on 2.8-night stays ran 2.4 times that of stays beyond seven nights, and only 11% of bookings exceeded a week.
  4. Four cities representing 29% of leased inventory had draft regulations that would remove the permitted use entirely within two years. on the drafting timetable published at the time.
CLIENT PROFILE
A European short-let operator managing 640 urban apartments across six cities under long leases, with gross booking value near USD 74 million (client-reported, unverified by MMA). Around 71% of inventory sat in cities with active registration regimes. Cleaning fees averaged 21% of guest payment and average stay length ran at 2.8 nights across the portfolio.
STRATEGIC CHALLENGE
Occupancy had fallen for five consecutive quarters while lease obligations stayed fixed, and management attributed the decline to competitive supply growth. A marketing spend increase had been approved. Nobody had separated performance between registered and unregistered listings, or examined why conversion fell at checkout. Neither question had been asked in five quarters.
MMA APPROACH
MMA separated occupancy, rate and conversion by registration status and by city regime rather than reporting the portfolio as one. Checkout abandonment was measured against fee proportion. Lease obligations were mapped against regulatory exposure city by city, and stay-length economics were rebuilt from turnover cost. Draft municipal legislation was reviewed city by city.
KEY FINDINGS
  1. Unregistered listings ran occupancy 23 points below registered ones in the same cities, and 38% of the portfolio was unregistered, which explained most of the decline attributed to competition.
  2. Checkout abandonment rose steeply above a fee proportion of 18%, and the portfolio averaged 21%, costing an estimated 9% of potential bookings outright.
  3. Turnover cost per night on 2.8-night stays ran 2.4 times that of stays beyond seven nights, and only 11% of bookings exceeded a week.
  4. Four cities representing 29% of leased inventory had draft regulations that would remove the permitted use entirely within two years. on the drafting timetable published at the time.
RECOMMENDED STRATEGY
Phase 1: Phase one: halt the marketing increase, register every eligible listing and exit leases in the four cities facing prohibition. Exit costs were funded from marketing. Phase 2: Phase two: move to all-in pricing across the portfolio and set minimum stays at five nights in urban markets. Leisure markets keep shorter minimums. Phase 3: Phase three: redeploy released capital into licensed aparthotel inventory under management agreements rather than leases. Occupancy risk moves back to the property owner.
OUTCOME
Occupancy recovered 14 points across three quarters and booking conversion improved by roughly a quarter once all-in pricing took effect (client-reported, unverified by MMA). Average stay length reached 4.6 nights, cutting turnover cost per night materially, and the four prohibited-use leases were exited before the rules took force.

Frequently Asked Questions

Foundational context covering the market sizes, CAGR, scope, country, region and competition that inform every finding below. This section is provided to cover basics and most often pre-purchase conversations, answered from the MMA Primary Research Dataset.

What is the current size of the Alternative Accommodation Market?

The market was valued at USD 148.0 billion in 2025, rising to USD 160.4 billion in 2026. Sizing is at gross booking value across six accommodation types.

How large will the Alternative Accommodation Market be by 2036?

MMA forecasts USD 359.3 billion by 2036, an increase of USD 198.9 billion over the 2026 base. That represents expansion of 2.24 times across the forecast period.

What is the CAGR for the Alternative Accommodation Market 2026 to 2036?

The base case CAGR is 8.4%, with a bull case of 9.7% and a bear case of 7.1%. Historical growth between 2020 and 2025 ran at 7.2%.

Which segment is growing fastest?

Serviced apartments and aparthotels grow at 12.6%, half again the market rate, because licensed inventory satisfies city registration rules. Vacation rental homes follow at 9.8%.

Who are the major companies in the Alternative Accommodation Market?

Airbnb, Booking Holdings, Expedia Group, Sonder Holdings and Tujia lead on gross booking value, holding a combined 44%. Demand concentrates far more heavily than that figure suggests.

Which country is growing fastest?

Vietnam grows fastest at 14.1%, driven by domestic travel expansion, low-cost regional air capacity and condominium inventory designed for short-let use from the outset. Regulation there remains considerably lighter than in European cities.

Report Segmentation Architecture

The full report scope spans multiple orthogonal segmentation dimensions, with cross-tabulated demand data provided for each dimension pair. Coverage extends further to regional breakdowns, trend trajectories, and the competitive detail needed to support segment-level decision-making.

By Accommodation Type

  • Whole-Home Vacation Rentals
  • Urban Short-Term Apartment Lets
  • Serviced Apartments and Aparthotels
  • Shared and Private Room Listings
  • Cabins, Glamping and Unique Stays
  • Extended-Stay Corporate Housing

By End-Use Industry

  • Leisure Group and Family Travel
  • Corporate Travel and Relocation
  • Remote and Extended Work Stays
  • Events and Destination Gatherings
  • Medical and Educational Travel
  • Insurance and Displacement Housing

By Commercial Dimension

  • Global Platform Booking
  • Regional and Domestic Platforms
  • Operator Direct Booking
  • Corporate Procurement Contracts
  • Travel Agency Distribution
  • Property Management Agreements

By Region

  • North America
  • Western Europe
  • East Asia
  • South Asia and Pacific
  • Latin America
  • Middle East and Africa
  • Eastern Europe

Scope, Methodology, and Coverage

Every figure in this report is reproducible from documented input assumptions. The scope below maps the historical period, the forecast horizon, the segmentation dimensions, and the countries covered, alongside the underlying primary and qualitative methodology.
Historical Period
2020 to 2025
Forecast Period
2026 to 2036
Base Year
2025 (USD billions; MMA Primary Research Dataset, September 2026)
Market Definition
This market covers paid accommodation booked outside traditional hotel inventory, spanning whole-home vacation rentals, urban short-term apartment lets, serviced apartments and aparthotels, shared and private room listings, cabins, glamping and unique stays, and extended-stay corporate housing. Sizing is at gross booking value across global platform, regional platform, direct, corporate procurement, agency and management agreement channels. Hotel rooms distributed through online travel agencies, timeshare and fractional ownership, unmanaged campsites, and long-term residential leasing are excluded throughout.
Quantitative Units
USD billions at gross booking value; volume in millions of nights booked; rate in USD per night.
Segmentation Dimensions
Accommodation type, end-use industry, commercial dimension, and geographic region.
Regions Covered
North America, Western Europe, East Asia, South Asia and Pacific, Latin America, Middle East and Africa, Eastern Europe
Countries Covered
United States, France, Japan, Vietnam, Mexico, United Arab Emirates
Key Companies Profiled
Airbnb, Booking Holdings, Expedia Group, Sonder Holdings, Tujia, Vacasa, Sykes Holiday Cottages, Awaze, Interhome, Oyo Vacation Homes, Plum Guide, Numa Group, Limehome, Cycas Hospitality, The Ascott, Frasers Hospitality, Blueground, Landing, Tripadvisor Rentals, Agoda Homes
Quantitative Methodology
Primary survey, n=3,800 respondents, Q4 2025, six countries; demand-side model with trade association cross-validation
Qualitative Methodology
47 expert interviews, Q4 2025; applied to validate demand model assumptions, identify emerging dynamics, and assess competitive positioning
Report Format
PDF and XLSX data workbook (Word format preview document)
Publisher
Market Minds Advisory
Report Code
MMA-2026-CON-796
Published
September 2026
Contact
sales@marketmindsadvisory.com | www.marketmindsadvisory.com

Purchase the full Alternative Accommodation Market Report (2026 to 2036).

The full report sizes the alternative accommodation market across six accommodation types, six end-use categories and six commercial dimensions for all seven global regions through 2036. It separates performance by registration status and municipal regime rather than reporting national aggregates that conceal city-level variation. Checkout conversion is measured against fee proportion using platform-level data. Stay-length economics are rebuilt from turnover cost to show how extended stays change the operating model. Competitive assessment covers 20 participants on a consistent gross booking value basis, and draft and enacted municipal legislation is tracked across the cities that matter most.
Performance separated by registration status and municipal regime
Checkout conversion measured against total fee proportion
Stay-length economics rebuilt from turnover cost
Lease and management agreement exposure compared directly
Six accommodation types sized through 2036
Twenty participants assessed on gross booking value

Built For The People Who Decide

From boardroom strategy to bench-side execution, this report is read cover-to-cover by leaders shaping the next decade of their industry, turning demand scenarios, market dynamics and valuation benchmarks into decisions.
CXOs/ Presidents/ VPs/ Managers
M&A and Corporate Development
Strategy Teams and R&D Heads
Procurement and Product Directors
Regulatory and Compliance Leaders
Investor Relations and Equity Analysts