

Market Minds Advisory
Alpha Olefin Market

Alpha Olefin Market: The Cut Problem, On-Purpose Escape Routes, and Decene Scarcity Nobody Planned For

Full-range oligomerisation produces a fixed statistical spread of carbon numbers, so a producer cannot make more decene without making more of everything else, and that single constraint governs the entire market.

Lead Analyst

Bilal Shaikh

Published

September 2026

Make Smarter Decisions with Customized Research Insights

Request a free sample report and evaluate market opportunities, growth trends, and competitive dynamics relevant to your business needs.

2025 MARKET VALUE$13.6BMarket Size 2025
2036 FORECAST VALUE$26.6BBase Case , 2026 to 2036
CAGR 2026 TO 20366.3 %Bull 7.6% / Bear 5.0%
INCREMENTAL OPPORTUNITY$12.2BNet 10- year value creation
EXPANSION MULTIPLE1.84x2036 value over 2026 base
Strategic Levers
M&A Pipeline
Regional Outlook
Country Rankings
Competitive Intelligence
Segmental Deep-dive
Call-Us : 91 93563 13602

Executive Snapshot and Market Trajectory

Alpha olefin economics are governed by an awkward physical fact. Conventional ethylene oligomerisation yields a statistical distribution across carbon numbers, so a producer chasing scarce decene also makes butene, octene, and heavy ends it may have nowhere profitable to sell. Whole-slate economics decide the year, not any single fraction.
Commercial power sits with producers who escaped that constraint. Selective on-purpose routes to hexene and octene, and Fischer-Tropsch derived octene, let a supplier make what the market wants rather than what the reactor gives, and roughly 34% of capacity now works this way. 1-decene grows fastest at 9.2%, roughly 1.46 times the market, on synthetic lubricant demand. East Asia holds 30% of value. That gap keeps widening.
Concentration is high at roughly 62% for the top five, since oligomerisation demands catalyst systems, fractionation trains, and ethylene integration that few operators possess. Regional cost position has diverged sharply: American producers on ethane feedstock hold an advantage European crackers cannot match, and several European ethylene assets have been announced for closure. Chinese polyethylene capacity additions keep pulling comonomer demand eastward regardless. Cost position between regions is now diverging permanently rather than converging.
Market Definition
This report covers linear alpha olefins produced by ethylene oligomerisation and related selective routes, spanning 1-butene, 1-hexene, 1-octene, 1-decene, 1-dodecene, and C14 and heavier fractions. Value is measured at producer level on a contained alpha olefin basis. Internal and branched olefins, ethylene and propylene themselves, downstream derivatives including polyalphaolefins and detergent alcohols, and olefins recovered from refinery streams without deliberate oligomerisation fall outside scope.
Base Year Value
$13.6B in 2025 (MMA Primary Research Dataset, August 2026)
Forecast Period
2026 to 2036, eleven discrete annual values
CAGR
6.3% base case. Bull 7.6%. Bear 5.0%.
Fastest Growth Segment
1-Decene: 9.2% CAGR
Fastest Growth Country
India: 8.9% CAGR
Fastest Growth Region
South Asia and Pacific: 8.4% CAGR
Largest Region
East Asia: 30% of 2025 global value
Market Leaders
Chevron Phillips Chemical, INEOS Oligomers, Shell Chemicals, SABIC, Sasol. Source: MMA Analysis based on company annual reports.
Primary Survey
n=3,800 procurement and R&D decision-makers, Q4 2025, six countries
Methodology
Demand-side build-up, cross-validated against public data, 47 expert interviews

Alpha Olefin Market Forecast Scenarios

alpha-olefin-market-trends-size-forecast-scenario-1787464014764
The 2020 to 2025 period was defined by comonomer demand growth and by feedstock cost divergence. Chinese polyethylene capacity additions pulled hexene and octene demand upward consistently, while European crackers struggled with energy costs that American ethane-based producers never faced. Decene tightened separately as synthetic lubricant demand rose faster than full-range output could supply it. The 5.1% historical growth blends those movements with heavy pricing volatility.
The 6.3% base case rests on three mechanisms. Polyethylene comonomer demand keeps shifting from butene toward hexene and octene as film producers chase mechanical properties that butene copolymers cannot deliver. Synthetic lubricant demand keeps growing through electric vehicle driveline fluids, data centre immersion cooling, and aviation applications, all of which consume decene specifically. And on-purpose capacity keeps being added, letting producers serve those shifts without accepting unwanted co-production of every other fraction.
The 7.6% bull case assumes immersion cooling adoption in data centres scales quickly, tightening decene well beyond current expectations. The 5.0% bear case reflects Chinese self-sufficiency in comonomer arriving faster than forecast, alongside European cracker closures removing regional demand and displacing exports into already competitive markets. Chinese self-sufficiency timing decides which of those cases arrives first.

Why the Cut Decides Everything

Three forces govern this market and demand for any single fraction is only one of them. Product distribution comes first, because full-range oligomerisation delivers a fixed spread and a producer cannot preferentially make whichever fraction is scarce. Ethylene cost comes second at 64% of production cost, and it diverges enormously between ethane and naphtha regions. Downstream pull comes third, and it keeps shifting up the carbon range.
TOP-FIVE CONCENTRATION62%Share of global alpha olefin capacity held collectively
AVERAGE SELLING PRICE$1,760/tonneBlended price across comonomer and specialty carbon fractions
COMONOMER DEMAND SHARE58%Portion of output consumed in polyethylene copolymer production
ETHYLENE COST SHARE64%Feedstock input as proportion of total production cost
ON-PURPOSE CAPACITY SHARE34%Output from selective rather than full-range oligomerisation routes
CAPACITY UTILISATION79%Average loading across oligomerisation and fractionation plant assets
That produces a commercial character unlike most petrochemicals. A full-range producer chasing decene generates butene it must place at whatever the market allows, so profitability depends on the whole slate clearing. Producers holding on-purpose hexene or octene capacity avoid that entirely and can respond to demand shifts directly. That gap widens whenever any single fraction tightens.
The next decade turns on how far on-purpose capacity spreads. Selective routes to hexene and octene are proven and increasingly deployed, but no comparable commercial route to decene exists at scale, which is precisely why decene keeps tightening as synthetic lubricant demand grows. Whoever solves selective decene production breaks the constraint defining this industry, and licensors are working on it without visible success yet.
"Every alpha olefin producer will tell you decene margins are excellent. Ask how much butene they had to sell at a loss to make it, and the conversation moves to the weather."
Director, Petrochemicals and Olefin Derivatives Practice · MMA Petrochemicals / Olefin Derivatives Practice · August 2026

Market Trends

Immersion Cooling Demand Tightens an Already Scarce Fraction

Data centre operators deploying single-phase immersion cooling for high-density artificial intelligence workloads consume synthetic dielectric fluids based on polyalphaolefins, which are made from 1-decene. That demand arrived quickly and from a sector with no history in lubricant markets, competing directly against established synthetic lubricant and driveline fluid buyers for a fraction that full-range oligomerisation produces in fixed proportion. Producers cannot respond by making more decene without making more of everything else. Pricing has moved accordingly, and several PAO producers now allocate rather than sell. Nobody in the lubricant industry saw this demand source coming at all.
Market Impact: Raises comonomer value 2.4x
On-Purpose Routes Break the Fixed Distribution Constraint

Selective ethylene trimerisation to 1-hexene and tetramerisation to 1-octene, alongside Fischer-Tropsch derived octene, now account for roughly 34% of global capacity and let producers make what customers want rather than what the reactor statistically delivers. Licensed technologies from several providers have been deployed across the Gulf, Asia, and North America. The commercial advantage is decisive when any single fraction tightens, because an on-purpose producer captures the price movement while a full-range operator must place unwanted co-products. Chinese capacity additions have adopted selective routes heavily. Full-range operators watch the same price movement disappear into placement losses.
Market Impact: Consumes 26% of decene output

Market Opportunities and Growth Drivers

Comonomer Demand Migrates From Butene Toward Higher Carbon Numbers

Linear low density polyethylene film producers keep shifting comonomer from butene to hexene and increasingly octene, because longer side branches deliver tear strength, puncture resistance, and dart impact that butene copolymers cannot match at equivalent density. Metallocene grades in particular specify octene for demanding packaging and industrial film. Each step up the carbon range raises alpha olefin value per tonne of polyethylene produced considerably. Chinese and Southeast Asian capacity additions have adopted hexene and octene grades from commissioning rather than transitioning later, which accelerates the shift permanently across the region.
Market Impact: Fixes distribution across 6 fractions

Electric Driveline Fluids Expand Synthetic Lubricant Consumption

Electric vehicle transmissions and integrated drive units require fluids that lubricate gears, cool motors, and remain electrically insulating simultaneously, and polyalphaolefin base stocks made from decene meet that combination better than mineral alternatives. Fluid volumes per vehicle are smaller than conventional engine oil fills, but specification requirements are considerably tighter and formulators specify synthetic base stocks by default. Aviation and industrial synthetic lubricants add further decene consumption on established demand. Together these applications compete for a fraction whose supply cannot be increased independently of everything else. Substitution options at these performance levels remain genuinely limited.
Market Impact: Removes 4 integrated cracker positions

Market Restraints and Challenges

Fixed Product Distribution Traps Full-Range Producer Economics

Conventional ethylene oligomerisation yields a statistical spread across carbon numbers set by catalyst chemistry and operating conditions, and adjusting it shifts the whole curve rather than isolating one fraction. The root cause is reaction kinetics rather than plant design. A producer running hard to capture decene pricing therefore generates butene and heavy ends that must be placed at whatever the market allows, and whole-slate economics decide profitability. Responses include on-purpose capacity investment, co-product upgrading into detergent alcohols and oilfield chemicals, and swap arrangements between producers with complementary imbalances. Whole-slate clearing decides the year, not headline margin.
Market Impact: Drives 9.2% decene segment growth

European Cracker Closures Remove Integrated Feedstock Positions

Several European ethylene crackers have been announced for closure or conversion as energy costs and Asian competition made them uneconomic, and alpha olefin plants integrated with those assets lose their feedstock position entirely. The root cause is regional cost structure rather than any weakness in olefin demand. Producers left buying merchant ethylene face costs that ethane-advantaged American and Gulf competitors do not. Responses include relocating capacity toward advantaged feedstock regions, negotiating long-term merchant ethylene supply, and concentrating remaining European output on specialty fractions where freight protects position. Merchant purchasing cannot restore what integration provided.
Market Impact: Covers 34% of global capacity
3 additional market trends, 2 additional growth drivers, and 4 additional restraints and challenges are covered in the full report. Contact sales@marketmindsadvisory.com to access the complete intelligence.

Segment CAGR and Growth Architecture

Segmentation follows carbon number, the single logic the industry itself trades on and the one determining application, price, and whether a fraction can be made deliberately at all. Carbon number decides everything downstream, from comonomer performance to lubricant viscosity. Production route, end-use industry, and channel structure appear separately in the framework as commercial dimensions rather than parallel segments.
alpha-olefin-market-trends-market-share-analysis-1787464015305

1-Decene

Decene is the scarcest commercially important fraction and the one with no proven selective production route, which is precisely why it commands the pricing it does. Growth of 9.2%, roughly 1.46 times the market, comes from polyalphaolefin demand across electric vehicle driveline fluids, aviation and industrial synthetic lubricants, and now data centre immersion cooling for high-density computing. Full-range oligomerisation produces decene as a modest slice of a fixed distribution, so supply cannot respond to demand without generating unwanted volumes of every other fraction. Several PAO producers now allocate rather than sell, and licensors working on selective decene routes have not yet demonstrated anything commercially viable at scale. Nothing about the demand growth changes that constraint.
CAGR 9.2%

1-Octene

Octene delivers the longest practical side branch in polyethylene comonomer applications, giving film producers tear strength, puncture resistance, and dart impact performance that hexene and butene copolymers cannot match at equivalent density. Growth of 8.6% follows metallocene linear low density polyethylene adoption and the general migration up the carbon range. Unusually for this market, octene can be made on purpose through ethylene tetramerisation and through Fischer-Tropsch routes, which frees producers from the distribution constraint governing decene. That optionality has attracted capacity investment across the Gulf and Asia, and it means octene supply can genuinely respond to demand rather than merely reflecting whatever the reactor happened to produce. That optionality is worth more than the margin difference suggests.
CAGR 8.6%
Full segment breakdown across 6 segments available in the complete report.

Regional Architecture and Country Demand Map

East Asia holds the largest share at 30%, driven by Chinese polyethylene capacity additions pulling comonomer demand and by domestic on-purpose capacity investment. North America follows on ethane feedstock advantage, while Middle East and Africa punches above its share on integrated Gulf positions. South Asia and Pacific grows fastest overall.

North America

Ethane feedstock advantage defines this region and shows up directly in alpha olefin cost position. Gulf Coast producers including Chevron Phillips, INEOS, and Shell operate integrated ethylene and oligomerisation assets at costs European competitors cannot approach, and that gap widened rather than narrowed after 2022. Chevron Phillips holds significant selective hexene capacity, which frees it from the distribution constraint on that fraction. Domestic polyethylene capacity absorbs substantial comonomer, and synthetic lubricant demand for decene grows with both automotive and data centre applications. Regional growth of 5.6% reflects a mature demand base where cost position rather than volume drives commercial outcomes. Cost position rather than volume growth is what matters commercially here.
Share: 26% | CAGR: 5.6% (2026 to 2036)

Western Europe

This region is contracting rather than growing, and cracker economics explain why. Several European ethylene assets have been announced for closure or conversion as energy costs and Asian import competition made them uneconomic, and alpha olefin plants integrated with those crackers lose feedstock positions they cannot easily replace. What remains concentrates on specialty fractions where freight cost protects regional supply and on established comonomer customers with logistics reasons to buy locally. Shell and INEOS retain significant European positions. Growth of 4.7% is the slowest of any region and reflects a cost structure that shows no sign of improving materially. The cost structure shows no sign of improving materially. Specialty fractions are the remaining defence.
Share: 20% | CAGR: 4.7% (2026 to 2036)
Regional intelligence for 5 additional markets available in the complete report: East Asia, South Asia and Pacific, Latin America, Middle East and Africa, Eastern Europe. Contact sales@marketmindsadvisory.com.
alpha-olefin-market-trends-country-cagr-analysis-1787464015885

Where Alpha Olefin Margin Actually Sits

Running a full-range plant hard to chase one fraction and dumping the rest is how producers turn a good price into an average year. The four moves below attack the constraint directly: on-purpose capacity, co-product upgrading, decene allocation discipline, and swap arrangements that fix imbalances without building anything at all. None of the four requires better catalyst chemistry.

Invest in Selective Hexene and Octene Capacity

Licensed trimerisation and tetramerisation routes let a producer make the fraction customers actually want rather than accepting whatever the statistical distribution delivers, and roughly 34% of global capacity now works this way. A selective unit costs around $340 million at commercial scale, which is substantial and considerably less than the value destroyed by placing unwanted co-products across a decade. Producers holding on-purpose capacity capture price movements in tight fractions directly, while full-range operators watch the gain disappear into co-product placement losses. The distribution curve is a constraint you can buy your way out of.
Market Impact: Captures the full price movement on 34% capacity

Upgrade Co-Products Rather Than Clearing Them at Market

Butene and heavy fractions generated alongside scarce decene frequently clear at prices barely covering variable cost, and that placement loss determines whole-slate profitability more than the headline fraction margin does. Integrating downstream into detergent alcohols, oilfield chemicals, or plasticiser alcohols converts distress volume into a business, typically lifting realised value on those fractions by 30% to 45%. Capital runs to roughly $180 million for a meaningful derivatives position. It also removes the pressure to run the oligomerisation unit around co-product placement rather than around demand. Trader clearance is not a placement strategy.
Market Impact: Lifts co-product realised value by 30 to 45%

Allocate Decene on Contract Rather Than Selling Spot

Decene supply cannot respond to demand because no selective route exists, and synthetic lubricant, driveline fluid, and immersion cooling buyers are all competing for a fixed slice. Moving to multi-year allocation contracts with volume commitments and indexed pricing secures customer relationships through the tight period rather than harvesting spot prices and losing them afterwards. Contracted customers accept 12% to 18% above historical spot averages for security of supply. Producers who maximised spot realisation during the last squeeze found formulators had qualified alternative base stocks by the time it eased. Qualification once completed rarely gets reversed.
Market Impact: Secures 12 to 18% above historical spot averages

Trade Imbalances Through Producer Swap Arrangements

A full-range producer long butene and short octene, and a selective producer with the reverse position, can both improve realisation through swap arrangements without either building capacity. These deals are commercially awkward between competitors and they work, typically improving blended realisation by 4% to 7% for both parties. Freight and specification alignment are the practical obstacles rather than any commercial objection. Producers who treat every competitor purely as a rival forgo an easy improvement that requires no capital and no board approval. No capital, no board approval, and both parties gain.
Market Impact: Improves blended realisation by roughly 4 to 7%

Who Controls the Margin Pool

The top five hold roughly 62% of capacity, measured consistently as alpha olefin production capability on a contained basis. Chevron Phillips, INEOS, Shell, SABIC, and Sasol combine ethylene integration, oligomerisation technology, and fractionation scale that few operators can assemble. The competitive divide is no longer size but whether a producer holds selective capacity or remains bound by full-range statistical distribution across every fraction.
Competition runs along three lines. Feedstock position is the first, with ethane-advantaged Gulf Coast and Middle Eastern producers holding cost positions that naphtha-based European operators cannot match at any scale. Technology access is the second, covering selective trimerisation and tetramerisation licences and the Fischer-Tropsch route Sasol operates uniquely. The third is downstream integration, which determines whether co-products become a business or a placement problem.

Two pressures will reshape positions. Chinese on-purpose capacity additions keep reducing import dependence for exactly the comonomer fractions that carry growth, which will eventually displace export volumes currently flowing east. Meanwhile decene scarcity keeps rewarding whoever can supply it, and no selective route has emerged. The exposed position is a European full-range producer losing integrated cracker feedstock with no selective capacity and no downstream derivatives business.
alpha-olefin-market-trends-company-positioning-matrix-1787464016413

Competitive Moat and Risk Dimensions

CHEVRON PHILLIPS CHEMICAL

Moat: Ethane Integration and Selective Hexene

The company combines Gulf Coast ethane-based ethylene integration with selective hexene production capability, which delivers both a feedstock cost position European producers cannot match and freedom from the distribution constraint on a major comonomer fraction. That combination is rare and it compounds, because low feedstock cost makes selective capacity investment easier to justify than it is elsewhere.
CHEVRON PHILLIPS CHEMICAL

Risk: Decene Distribution Dependence

Selective capability covers hexene rather than decene, so the company remains exposed to statistical distribution on the fraction with the tightest supply and strongest pricing. Capturing decene upside still requires running full-range units and placing co-products. Until a selective decene route exists, that exposure limits how much scarcity value any producer retains.
SASOL

Moat: Fischer-Tropsch Octene Production Route

Sasol produces 1-octene from Fischer-Tropsch derived streams rather than through ethylene oligomerisation, which is a genuinely distinctive route no competitor operates at comparable scale. It decouples octene output from ethylene economics entirely and from the statistical distribution that constrains conventional producers. That uniqueness has supported the position through several cycles where conventional producers struggled with co-product placement.
SASOL

Risk: South African Operating Exposure

The Fischer-Tropsch complex depends on South African coal feedstock, electricity supply, and rail logistics, all of which have been unreliable and carry considerable emissions exposure under tightening customer expectations. Buyers increasingly ask about carbon intensity of supply. Replicating the route elsewhere would require capital and feedstock conditions that do not obviously exist in any other jurisdiction.

Players Tracked

Prominent Players

Chevron Phillips Chemical
INEOS Oligomers
Shell Chemicals
SABIC
Sasol

Other Key Players

ExxonMobil Chemical
Dow
Qatar Chemical Company
Idemitsu Kosan
Mitsui Chemicals
Sinopec
PetroChina
Zhejiang Satellite Petrochemical
Linde
Axens
Evonik Industries
Nizhnekamskneftekhim
Formosa Plastics
Hanwha TotalEnergies
LG Chem

Recent Developments

FEBRUARY 2025

Data centre immersion cooling demand tightens polyalphaolefin supply

Synthetic lubricant producers reported constrained polyalphaolefin availability as data centre immersion cooling deployments for high-density computing workloads competed with established driveline and industrial lubricant demand. The underlying constraint traced to 1-decene supply, which full-range oligomerisation produces in fixed proportion and no selective route currently addresses.
Signal: A computing infrastructure trend is now setting pricing for a petrochemical fraction nobody can make deliberately.
SEPTEMBER 2024

European producers confirm ethylene cracker closures and conversions

Several European petrochemical operators confirmed cracker closures and conversions as energy costs and Asian import competition rendered assets uneconomic. Alpha olefin units integrated with those crackers face loss of feedstock positions, prompting evaluation of merchant ethylene supply arrangements or relocation toward advantaged feedstock regions instead.
Signal: Losing an integrated cracker removes a cost position that merchant ethylene purchasing cannot realistically restore afterwards.
JUNE 2025

Chinese producers commission additional selective comonomer capacity

Chinese petrochemical operators commissioned further selective hexene and octene capacity using licensed trimerisation and tetramerisation technology, reducing dependence on imported comonomer for the country's expanding polyethylene base. The additions target exactly the fractions where import volumes had been largest and growing fastest across preceding years.
Signal: Chinese self-sufficiency in comonomer supply will eventually displace most export volumes currently flowing into that region.

Ethylene, Catalyst, and Fractionation Energy

Ethylene feedstock accounts for roughly 64% of production cost, sourced from integrated crackers where available and purchased on merchant markets where not. Energy for oligomerisation, separation, and multi-column fractionation takes a further 15%, since resolving adjacent carbon numbers demands substantial distillation duty. Catalyst systems, solvents, and their recovery contribute 9%, and labour, maintenance, and effluent handling absorb the remaining balance.
European ethylene costs rose steeply through 2022 and 2023 as gas and naphtha pricing moved together, documented in IEA reporting, while American ethane-based producers saw far smaller increases and Gulf producers almost none. That divergence persisted rather than correcting, which is what ultimately drove the European cracker closure announcements. INEOS and Shell both referenced European petrochemical cost pressure across their 2023 and 2024 reporting, and several European oligomerisation units ran below economic utilisation throughout.

Exposure divides almost entirely on feedstock geography and integration. Producers with captive ethane-based ethylene absorbed the period comfortably and gained share. Those buying merchant ethylene in Europe faced costs no operational improvement could offset. Gulf producers on subsidised ethane hold the strongest position globally and export accordingly. Chinese producers using naphtha and coal-based routes sit in between, with position varying by site rather than company.
alpha-olefin-market-trends-cost-volatility-analysis-1787464016611

Site oligomerisation capacity against long-term ethylene cost position

Alpha olefin economics are dominated by ethylene at nearly two thirds of cost, so plant location relative to advantaged feedstock determines competitiveness for decades rather than seasons. Freight on the finished product is trivial by comparison, which means proximity to customers is the wrong siting criterion entirely. European producers learned this expensively and several are now acting on it.

Reduce fractionation duty through heat integration across columns

Separating adjacent carbon numbers demands substantial distillation energy, and heat integration between column reboilers and condensers typically cuts thermal duty by a tenth to a fifth. Payback runs inside four years at post-2022 European energy pricing and considerably longer where power is cheap. Neither product specification nor customer qualification changes, which is why the investment proceeds without any commercial friction.

Contract merchant ethylene on formula rather than spot terms

Producers without captive crackers face a persistent cost disadvantage that contract structure can at least stabilise. Formula pricing referenced to published ethylene benchmarks removes the worst volatility even where it cannot remove the cost gap itself. Sellers accept it because oligomerisation offtake is steady and creditworthy, which is worth something to a cracker operator managing its own placement.

Portfolio Architecture for Margin Defence

Three tiers separate on whether a fraction can be made deliberately and on how tight its supply is. Butene and heavy ends cleared into commodity outlets earn 6% to 14%, because they are frequently placement problems rather than products. Hexene and octene supplied on contract into polyethylene comonomer earn 16% to 26%, supported by specification requirements and long customer relationships. Decene and specialty fractions earn most, and scarcity rather than any cost advantage explains the whole gap.
The tension is that whole-slate economics govern everything for full-range producers. Running hard to capture decene pricing generates butene that must clear somewhere, and the placement loss frequently consumes most of the scarcity gain. That arithmetic is why on-purpose capacity and downstream co-product integration matter more than any individual fraction margin. Producers reporting excellent decene realisation while their overall results disappoint are describing exactly this problem without naming it.

High-value pools sit where supply genuinely cannot respond. Decene has no selective route, immersion cooling demand arrived from outside the lubricant industry entirely, and formulators have limited substitution options at the performance levels they require, which is why allocation rather than pricing has become the commercial mechanism.

Volume / Commodity-Adjacent Tier

Butene and C14 plus heavy fractions cleared into commodity comonomer, surfactant, and industrial outlets at whatever the market allows. Frequently placement problems rather than products. The wide range reflects large differences in downstream integration and freight position between producers.
Gross Margin: 6%-14%

Premium / Certified Tier

Hexene and octene supplied on multi-year contract into polyethylene comonomer applications with specification and purity requirements. Range width separates conventional comonomer supply from metallocene grade material carrying tighter specifications within the same tier.
Gross Margin: 16%-26%

Sustainability / Regulatory / Next-Generation Tier

Decene and specialty fractions supplied into synthetic lubricants, driveline fluids, and immersion cooling under allocation arrangements. Genuine supply scarcity with no selective production route, rather than any cost position, sustains the margin structure here.
Gross Margin: 30%-46%
alpha-olefin-market-trends-portfolio-architecture-1787464017120

High-value Sub-segments and Strategic Watch-out

Decene for Polyalphaolefin Production

Highest value in the market and the fraction nobody can make deliberately at scale. Immersion cooling demand arrived from outside the lubricant industry entirely and competes with driveline fluids. Allocation has replaced pricing as the commercial mechanism here. No selective route exists at commercial scale.
Gross Margin: 36%-46%

On-Purpose Octene Supply

High value with 8.6% growth and, unusually, supply that can actually respond to demand through tetramerisation and Fischer-Tropsch routes. Metallocene film performance drives the specification. Producers holding selective capacity capture price movements that full-range operators lose downstream. Supply here can genuinely respond to demand signals.
Gross Margin: 22%-32%

Contract Hexene Comonomer Supply

The reliable core, protected by specification requirements, purity thresholds, and long polyethylene producer relationships that rarely change. Selective capacity is widely available, so competition is real but orderly. It funds the rest of the portfolio dependably. Competition is real but unusually orderly in this fraction.
Gross Margin: 18%-26%

Butene and Heavy End Co-Products

The strategic watch-out. Generated whether wanted or not by full-range operation, and frequently cleared at prices barely covering variable cost. Placement losses here routinely consume most of the scarcity gain captured on decene in the same quarter. Downstream integration is the only durable answer available.
Gross Margin: 5%-13%

Why Comonomer Specifications Rarely Move

Alpha olefin revenue behaves as an annuity because a polyethylene producer cannot change comonomer casually. Reactor conditions, catalyst systems, product grade slates, and downstream customer qualifications are all built around a specific comonomer and its purity specification, and changing it means requalifying resin grades with converters who have their own validation to repeat. Typical comonomer supply tenure runs seven to ten years with a major polyethylene producer, punctuated by price negotiation rather than by supplier replacement.
Stickiness varies with how far downstream the specification reaches. Metallocene film grades are the most durable, because the comonomer choice is embedded in resin properties that converters have qualified into packaging structures with their own brand owner approvals behind them. Conventional comonomer supply comes next, protected by reactor tuning and logistics integration. Butene and heavy end co-product sales are the least sticky, moving on price and availability with no attachment whatsoever to the supplier.

Buyer profiles have shifted with decene scarcity. Lubricant formulators now negotiate supply security ahead of price, and several have begun qualifying alternative base stocks purely as insurance rather than from any intention to switch. Security of supply has displaced price as the opening subject in those negotiations.
alpha-olefin-market-trends-end-use-penetration-index-1787464017632

Where Alpha Olefin Capital Belongs

These are among the four positions where our research anticipates prominent divergence between winners and laggards over the coming forecast period. Each is grounded in the demand model, the regulatory perimeter, and the announced capacity pipeline.
01 / SELECTIVE CAPACITY INVESTMENT

Buy freedom from the distribution curve, not more full-range capacity

Licensed trimerisation and tetramerisation routes let a producer make the fraction customers actually want rather than accepting whatever statistical distribution the reactor delivers, and roughly 34% of global capacity already works that way. A selective unit costs around $340 million at commercial scale, which is substantial and considerably less than the value destroyed placing unwanted co-products across a decade of operation. Producers holding on-purpose capacity capture price movements in tight fractions directly, while full-range operators watch those gains disappear into placement losses.
02 / CO-PRODUCT INTEGRATION STRATEGY

Turn placement problems into a downstream derivatives business

Butene and heavy fractions generated alongside scarce decene frequently clear at prices barely covering variable cost, and that placement loss determines whole-slate profitability far more than any headline fraction margin ever does. Integrating into detergent alcohols, oilfield chemicals, or plasticiser alcohols converts distress volume into a genuine business, lifting realised value on those fractions by 30% to 45% at capital around $180 million. It also removes the standing pressure to run oligomerisation around co-product placement rather than around actual customer demand.
03 / DECENE ALLOCATION DISCIPLINE

Contract scarce fractions rather than harvesting the spot market

Decene supply cannot respond to demand because no selective route exists at commercial scale, and lubricant, driveline fluid, and immersion cooling buyers are all competing for a fixed slice of a fixed distribution. Multi-year allocation contracts with volume commitments and indexed pricing secure those relationships through the tight period, and customers accept 12% to 18% above historical spot averages for security. Producers who maximised spot realisation last time found formulators had qualified alternative base stocks by the time supply eased.
04 / FEEDSTOCK POSITION RELOCATION

Site against ethylene cost, because freight is trivial by comparison

Ethylene represents roughly 64% of alpha olefin production cost, and the gap between ethane-advantaged Gulf Coast and Middle Eastern positions and European naphtha economics widened rather than corrected after 2022, which is precisely what drove the recent cracker closure announcements. Freight on finished alpha olefins is trivial against that differential, so proximity to customers is entirely the wrong siting criterion. European producers learned this expensively across three years, and relocating capacity remains the only response that addresses the actual underlying problem.

Engagement Snapshot From the Field

A live engagement with an industry participant carrying material or product regulatory and market exposure ahead of a defining policy shift, showing how our research translates into a defensible multi-year portfolio strategy.
MARKET MINDS ADVISORY · CLIENT ENGAGEMENT SUMMARY
Alpha Olefin Producer Strategic Portfolio Review and Transition Roadmap 2026·Investment Scenario on Alpha Olefin Exposure Evaluation 2025-26
CLIENT PROFILE
A European alpha olefin producer operating a full-range oligomerisation unit integrated with a naphtha-based ethylene cracker, supplying comonomer and specialty fractions across twenty-eight countries, with annual revenue near EUR 480 million (client-reported, unverified by MMA). The plant held no selective capacity, co-products were cleared through traders, and roughly 41% of output was butene sold into commodity outlets.
STRATEGIC CHALLENGE
The parent cracker had been placed under strategic review following three years of uneconomic operation, which threatened the client's integrated feedstock position entirely. Decene realisations were strong but whole-slate margin had fallen to 7%, and butene placement had required repeated distressed sales. Management needed a position on relocation, selective capacity, and downstream integration simultaneously.
MMA APPROACH
MMA rebuilt margin on a whole-slate basis, isolating how much of the decene contribution was consumed by butene and heavy end placement losses each quarter. Selective capacity investment was costed against relocation to an advantaged feedstock region. Downstream derivatives options were assessed for co-product upgrading, and swap arrangements with complementary producers were evaluated, with findings tested through 47 expert interviews during Q4 2025.
KEY FINDINGS
  1. Butene and heavy end placement losses consumed an estimated 63% of the contribution generated by decene and octene sales across the preceding three financial years.
  2. Merchant ethylene purchasing following a cracker closure would raise feedstock cost by an estimated 22%, which no operational improvement at the oligomerisation unit could offset.
  3. A swap arrangement with two producers holding complementary imbalances could improve blended realisation by roughly 5% within a year and required no capital at all.
  4. Selective octene capacity at the existing site remained uneconomic under merchant ethylene assumptions, but was viable at a Gulf Coast or Middle Eastern location.
CLIENT PROFILE
A European alpha olefin producer operating a full-range oligomerisation unit integrated with a naphtha-based ethylene cracker, supplying comonomer and specialty fractions across twenty-eight countries, with annual revenue near EUR 480 million (client-reported, unverified by MMA). The plant held no selective capacity, co-products were cleared through traders, and roughly 41% of output was butene sold into commodity outlets.
STRATEGIC CHALLENGE
The parent cracker had been placed under strategic review following three years of uneconomic operation, which threatened the client's integrated feedstock position entirely. Decene realisations were strong but whole-slate margin had fallen to 7%, and butene placement had required repeated distressed sales. Management needed a position on relocation, selective capacity, and downstream integration simultaneously.
MMA APPROACH
MMA rebuilt margin on a whole-slate basis, isolating how much of the decene contribution was consumed by butene and heavy end placement losses each quarter. Selective capacity investment was costed against relocation to an advantaged feedstock region. Downstream derivatives options were assessed for co-product upgrading, and swap arrangements with complementary producers were evaluated, with findings tested through 47 expert interviews during Q4 2025.
KEY FINDINGS
  1. Butene and heavy end placement losses consumed an estimated 63% of the contribution generated by decene and octene sales across the preceding three financial years.
  2. Merchant ethylene purchasing following a cracker closure would raise feedstock cost by an estimated 22%, which no operational improvement at the oligomerisation unit could offset.
  3. A swap arrangement with two producers holding complementary imbalances could improve blended realisation by roughly 5% within a year and required no capital at all.
  4. Selective octene capacity at the existing site remained uneconomic under merchant ethylene assumptions, but was viable at a Gulf Coast or Middle Eastern location.
RECOMMENDED STRATEGY
Phase 1: Phase 1 (months one to eight): negotiate swap arrangements with two complementary producers and secure formula-priced merchant ethylene against cracker closure. Phase 2: Phase 2 (months nine to twenty-four): move decene and specialty customers onto multi-year allocation contracts and exit distressed butene trading entirely. Phase 3: Phase 3 (months twenty-five to forty-eight): evaluate selective octene capacity at an advantaged feedstock location rather than at the existing European site.
OUTCOME
The producer implemented both swap arrangements and reported whole-slate margin improving from 7% to 13% within fourteen months (client-reported, unverified by MMA). Decene customers moved onto allocation contracts at improved realisations. The Gulf Coast capacity study is under way and the European cracker review remains open.

Frequently Asked Questions

Foundational context covering the market sizes, CAGR, scope, country, region and competition that inform every finding below. This section is provided to cover basics and most often pre-purchase conversations, answered from the MMA Primary Research Dataset.

What is the current size of the Alpha Olefin Market?

The market was valued at USD 13.60 billion in 2025, rising to an estimated USD 14.46 billion in 2026. East Asia holds the largest regional share at 30% of global value.

How large will the Alpha Olefin Market be by 2036?

MMA forecasts USD 26.63 billion by 2036 under the base case, an expansion multiple of 1.84 times the 2026 level. Incremental value creation across the period reaches USD 12.17 billion.

What is the CAGR for the Alpha Olefin Market 2026 to 2036?

The base case CAGR is 6.3%, with a bull case of 7.6% and a bear case of 5.0%. Historical growth between 2020 and 2025 ran at 5.1% amid substantial pricing volatility.

Which segment is growing fastest?

1-decene, at 9.2%, roughly 1.46 times the overall market rate. Synthetic lubricants, electric driveline fluids, and data centre immersion cooling all compete for a fraction nobody can make deliberately.

Who are the major companies in the Alpha Olefin Market?

Chevron Phillips Chemical, INEOS Oligomers, Shell Chemicals, SABIC, and Sasol lead, holding roughly 62% of capacity between them. Sinopec and PetroChina hold growing Chinese positions.

Which country is growing fastest?

India, at 8.9%, driven by polyethylene capacity additions pulling comonomer demand from a largely import-dependent base. Domestic alpha olefin production remains limited relative to that requirement.

Report Segmentation Architecture

The full report scope spans multiple orthogonal segmentation dimensions, with cross-tabulated demand data provided for each dimension pair. Coverage extends further to regional breakdowns, trend trajectories, and the competitive detail needed to support segment-level decision-making.

By Carbon Number

  • 1-Butene
  • 1-Hexene
  • 1-Octene
  • 1-Decene
  • 1-Dodecene
  • C14 and Heavier Fractions

By End-Use Industry

  • Polyethylene Comonomer Production
  • Synthetic Lubricants and Base Stocks
  • Detergent Alcohols and Surfactants
  • Oilfield and Drilling Chemicals
  • Plasticiser Alcohols and Specialties

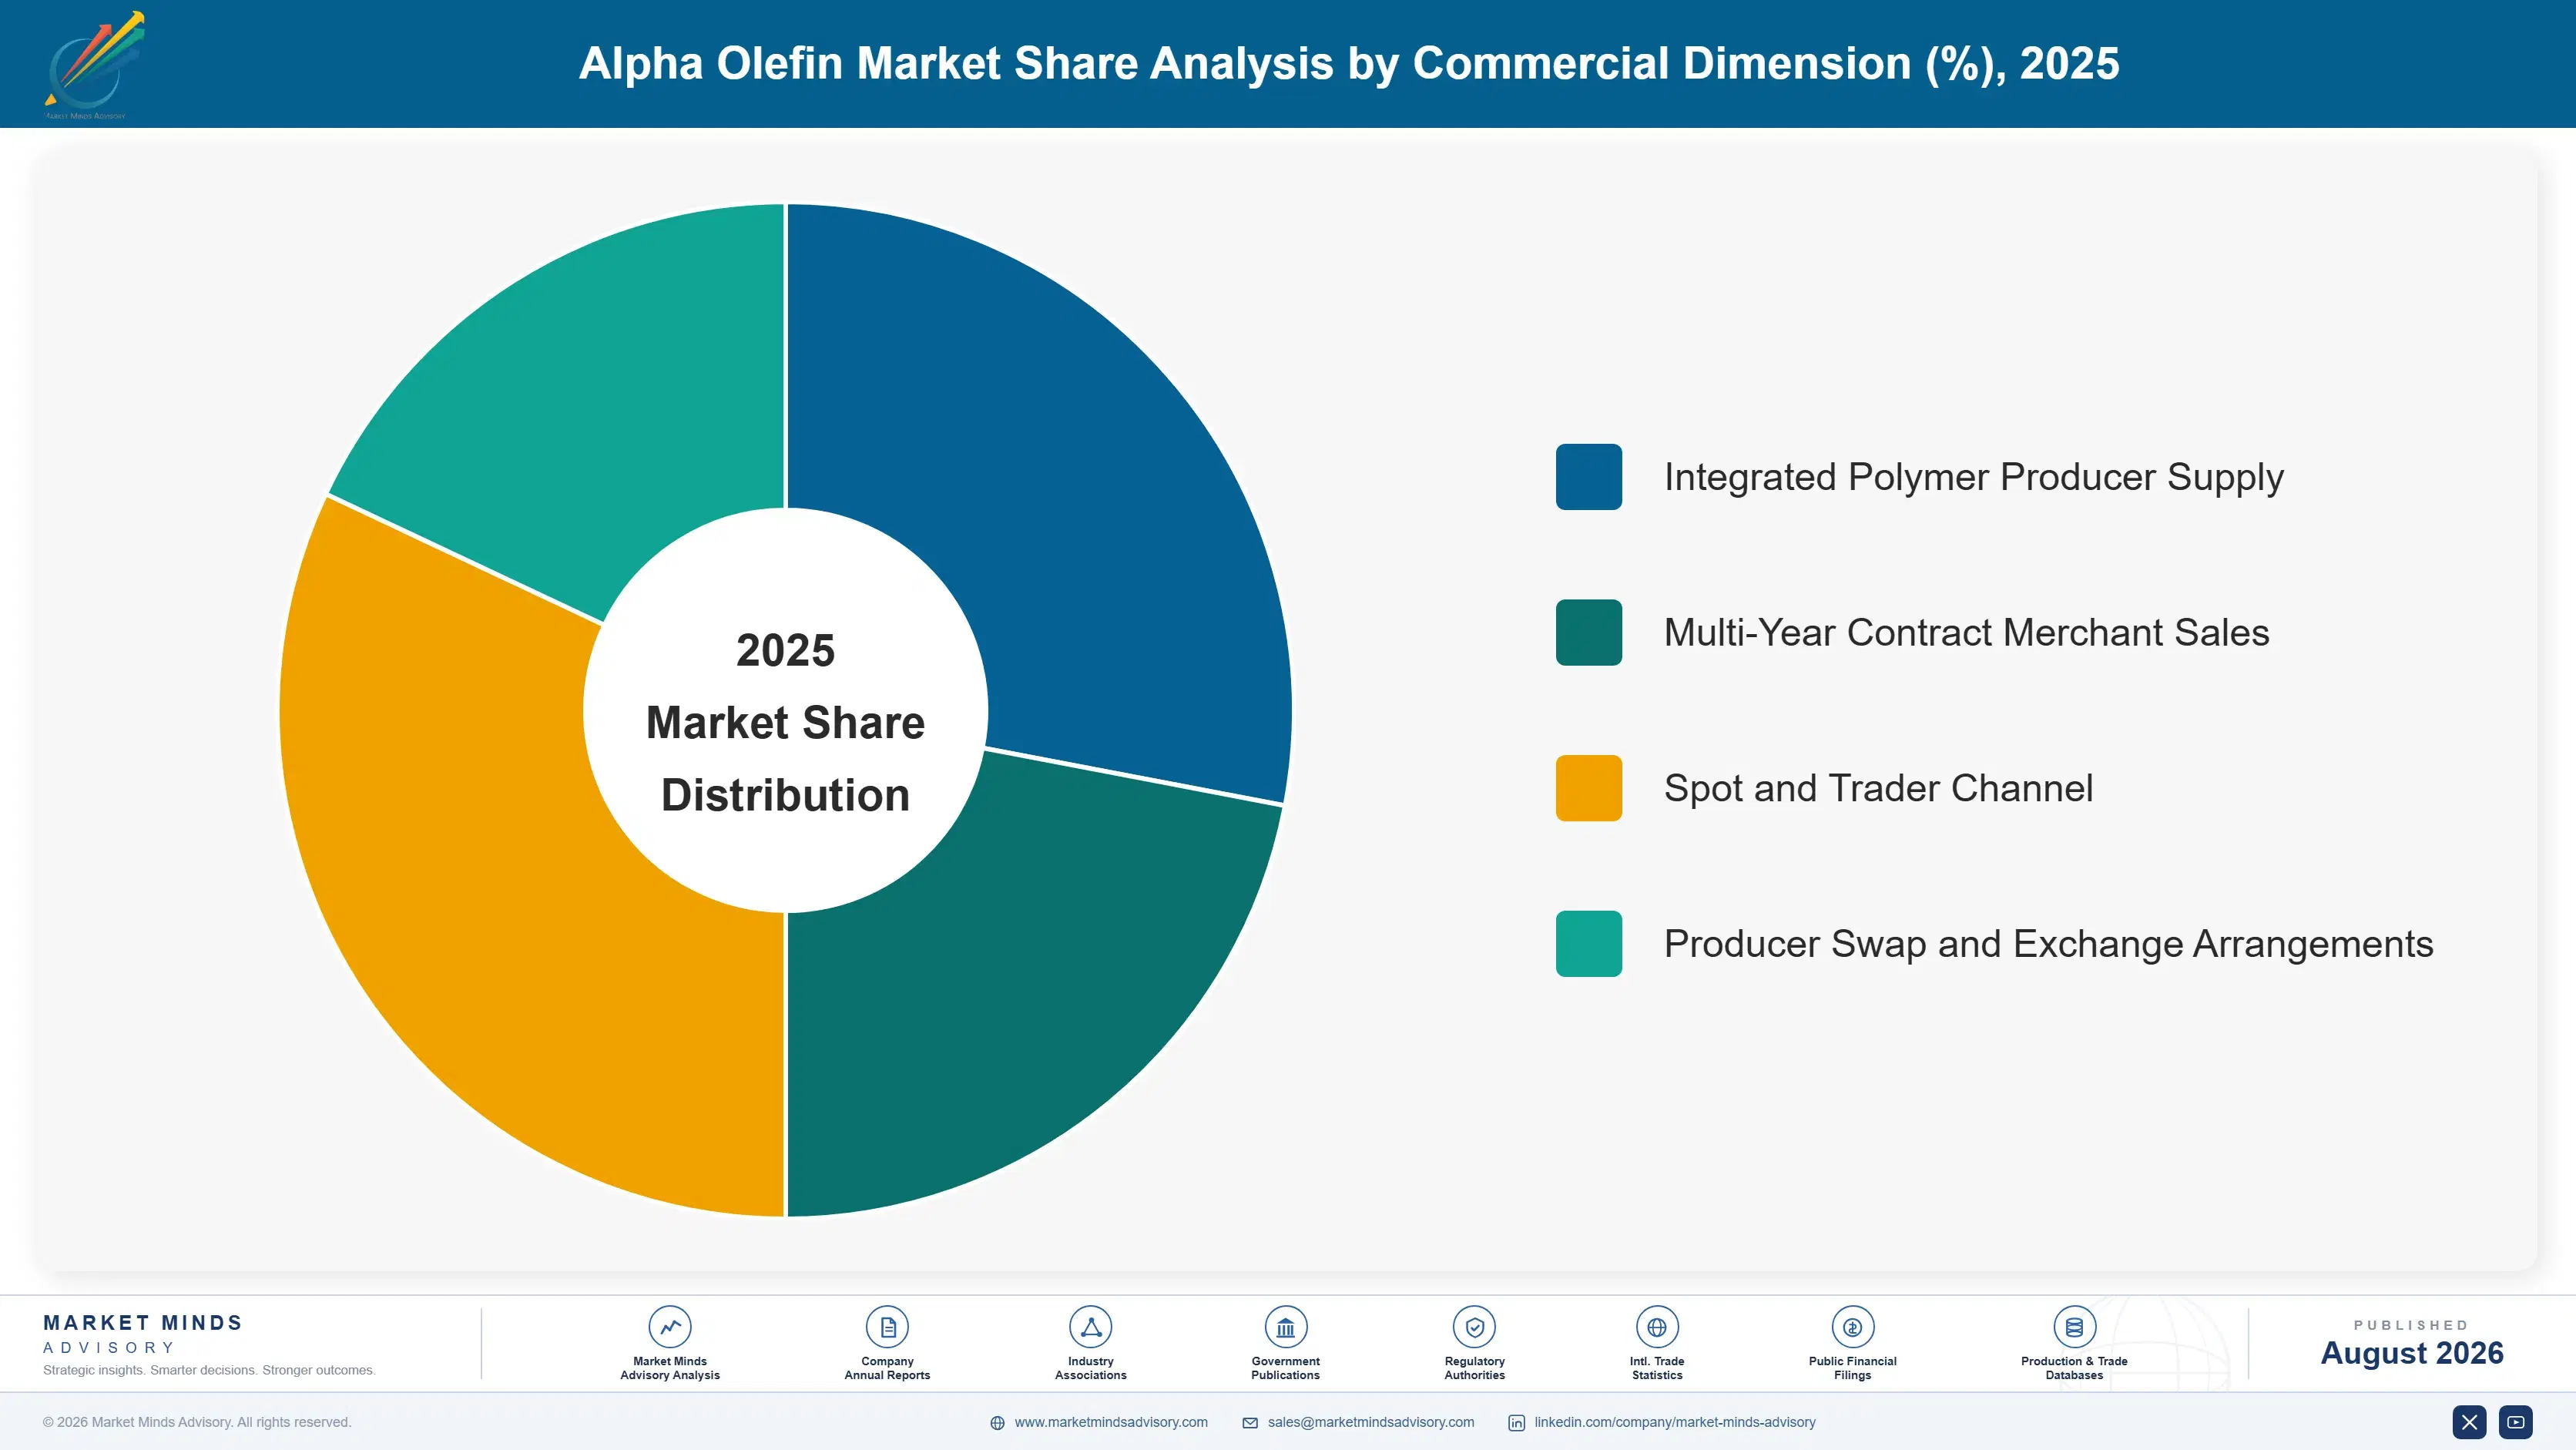
By Commercial Dimension

  • Integrated Polymer Producer Supply
  • Multi-Year Contract Merchant Sales
  • Spot and Trader Channel
  • Producer Swap and Exchange Arrangements

By Region

  • North America
  • Western Europe
  • East Asia
  • South Asia and Pacific
  • Latin America
  • Middle East and Africa
  • Eastern Europe

Scope, Methodology, and Coverage

Every figure in this report is reproducible from documented input assumptions. The scope below maps the historical period, the forecast horizon, the segmentation dimensions, and the countries covered, alongside the underlying primary and qualitative methodology.
Historical Period
2020 to 2025
Forecast Period
2026 to 2036
Base Year
2025 (USD billions; MMA Primary Research Dataset, August 2026)
Market Definition
The market comprises linear alpha olefins produced by ethylene oligomerisation and by selective on-purpose routes including trimerisation, tetramerisation, and Fischer-Tropsch derivation, covering 1-butene, 1-hexene, 1-octene, 1-decene, 1-dodecene, and C14 and heavier fractions. Value is measured at producer level on a contained alpha olefin basis. Internal and branched olefins, ethylene and propylene, downstream derivatives including polyalphaolefins and detergent alcohols, and olefins recovered from refinery streams without deliberate oligomerisation fall outside scope.
Quantitative Units
USD billions (current prices); thousand tonnes of contained alpha olefin; USD per tonne average selling price
Segmentation Dimensions
By Carbon Number; By End-Use Industry; By Commercial Dimension; By Region
Regions Covered
North America, Western Europe, East Asia, South Asia and Pacific, Latin America, Middle East and Africa, Eastern Europe
Countries Covered
USA, China, Germany, France, UK, Japan, South Korea, India, Australia, Canada, Brazil, Mexico, Indonesia, Vietnam, Thailand, Malaysia, UAE, Saudi Arabia, South Africa, Nigeria, Turkey, Poland, Netherlands, Italy, Spain, Sweden, Switzerland, Argentina, Colombia, Singapore, and additional markets relevant to this sector
Key Companies Profiled
Chevron Phillips Chemical, INEOS Oligomers, Shell Chemicals, SABIC, Sasol, ExxonMobil Chemical, Dow, Qatar Chemical Company, Idemitsu Kosan, Mitsui Chemicals, Sinopec, PetroChina, Zhejiang Satellite Petrochemical, Linde, Axens, Evonik Industries, Nizhnekamskneftekhim, Formosa Plastics, Hanwha TotalEnergies, LG Chem
Quantitative Methodology
Primary survey, n=3,800 respondents, Q4 2025, six countries; demand-side model with trade association cross-validation
Qualitative Methodology
47 expert interviews, Q4 2025; applied to validate demand model assumptions, identify emerging dynamics, and assess competitive positioning
Report Format
PDF and XLSX data workbook (Word format preview document)
Publisher
Market Minds Advisory
Report Code
MMA-2026-CHM-152
Published
August 2026
Contact
sales@marketmindsadvisory.com | www.marketmindsadvisory.com

Purchase the full Alpha Olefin Market Report (2026 to 2036).

The full report sizes alpha olefin demand across six carbon number fractions and seven regions with 2026 to 2036 forecasts under base, bull, and bear cases. It models whole-slate economics for full-range producers, quantifying how much scarcity value in tight fractions is consumed by co-product placement losses. Competitive profiles cover twenty producers assessed consistently on contained capacity, selective technology access, and feedstock position. Cost analysis compares ethane, naphtha, and coal-based ethylene positions by region. Commercial guidance addresses selective capacity investment, co-product integration, allocation discipline, and feedstock siting decisions.
Six carbon number fractions sized and forecast separately
Whole-slate economics modelled for full-range producers
Twenty producer profiles on consistent capacity basis
Ethylene cost positions compared across feedstock routes
On-purpose capacity tracked by technology and location
Decene scarcity modelled against emerging cooling demand

Built For The People Who Decide

From boardroom strategy to bench-side execution, this report is read cover-to-cover by leaders shaping the next decade of their industry, turning demand scenarios, market dynamics and valuation benchmarks into decisions.
CXOs/ Presidents/ VPs/ Managers
M&A and Corporate Development
Strategy Teams and R&D Heads
Procurement and Product Directors
Regulatory and Compliance Leaders
Investor Relations and Equity Analysts