Market Minds Advisory
Allergy Diagnostics Market

Allergy Diagnostics Market: Sensitisation is Not Allergy, and the Panel Cannot Tell

Around 40% of adults carry measurable antibody to something they eat without incident. Broad panels find all of it, which is why specialists spend so much time undoing results somebody else ordered.

Lead Analyst

Alice Ballenger

Published

September 2026

Make Smarter Decisions with Customized Research Insights

Request a free sample report and evaluate market opportunities, growth trends, and competitive dynamics relevant to your business needs.

2025 MARKET VALUE$5.4BMarket Size 2025
2036 FORECAST VALUE$12.8BBase Case , 2026 to 2036
CAGR 2026 TO 20368.2 %Bull 9.4% / Bear 7.0%
INCREMENTAL OPPORTUNITY$7.0BNet 10- year value creation
EXPANSION MULTIPLE2.20x2036 value over 2026 base
Strategic Levers
M&A Pipeline
Regional Outlook
Country Rankings
Competitive Intelligence
Segmental Deep-dive
Call-Us : 91 93563 13602

Executive Snapshot and Market Trajectory

A positive allergy test does not mean the patient is allergic. Roughly 40% of adults carry measurable antibody to foods they eat without any reaction at all, and about 30% of positive results fail a supervised food challenge. That gap defines this market. It reaches USD 5.4 billion in 2025.
Component-resolved diagnostics grow fastest at 12.3%, exactly 1.50 times the market rate, because testing the specific protein rather than the whole extract separates genuine anaphylaxis risk from harmless pollen cross-reactivity entirely. East Asia holds 27% of value on Japanese cedar pollen prevalence and on Chinese urban testing expansion together. South Asia and Pacific takes 12% of value and grows faster than anywhere else in this forecast.
Concentration is high at 66% across the top five, and one platform holds most of the specific antibody testing installed base worldwide. Competition turns on allergen library breadth rather than on instrument performance, since a laboratory picks whichever analyser is able to measure what its own clinicians actually order. Reimbursement has historically rewarded breadth of panel, which is precisely what generates the false positives that everybody then complains about afterwards.
Market Definition
The allergy diagnostics market covers in-vitro and in-vivo tests identifying allergic sensitisation and its clinical relevance, spanning component-resolved molecular diagnostics, multiplex allergen arrays, singleplex specific antibody assays, skin prick and intradermal testing, and patch and cellular activation testing, together with the analysers, reagents, and allergen extracts supplied for them. Allergen immunotherapy products, adrenaline autoinjectors, antihistamines and other treatments, general immunology analysers, and food intolerance tests without an immunological basis are excluded.
Base Year Value
$5.4B in 2025 (MMA Primary Research Dataset, August 2026)
Forecast Period
2026 to 2036, eleven discrete annual values
CAGR
8.2% base case. Bull 9.4%. Bear 7.0%.
Fastest Growth Segment
Component-Resolved Molecular Diagnostics: 12.3% CAGR
Fastest Growth Country
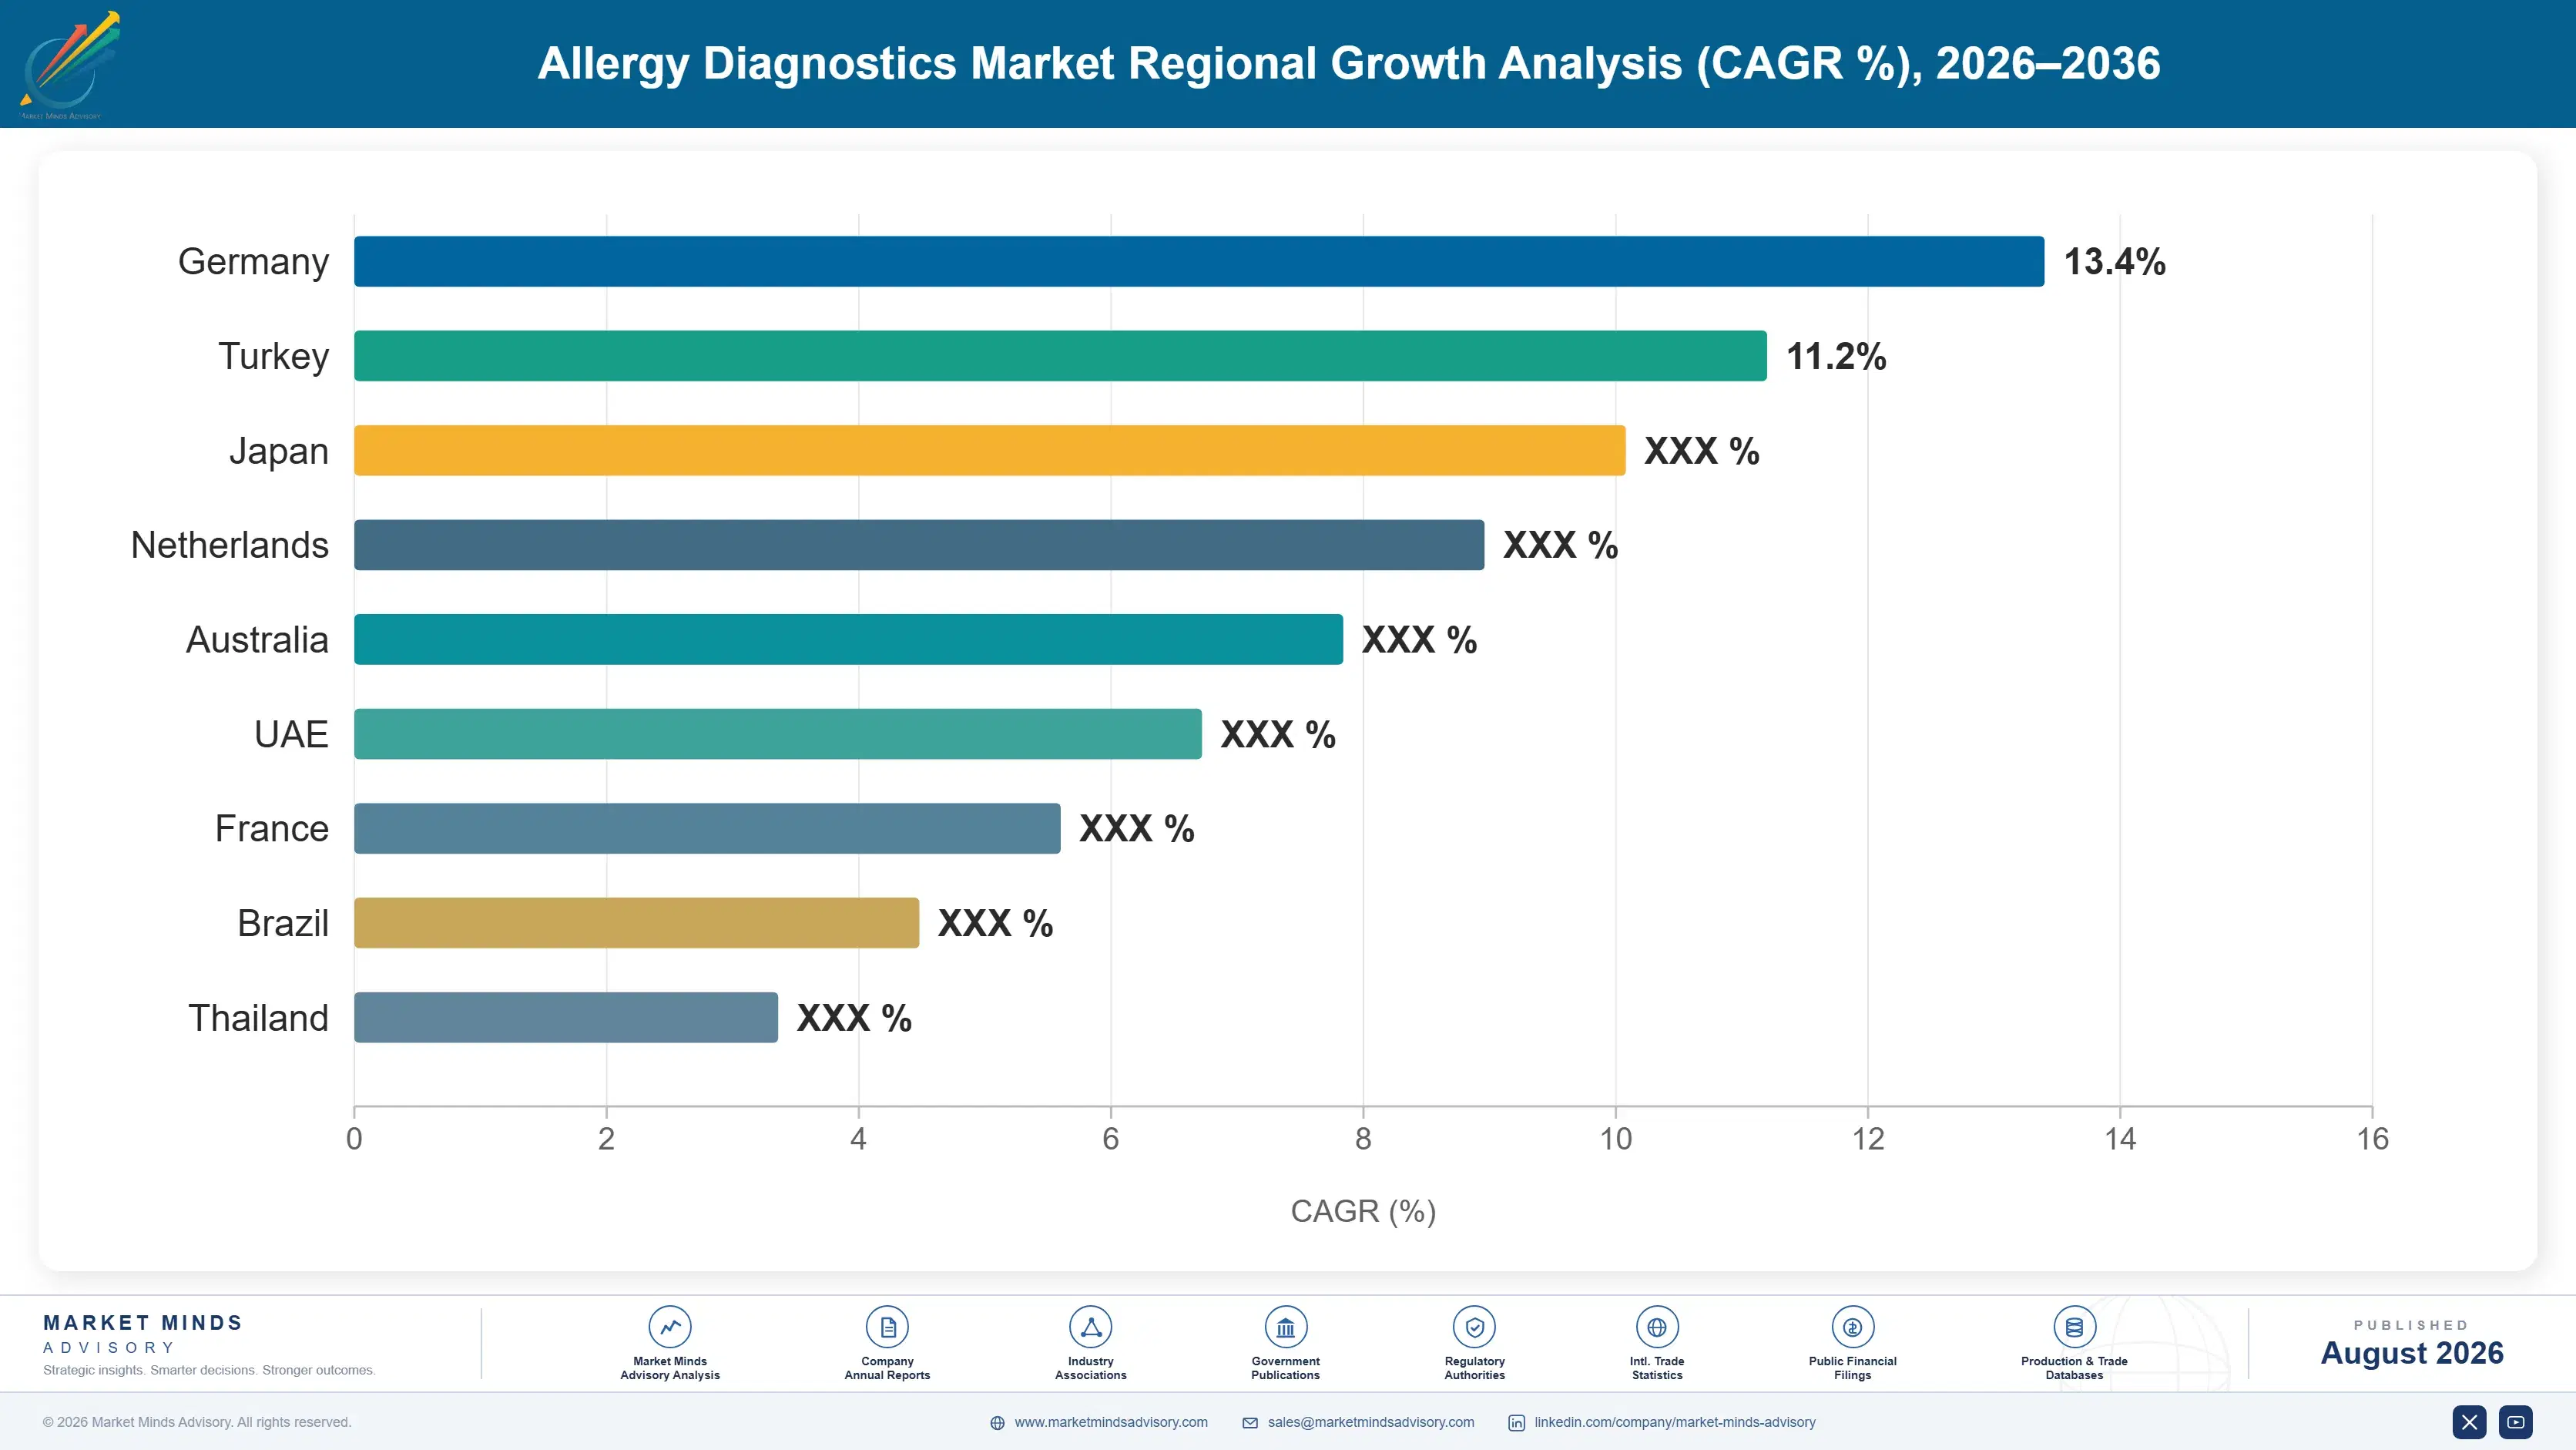
India: 12.2% CAGR
Fastest Growth Region
South Asia and Pacific: 10.4% CAGR
Largest Region
East Asia: 27% of 2025 global value
Market Leaders
Thermo Fisher Scientific, Siemens Healthineers, Revvity, Hycor Biomedical, Stallergenes Greer. Source: MMA Primary Research Dataset, July 2026.
Primary Survey
n=3,800 procurement and R&D decision-makers, Q4 2025, six countries
Methodology
Demand-side build-up, cross-validated against public data, 47 expert interviews

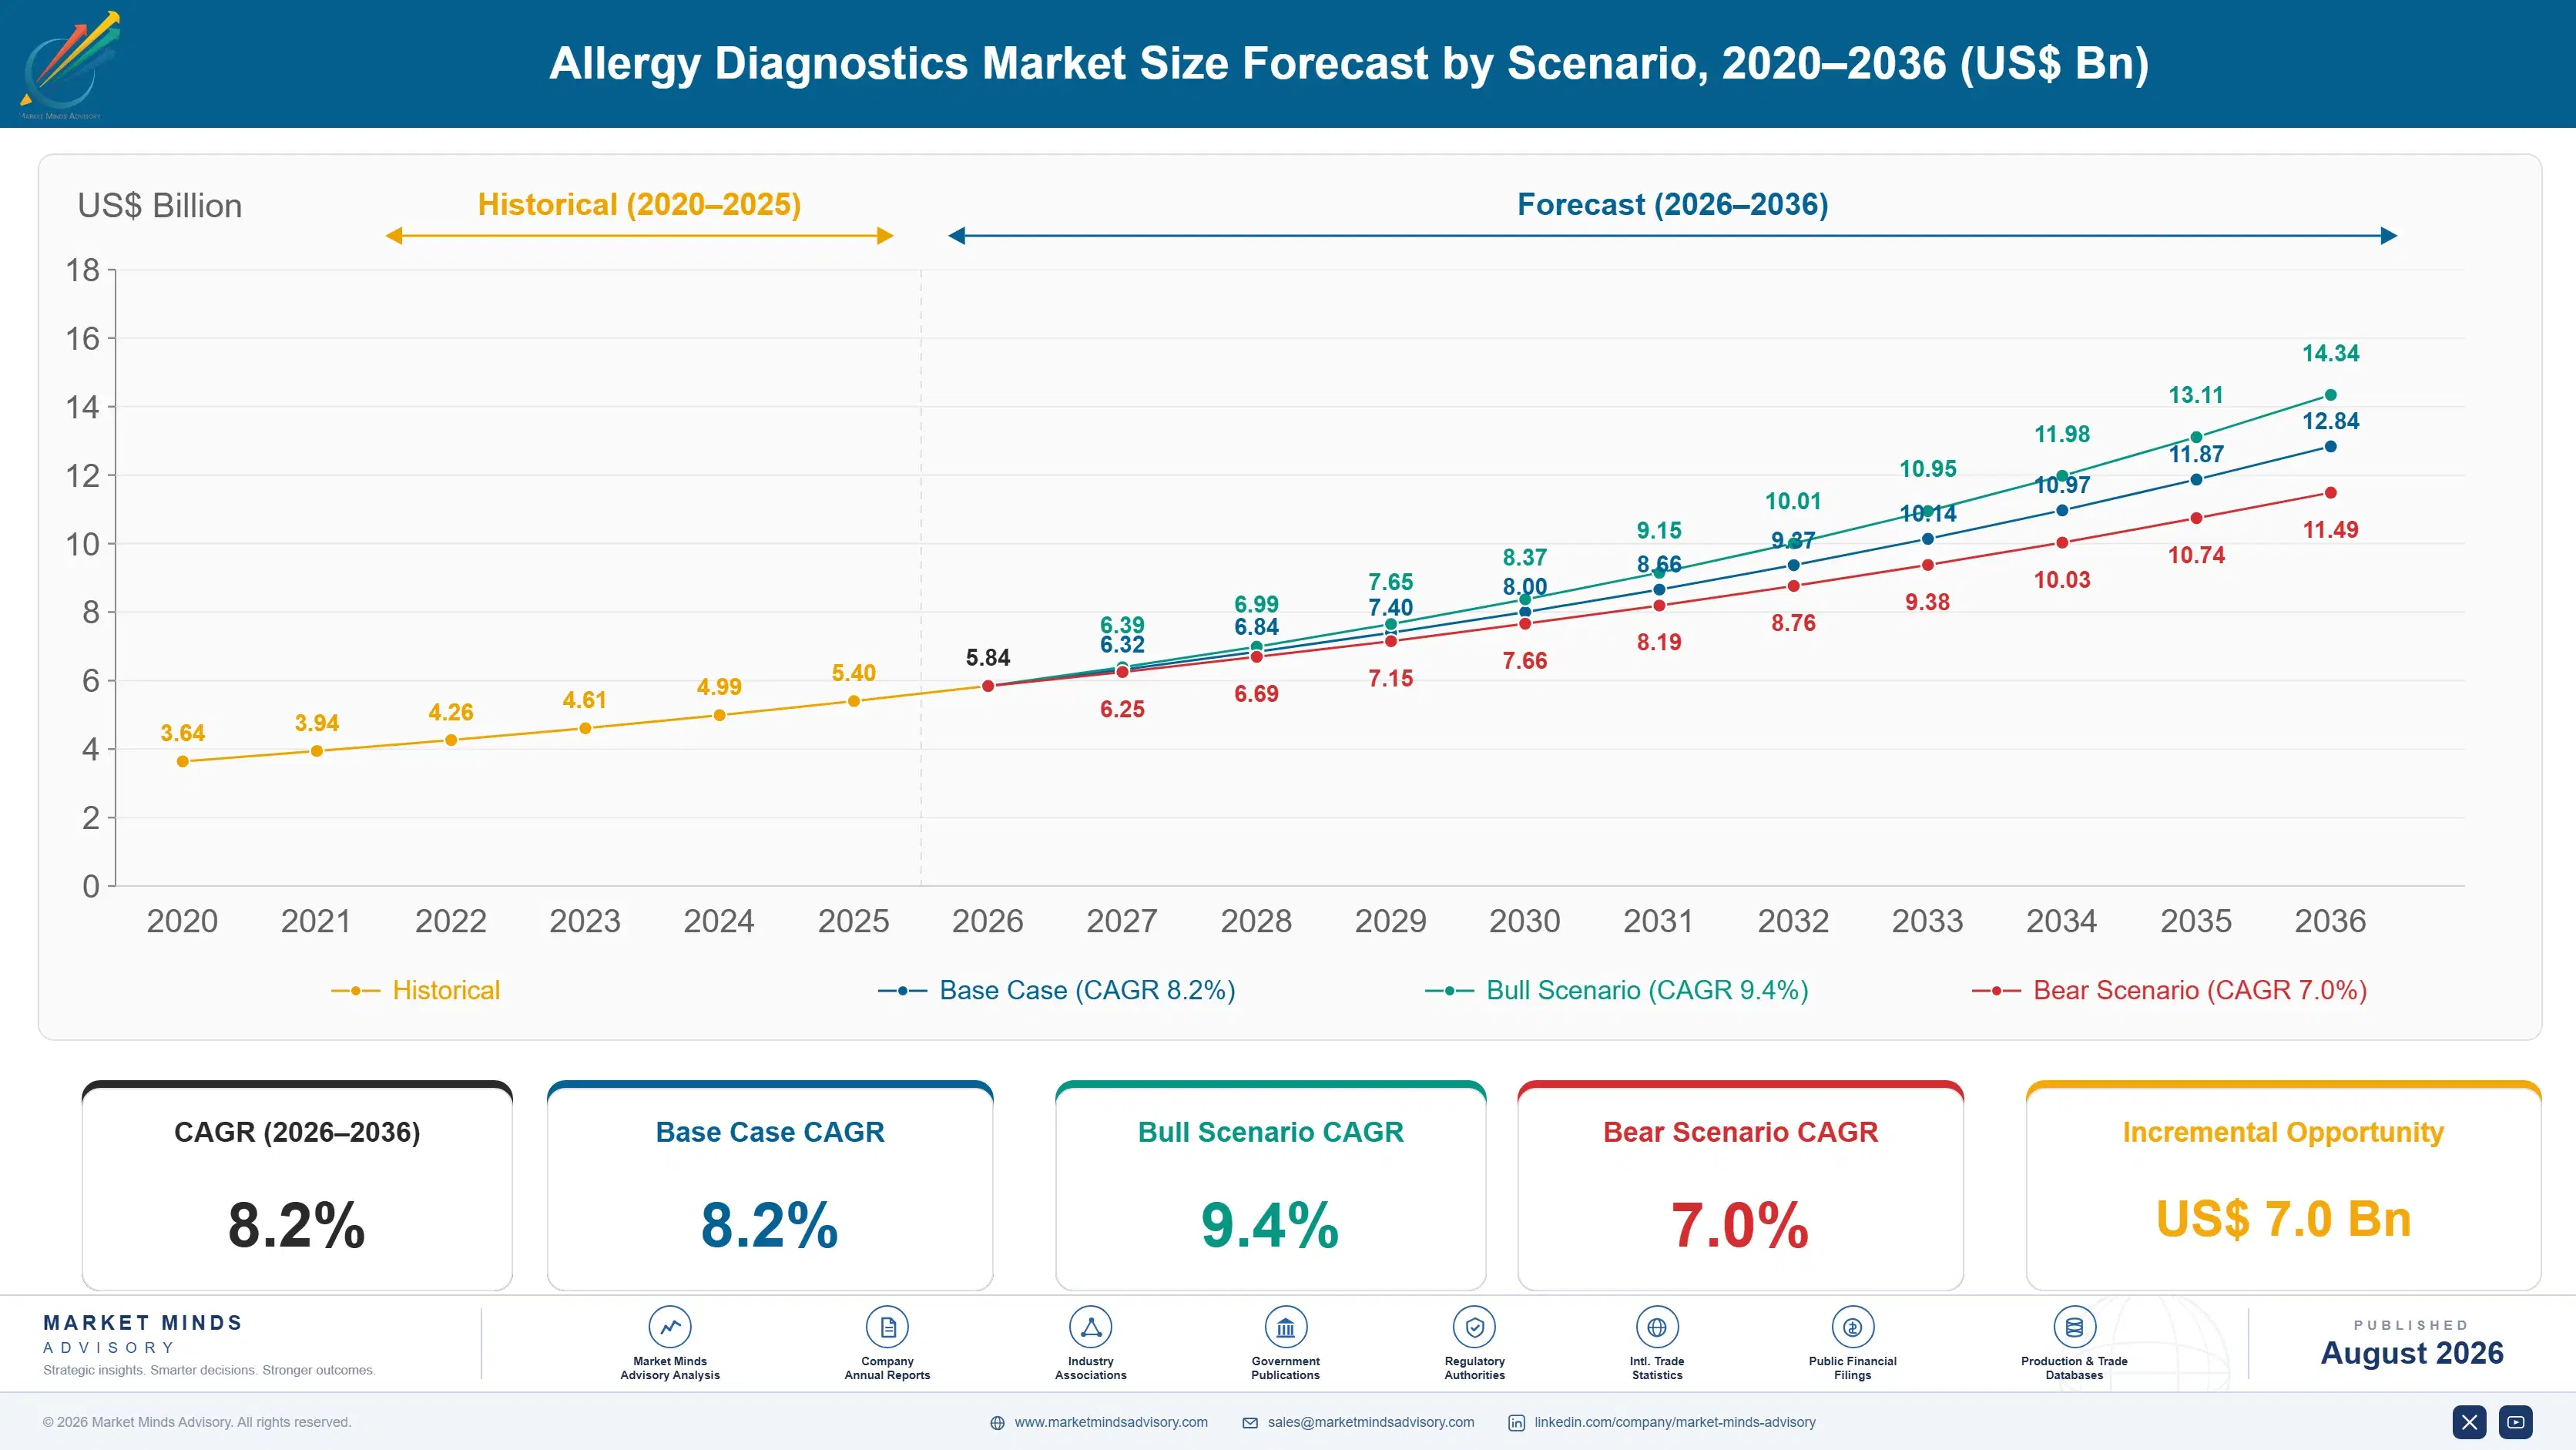
Allergy Diagnostics Market Forecast Scenarios

allergy-diagnostics-market-size-forecast-scenario-1787297645334
Between 2020 and 2025 testing volumes recovered and the questions being asked of them changed. Elective testing collapsed through 2020 and rebounded from 2021, while paediatric food allergy referrals rose steadily across every developed market. Component-resolved testing moved from specialist centres into routine laboratory menus during the same period. A 7.1% historical CAGR blends a volume recovery with a genuine shift in what clinicians ordered.
Three mechanisms carry the 8.2% base case. Rising allergy prevalence is the largest, with food allergy and allergic rhinitis both increasing across urbanising populations for reasons nobody has fully explained. Component-resolved adoption is the second, driven by clinicians who have grown tired of managing false positives generated by extract-based panels. And laboratory consolidation is the third, since larger laboratories run broader menus and order more allergens per patient. None of the three depends on a new assay technology.
The 9.4% bull case rests on oral immunotherapy expanding, which requires accurate component-level risk stratification before treatment and generates repeat testing during it. The 7.0% bear case is payer pushback on broad panel testing, which several health systems have already begun after auditing how many positive results led to no clinical change at all in patient management.

What A Positive Result Actually Means

The central difficulty in this field is that the test measures sensitisation and the clinician needs to know about allergy, and those are not the same thing. Around 40% of adults have measurable antibody to something, most of them eat it happily, and roughly 30% of positive results fail a supervised food challenge. The assay is working correctly. It is answering a slightly different question from the one asked.
TOP FIVE CONCENTRATION66%One platform holds most of the specific antibody testing base
ALLERGENS PER PANEL300Individual components measurable from a single patient blood sample
TEST COSTUSD 180Reimbursed price for a comprehensive component resolved workup
FALSE POSITIVE RATE30%Positive results showing no clinical reaction on supervised challenge
SENSITISATION RATE40%Adults showing measurable antibody response to common environmental allergens
INSTRUMENT INSTALLED BASE12,000Analysers placed in clinical laboratories worldwide for this testing
Extract-based testing makes that considerably worse. A whole peanut extract contains proteins that cause anaphylaxis and proteins that merely cross-react with birch pollen, and a positive result cannot distinguish between the two. The patient then avoids peanuts unnecessarily for years. Paediatric allergists spend a substantial share of clinic time undoing results ordered by somebody who meant well and had no way to interpret them.
Component-resolved diagnostics fix this by measuring the individual protein. Antibody to one peanut component predicts systemic reaction while antibody to another predicts nothing worse than an itchy mouth, and the distinction changes management immediately. That is why the segment grows at 12.3% while extract-based skin testing grows at less than half the market rate.
"We built an industry that is extremely good at finding antibody and much less good at telling anybody what to do about it. Component testing is the first thing in thirty years that genuinely narrows that gap."
Director, Diagnostics Practice · MMA Medical Devices Practice ·

Market Trends

Component Testing Separates Risk From Cross-Reactivity

Measuring antibody to individual allergen proteins rather than to whole extracts distinguishes patients at genuine risk of systemic reaction from those merely cross-sensitised through pollen exposure. In peanut allergy the difference between two components predicts anaphylaxis or an itchy mouth, and the management decision that follows is completely different. Clinicians who have spent years managing false positives from extract panels adopt this readily once a laboratory offers it. Component menus have widened rapidly, and the segment grows at 12.3% against a market at 8.2%. Extract testing cannot make that distinction at all.
Market Impact: Prevalence doubled in 20 years
Payers Have Started Auditing Broad Panel Ordering

Several health systems have examined how often a broad allergen panel changed clinical management and found the answer uncomfortable, since a panel ordered without a clinical history generates positives that lead nowhere. Reimbursement policies in some markets now restrict panel size, require a specialist request, or pay per allergen rather than per panel. That directly attacks the volume model this industry has run on, while favouring targeted component testing where each result carries a clear implication. Suppliers whose revenue depends on allergen count per sample face a genuine commercial question here. Ordering behaviour is what pays for this market.
Market Impact: Protocols require 6 monitoring tests

Market Opportunities and Growth Drivers

Food Allergy Prevalence Keeps Rising In Urban Populations

Paediatric food allergy has increased across developed and rapidly urbanising countries alike over three decades, and no single explanation accounts for it. Whatever the cause, the consequence is a growing population of children requiring diagnosis, risk stratification, and periodic retesting as tolerance develops or fails to. Each of those children generates repeat testing across childhood rather than a single episode. Urbanising Asian populations are showing the same trajectory that Western countries followed earlier, which is where most of the volume growth now comes from. Nobody expects the trajectory to flatten within this forecast.
Market Impact: 30% fail supervised challenge

Oral Immunotherapy Requires Accurate Risk Stratification

Desensitisation protocols for peanut and other foods are moving from specialist research centres into wider clinical practice, and they cannot be started safely without knowing which component a patient is sensitised to and at what level. Treatment then requires monitoring throughout, generating repeat testing rather than a single diagnostic episode. That converts allergy diagnostics from a one-off answer into a longitudinal measurement alongside therapy. It also pulls component-resolved testing into routine use, because extract-based results are not precise enough to dose against. A protocol validated on one assay is never rerun against another.
Market Impact: Skin tests cost 5 times less

Market Restraints and Challenges

Test Results Overstate Clinical Allergy Substantially

Roughly 30% of positive specific antibody results correspond to no reaction on supervised food challenge, which means broad testing produces unnecessary avoidance, anxiety, and dietary restriction at scale. The root cause is that sensitisation and clinical allergy are different biological states and the assay measures only the first. Commercially this invites payer scrutiny and clinical scepticism, both of which restrain volume growth. Participants are mitigating with component-resolved panels, quantitative thresholds validated against challenge outcomes, and interpretive reporting that tells the clinician what a result actually implies. Interpretation rather than measurement is the missing piece.
Market Impact: Components predict 90% of reactions

Skin Testing Remains Cheap And Deeply Entrenched

A skin prick test costs a fraction of a blood panel, gives a result during the consultation, and allergists have performed them for decades with results they trust. The root cause is habit reinforced by economics: the test is inexpensive, reimbursed, and performed in the clinic rather than sent away. Commercially this caps in-vitro penetration in exactly the specialist settings where component testing would add most value. Mitigation runs toward positioning blood testing where skin testing cannot go, in infants, in patients on antihistamines, and where extensive eczema prevents it.
Market Impact: Audits found 45% changed nothing
3 additional market trends, 2 additional growth drivers, and 4 additional restraints and challenges are covered in the full report. Contact sales@marketmindsadvisory.com to access the complete intelligence.

Segment CAGR and Growth Architecture

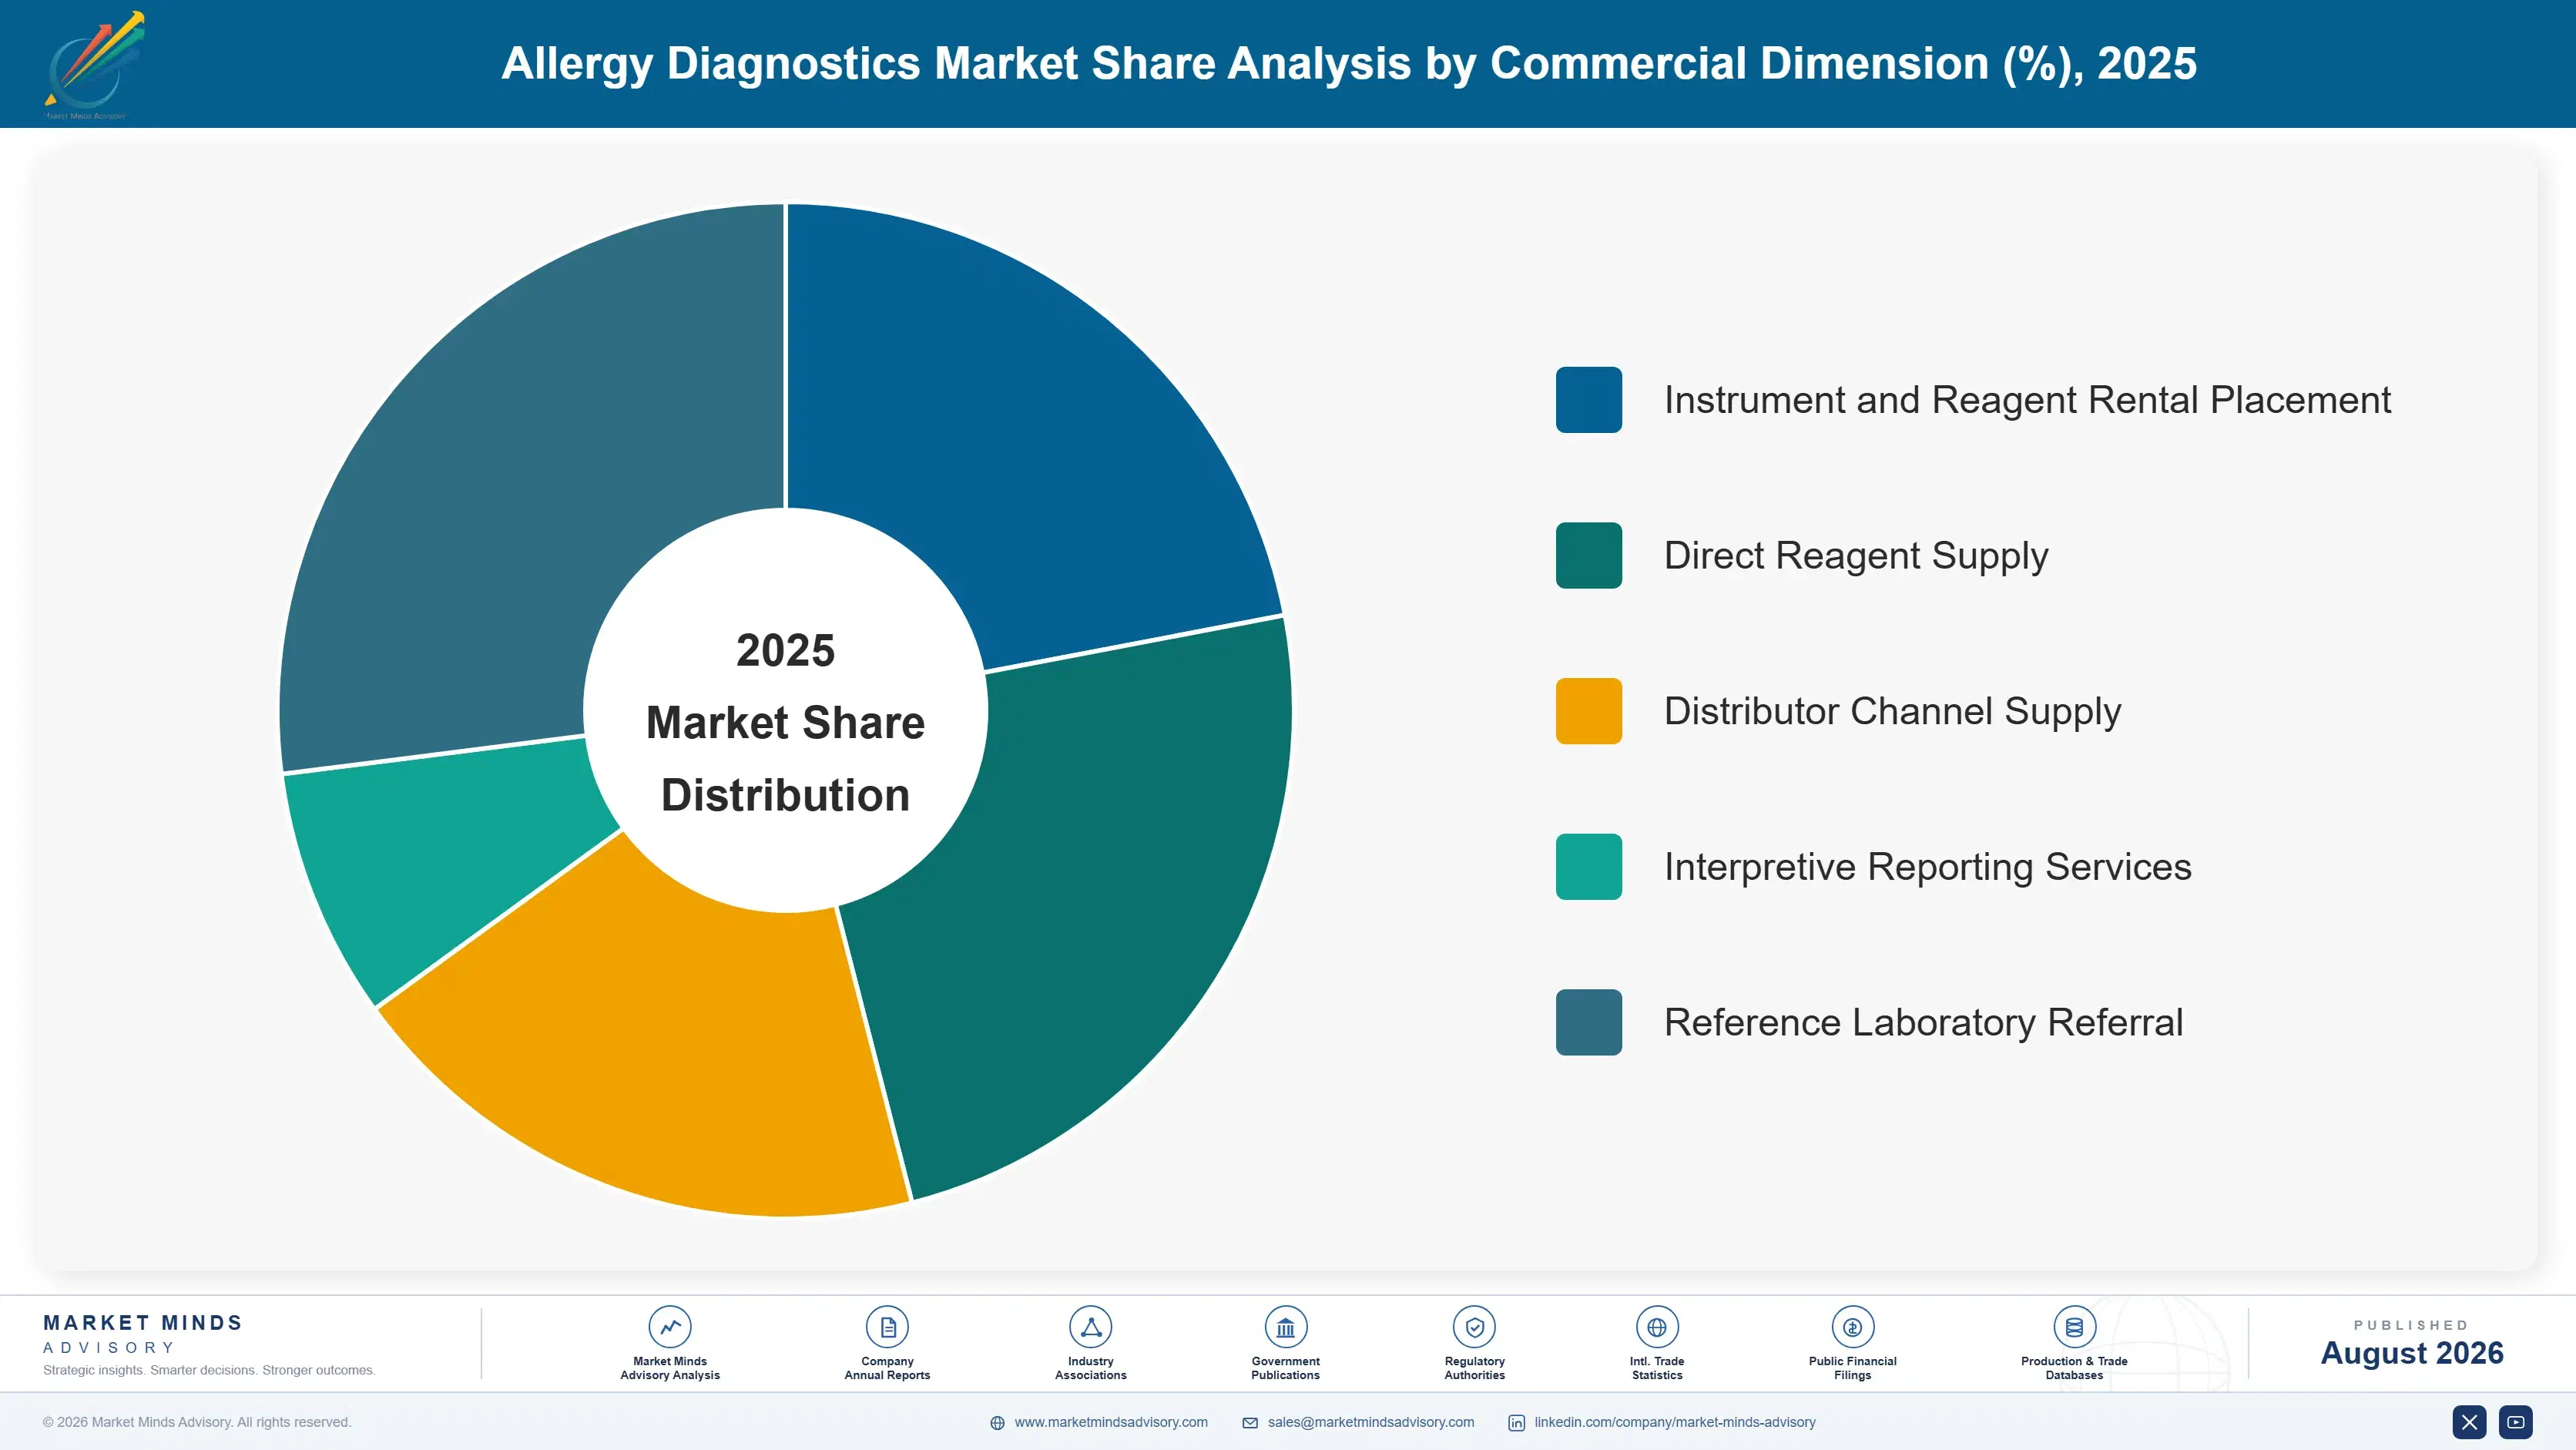
Segmentation follows test method, because how the measurement is actually made determines what the result can support clinically, where the test gets performed, who orders it, and how it is eventually reimbursed. Allergen type, patient age group, and care setting are handled in the framework and commentary rather than being treated as segments here.
allergy-diagnostics-market-market-share-analysis-1787297645871

Component-Resolved Molecular Diagnostics

Component-resolved testing grows fastest at 12.3%, exactly 1.50 times the market rate, and it grows because it answers the question clinicians actually have. Measuring antibody to an individual allergen protein rather than to a crude extract separates the patient at risk of systemic reaction from the one who is merely cross-sensitised through birch pollen. In peanut allergy two different components predict anaphylaxis and an itchy mouth respectively, and the management that follows differs completely. Adoption accelerated once laboratories added components to routine menus rather than sending them to reference centres. Oral immunotherapy protocols cannot be dosed safely without this level of resolution. Nothing else in this market has changed clinical practice as directly.
CAGR 12.3%

Multiplex Allergen Array Testing

Multiplex arrays grow at 10.6%, measuring several hundred allergens and components from a single small sample, which matters enormously in paediatrics where drawing blood repeatedly is not an option. The technology suits complex polysensitised patients and unexplained anaphylaxis, where a targeted request would need a hypothesis nobody has. That same breadth is the commercial vulnerability: payers auditing broad panels find results that changed nothing, and several have restricted reimbursement accordingly. The segment therefore grows on genuine clinical need in complex cases while facing pressure wherever it is used as a fishing expedition. Paediatric laboratories choose it on sample volume alone, whatever the reimbursement position happens to be. Nothing else works in an infant.
CAGR 10.6%
Full segment breakdown across 5 segments available in the complete report.

Regional Architecture and Country Demand Map

Regional shares here follow testing infrastructure and reimbursement rather than allergy prevalence itself, which happens to be rising almost everywhere in the world. A population can be heavily sensitised and still generate very little diagnostic revenue if nobody is willing to pay for the workup.

East Asia

East Asia takes 27% of value, at the ceiling of the band this framework applies, and two distinct dynamics sit inside it. Japanese cedar pollen allergy affects an extraordinary share of the population, testing is routine, and reimbursement supports it comprehensively, which makes Japan one of the highest per-capita allergy testing markets anywhere. Chinese urban allergy testing has expanded very quickly as prevalence rises and tertiary hospital laboratories add specific antibody menus. Korean and Taiwanese provision is comprehensive on smaller populations. Growth at 9.2% exceeds the global rate on Chinese volume expansion rather than on Japanese demand, which is already near saturation. Regional allergen coverage remains a genuine gap for global suppliers here.
Share: 27% | CAGR: 9.2% (2026 to 2036)

South Asia and Pacific

Fastest growth sits in South Asia and Pacific at 10.4%, on 12% of global value. Indian urban allergy prevalence has climbed steeply with air quality and dietary change, while diagnostic testing penetration remains a fraction of developed market levels, which is precisely the gap driving growth. Private diagnostic chains have added allergy menus aggressively because the tests are profitable and demand is self-referred. Australian food allergy prevalence is among the highest measured anywhere and provision is well funded. Southeast Asian testing is expanding from a low base as tertiary laboratory capability spreads. Penetration rather than prevalence is what drives the rate. Almost none of this demand is publicly funded. Self-referral drives most of it.
Share: 12% | CAGR: 10.4% (2026 to 2036)
Regional intelligence for 5 additional markets available in the complete report: Western Europe, North America, Latin America, Middle East and Africa, Eastern Europe. Contact sales@marketmindsadvisory.com.
allergy-diagnostics-market-country-cagr-analysis-1787297646395

Where Allergy Diagnostics Margin Actually Sits

The analyser is not the product and has not been for years. Value sits in the allergen library a laboratory can order from, in interpretation that tells a clinician what a result means rather than what it measures, and in becoming the monitoring assay attached to a therapy rather than a single diagnostic episode.

Widen The Allergen Library Beyond Western Panels

Laboratories choose the platform that can measure what their clinicians order, and clinicians order what their local population reacts to. Gulf dust and date palm, Japanese cedar, Indian pollens, and Latin American cockroach species are all under-served by menus built for European and North American practice. Adding regionally relevant allergens costs development and validation per allergen and wins entire laboratory accounts worth USD 200,000 to USD 700,000 annually, because a laboratory will not run two platforms. Validation cost per allergen looks unattractive alone and reasonable measured against a whole account.
Market Impact: Accounts worth 200,000 to 700,000 dollars each year

Sell Interpretation Rather Than Measured Values

A component result means nothing to a general practitioner who ordered a panel without a hypothesis, and a number on a report is where the clinical value stops. Interpretive reporting that states reaction probability against validated challenge thresholds converts a measurement into a decision, and health systems pay 20% to 30% more for a result that reduces unnecessary referral. It also answers the payer audit directly, because a report that changes management is exactly what the audit was looking for. A number on a report is where clinical value currently stops. Very few suppliers have crossed that line.
Market Impact: Interpretation earns 20 to 30 percent more revenue

Attach Testing To Immunotherapy Monitoring Protocols

A single diagnostic episode generates one test, while an oral immunotherapy protocol generates six or more across the treatment course plus periodic follow-up for years afterwards. Working with immunotherapy providers to embed component measurement into dosing and monitoring protocols converts diagnosis into a longitudinal revenue stream worth 6 to 10 times a single workup. It also locks the platform, since a protocol validated against one assay is never casually rerun against another one. Very few diagnostics suppliers have approached therapy providers on these terms at all. Therapy providers are a channel almost nobody in diagnostics calls on.
Market Impact: Protocols generate 6 separate tests for each patient

Who Controls the Margin Pool

Concentration reaches 66% across the top five measured on allergy diagnostics revenue, and one platform accounts for most of the specific antibody installed base worldwide. Thermo Fisher Scientific holds that position through Phadia and an allergen library nobody else has matched, with Siemens Healthineers the principal alternative on automated immunoassay. Revvity, Hycor, and Stallergenes Greer hold distinct positions in arrays, reagents, and extracts respectively.
Competition currently turns on allergen and component menu breadth rather than on analytical performance, because a laboratory will not run two platforms and therefore picks the one covering everything its clinicians request. Turnaround time and how the automation fits into an existing laboratory workflow matter next after that. Analytical sensitivity differences between the major platforms very rarely decide anything at all.

Pressure is coming from multiplex array specialists offering hundreds of components from a single sample at a price point that automated singleplex cannot reach, and from payers restricting exactly the broad panel testing array economics depend on. Rankings will shift wherever reimbursement moves from panel-based to allergen-based payment, because that one change revalues every single competitor's menu strategy at once.
allergy-diagnostics-market-company-positioning-matrix-1787297646933

Competitive Moat and Risk Dimensions

THERMO FISHER SCIENTIFIC

Moat: Allergen library and clinical evidence

The Phadia platform carries an allergen and component library that decades of development and validation built, and the published evidence linking its quantitative results to challenge outcomes underpins most allergy guidelines. A laboratory switching would lose allergens its clinicians request and thresholds those clinicians have learned to interpret, which is a far higher barrier than any instrument specification.
THERMO FISHER SCIENTIFIC

Risk: Panel reimbursement under scrutiny

Revenue scales with allergens measured per patient, which is exactly the ordering behaviour payers have begun auditing after finding that broad panels frequently changed no clinical management at all. A shift toward targeted allergen-based reimbursement would reward precision over breadth and reduce the value of the library advantage that currently protects the position.
SIEMENS HEALTHINEERS

Moat: Integrated laboratory automation footprint

Siemens places allergy testing on immunoassay analysers that laboratories already run for endocrinology, cardiac markers, and infectious disease, which removes the need for a dedicated instrument and its bench space. For a consolidated laboratory measuring cost per reportable result across a whole menu, that consolidation argument reaches operations management rather than the allergy clinician.
SIEMENS HEALTHINEERS

Risk: Narrower component menu depth

The allergen and component menu is materially narrower than the market leader's, and clinicians requesting a component that is unavailable will send the sample elsewhere regardless of how convenient the analyser is. As component-resolved testing becomes routine rather than specialist, menu gaps convert directly into lost samples and undermine the consolidation argument.

Players Tracked

Prominent Players

Thermo Fisher Scientific
Siemens Healthineers
Revvity
Hycor Biomedical
Stallergenes Greer

Other Key Players

ALK-Abello
HAL Allergy
Macro Array Diagnostics
Omega Diagnostics
Minaris Medical
Lincoln Diagnostics
Bio-Rad Laboratories
R-Biopharm
Dr. Fooke Laboratorien
Mediwiss Analytic
AESKU Group
Zeus Scientific
Vitro SA
Hangzhou Zheda Dixun
Shenzhen YHLO Biotech

Recent Developments

FEBRUARY 2025

Health system restricted broad allergy panels to specialist request

A national health system restricted reimbursement for broad allergen panels to specialist requests only, following an audit showing a large share of primary care panels produced positive results that changed no clinical management at all. Targeted component testing remained fully reimbursed under the revised policy.
Signal: Payers are now attacking exactly the ordering behaviour that panel-based revenue models have quietly depended upon.
AUGUST 2024

Supplier extended component menu for regional allergen profiles

A diagnostics supplier extended its component menu with allergens relevant to Gulf and South Asian sensitisation patterns, addressing gaps in libraries originally built around European and North American clinical practice. Regional laboratories had been sending samples abroad for the allergens their own populations react to most.
Signal: Menu gaps in regional allergens become lost accounts, because laboratories will not run two separate platforms.
NOVEMBER 2024

Immunotherapy provider embedded component testing into dosing protocol

An oral immunotherapy provider embedded component-resolved measurement into its own dosing and monitoring protocol, requiring baseline stratification and then repeated measurement right across the entire treatment course itself. The protocol validated against one assay platform, which effectively fixed the supplier for every single patient enrolled.
Signal: Embedding a test inside a treatment protocol converts one diagnostic episode into a long monitoring stream.

Allergen Sourcing, Antibodies, And Validation

Purified and recombinant allergen proteins carry roughly 30% to 38% of cost of goods, sourced from natural extracts that vary batch to batch or produced recombinantly at considerably higher cost and far better consistency. Detection antibodies, conjugates, and solid phase materials add 20% to 26%. Assay validation, lot release testing, and the regulatory documentation each allergen requires account for most of the remainder.
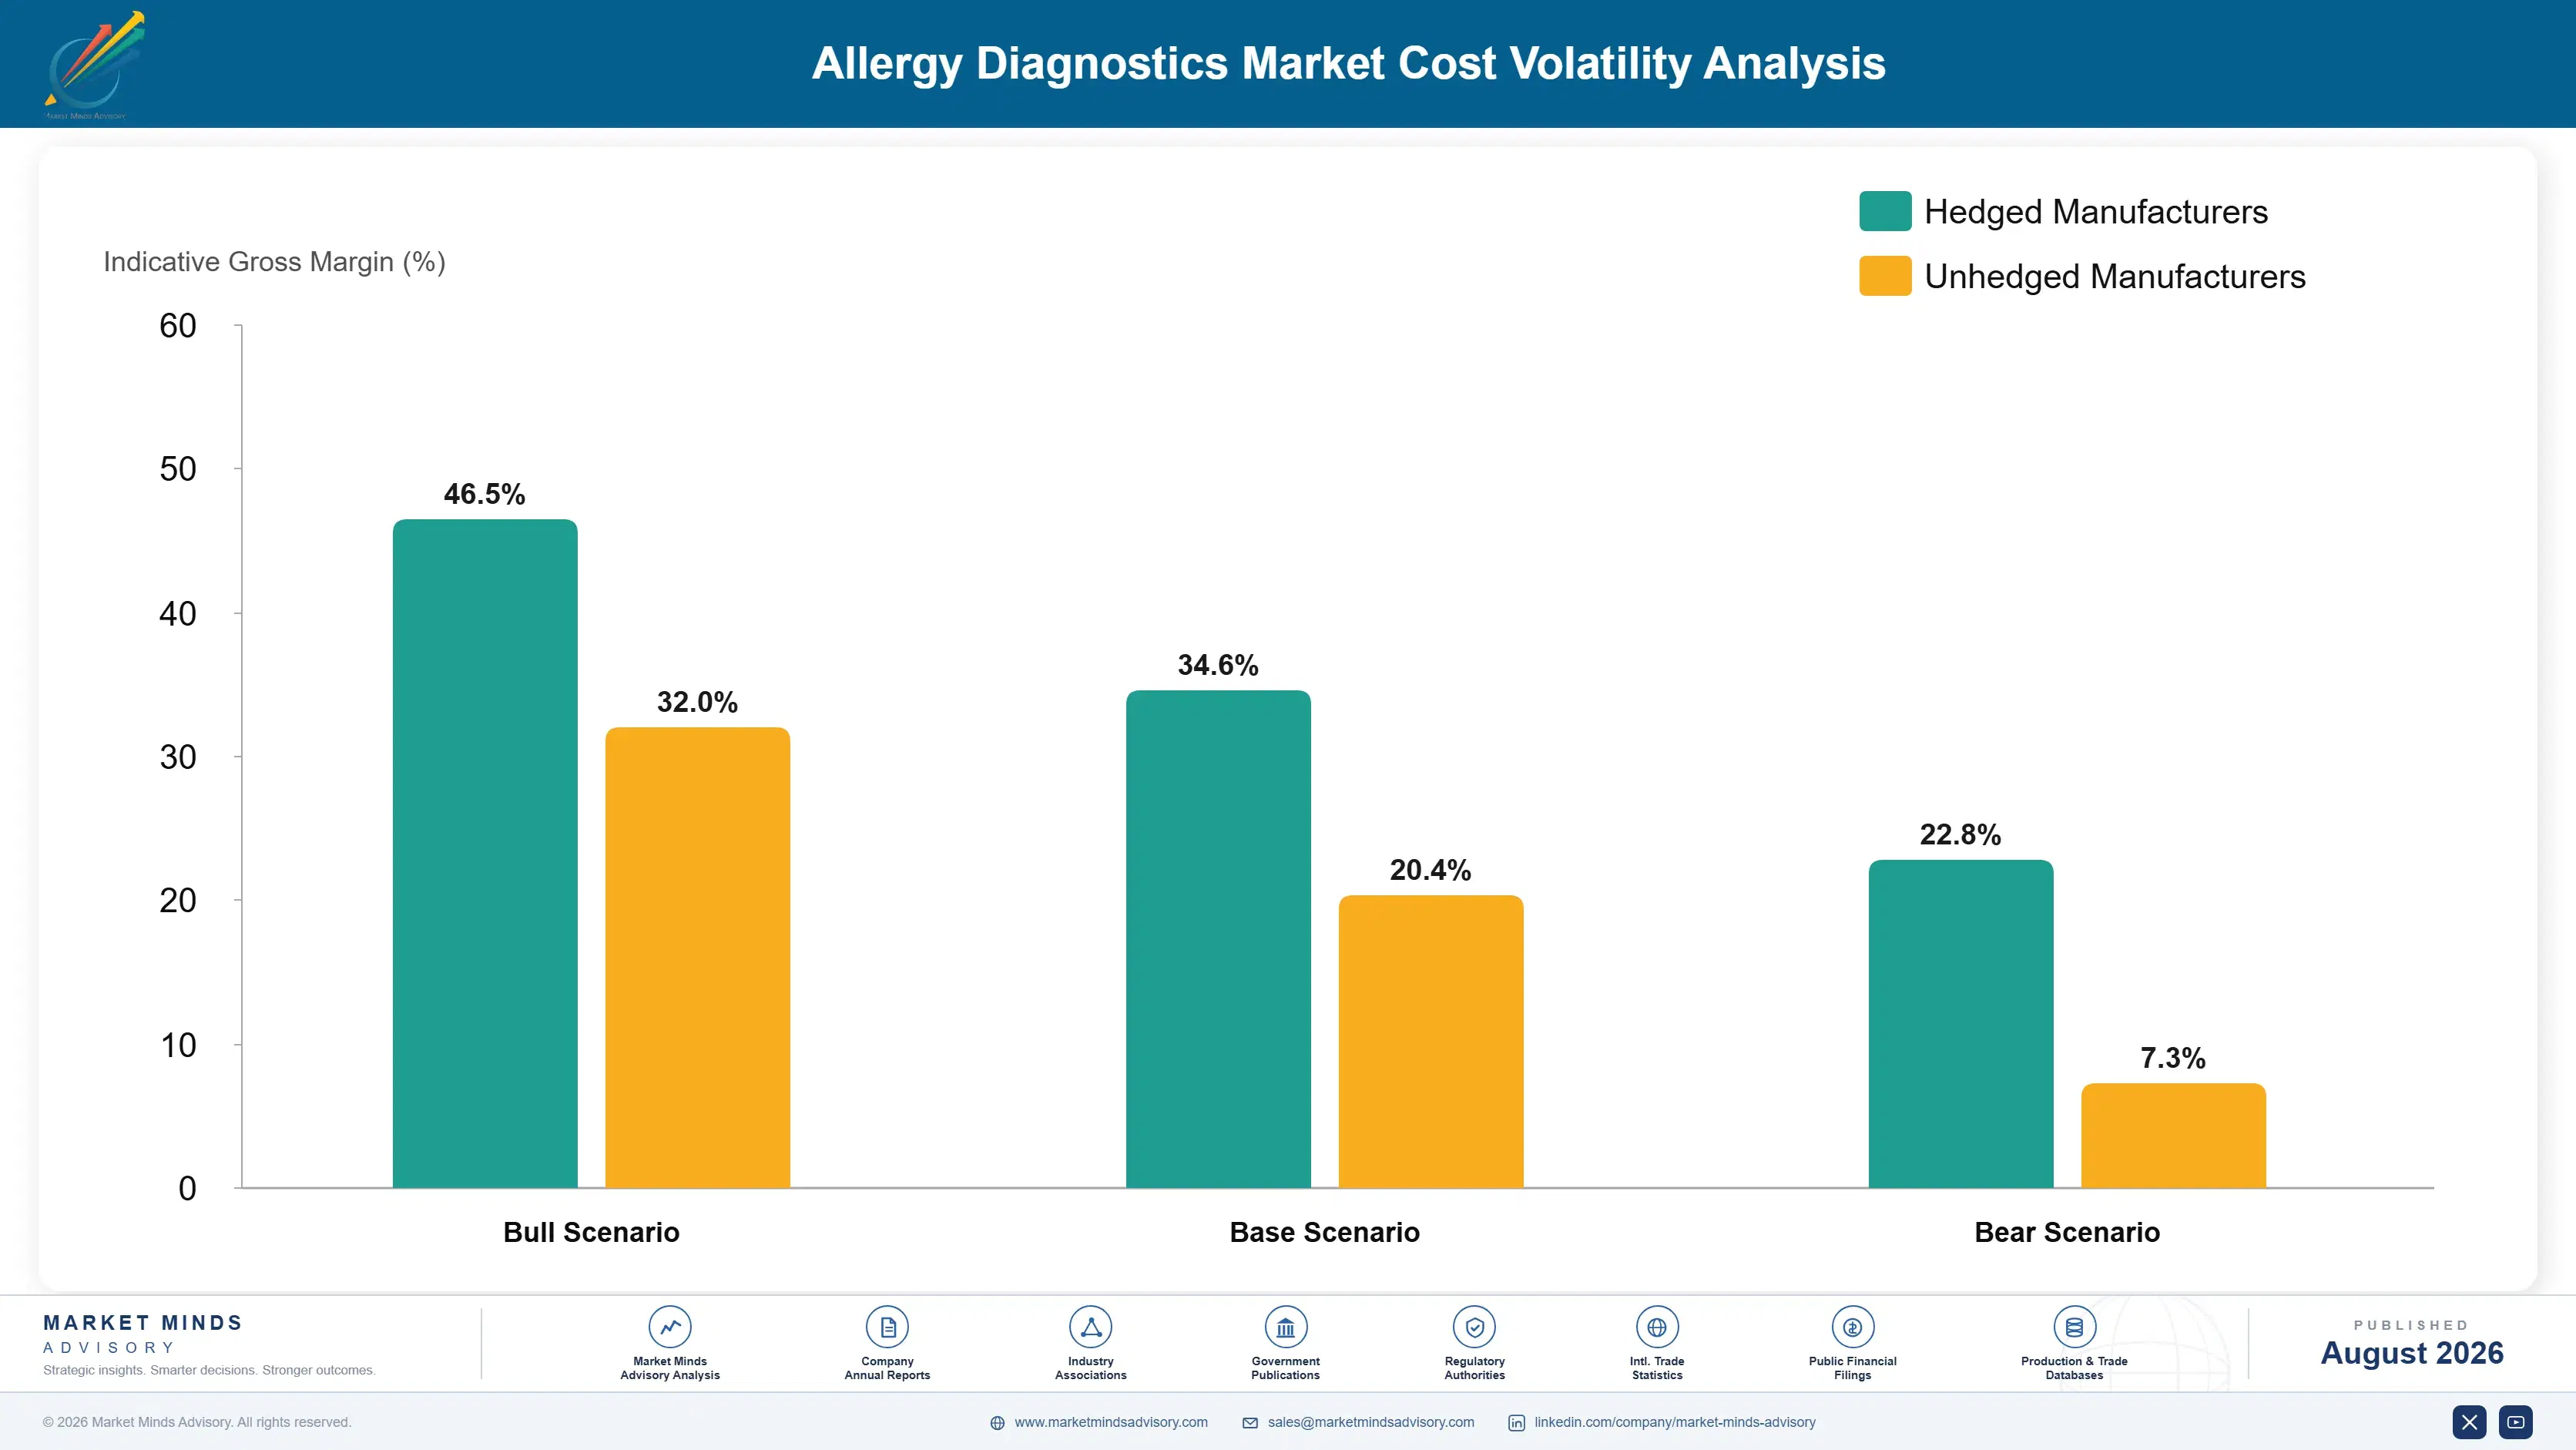
Recombinant protein and specialty reagent pricing rose sharply through 2021 and 2022 as biopharmaceutical manufacturing competed for the same fermentation and purification capacity, and European Commission energy statistics record industrial electricity roughly doubling at the 2022 peak. Thermo Fisher and Revvity both reported input and logistics cost pressure across that period. Diagnostics suppliers holding annual laboratory contracts absorbed most of it rather than reopening pricing mid-term.

Exposure divides by how a supplier sources its allergens. Natural extract sourcing is cheap and exposed to harvest variability, contamination, and seasonal supply nobody can control. Recombinant production costs more per allergen and removes that variability entirely, which matters because lot-to-lot inconsistency is a clinical problem rather than merely a commercial one. Suppliers running both carry a blended exposure that is easier to manage than either alone.
allergy-diagnostics-market-cost-volatility-analysis-1787297647132

Move high-volume allergens to recombinant production

Natural extracts vary with harvest, season, and source population, and that variability reaches the clinician as shifting quantitative results on an unchanged patient. Recombinant production costs more per allergen and removes the variability completely. It only pays on allergens ordered in real volume, so the decision is a portfolio one rather than a technical preference.

Contract natural extract supply across multiple seasons

Pollen, mite, and food extract supply depends on seasonal collection that a bad year can disrupt entirely, and spot buying during a shortage is both expensive and slow to qualify through properly. Multi-season agreements with collectors secure the volume and smooth pricing considerably. Storage stability then caps how far ahead anybody can usefully buy at all.

Share validation cost across regional menu expansion

Each new allergen carries validation and documentation cost regardless of the volume it eventually sells, which makes regional allergens look unattractive individually. Validating them as a regional panel rather than one at a time spreads that fixed cost across an account win rather than against a single test. It changes an unattractive per-allergen case into an obvious per-market one.

Portfolio Architecture for Margin Defence

Margin here tracks whether the result actually changes what a clinician does. A broad extract panel ordered without a hypothesis produces measurements that frequently lead nowhere, and payers have started pricing it accordingly. A component result separating anaphylaxis risk from pollen cross-reactivity changes management immediately, and it survives the same audit that broad panels increasingly fail.
The volume tension runs between breadth and precision. Broad panels generate the allergen counts that reimbursement has historically rewarded and keep analysers loaded through the working day, and they are exactly what payer scrutiny is now aimed at. Targeted component testing produces fewer measurements per patient at considerably higher clinical value. A supplier whose whole model assumes allergens per sample will keep rising is badly exposed to a policy change already under way.

High-value pools sit in three places. Component menus deep enough that a laboratory never needs to send a sample elsewhere, regional allergen coverage that the global libraries have neglected for decades, and interpretive reporting that turns a measurement into an actual decision. All three defend directly against exactly the reimbursement pressure now threatening the panel volume model.

Volume / Commodity-Adjacent Tier

Total antibody assays, extract-based singleplex testing, and skin prick devices and extracts. Competition is on price and workflow fit, and the range reflects how differently instrument-tied reagents and standalone consumables are priced.
Gross Margin: 38-48%

Premium / Certified Tier

Automated specific antibody platforms with broad validated allergen menus and established clinical thresholds. Menu breadth and published evidence rather than analytical performance are what sustain the margin in laboratory selection.
Gross Margin: 54-66%

Sustainability / Regulatory / Next-Generation Tier

Component-resolved menus, multiplex arrays, interpretive reporting, and immunotherapy monitoring protocols. The very wide range reflects genuinely different economics between reagent-based component testing and clinical interpretation delivered as software alongside it.
Gross Margin: 62-76%
allergy-diagnostics-market-portfolio-architecture-1787297647629

High-value Sub-segments and Strategic Watch-out

Component-Resolved Menus

Growing at 12.3% because a component result changes management where an extract result frequently changes nothing at all. It is also the part of the menu that survives payer audit, since every measurement carries a clear clinical implication. Guidelines increasingly specify components rather than extracts.
Gross Margin: 64-78%

Regional Allergen Coverage

Gulf dust, Japanese cedar, Indian pollens, and Latin American cockroach species remain under-served by libraries built for European practice. A laboratory will not run two platforms, so filling those gaps wins whole accounts rather than individual tests. Validating a regional panel as a group changes the economics entirely.
Gross Margin: 58-70%

Extract-Based Panel Testing

The historic volume base and the part payer scrutiny is aimed at directly, since broad panels generate positives that lead nowhere clinically. It still loads analysers and funds menu development, which is why nobody can simply abandon it. Abandoning it would strand the analyser and the menu together.
Gross Margin: 38-48%

Interpretive Reporting Services

Software turning a measured value into a stated reaction probability against validated thresholds, sold alongside the assay. The watch-out is regulatory, since an interpretation that guides management may be treated as a diagnostic claim in its own right. Regulatory classification is the open question here.
Gross Margin: 70-84%

What Follows The Platform Decision

An allergy platform placement is a reagent annuity rather than an instrument sale. The analyser is frequently placed on a reagent rental arrangement and earns nothing directly, while the laboratory then buys allergen reagents continuously for the life of the placement, typically seven to ten years. Menu breadth determines how much of that spend the supplier captures, because any allergen a laboratory cannot run leaves with the sample.
Stickiness is unusually high and comes from clinical familiarity rather than from contracts. Clinicians learn to interpret quantitative results against thresholds specific to one platform, and published guidance frequently cites those values directly. A laboratory switching platforms would hand its requesting clinicians unfamiliar numbers, which produces complaints immediately and no clinical benefit at all. Very few laboratories accept that trade.

Buyer profiles have split between laboratory operations and clinical specialists. Operations selects on cost per reportable result, automation fit, and consolidation onto existing analysers. Allergists and paediatricians decide what gets requested and will send samples elsewhere for an allergen their local laboratory cannot run. Suppliers who sell only to operations win placements and then lose the component volume that makes them profitable.
allergy-diagnostics-market-end-use-penetration-index-1787297648119

Where To Compete Here

These are among the four positions where our research anticipates prominent divergence between winners and laggards over the coming forecast period. Each is grounded in the demand model, the regulatory perimeter, and the announced capacity pipeline.
01 / MENU DEPTH INVESTMENT

Every missing allergen is a lost account

A laboratory will not run two allergy platforms, so it selects the one covering everything its requesting clinicians order and then sends nothing away at all. That makes menu breadth the single deciding factor rather than any analytical specification, and a single frequently requested component that a platform cannot measure puts a whole account at risk. Validation cost per allergen looks unattractive taken in isolation and entirely reasonable when measured against an account worth several hundred thousand dollars a year.
02 / REGIONAL ALLERGEN COVERAGE

Build menus for the populations being tested

Allergen libraries were originally built around European and North American sensitisation patterns, while the fastest-growing testing volumes now sit in Gulf, Indian, Chinese, and Latin American populations reacting mainly to allergens those libraries barely cover at all. Laboratories in those markets currently send their samples abroad for exactly the allergens their own patients react to most often. Validating those regional panels as a group rather than allergen by allergen turns an unattractive individual case into an obvious market entry decision.
03 / INTERPRETATION LAYER OWNERSHIP

Report a decision, not a number

A measured antibody value means very little indeed to a clinician who ordered a broad panel without any hypothesis, and roughly 30% of positive results correspond to no clinical reaction whatsoever. Reporting reaction probability against thresholds validated on real challenge outcomes converts a measurement into something actionable, and it earns a fifth to a third more per result. It also answers the payer audit directly, because a result that visibly changes management is precisely what those audits were looking for.
04 / THERAPY PROTOCOL ATTACHMENT

Follow the patient through treatment, not diagnosis

A single diagnostic episode generates one test, while an oral immunotherapy course generates six or more, plus periodic follow-up continuing for years after the treatment itself finishes. Working with immunotherapy providers to embed component measurement into their dosing and monitoring protocols converts a single answer into a longitudinal revenue stream tied directly to the therapy. It also fixes the platform for every single enrolled patient, since a protocol validated against one assay is never casually rerun against a different one.

Engagement Snapshot From the Field

A live engagement with an industry participant carrying material or product regulatory and market exposure ahead of a defining policy shift, showing how our research translates into a defensible multi-year portfolio strategy.
MARKET MINDS ADVISORY · CLIENT ENGAGEMENT SUMMARY
Allergy Diagnostics Producer Strategic Portfolio Review and Transition Roadmap 2026·Investment Scenario on Allergy Diagnostics Exposure Evaluation 2025-26
CLIENT PROFILE
A private laboratory network operating across several Gulf and South Asian markets, processing above twelve million tests annually with revenue near USD 410 million (client-reported, unverified by MMA). Allergy testing volumes had grown quickly on self-referred private demand, but a substantial share of allergy samples were being referred out to European reference laboratories rather than run in-house.
STRATEGIC CHALLENGE
Management could not explain why allergy referral rates stayed high when the network had recently installed a modern specific antibody platform with a broad menu. Requesting clinicians were not complaining about turnaround or cost, and the platform vendor insisted the menu covered everything a laboratory would normally need to offer.
MMA APPROACH
MMA analysed twelve months of referred-out allergy requests by allergen, comparing what clinicians had ordered against what the installed platform could actually measure. Regional sensitisation patterns from published prevalence work were then mapped against the platform's validated menu. The commercial value of the referred volume was costed against the effort of adding a second platform or changing supplier.
KEY FINDINGS
  1. Referred-out requests concentrated on roughly fourteen allergens, principally date palm pollen, regional dust mite species, and several local foods absent from the installed menu (client-reported, unverified by MMA).
  2. Those fourteen allergens together accounted for around 23% of every single allergy request received across the whole network in the period reviewed.
  3. Once a sample left for a referred allergen, the requesting clinician frequently sent the whole subsequent workup to the same reference laboratory rather than splitting it.
  4. No supplier serving the region had validated the full regional allergen set, though two had validated part of it and had not marketed the fact locally.
CLIENT PROFILE
A private laboratory network operating across several Gulf and South Asian markets, processing above twelve million tests annually with revenue near USD 410 million (client-reported, unverified by MMA). Allergy testing volumes had grown quickly on self-referred private demand, but a substantial share of allergy samples were being referred out to European reference laboratories rather than run in-house.
STRATEGIC CHALLENGE
Management could not explain why allergy referral rates stayed high when the network had recently installed a modern specific antibody platform with a broad menu. Requesting clinicians were not complaining about turnaround or cost, and the platform vendor insisted the menu covered everything a laboratory would normally need to offer.
MMA APPROACH
MMA analysed twelve months of referred-out allergy requests by allergen, comparing what clinicians had ordered against what the installed platform could actually measure. Regional sensitisation patterns from published prevalence work were then mapped against the platform's validated menu. The commercial value of the referred volume was costed against the effort of adding a second platform or changing supplier.
KEY FINDINGS
  1. Referred-out requests concentrated on roughly fourteen allergens, principally date palm pollen, regional dust mite species, and several local foods absent from the installed menu (client-reported, unverified by MMA).
  2. Those fourteen allergens together accounted for around 23% of every single allergy request received across the whole network in the period reviewed.
  3. Once a sample left for a referred allergen, the requesting clinician frequently sent the whole subsequent workup to the same reference laboratory rather than splitting it.
  4. No supplier serving the region had validated the full regional allergen set, though two had validated part of it and had not marketed the fact locally.
RECOMMENDED STRATEGY
Phase 1: Phase one: quantify the referred volume by allergen and present it to platform suppliers as an account-level commercial case rather than as individual test requests. Phase 2: Phase two: qualify a secondary platform covering the regional allergen gap for those requests specifically, rather than replacing the primary installation. Phase 3: Phase three: market in-house regional allergen capability directly to requesting clinicians, who had assumed it was simply unavailable anywhere locally.
OUTCOME
The network qualified a secondary platform for the regional allergen set and reported referred-out allergy volume falling by roughly two thirds within a year (client-reported, unverified by MMA). One primary supplier subsequently committed to validating the missing allergens, and total allergy revenue rose as clinicians returned the full workup rather than splitting requests.

Frequently Asked Questions

Foundational context covering the market sizes, CAGR, scope, country, region and competition that inform every finding below. This section is provided to cover basics and most often pre-purchase conversations, answered from the MMA Primary Research Dataset.

What is the current size of the Allergy Diagnostics Market?

The market reached USD 5.4 billion in 2025 and is forecast at USD 5.84 billion for 2026. Growth follows testing infrastructure and reimbursement rather than allergy prevalence, which is rising almost everywhere.

How large will the Allergy Diagnostics Market be by 2036?

MMA forecasts USD 12.85 billion by 2036, an increase of USD 7.01 billion over 2026. That represents an expansion multiple of 2.20 times across the forecast period.

What is the CAGR for the Allergy Diagnostics Market 2026 to 2036?

The base case CAGR is 8.2%, with a bull case at 9.4% and a bear case at 7.0%. The bear case reflects payer pushback on broad panel testing, which has already begun in several systems.

Which segment is growing fastest?

Component-resolved molecular diagnostics grow fastest at 12.3%, exactly 1.50 times the market rate. Testing individual allergen proteins separates genuine anaphylaxis risk from harmless pollen cross-reactivity.

Who are the major companies in the Allergy Diagnostics Market?

Thermo Fisher Scientific, Siemens Healthineers, Revvity, Hycor Biomedical, and Stallergenes Greer lead the market. The top five hold roughly 66% of allergy diagnostics revenue, with one platform accounting for most of the installed base.

Which country is growing fastest?

India grows fastest at 12.2%, driven by rising urban allergy prevalence against testing penetration that remains a fraction of developed market levels. Private diagnostic chains have added allergy menus aggressively.

Report Segmentation Architecture

The full report scope spans multiple orthogonal segmentation dimensions, with cross-tabulated demand data provided for each dimension pair. Coverage extends further to regional breakdowns, trend trajectories, and the competitive detail needed to support segment-level decision-making.

By Test Method

  • Component-Resolved Molecular Diagnostics
  • Multiplex Allergen Array Testing
  • Singleplex Specific Antibody Assays
  • Patch and Cellular Activation Testing
  • Skin Prick and Intradermal Testing

By End-Use Industry

  • Hospital and Reference Laboratories
  • Private Diagnostic Chains
  • Allergy and Immunology Clinics
  • Paediatric Services
  • Immunotherapy Providers

By Commercial Dimension

  • Instrument and Reagent Rental Placement
  • Direct Reagent Supply
  • Distributor Channel Supply
  • Interpretive Reporting Services
  • Reference Laboratory Referral

By Region

  • East Asia
  • South Asia and Pacific
  • Western Europe
  • North America
  • Latin America
  • Middle East and Africa
  • Eastern Europe

Scope, Methodology, and Coverage

Every figure in this report is reproducible from documented input assumptions. The scope below maps the historical period, the forecast horizon, the segmentation dimensions, and the countries covered, alongside the underlying primary and qualitative methodology.
Historical Period
2020 to 2025
Forecast Period
2026 to 2036
Base Year
2025 (USD billions; MMA Primary Research Dataset, August 2026)
Market Definition
The allergy diagnostics market comprises in-vitro and in-vivo tests used to identify allergic sensitisation and assess its clinical relevance, valued at supplier selling prices to hospital and reference laboratories, private diagnostic chains, allergy clinics, and immunotherapy providers. It spans component-resolved molecular diagnostics, multiplex allergen arrays, singleplex specific antibody assays, total antibody measurement, skin prick and intradermal testing, and patch and cellular activation testing, together with the analysers, reagents, allergen extracts and recombinant proteins, quality controls, and interpretive reporting supplied for them. Allergen immunotherapy products and extracts supplied for treatment, adrenaline autoinjectors, antihistamines and biologic therapies, general immunology and clinical chemistry analysers, food intolerance tests without an immunological basis, and genetic predisposition testing are excluded.
Quantitative Units
USD billions (current prices); volume in millions of tests performed
Segmentation Dimensions
By Test Method; By End-Use Industry; By Commercial Dimension; By Region
Regions Covered
East Asia, South Asia and Pacific, Western Europe, North America, Latin America, Middle East and Africa, Eastern Europe
Countries Covered
Japan, China, South Korea, Taiwan, India, Australia, Singapore, Thailand, Indonesia, Malaysia, Germany, Sweden, Denmark, Austria, Spain, Italy, France, UK, Netherlands, Switzerland, USA, Canada, Mexico, Brazil, Argentina, Chile, Colombia, Poland, Czechia, Hungary, Romania, Saudi Arabia, United Arab Emirates, Qatar, Kuwait, Egypt, South Africa, and additional markets relevant to this sector
Key Companies Profiled
Thermo Fisher Scientific, Siemens Healthineers, Revvity, Hycor Biomedical, Stallergenes Greer, ALK-Abello, HAL Allergy, Macro Array Diagnostics, Omega Diagnostics, Minaris Medical, Lincoln Diagnostics, Bio-Rad Laboratories, R-Biopharm, Dr. Fooke Laboratorien, Mediwiss Analytic, AESKU Group, Zeus Scientific, Vitro SA, Hangzhou Zheda Dixun, Shenzhen YHLO Biotech
Quantitative Methodology
Primary survey, n=3,800 respondents, Q4 2025, six countries; demand-side model with trade association cross-validation
Qualitative Methodology
47 expert interviews, Q4 2025; applied to validate demand model assumptions, identify emerging dynamics, and assess competitive positioning
Report Format
PDF and XLSX data workbook (Word format preview document)
Publisher
Market Minds Advisory
Report Code
MMA-2026-MED-687
Published
August 2026
Contact
sales@marketmindsadvisory.com | www.marketmindsadvisory.com

Purchase the full Allergy Diagnostics Market Report (2026 to 2036).

The full report examines allergy diagnostics demand across seven regions and five test methods, with particular attention to the gap between sensitisation and clinical allergy that broad panel testing cannot resolve. It quantifies where payer scrutiny is restricting panel ordering and models how allergen-based reimbursement would revalue each competitor's menu strategy. Competitive analysis covers twenty participants assessed on allergy diagnostics revenue, including where regional allergen gaps are quietly costing suppliers whole laboratory accounts. Regional chapters map sensitisation patterns against testing infrastructure and reimbursement entirely separately.
Seven-region prevalence, infrastructure and reimbursement analysis
Five test method segmentation with growth rates
Twenty participant competitive assessment and menu positioning
Component against extract testing clinical concordance data
Payer panel restriction policy tracking across major systems
Regional allergen menu gap assessment by laboratory market

Built For The People Who Decide

From boardroom strategy to bench-side execution, this report is read cover-to-cover by leaders shaping the next decade of their industry, turning demand scenarios, market dynamics and valuation benchmarks into decisions.
CXOs/ Presidents/ VPs/ Managers
M&A and Corporate Development
Strategy Teams and R&D Heads
Procurement and Product Directors
Regulatory and Compliance Leaders
Investor Relations and Equity Analysts