Market Minds Advisory
Allergen Cross-Contact Risk Monitoring Platforms for Food Plants Market

Allergen Cross-Contact Risk Monitoring Platforms for Food Plants Market: Allergen Cross-Contact Risk Monitoring Platforms for Food Plants: Quantified Thresholds, Changeover Discipline and the End of Defensive Labelling

Undeclared allergens cause roughly 38% of food recalls, and almost none of them happen because a plant lacked a test. They happen in the handoffs between changeover, rework and label.

Lead Analyst

Published

September 2026

Make Smarter Decisions with Customized Research Insights

Request a free sample report and evaluate market opportunities, growth trends, and competitive dynamics relevant to your business needs.

2025 MARKET VALUE$0.7BMarket Size 2025
2036 FORECAST VALUE$3.5BBase Case , 2026 to 2036
CAGR 2026 TO 203615.6 %Bull 16.8% / Bear 14.3%
INCREMENTAL OPPORTUNITY$2.6BNet 10- year value creation
EXPANSION MULTIPLE4.26x2036 value over 2026 base
Strategic Levers
M&A Pipeline
Regional Outlook
Country Rankings
Competitive Intelligence
Segmental Deep-dive
Call-Us : 91 93563 13602

Executive Snapshot and Market Trajectory.

Undeclared allergens cause around 38% of food recalls, and plants almost never fail because they lacked a test. They fail in the handoffs: a changeover run out of sequence, rework returned to the wrong line, a supplier specification that changed without anyone noticing. None of that is a testing problem.
Quantitative cross-contact risk assessment grows at 23.4%, half again the market rate of 15.6%, because published reference doses have turned precautionary labelling from a legal shield into something a manufacturer must justify with numbers. Label and formulation reconciliation follows at 18.2%. North America takes 40% of value, where recall enforcement and litigation exposure are heaviest and product complexity greatest. Sesame joining the list in 2023 exposed how thin formulation records really were across the industry.
Concentration sits near 29% across the top five on measured platform and associated service revenue, which is the most fragmented picture in food safety software. Testing houses, workflow software vendors and sanitation chemical suppliers all sell into the same problem from different directions. Changeover verification consumes about 47 minutes of line downtime, and that number is what plants actually optimise. Testing houses and software vendors are converging on the same buyer.
Market Definition
This market covers software platforms and integrated monitoring systems that manage allergen cross-contact risk inside food manufacturing plants, spanning sanitation verification and changeover workflow, quantitative cross-contact risk assessment, rapid test result capture and trending, label and formulation reconciliation, supplier ingredient declaration management, and inline and environmental sensing integration. Revenue is measured as platform licence, subscription and attributable implementation value at supplier level. Laboratory testing services sold standalone, sanitation chemicals, general quality management software without allergen-specific function, and retail or food service applications are excluded.
Base Year Value
$0.7B in 2025 (MMA Primary Research Dataset, September 2026)
Forecast Period
2026 to 2036, eleven discrete annual values
CAGR
15.6% base case. Bull 16.8%. Bear 14.3%.
Fastest Growth Segment
Quantitative Cross-Contact Risk Assessment: 23.4% CAGR
Fastest Growth Country
Australia: 18.6% CAGR
Fastest Growth Region
South Asia and Pacific: 17.8% CAGR
Largest Region
North America: 40% of 2025 global value
Market Leaders
SafetyChain Software, TraceGains, Neogen, Eurofins Scientific and Intelex lead on measured platform and associated service revenue. Source: MMA Primary Research Dataset, July 2026.
Primary Survey
n=3,800 procurement and R&D decision-makers, Q4 2025, six countries
Methodology
Demand-side build-up, cross-validated against public data, 47 expert interviews

Allergen Cross-Contact Risk Monitoring Platforms for Food Plants Market Forecast Scenarios

allergen-cross-contact-risk-monitoring-platforms-f-size-forecast-scenario-1788425147432
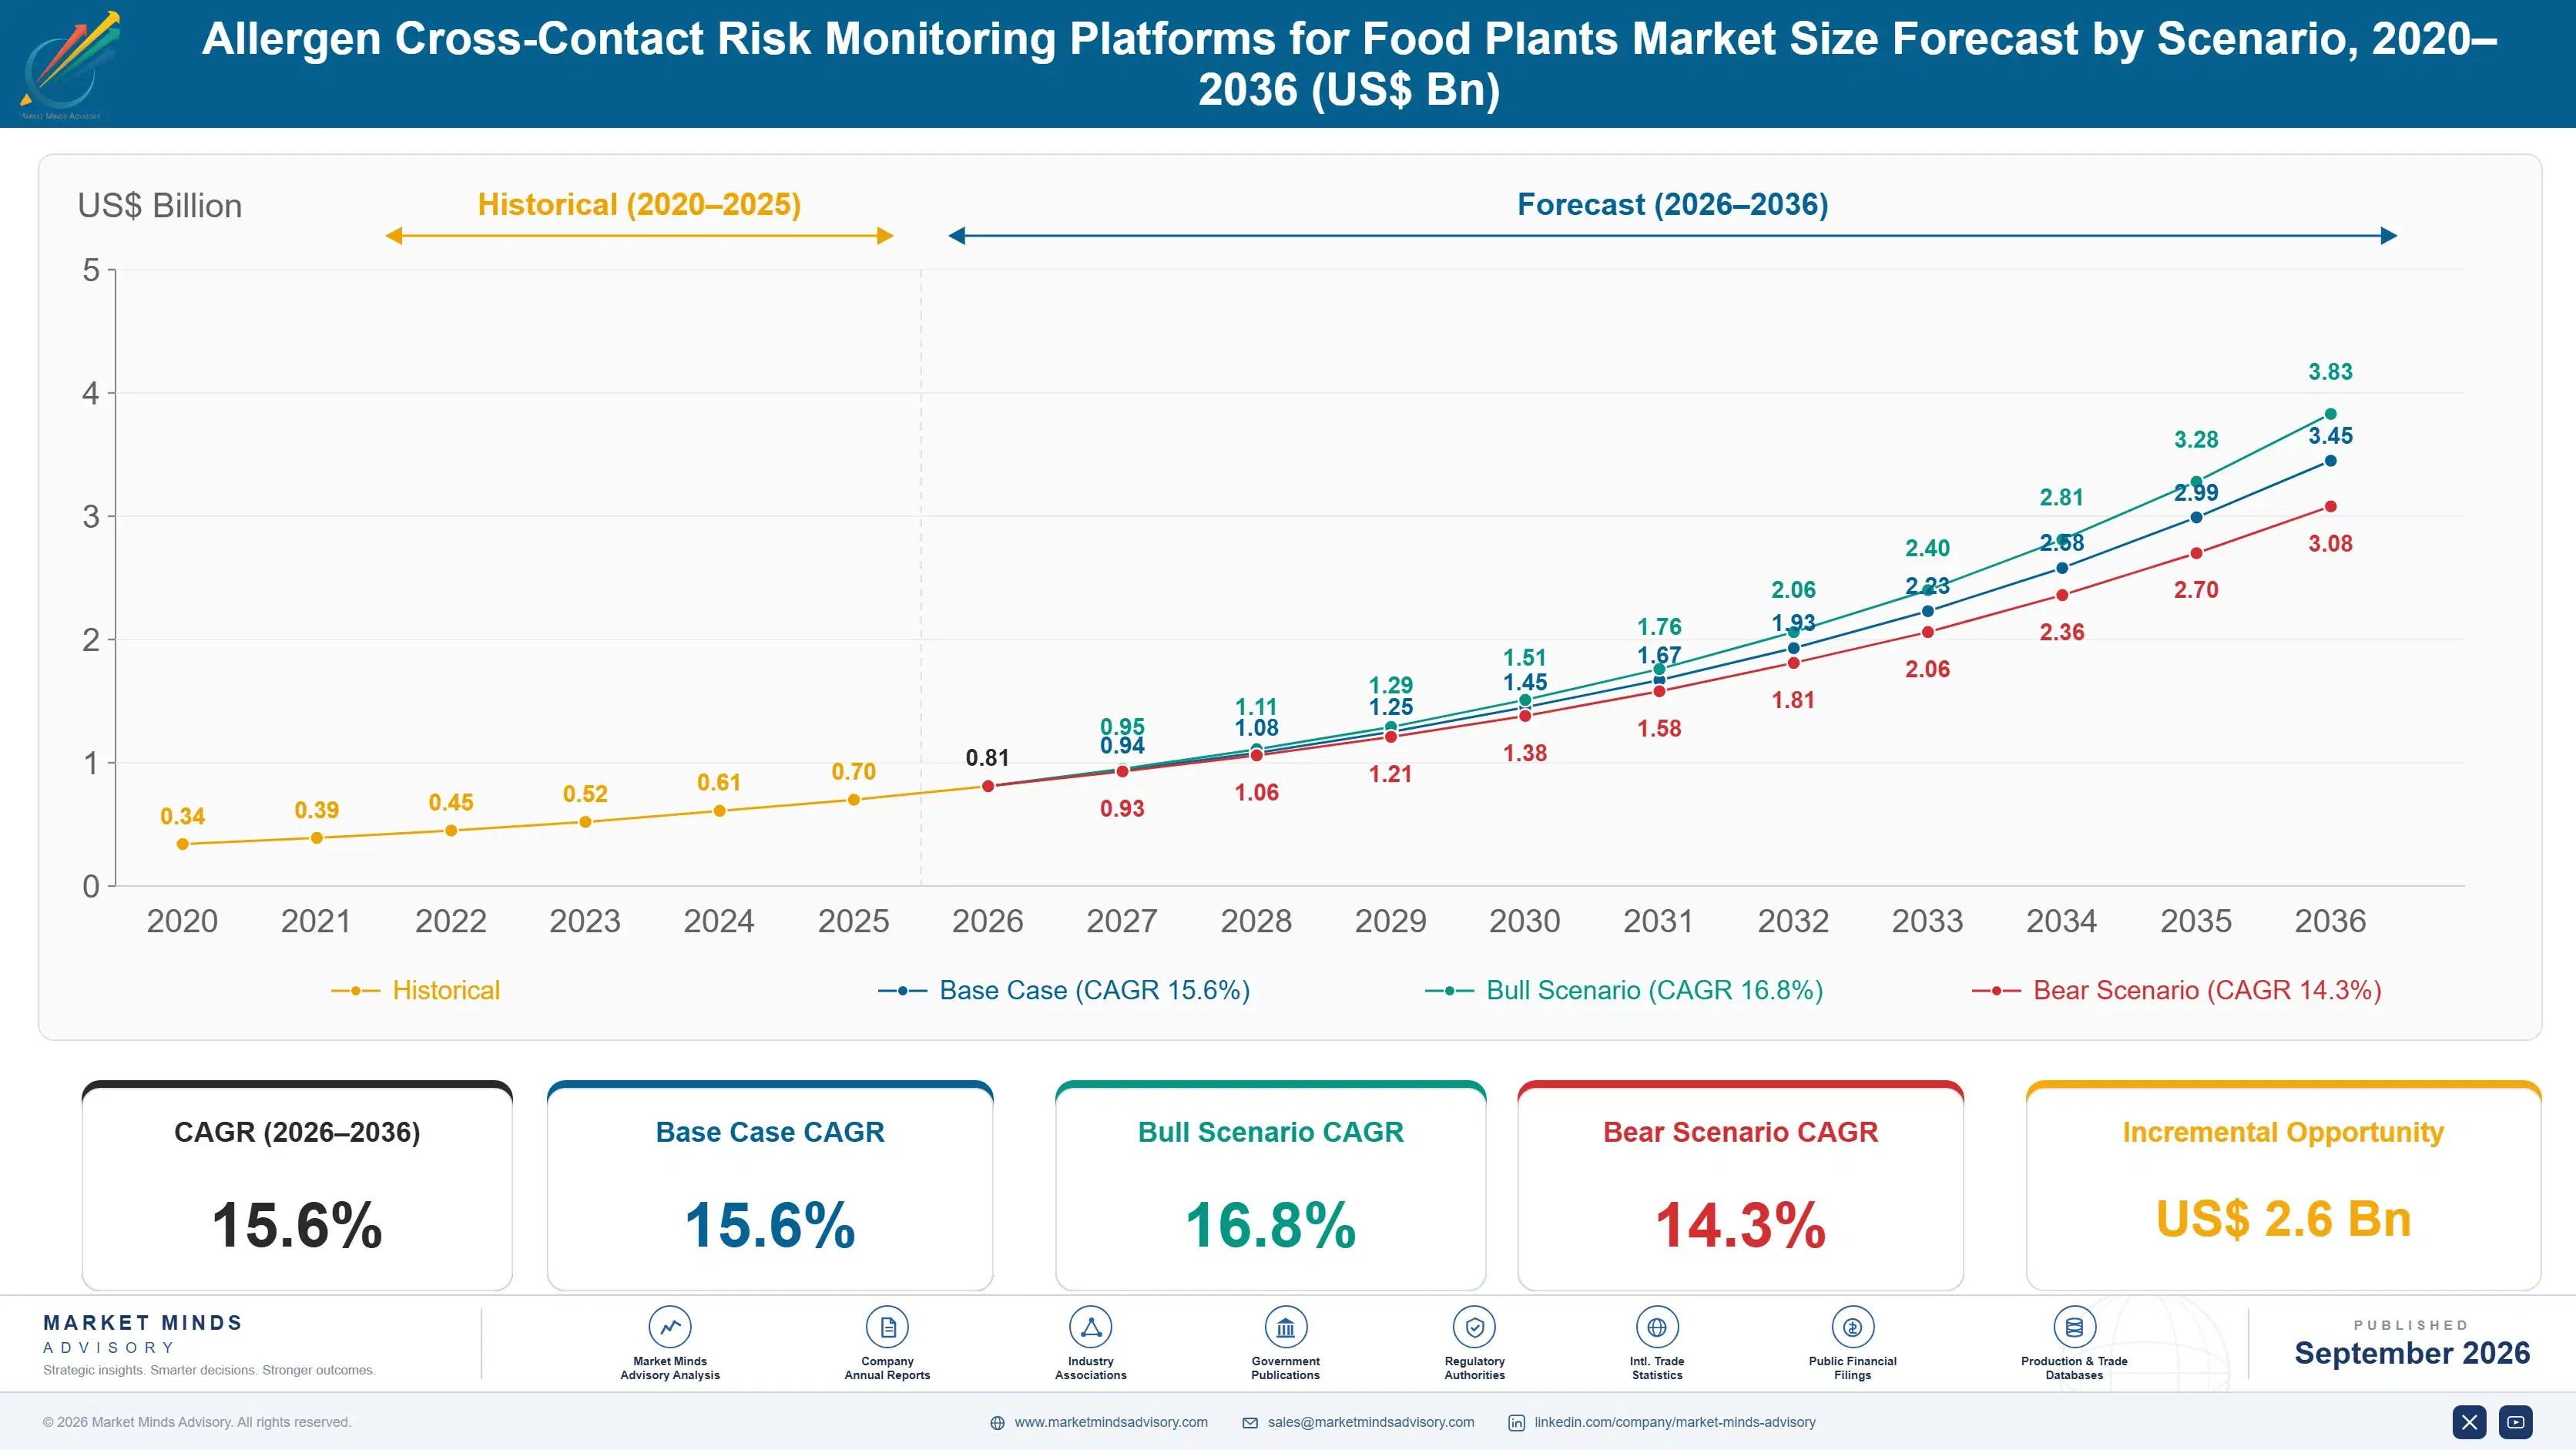
Growth ran at 14.2% from 2020 to 2025, and buying changed character part way through. Early spend went to capturing rapid test results digitally, which replaced paper records and satisfied auditors without changing plant behaviour at all. Sesame becoming the ninth major allergen under United States law in 2023 forced a genuine reassessment across thousands of formulations, and many manufacturers discovered their records could not answer the question.
The base case at 15.6% rests on three mechanisms. Published reference doses for allergen action levels mean a precautionary statement now requires a quantitative justification rather than a cautious instinct. Recall costs averaging around USD 9.4 million before litigation make prevention arithmetic easy for any finance function to follow. Third, supplier specification changes arriving at roughly 2.8 per supplier each year overwhelm manual reconciliation once a manufacturer runs more than a few hundred formulations.
The bull case at 16.8% assumes regulators move from encouraging quantitative risk assessment toward expecting it, which several jurisdictions are approaching. The bear case at 14.3% is that manufacturers continue treating precautionary labelling as adequate protection, keeping spend confined to record capture rather than extending it into the risk assessment and reconciliation work where the actual failures originate.

The Failure Is Never the Test

Read any undeclared allergen recall notice and the pattern repeats. The plant had swabs, procedures and trained staff. What it lacked was a link between the sanitation record, the production schedule and the label on the pack. Rework returned to a line running a different formulation. A supplier reformulated and told procurement, not quality. The label printed against a specification superseded months earlier and nobody compared the two.
TOP FIVE CONCENTRATION29%Fragmented across software vendors and testing service providers
UNDECLARED ALLERGEN RECALLS38%Share of food recalls caused by allergen labelling failures
AVERAGE RECALL COSTUSD 9.4 millionDirect cost incurred before litigation and brand damage
CHANGEOVER VERIFICATION TIME47 minutesLine downtime consumed by sanitation verification per changeover
PRECAUTIONARY LABEL PREVALENCE31%Packaged products carrying precautionary may contain allergen statements
SUPPLIER SPECIFICATION CHANGES2.8 per yearIngredient declaration revisions received from each supplier annually
That is why this market is not about testing. Rapid allergen tests are cheap, accurate enough and widely used, and their results sit in systems that never speak to the production schedule. Platforms earning money tie sanitation verification to what the line is about to run, and the approved formulation to what the printer receives. Changeover verification consumes about 47 minutes, so plants adopt anything that shortens it.
The regulatory ground has shifted under the defensive habit. Precautionary statements appear on roughly 31% of packaged products, and published reference doses let cross-contact risk be calculated rather than guessed. A manufacturer writing may contain without an assessment is increasingly exposed rather than protected, since the calculation exists and a court can ask why. That change is why the fastest segment grows at 23.4%.
"The uncomfortable finding across these plants is that precautionary labelling was never a safety measure. It was a way of not doing the arithmetic. Now the arithmetic exists, is published, and takes an afternoon, so declining to do it looks less like caution and more like a decision."
Director, Food Safety and Manufacturing Compliance Practice · MMA Agriculture and Food Practice · September 2026

Market Trends

Reference Doses Turn May Contain Into a Calculation

Published reference doses for the major allergens, developed through FAO and WHO expert consultation and applied in the Allergen Bureau VITAL programme, let a manufacturer calculate whether residual cross-contact actually exceeds a level that would harm a sensitive consumer. That converts precautionary labelling from an instinct into an assessment with a defensible answer. Roughly 31% of packaged products carry such statements today, many of which would not survive the calculation. Quantitative risk assessment is the fastest-growing function here at 23.4%, and it is a regulatory shift rather than a technical one.
Market Impact: Causes 38% of food recalls
Sanitation Records Connect to the Production Schedule

The persistent failure mode is a correct sanitation procedure performed against the wrong upcoming product, which no amount of swab accuracy prevents because the record and the schedule live in separate systems entirely. Platforms binding verification to the next scheduled formulation catch the mismatch before the line starts rather than after a recall. Verification consumes about 47 minutes per changeover, so shortening it while adding the check is the commercial argument that lands with operations rather than with quality. Plants adopt for the downtime and gain the control incidentally. The record and the schedule finally live in one place.
Market Impact: Added a 9th major allergen

Market Opportunities and Growth Drivers

Undeclared Allergens Dominate Recall Statistics Everywhere

Around 38% of food recalls across the United States and European Union arise from undeclared allergens rather than from microbiological or foreign body contamination, which makes this the single largest recall cause in packaged food. Direct recall cost averages about USD 9.4 million before litigation and retailer penalties are counted at all. The arithmetic for prevention is therefore straightforward for any finance function to follow without persuasion. What has been missing is not the business case but a system that addresses the handoffs where failures actually originate. Prevention was never the obstacle here.
Market Impact: Competes against 100% throughput spend

Sesame Addition Exposed Formulation Record Weakness

Sesame became the ninth major allergen under United States labelling law in 2023, which required every affected manufacturer to reassess formulations, supplier declarations, shared lines and label copy simultaneously across their entire catalogue. Many discovered their records could not answer the question without physical investigation, and some responded by adding sesame deliberately rather than segregating it properly. That episode demonstrated the fragility of formulation records more clearly than any audit had. It converted allergen data management from a quality preoccupation into a commercial exposure boards understood. Boards do not forget an exercise like that quickly.
Market Impact: Requires 4 missing data inputs

Market Restraints and Challenges

Plants Buy Quality Software Reluctantly and Rarely

Food manufacturing runs on thin margins and capital goes to line equipment that increases output, not to quality systems that prevent an event which has not happened yet. The root cause is that prevention spend competes against throughput spend inside the same budget and loses on every visible measure. Commercially this makes sales cycles long and forces vendors to justify purchases on downtime saved rather than on risk avoided. Vendors mitigate by attaching to changeover efficiency, which operations funds readily, and delivering the control benefit alongside. The purchase happens when somebody else pays for it.
Market Impact: Assesses 31% of precautionary labels

Quantitative Assessment Requires Data Plants Do Not Hold

Calculating cross-contact exposure needs carryover mass, batch sizes, serving sizes and residue distribution, and most plants hold none of it in a usable form because nobody previously needed it. The root cause is that precautionary labelling never required evidence, so no evidence was gathered for decades. Commercially this makes the fastest-growing segment the hardest to deliver, since implementation involves measurement work before any software runs. Suppliers mitigate through standardised carryover studies and default assumptions, which produce conservative answers that still beat labelling everything. Conservative assumptions still beat labelling every product defensively.
Market Impact: Saves part of 47 minutes
4 additional market trends, 3 additional growth drivers, and 2 additional restraints and challenges are covered in the full report. Contact sales@marketmindsadvisory.com to access the complete intelligence.

Segment CAGR and Growth Architecture

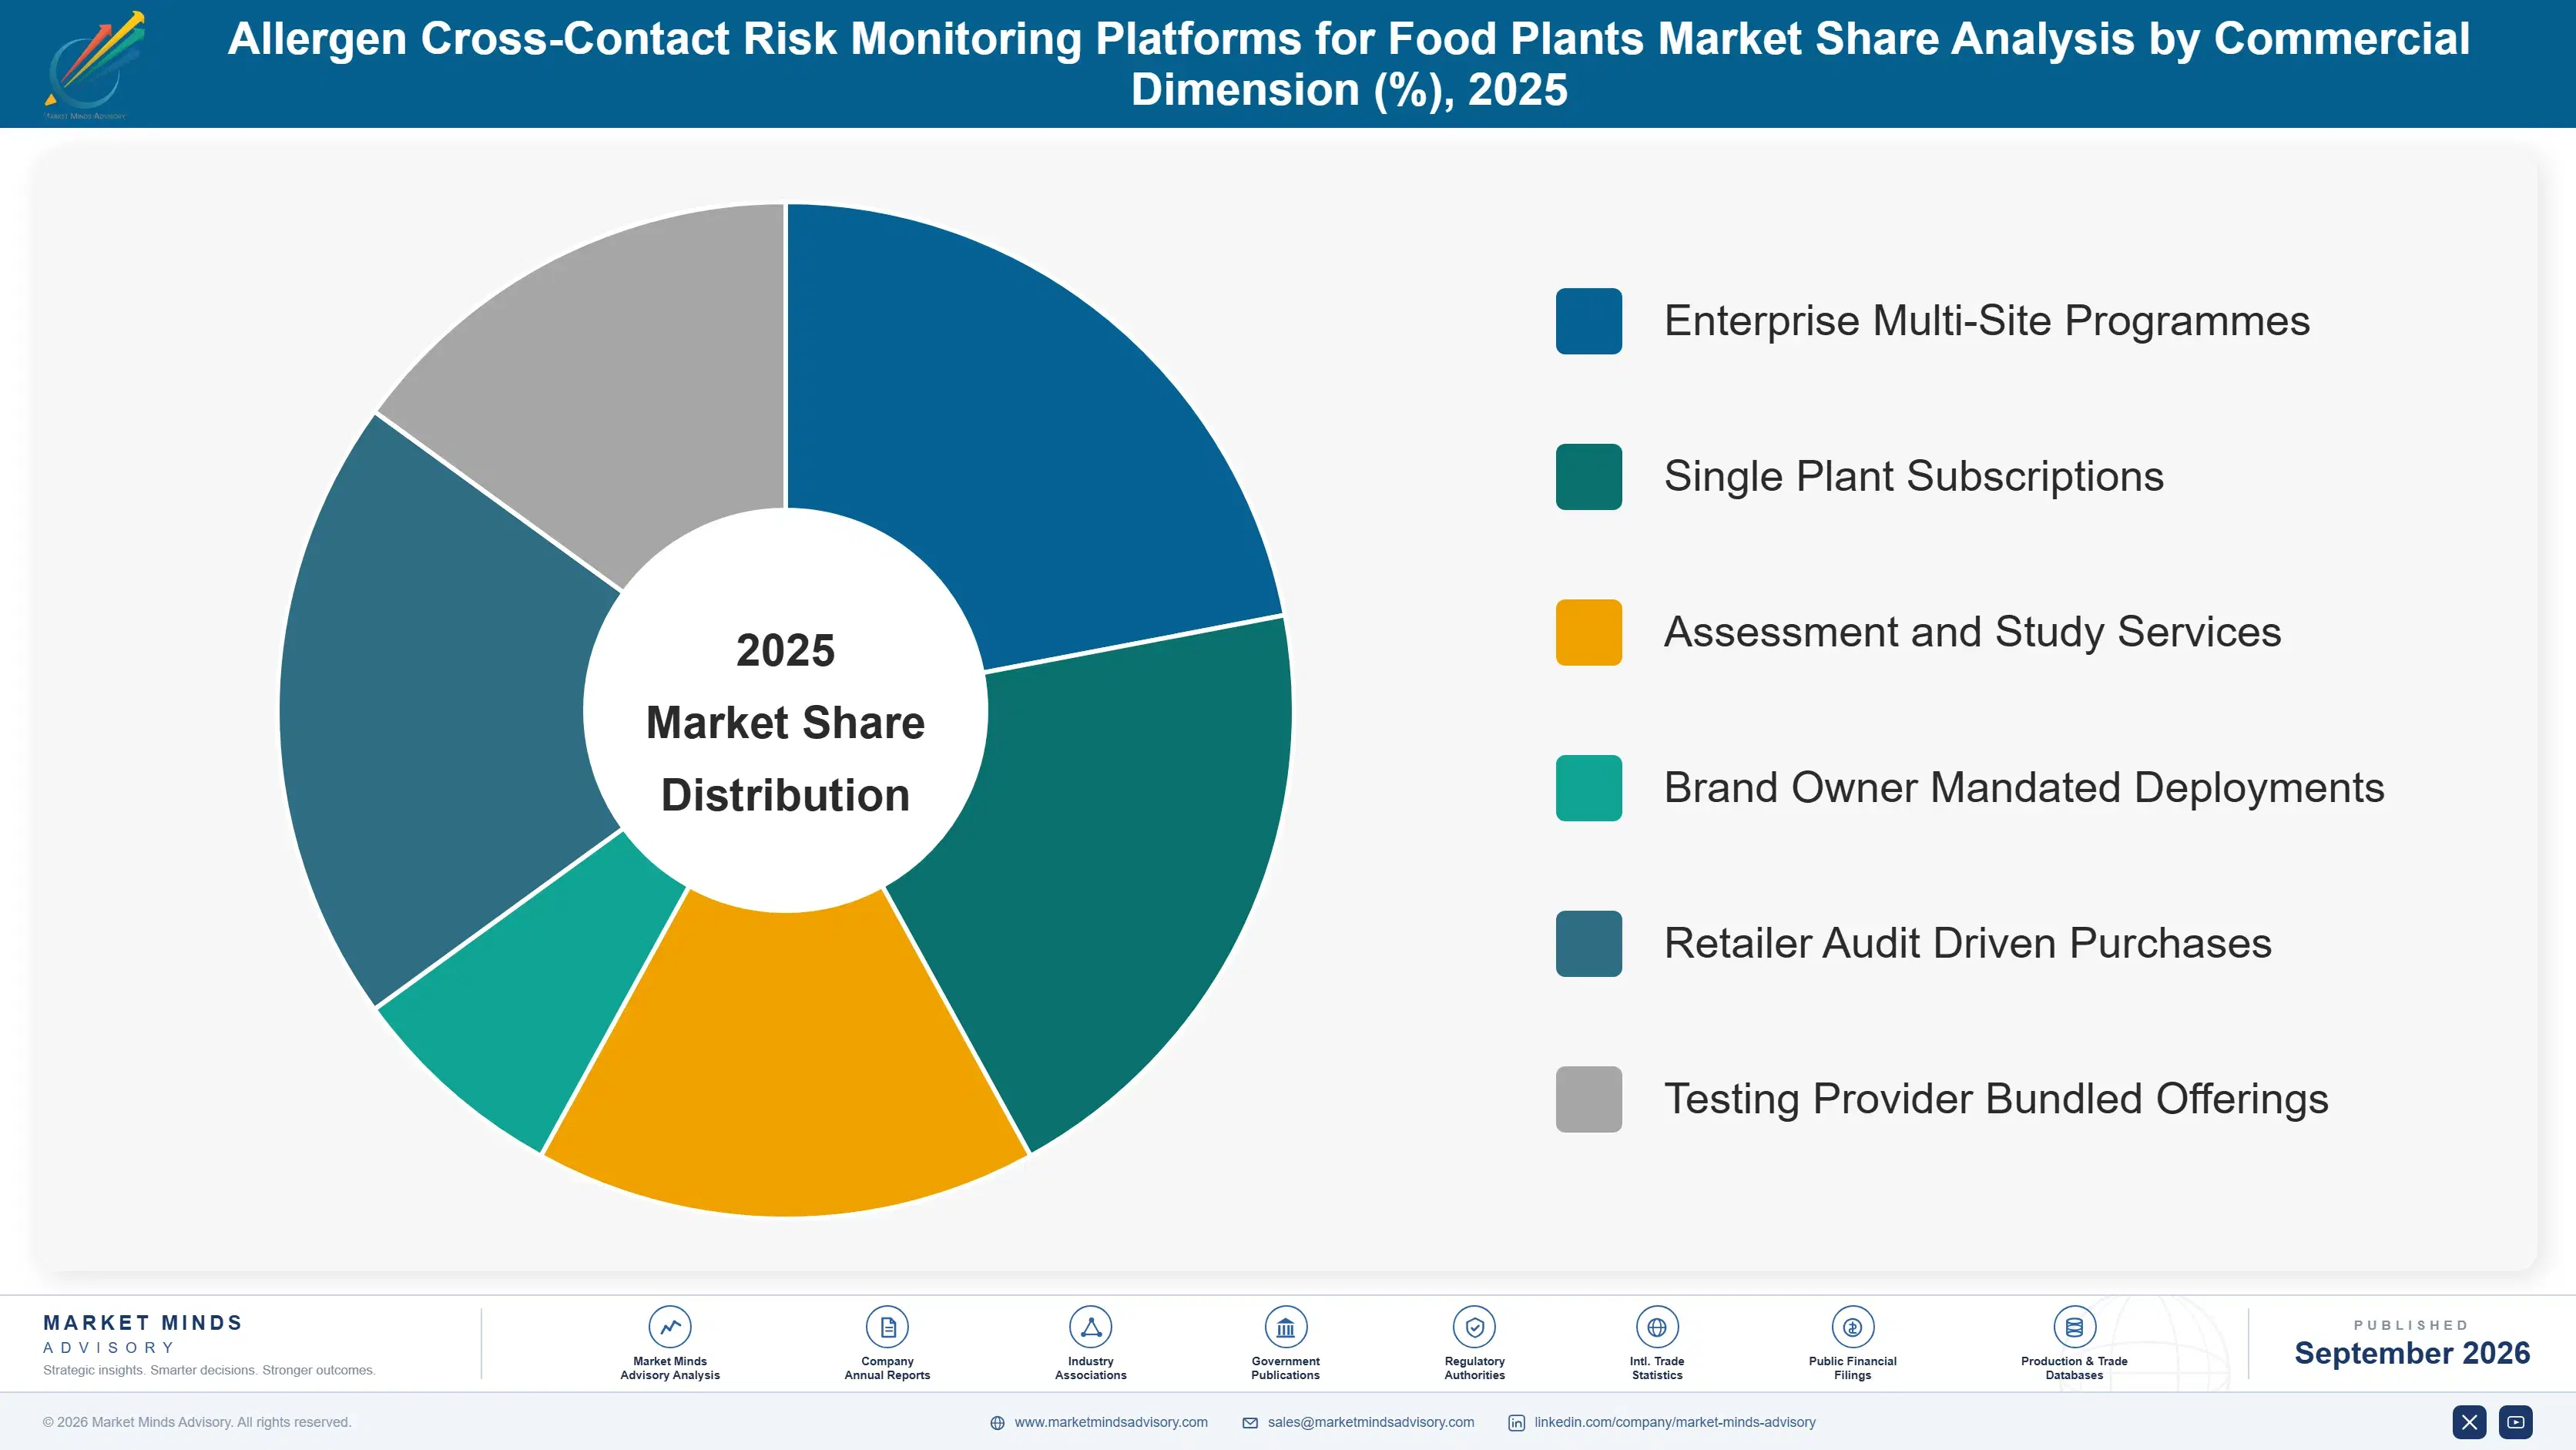
Segmentation follows platform function, because each function addresses a different point where allergen control actually breaks. Sanitation workflow addresses the changeover, reconciliation addresses the label, declaration management addresses the supplier, and quantitative assessment addresses the question of whether any of it needed a warning at all. Most manufacturers have bought one of the four and assume they are covered.
allergen-cross-contact-risk-monitoring-platforms-f-market-share-analysis-1788425147972

Quantitative Cross-Contact Risk Assessment

Quantitative assessment grows at 23.4%, half again the market rate of 15.6%, and it exists because published reference doses made the calculation possible where previously only judgement was available. A manufacturer can now determine whether residual carryover on a shared line exceeds a level that would affect a sensitive consumer, which either justifies a precautionary statement or removes it. Removing one is commercially valuable, since a may contain warning restricts retail listings and excludes the consumers most motivated to buy free-from products. Implementation is the constraint rather than demand, because the carryover and batch data the calculation requires has rarely been collected. Manufacturers holding the data from earlier work move considerably faster than those starting cold.
CAGR 23.4%

Label and Formulation Reconciliation

Label reconciliation grows at 18.2% because the final failure in most undeclared allergen recalls is a pack printed against a superseded specification, which no plant-floor control catches. Platforms comparing approved formulation records against artwork and print files before release close a gap that sits between quality, marketing and packaging suppliers, none of whom owns it. Adoption concentrates among manufacturers with large stock keeping unit counts and frequent promotional packaging changes, where the volume of artwork versions defeats manual checking entirely. The function is unglamorous, cheap to run once configured, and it catches the specific error that ends careers. Promotional packaging cycles are where the version conflicts multiply fastest across a catalogue.
CAGR 18.2%
Full segment breakdown across 6 segments available in the complete report.

Regional Architecture and Country Demand Map

Demand follows enforcement intensity and litigation exposure rather than food production volume. Regions where a recall carries consequences beyond product loss buy these platforms; regions where it does not continue managing allergens through procedure and precautionary labelling instead. Production volume predicts almost nothing about who buys.

North America

North America holds 40%, above the regional band, because recall enforcement, retailer penalty regimes and civil litigation exposure combine here in a way no other market matches. The sesame addition in 2023 forced a catalogue-wide reassessment across thousands of manufacturers and exposed how little formulation history most of them held. Packaged product complexity is greater here than anywhere, with high stock keeping unit counts, frequent promotional packaging and extensive private label manufacturing across shared lines. Retailer audit requirements frequently exceed regulatory ones, which pulls spending forward independently of what regulators demand. Private label manufacturing on shared lines concentrates the liability with contract producers who carry other companies' formulations and other companies' brand risk simultaneously.
Share: 40% | CAGR: 16.6% (2026 to 2036)

Western Europe

European demand rests on Regulation 1169/2011, which requires declaration of fourteen allergens rather than the nine covered under United States law, so the reconciliation burden per product is inherently larger. Cross-border trade multiplies the problem, since a product sold across several member states carries several label versions with the same underlying formulation. German and Dutch manufacturers have been earliest to quantitative assessment, partly because free-from product ranges are commercially significant there. Growth at 14.0% is the slowest anywhere, reflecting a base that started adopting earlier rather than any lack of regulatory pressure. Free-from retail ranges are more developed here than anywhere, which turns precautionary label removal into a listing decision with direct revenue consequences.
Share: 26% | CAGR: 14.0% (2026 to 2036)
Regional intelligence for 5 additional markets available in the complete report: East Asia, South Asia and Pacific, Latin America, Middle East and Africa, Eastern Europe. Contact sales@marketmindsadvisory.com.
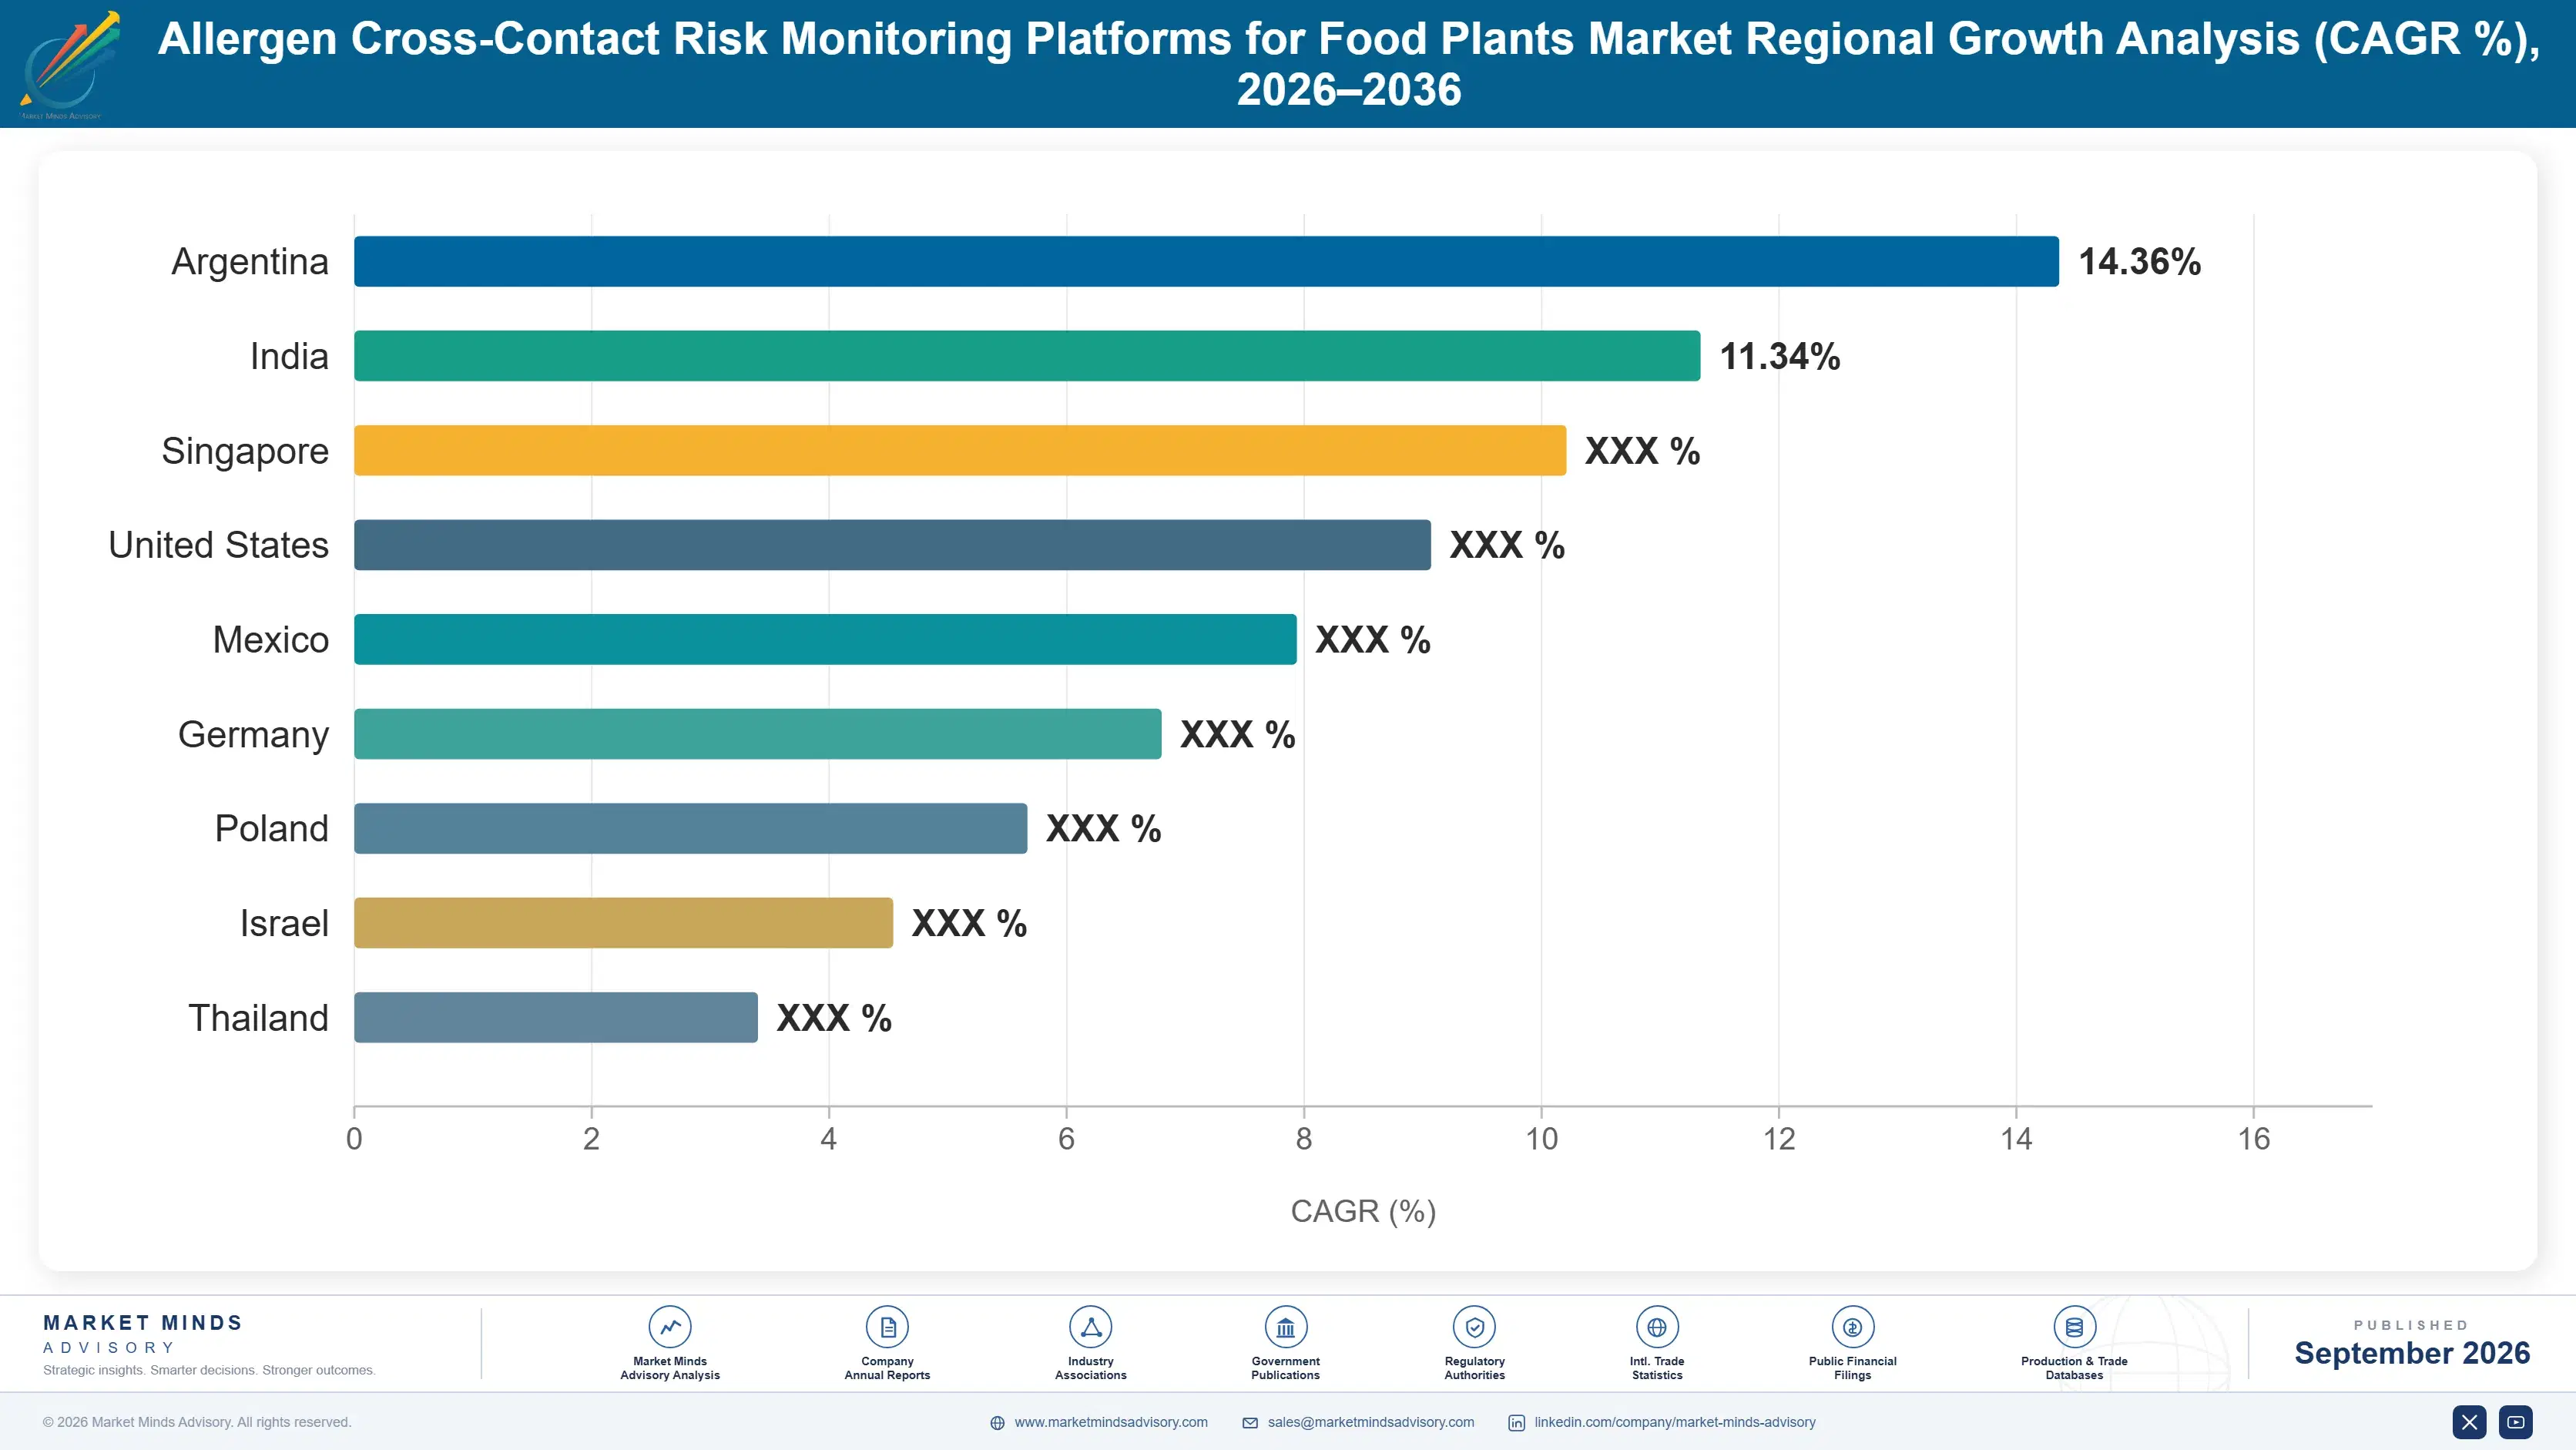
allergen-cross-contact-risk-monitoring-platforms-f-country-cagr-analysis-1788425148505

Selling Prevention to the Operations Budget

Quality budgets are small, slow and defended against, while operations budgets fund anything that shortens a changeover. Every commercially successful platform in this market has found a way to be bought by operations and used by quality, which is a positioning decision rather than a product one. The product hardly matters if the wrong budget is asked.

Attach to Changeover Downtime, Not Risk Avoidance

Sanitation verification consumes about 47 minutes per changeover and a plant running eight changeovers a day loses most of a shift to it, which operations will pay to recover without a business case debate. Platforms cutting verification time by roughly 30% while binding the record to the next scheduled product deliver the control benefit as a consequence rather than as the pitch. Quality gets the system it could not fund. Vendors leading with recall prevention are selling to the budget least able to say yes. The pitch and the benefit are deliberately different things.
Market Impact: Cuts changeover verification time by roughly 30% overall

Remove Precautionary Labels to Open Retail Listings

A may contain statement excludes the free-from consumer entirely and restricts listings with retailers running dedicated allergen ranges, which turns label removal into a revenue argument rather than a compliance one. Quantitative assessment against published reference doses can remove statements from a meaningful share of the roughly 31% of products carrying them. Manufacturers recovering listings report category revenue gains around 7%. That framing reaches commercial leadership, who fund things quality teams cannot. Retailers running dedicated allergen ranges treat a supporting assessment as listing evidence rather than as paperwork, which is why the argument travels beyond the quality function entirely.
Market Impact: Lifts category revenue by roughly 7% on average

Ingest Supplier Declarations Automatically Into One Record

Suppliers issue about 2.8 specification revisions each year and send them by email in whatever format suits them, addressed to whoever they happen to know at the manufacturer. Platforms that ingest, parse and compare declarations against approved specifications catch changes that manual reading misses at scale, and the failure they prevent is the hardest one to detect otherwise. Implementation effort falls almost entirely on the vendor rather than the customer, which shortens sales cycles by roughly 40%. It is the easiest function to sell and the least contested commercially. Nobody argues about whether this one is needed.
Market Impact: Shortens the sales cycle by roughly 40% typically

Sell Carryover Studies Before Selling Software

Quantitative assessment needs carryover mass, batch sizes and residue distribution data that almost no plant holds, which stalls the fastest-growing segment at implementation rather than at purchase. Vendors offering standardised carryover studies as a paid first engagement remove the barrier, earn revenue before the licence and produce the dataset their own platform then runs on. Study engagements convert to platform subscriptions at roughly 3 times the rate of cold software proposals. Few vendors have built the field capability this requires. Testing houses hold this capability already and software vendors have to acquire or build it.
Market Impact: Converts at roughly 3 times the usual rate

Who Controls the Margin Pool

Concentration sits near 29% across the top five on measured platform and associated service revenue, the most fragmented picture anywhere in food safety software. Three different kinds of company sell into the same problem: workflow software vendors, testing and certification houses extending upstream from laboratory work, and sanitation chemical suppliers attaching software to consumable programmes. None has the complete answer, so buyers run several systems that do not speak to one another.
Competition runs on three dimensions. Integration with plant scheduling and enterprise resource planning systems is first, since the value comes from connecting records that currently sit apart. Second is allergen domain depth, particularly the ability to run quantitative assessment against published reference doses rather than merely storing test results. Third is field capability to perform the carryover studies that quantitative assessment requires before any software becomes useful.

Two pressures will reshape positions. Quantitative assessment is becoming the function that differentiates, and it favours suppliers with laboratory and field science capability over pure software vendors. Meanwhile large quality management platform vendors are adding allergen modules, which threatens specialists on breadth while rarely matching depth. Rankings will move toward participants combining domain science with workflow software rather than either alone.
allergen-cross-contact-risk-monitoring-platforms-f-company-positioning-matrix-1788425149031

Competitive Moat and Risk Dimensions

SAFETYCHAIN SOFTWARE

Moat: Plant floor workflow depth

SafetyChain is built around plant floor execution rather than document management, which matters because allergen failures happen during changeover and rework rather than in filing. Its integration with production scheduling connects sanitation verification to what a line is about to run. Operations teams adopt it for downtime reduction, which gets it funded from budgets quality teams cannot access.
SAFETYCHAIN SOFTWARE

Risk: Limited laboratory science capability

The fastest-growing function at 23.4% is quantitative cross-contact assessment, which requires carryover studies and residue science rather than workflow configuration. Testing houses hold that capability natively and software vendors must acquire or partner for it. As buyers move from recording controls toward justifying labels, the competitive ground shifts toward scientific depth the company does not currently own.
NEOGEN

Moat: Test and data combination

Neogen supplies both the rapid allergen tests plants run and the systems capturing those results, which gives it a position no pure software vendor can assemble quickly. Its laboratory science supports quantitative assessment directly rather than through partnership. Consumable revenue creates continuous customer contact that software vendors have to manufacture through account management instead.
NEOGEN

Risk: Consumable business gravity

The company's economics rest on test consumables, and quantitative risk assessment logically reduces testing volume by establishing that certain lines do not require routine verification at all. Selling the analysis that shrinks the consumable base requires a commercial discipline few organisations manage well. Workflow integration with plant scheduling systems is also less developed than dedicated software vendors offer.

Players Tracked

Prominent Players

SafetyChain Software
TraceGains
Neogen
Eurofins Scientific
Intelex

Other Key Players

Romer Labs
Hygiena
Charm Sciences
SGS
Bureau Veritas
Intertek
LGC Group
Sparta Systems
Rockwell Automation
Siemens
AspenTech
Ecolab
Diversey
Kersia
FoodLogiQ

Recent Developments

MARCH 2025

Manufacturers begin removing precautionary statements after quantitative assessment

Several packaged food producers withdrew may contain warnings from product ranges following carryover studies and reference dose calculations showing residual exposure below action levels. Retailers with dedicated free-from ranges accepted the assessments as listing evidence, which opened category positions previously closed. Category positions had been closed for years.
Signal: Label removal is becoming a revenue argument rather than a compliance exercise, which changes who funds the work.
AUGUST 2025

Quality platform vendors add allergen-specific modules to broader suites

Established quality management software suppliers extended their offerings with allergen matrices, changeover verification and specification comparison functions, competing with specialists on breadth. The modules generally record controls rather than performing the quantitative assessment that specialists provide. Buyers rarely test that difference during selection, and discover it afterwards.
Signal: Breadth competition arrives before depth competition, and buyers frequently discover the difference only after an implementation has finished.
NOVEMBER 2025

Testing houses extend from laboratory services into risk assessment platforms

Laboratory and certification companies launched platform offerings combining test result capture with carryover study services and reference dose calculation, moving upstream from analysis into the decision the analysis supports. Field science capability rather than software was the stated differentiator. The move puts them in direct competition with workflow specialists.
Signal: Scientific capability is becoming the competitive dimension as buyers move from recording controls to justifying labels.

What Delivery Actually Costs

Cost structure is dominated by implementation labour rather than by software development. Configuration, plant floor integration and validation together account for roughly 54% of first-year contract value, since every plant runs different scheduling systems, line layouts and rework practices. Carryover studies and field science add a further block for vendors offering quantitative assessment. Hosting and platform engineering are small and behave like any subscription software business.
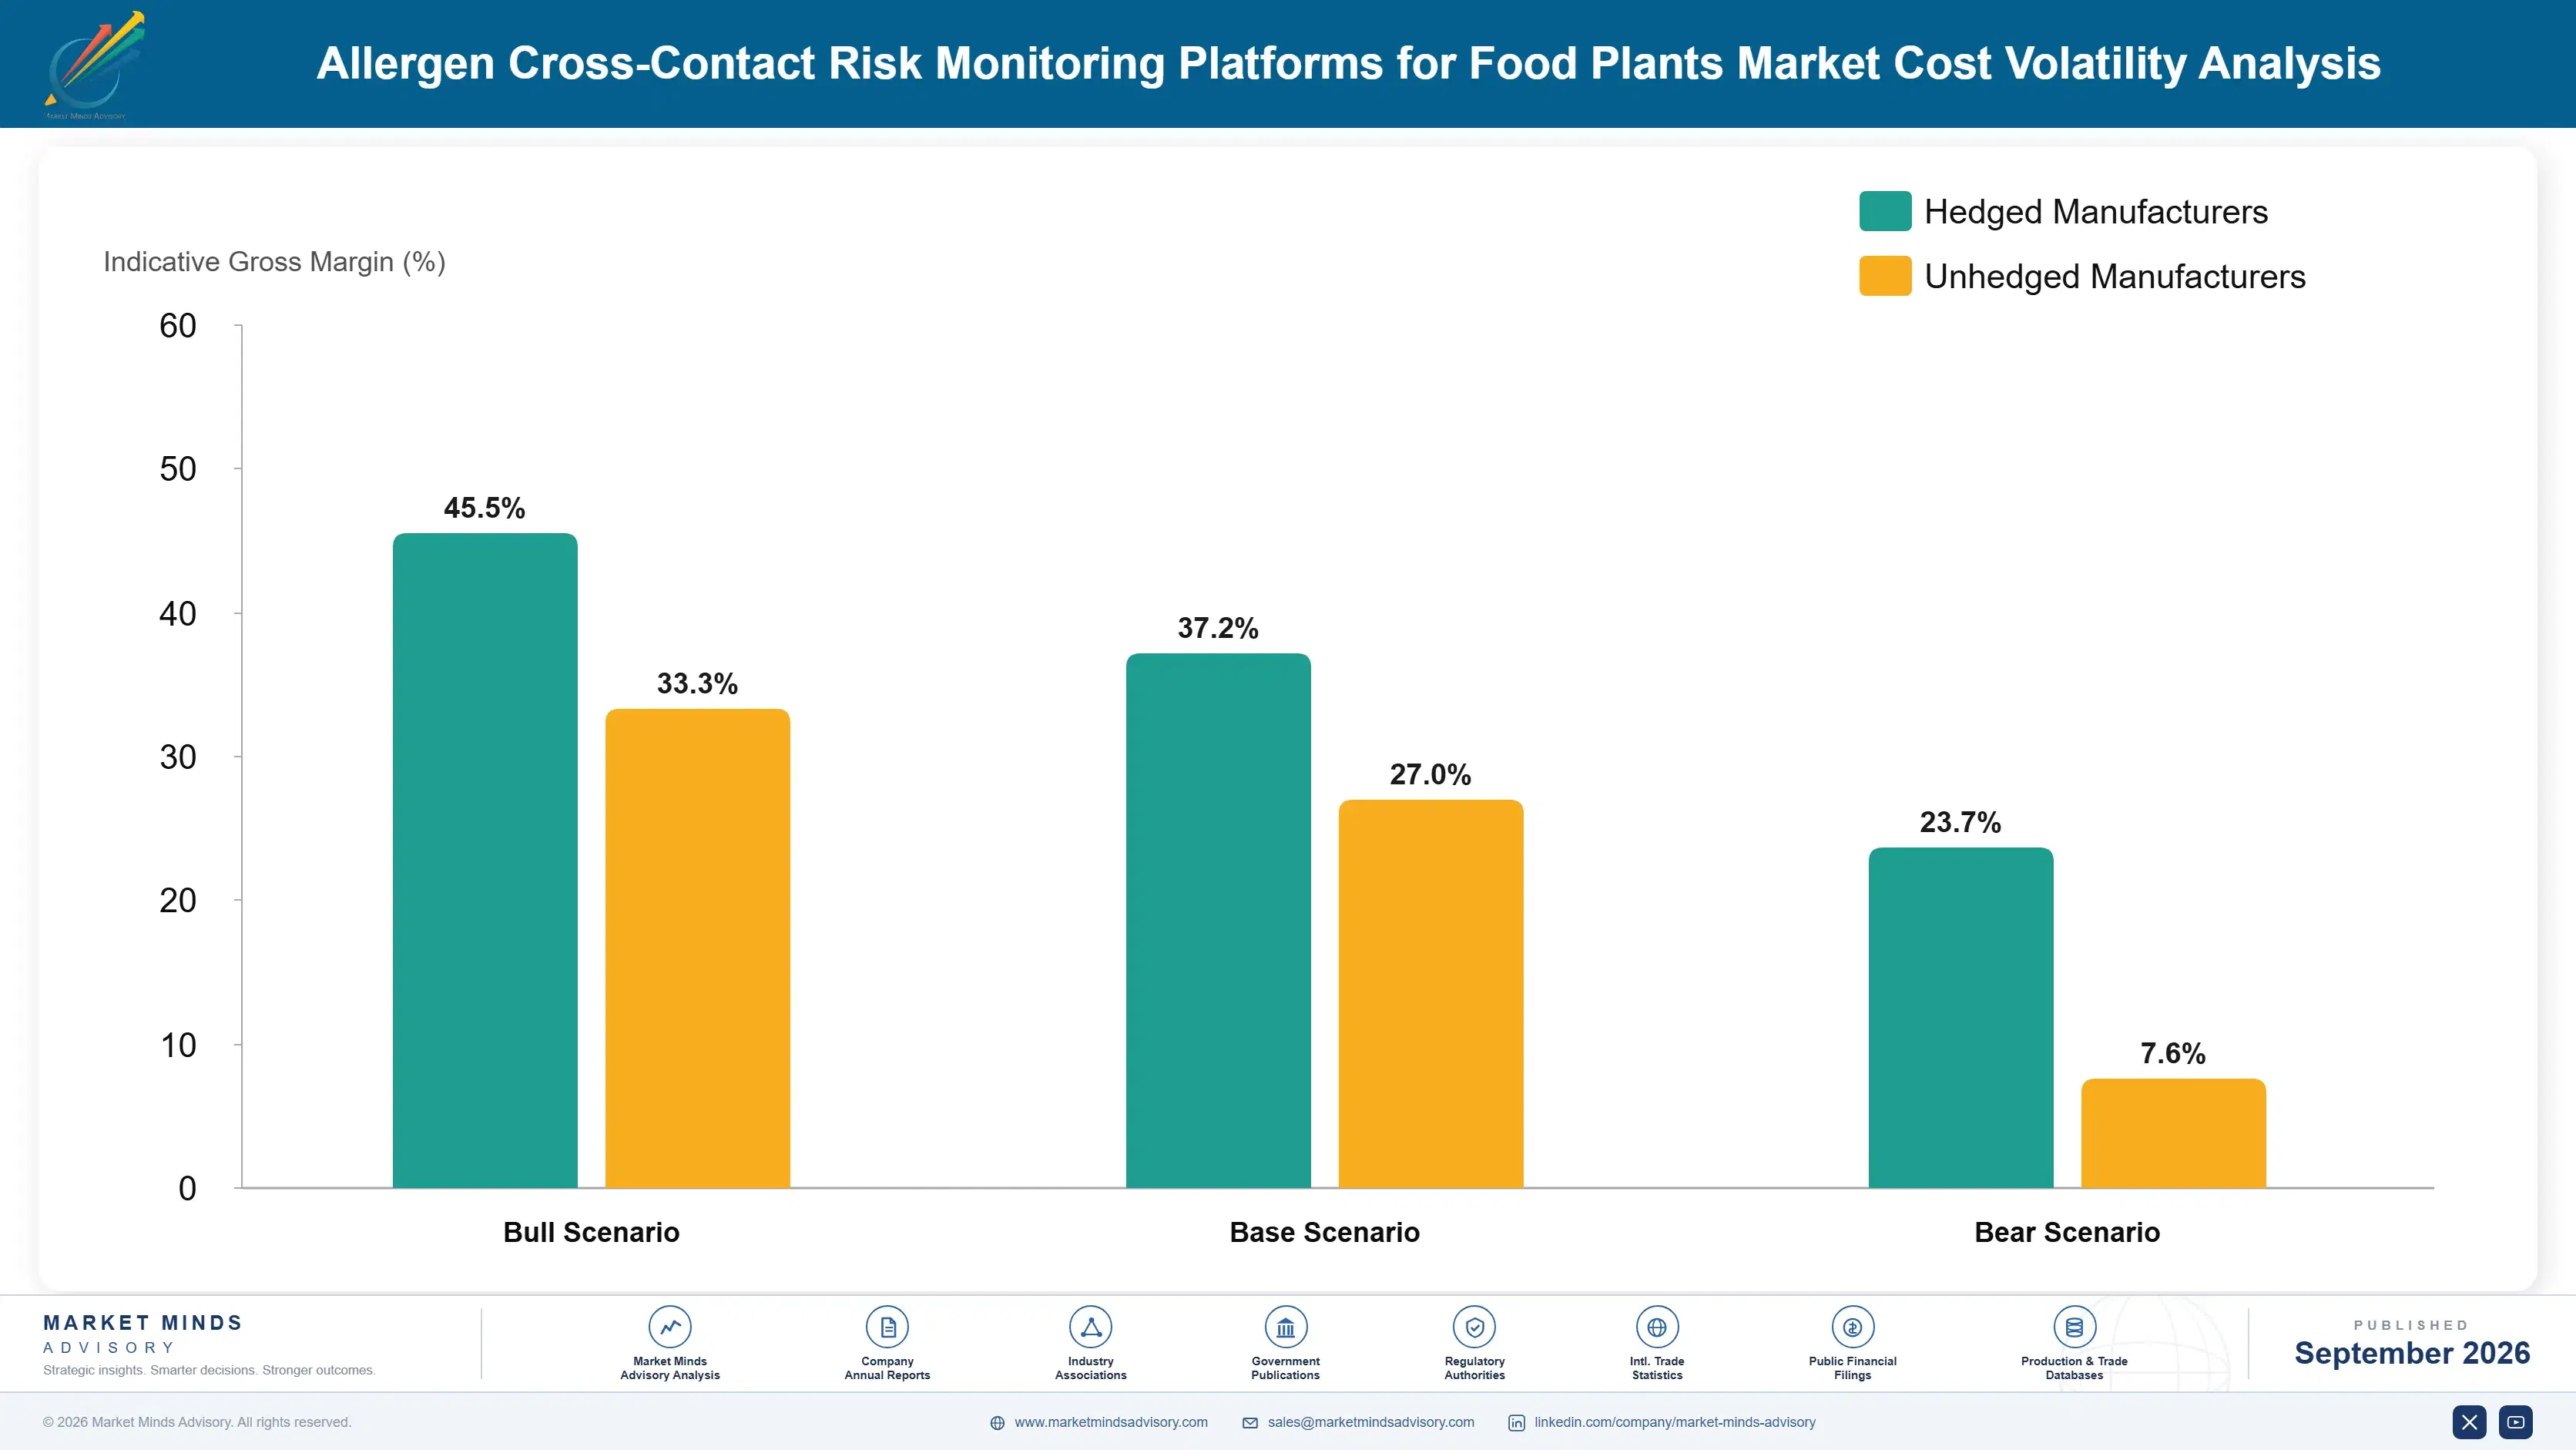
Skilled implementation labour has been the sharpest pressure. People who understand both food plant operations and data integration are scarce, and demand for them rose through 2024 and 2025 as adoption widened beyond early buyers. Neogen and Eurofins Scientific both referenced personnel and service delivery cost conditions in recent annual reporting. Vendors absorbed most of it, because implementation fees are compared against competitors during selection and cannot be raised mid-cycle.

Exposure varies by delivery model rather than by size. Vendors implementing directly carry the full labour cost and control quality of outcome. Those delivering through partners transfer cost and accept variable results that surface as churn later. Vendors offering carryover studies carry field science staff who are scarcer still, though that capability wins the fastest-growing segment. Pure subscription models scale best and deliver least.
allergen-cross-contact-risk-monitoring-platforms-f-cost-volatility-analysis-1788425149225

Standardise integration connectors for common plant systems

Most implementation labour goes into connecting the same handful of scheduling and enterprise systems repeatedly, engineered fresh each time because no two plants configured theirs alike. Prebuilt connectors with defined mapping cut that effort by roughly 40% and shorten time to value, which matters commercially because slow implementations generate churn. The engineering investment is modest against the labour it removes.

Package carryover studies as a standard priced engagement

Quantitative assessment stalls because plants lack carryover data, and bespoke study design makes every engagement expensive and slow to quote. A standardised study protocol with defined sampling and conservative default assumptions produces defensible answers at predictable cost. It also builds the field science team's utilisation, which otherwise sits idle between bespoke projects and becomes difficult to justify retaining.

Train customer staff to run recurring assessments internally

Reference dose calculations recur whenever a formulation, line or supplier changes, and vendor-delivered assessment each time consumes scarce specialist labour on repetitive work. Training customer quality teams to run routine cases internally reserves specialists for genuinely complex ones. Customers value the capability transfer, and vendors worried about losing service revenue generally find retention improves enough to more than compensate.

Portfolio Architecture for Margin Defence

Margin architecture separates on whether the offering is software or expertise. Record capture and workflow functions behave like subscription software once implemented, earning software margins on modest contract values because buyers compare them against general quality platforms. Quantitative assessment and carryover studies earn professional service margins on higher values, and they are what differentiate a supplier rather than what fills a feature comparison.
The tension runs between scalability and defensibility. Pure subscription models scale cleanly, implement quickly and get commoditised by larger quality platform vendors adding allergen modules. Science-heavy offerings resist that competition entirely, since a general software vendor cannot perform a carryover study, yet they consume scarce specialist labour and scale with headcount rather than with licences. Suppliers that do only one of the two are exposed in opposite directions.

High-value revenue concentrates in quantitative risk assessment and in the recurring reassessment work that follows every formulation, line or supplier change. That recurrence is what makes the science offering an annuity rather than a project. Workflow subscription provides the plant floor presence and the data that assessment then uses, so neither part works nearly as well without the other alongside it.

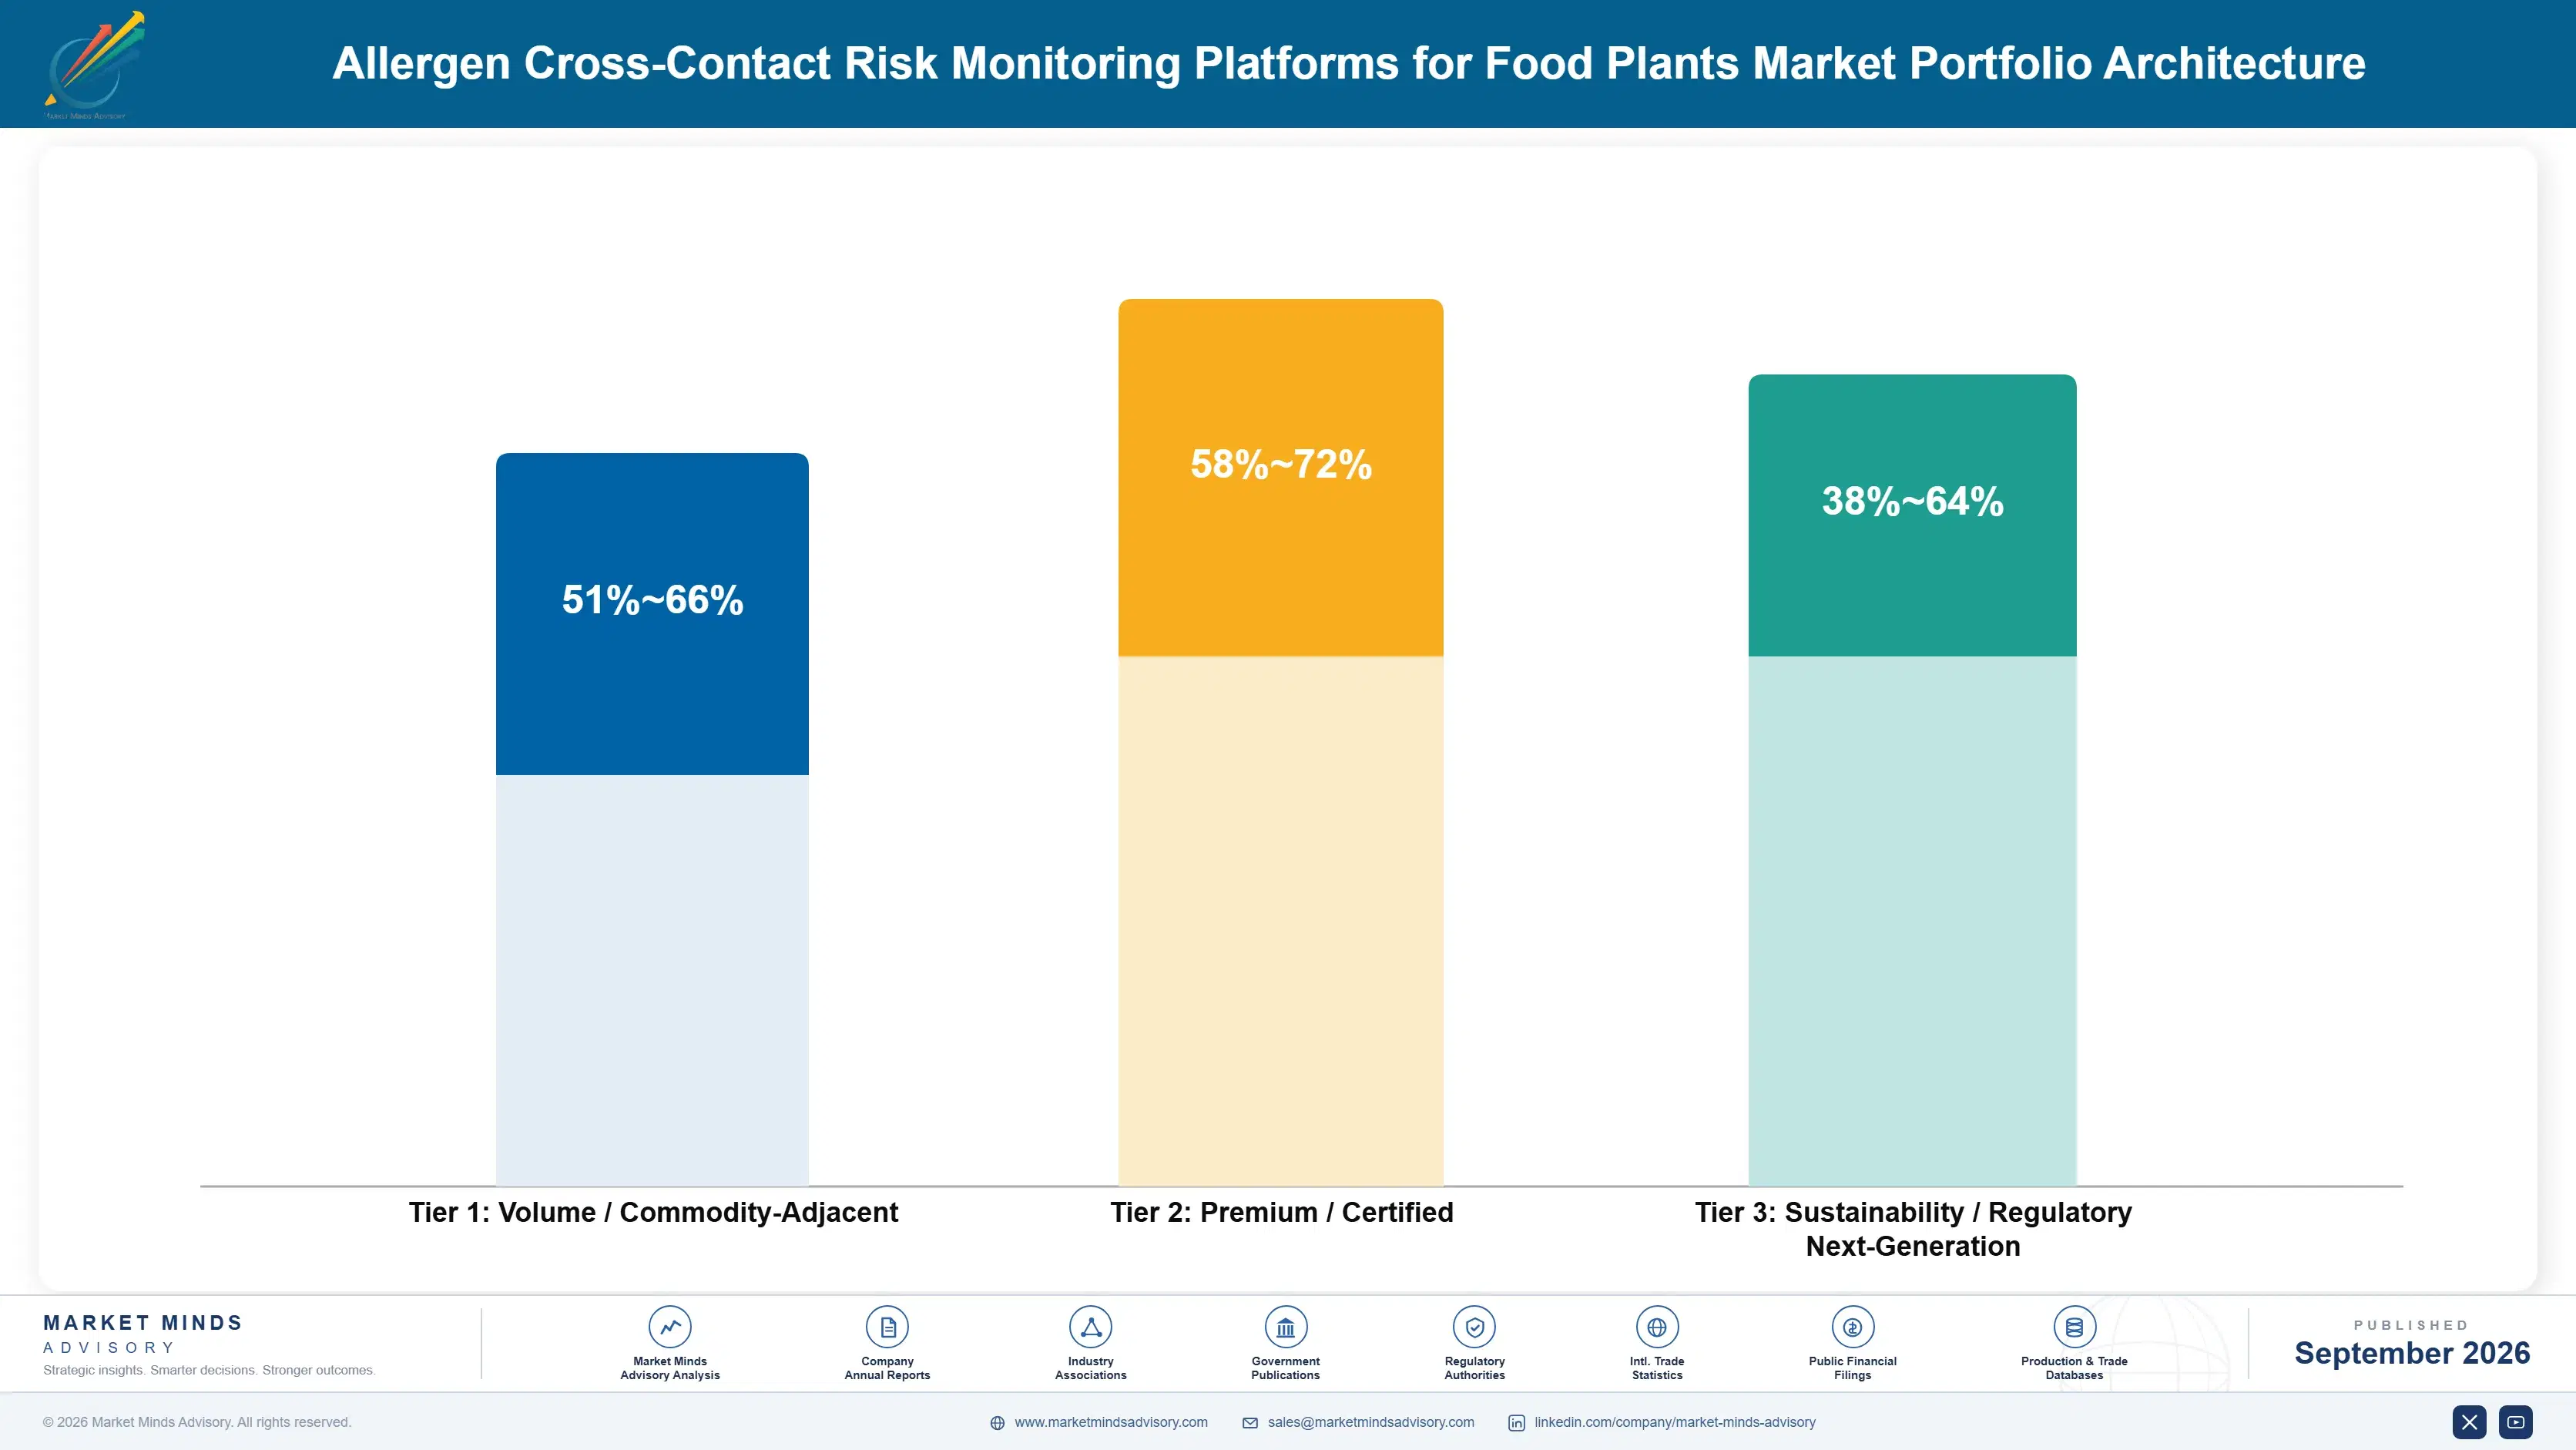
Volume / Commodity-Adjacent

Test result capture, record management and basic workflow subscription sold against general quality platforms. The range reflects implementation effort recovered against contract value. Larger quality software vendors compete here directly and increasingly on price rather than function.
Gross Margin: 51-66%

Premium / Certified

Changeover workflow integrated with production scheduling, label and formulation reconciliation, and supplier declaration ingestion. Margin depends on how much integration is standardised through prebuilt connectors. These functions are defensible on integration depth rather than on science.
Gross Margin: 58-72%

Sustainability / Regulatory / Next-Generation

Quantitative cross-contact assessment, carryover studies and reference dose calculation delivered by field science staff. The widest range in the portfolio, reflecting utilisation of scarce specialists and study standardisation. Lower margin than software and considerably harder to displace.
Gross Margin: 38-64%
allergen-cross-contact-risk-monitoring-platforms-f-portfolio-architecture-1788425149721

High-value Sub-segments and Strategic Watch-out

Quantitative Risk Assessment Services

High value with the fastest growth at 23.4%, recurring whenever a formulation, line or supplier changes and defended by field science capability software vendors lack. The range reflects specialist utilisation between engagements. It converts label removal into a revenue argument commercial leadership will actually fund.
Gross Margin: 40-64%

Label and Formulation Reconciliation

High value with strong growth at 18.2%, catching the superseded specification error that ends most undeclared allergen recalls. The range reflects artwork system integration complexity by customer. It runs cheaply once configured and sits in a gap that quality, marketing and packaging suppliers each assume somebody else owns.
Gross Margin: 62-74%

Test Result Capture and Workflow

The volume core, providing the plant floor presence and data that higher-value functions depend upon. The range reflects implementation recovery against contract value. General quality platform vendors compete here on breadth, which makes it the part of the portfolio most exposed to price pressure. That is the trade.
Gross Margin: 50-65%

Standalone Compliance Documentation

The strategic watch-out, digitising paper records without connecting them to scheduling, labels or suppliers. It satisfies auditors, changes no plant behaviour and competes against general document management at general document prices. Several vendors still lead with it because it is the easiest thing to demonstrate.
Gross Margin: 0-22%

Why This Spend Recurs

Recurrence comes from change rather than from usage. A formulation revision, a new line, a supplier substitution or a packaging update each invalidates a prior assessment and triggers new work, which happens continuously in any manufacturer running a real catalogue. Workflow subscription recurs annually in the ordinary way. Assessment services recur unpredictably and in aggregate steadily, which makes them behave like an annuity despite being sold as projects.
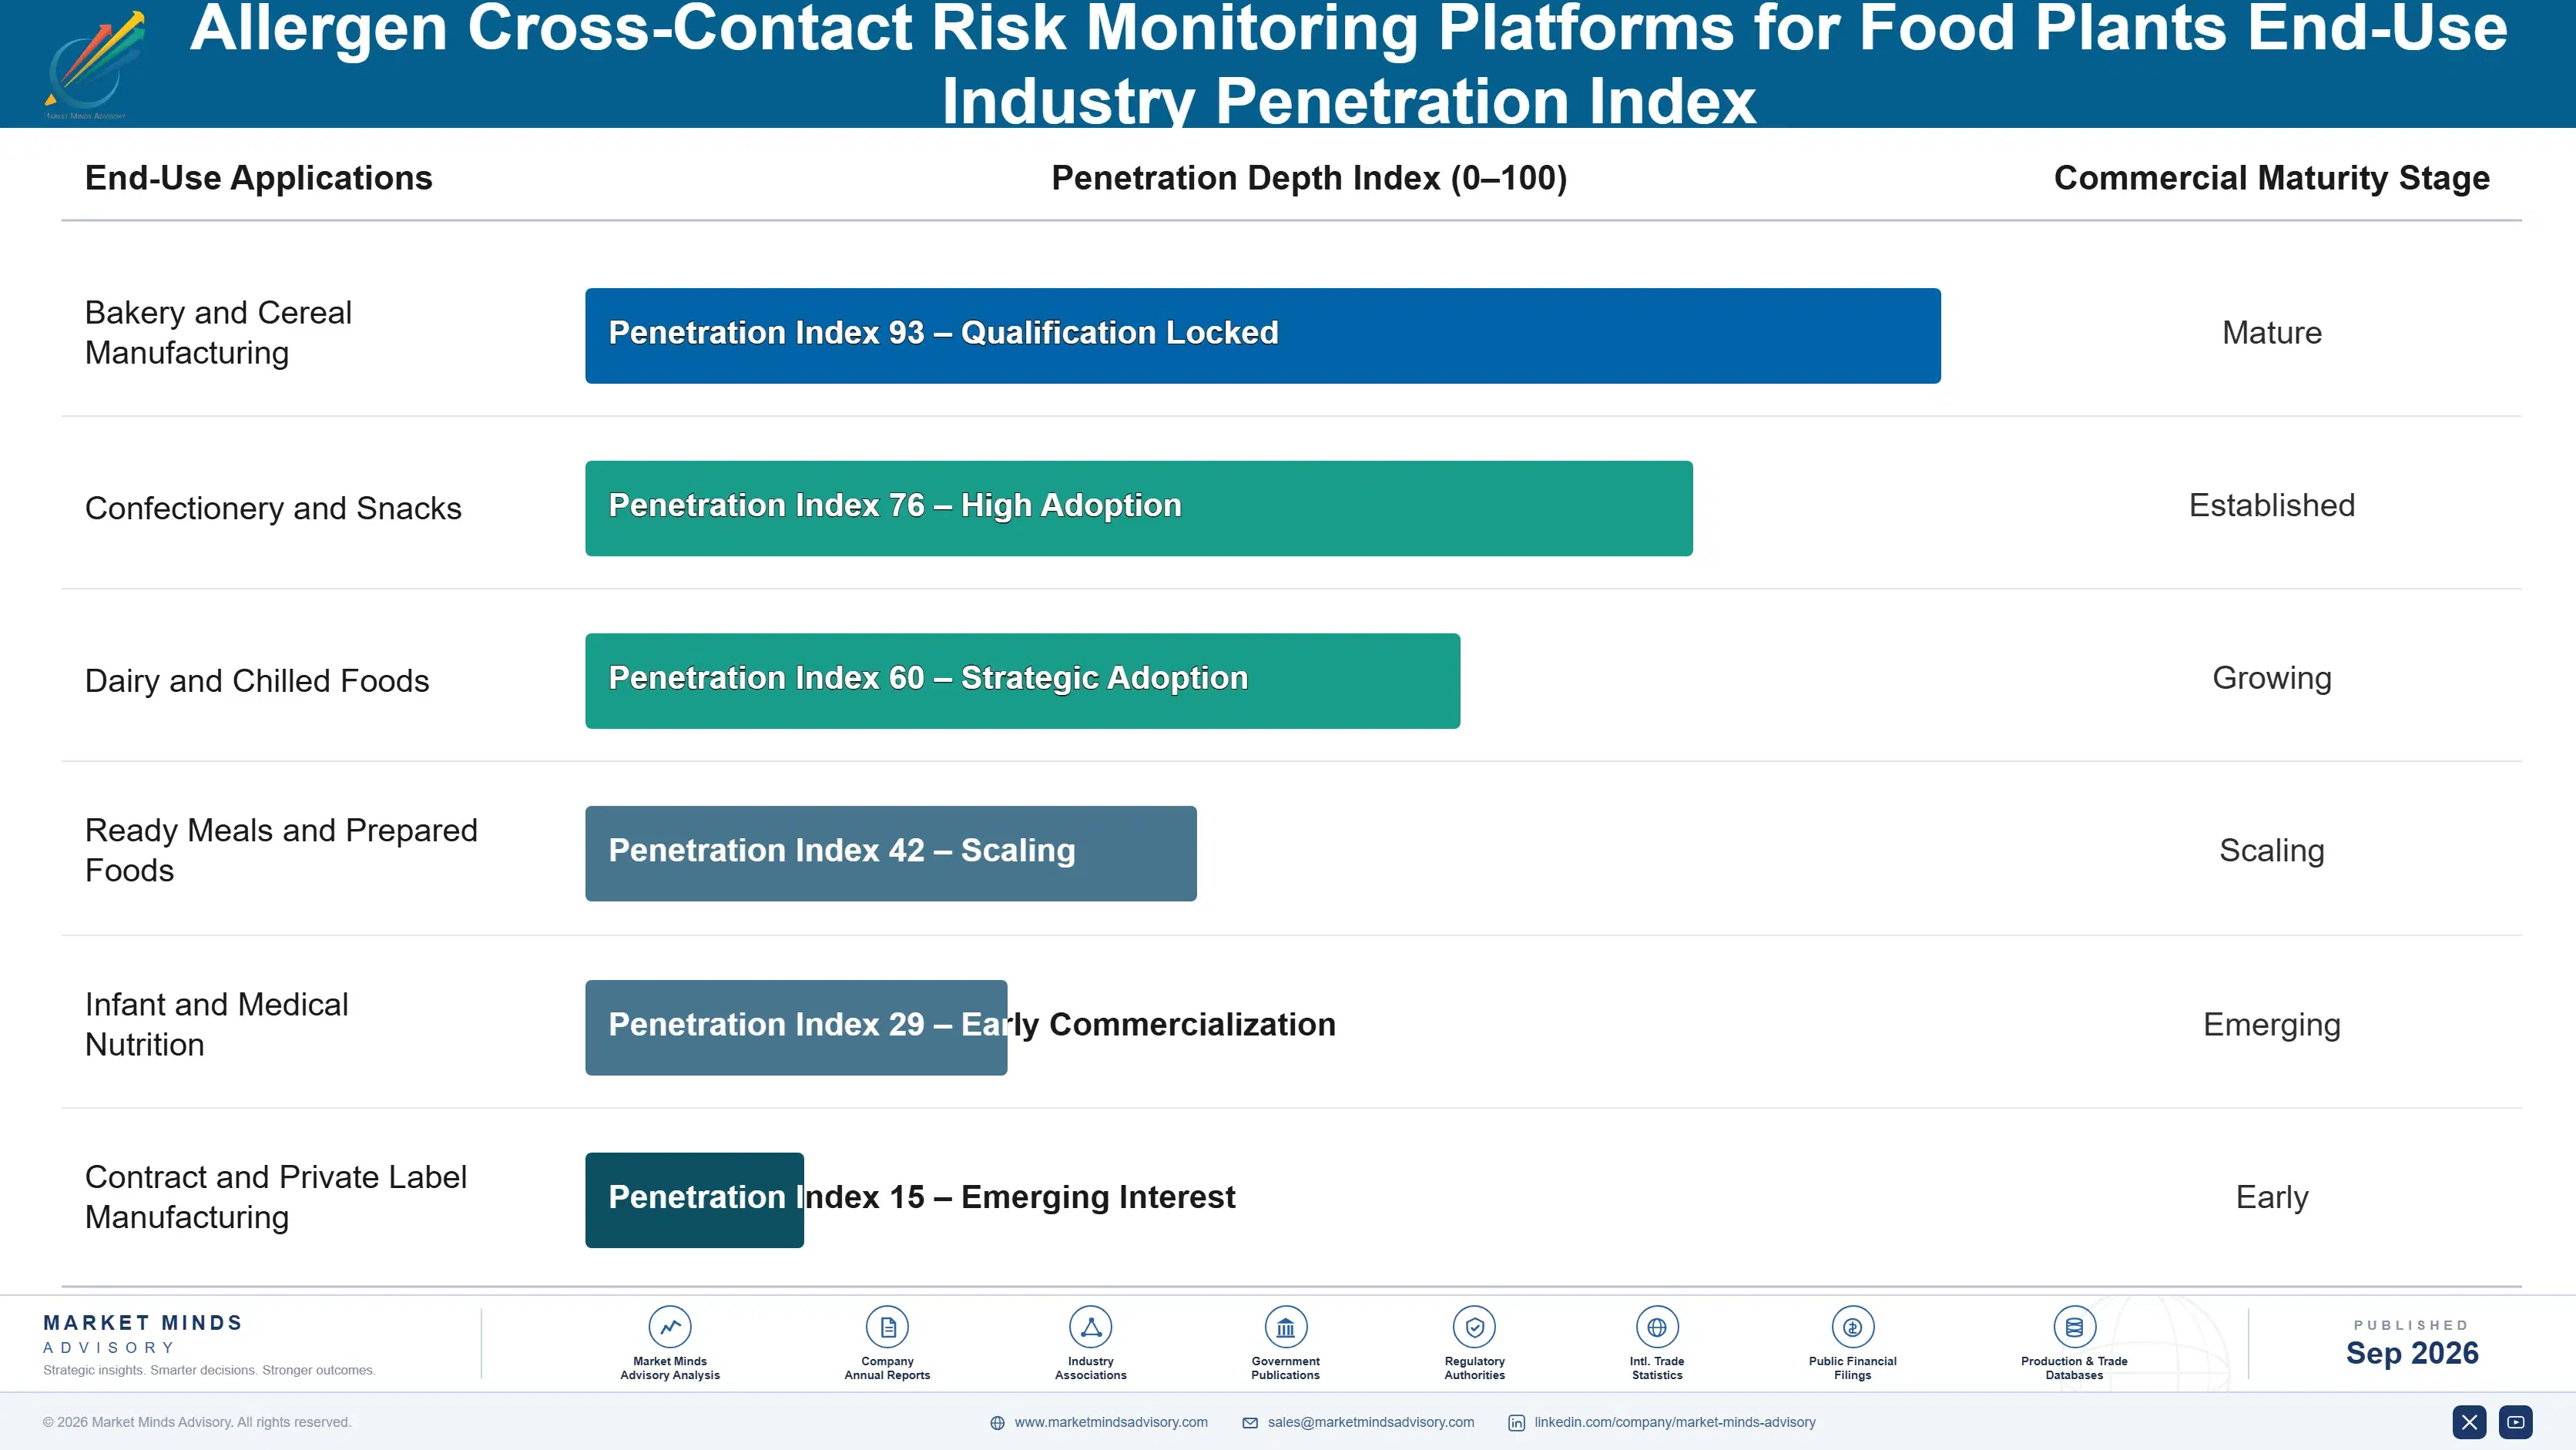
Adoption depth varies more by plant than by company. A site running dedicated lines for allergen-containing products needs comparatively little, since segregation does the work. A site running shared lines with frequent changeovers and heavy rework needs everything the platform offers and uses it every shift. Contract manufacturers sit deepest of all, because they run other companies' formulations on shared assets and carry the liability for both.

The buyer has moved upward inside the organisation. Allergen management was a quality manager's concern purchased from a quality budget, which is why adoption stayed slow for years. Recall costs near USD 9.4 million, sesame reassessment and litigation exposure moved the decision toward operations and commercial leadership. Vendors still presenting to quality managers address the person who wants the system and cannot authorise it.
allergen-cross-contact-risk-monitoring-platforms-f-end-use-penetration-index-1788425150214

Where This Market Rewards

These are among the four positions where our research anticipates prominent divergence between winners and laggards over the coming forecast period. Each is grounded in the demand model, the regulatory perimeter, and the announced capacity pipeline.
01 / OPERATIONS BUDGET POSITIONING

Get bought by operations, get used by quality

Quality budgets are small and defended, while operations funds anything that recovers line time without extended debate about probability or hypothetical events. Sanitation verification consumes roughly 47 minutes per changeover, and a platform cutting that by around 30% while binding the record to the next scheduled product delivers allergen control as a consequence rather than as the pitch to operations. Vendors leading with recall prevention are addressing the budget least able to approve them, which shows plainly in their sales cycles and their win rates.
02 / LABEL REMOVAL ECONOMICS

Frame assessment as revenue, never as compliance

A precautionary statement excludes free-from consumers entirely and blocks listings with retailers running dedicated allergen ranges, so removing one is a commercial gain rather than a regulatory improvement anybody notices. Quantitative assessment against published reference doses can clear statements from a meaningful share of the roughly 31% of products carrying them, and manufacturers recovering listings report category revenue gains near 7% within a year. That framing reaches commercial leadership, who fund work that quality teams have requested unsuccessfully for years on end.
03 / FIELD SCIENCE CAPABILITY

Build carryover study capability or forfeit the growth

Quantitative assessment grows at 23.4% and stalls at implementation rather than at purchase, because plants hold none of the carryover, batch and residue data the calculation needs in any usable form. Vendors offering standardised studies as a paid first engagement earn revenue before the licence and produce the dataset their platform then runs on, converting at roughly 3 times the rate of cold software proposals sent to the same accounts. Pure software vendors must acquire or partner for capability that testing houses already hold natively.
04 / INTEGRATION OVER DOCUMENTATION

Connect the records rather than digitising them

Almost every undeclared allergen recall traces to records that were individually correct and never compared: a sanitation log, a production schedule, a supplier declaration and a print file sitting in four separate systems that nobody reconciles. Digitising any one of them satisfies auditors and changes no plant behaviour whatsoever, which is why documentation-only offerings earn general document management margins and nothing better. The commercial value sits entirely in the connections, and buyers discover that distinction only after an implementation has finished and a recall happens anyway.

Engagement Snapshot From the Field

A live engagement with an industry participant carrying material or product regulatory and market exposure ahead of a defining policy shift, showing how our research translates into a defensible multi-year portfolio strategy.
MARKET MINDS ADVISORY · CLIENT ENGAGEMENT SUMMARY
Allergen Cross-Contact Risk Monitoring Platforms for Food Plants Producer Strategic Portfolio Review and Transition Roadmap 2026·Investment Scenario on Allergen Cross-Contact Risk Monitoring Platforms for Food Plants Exposure Evaluation 2025-26
CLIENT PROFILE
A contract food manufacturer running approximately 640 formulations for 38 brand owners across four plants (client-reported, unverified by MMA), with shared lines, frequent changeovers and substantial rework. Precautionary allergen statements appeared on roughly 44% of products, well above category norms, and several brand owner customers had begun questioning whether the warnings were justified. Nobody could answer them.
STRATEGIC CHALLENGE
Two brand owners had threatened to move volume unless precautionary statements were removed, since the warnings blocked their products from retailer free-from ranges. The client had no basis for removing them and no data to justify keeping them. An undeclared allergen incident eighteen months earlier had cost approximately USD 6.2 million (client-reported, unverified by MMA).
MMA APPROACH
MMA assessed the control programme against where failures actually originate rather than against audit requirements, which the client passed consistently. We reviewed changeover records against production schedules, traced rework routing, interviewed 19 plant and quality staff, and examined supplier declaration handling. Carryover measurement gaps were mapped before any platform options were considered at all.
KEY FINDINGS
  1. Precautionary statements on roughly 44% of products had been applied by default, with no carryover measurement supporting any of them at any site.
  2. Rework was routed by production supervisors without any systematic check against the allergen profile of the receiving line, which had caused the earlier incident.
  3. Supplier declarations arrived by email to three different departments and were reconciled against approved specifications only during annual audit preparation, once each year.
  4. Changeover verification consumed about 52 minutes per event across roughly nine daily changeovers, absorbing more line time than any other non-production activity.
CLIENT PROFILE
A contract food manufacturer running approximately 640 formulations for 38 brand owners across four plants (client-reported, unverified by MMA), with shared lines, frequent changeovers and substantial rework. Precautionary allergen statements appeared on roughly 44% of products, well above category norms, and several brand owner customers had begun questioning whether the warnings were justified. Nobody could answer them.
STRATEGIC CHALLENGE
Two brand owners had threatened to move volume unless precautionary statements were removed, since the warnings blocked their products from retailer free-from ranges. The client had no basis for removing them and no data to justify keeping them. An undeclared allergen incident eighteen months earlier had cost approximately USD 6.2 million (client-reported, unverified by MMA).
MMA APPROACH
MMA assessed the control programme against where failures actually originate rather than against audit requirements, which the client passed consistently. We reviewed changeover records against production schedules, traced rework routing, interviewed 19 plant and quality staff, and examined supplier declaration handling. Carryover measurement gaps were mapped before any platform options were considered at all.
KEY FINDINGS
  1. Precautionary statements on roughly 44% of products had been applied by default, with no carryover measurement supporting any of them at any site.
  2. Rework was routed by production supervisors without any systematic check against the allergen profile of the receiving line, which had caused the earlier incident.
  3. Supplier declarations arrived by email to three different departments and were reconciled against approved specifications only during annual audit preparation, once each year.
  4. Changeover verification consumed about 52 minutes per event across roughly nine daily changeovers, absorbing more line time than any other non-production activity.
RECOMMENDED STRATEGY
Phase 1: Commission standardised carryover studies across the four plants before selecting any platform, since the assessment data gap blocks everything downstream. Phase 2: Implement changeover workflow bound to the production schedule first, funding it from line time recovery rather than from the quality budget. Phase 3: Centralise supplier declaration ingestion into a single reconciled specification record, removing the three-department handling that had caused repeated version conflicts across all four sites.
OUTCOME
Carryover studies supported removing precautionary statements from about 61% of the products carrying them (client-reported, unverified by MMA), and both brand owners retained their volume. Changeover verification fell to roughly 34 minutes, recovering line time that funded the programme, and rework routing became a controlled step rather than a supervisor decision.

Frequently Asked Questions

Foundational context covering the market sizes, CAGR, scope, country, region and competition that inform every finding below. This section is provided to cover basics and most often pre-purchase conversations, answered from the MMA Primary Research Dataset.

What is the current size of the Allergen Cross-Contact Risk Monitoring Platforms for Food Plants Market?

The market was worth USD 0.7 billion in 2025 and reaches USD 0.81 billion in 2026. Undeclared allergens cause roughly 38% of food recalls across major markets.

How large will the Allergen Cross-Contact Risk Monitoring Platforms for Food Plants Market be by 2036?

MMA forecasts USD 3.45 billion by 2036, an expansion of 4.26 times over the forecast period. That represents USD 2.64 billion of incremental annual revenue against 2026.

What is the CAGR for the Allergen Cross-Contact Risk Monitoring Platforms for Food Plants Market 2026 to 2036?

The base case is 15.6% compound annual growth, with a bull case at 16.8% and a bear case at 14.3%. Regulatory expectation around quantitative assessment separates the scenarios.

Which segment is growing fastest?

Quantitative cross-contact risk assessment grows at 23.4%, half again the market rate of 15.6%. Published reference doses turned precautionary labelling from an instinct into a calculation with a defensible answer.

Who are the major companies in the Allergen Cross-Contact Risk Monitoring Platforms for Food Plants Market?

SafetyChain Software, TraceGains, Neogen, Eurofins Scientific and Intelex lead on measured platform and service revenue. Together they hold roughly 29%, the most fragmented picture in food safety software.

Which country is growing fastest?

Australia grows fastest at 18.6%, because the Allergen Bureau VITAL programme made quantitative cross-contact assessment routine there years before other markets took it up at all.

Report Segmentation Architecture

The full report scope spans multiple orthogonal segmentation dimensions, with cross-tabulated demand data provided for each dimension pair. Coverage extends further to regional breakdowns, trend trajectories, and the competitive detail needed to support segment-level decision-making.

By Primary Market Dimension

  • Sanitation Verification and Changeover Workflow
  • Quantitative Cross-Contact Risk Assessment
  • Rapid Test Result Capture and Trending
  • Label and Formulation Reconciliation
  • Supplier Ingredient Declaration Management
  • Inline and Environmental Sensing Integration

By End-Use Industry

  • Bakery and Cereal Manufacturing
  • Confectionery and Snacks
  • Dairy and Chilled Foods
  • Ready Meals and Prepared Foods
  • Infant and Medical Nutrition
  • Contract and Private Label Manufacturing

By Commercial Dimension

  • Enterprise Multi-Site Programmes
  • Single Plant Subscriptions
  • Assessment and Study Services
  • Brand Owner Mandated Deployments
  • Retailer Audit Driven Purchases
  • Testing Provider Bundled Offerings

By Region

  • North America
  • Western Europe
  • East Asia
  • South Asia and Pacific
  • Latin America
  • Middle East and Africa
  • Eastern Europe

Scope, Methodology, and Coverage

Every figure in this report is reproducible from documented input assumptions. The scope below maps the historical period, the forecast horizon, the segmentation dimensions, and the countries covered, alongside the underlying primary and qualitative methodology.
Historical Period
2020 to 2025
Forecast Period
2026 to 2036
Base Year
2025 (USD billions; MMA Primary Research Dataset, September 2026)
Market Definition
This market covers software platforms and integrated monitoring systems that manage allergen cross-contact risk within food manufacturing plants, spanning sanitation verification and changeover workflow, quantitative cross-contact risk assessment, rapid test result capture and trending, label and formulation reconciliation, supplier ingredient declaration management, and inline and environmental sensing integration. Revenue is measured as platform licence, subscription and attributable implementation and assessment service value at supplier level. Laboratory testing services sold standalone, sanitation chemicals and consumables, general quality management software lacking allergen-specific function, agricultural traceability systems, and retail or food service applications are excluded from scope.
Quantitative Units
USD billions, platform licence, subscription and attributable service revenue at supplier level
Segmentation Dimensions
Platform function, end-use food category, commercial model, region
Regions Covered
North America, Western Europe, East Asia, South Asia and Pacific, Latin America, Middle East and Africa, Eastern Europe
Countries Covered
United States, Canada, Mexico, Brazil, Argentina, Chile, United Kingdom, Germany, Netherlands, France, Ireland, Denmark, Spain, Italy, Poland, Czechia, Hungary, China, Japan, South Korea, Taiwan, India, Australia, New Zealand, Thailand, Vietnam, Saudi Arabia, United Arab Emirates, South Africa
Key Companies Profiled
SafetyChain Software, TraceGains, Neogen, Eurofins Scientific, Intelex, Romer Labs, Hygiena, Charm Sciences, SGS, Bureau Veritas, Intertek, LGC Group, Sparta Systems, Rockwell Automation, Siemens, AspenTech, Ecolab, Diversey, Kersia, FoodLogiQ
Quantitative Methodology
Primary survey, n=3,800 respondents, Q4 2025, six countries; demand-side model with trade association cross-validation
Qualitative Methodology
47 expert interviews, Q4 2025; applied to validate demand model assumptions, identify emerging dynamics, and assess competitive positioning
Report Format
PDF and XLSX data workbook (Word format preview document)
Publisher
Market Minds Advisory
Report Code
MMA-2026-AGR-141
Published
September 2026
Contact
sales@marketmindsadvisory.com | www.marketmindsadvisory.com

Purchase the full Allergen Cross-Contact Risk Monitoring Platforms for Food Plants Market Report (2026 to 2036).

The full MMA report locates allergen failure where it actually occurs, in the handoffs between changeover, rework, supplier declaration and label, rather than in the testing that plants already perform competently. It sizes the market to 2036 across six platform functions, seven regions and 29 countries, with segment growth rates and regional demand mechanisms set out throughout. Competitive analysis covers 20 suppliers assessed on measured platform and associated service revenue, with moat and risk assessment for the two leaders. The report quantifies implementation cost structure, precautionary label economics and margin architecture across three portfolio tiers. It closes with four strategic verdicts and an anonymised contract manufacturer engagement.
Six platform functions sized through 2036
Seven regions with demand mechanism analysis
Twenty suppliers on consistent revenue basis
Recall cost and changeover downtime benchmarks
Margin architecture across three portfolio tiers
Anonymised contract manufacturer allergen programme engagement

Built For The People Who Decide

From boardroom strategy to bench-side execution, this report is read cover-to-cover by leaders shaping the next decade of their industry, turning demand scenarios, market dynamics and valuation benchmarks into decisions.
CXOs/ Presidents/ VPs/ Managers
M&A and Corporate Development
Strategy Teams and R&D Heads
Procurement and Product Directors
Regulatory and Compliance Leaders
Investor Relations and Equity Analysts