Market Minds Advisory
Alcoholic Flavors Market

Alcoholic Flavors Market: Ready-to-Drink Expansion and Natural Extract Premiumization

Ready-to-drink cocktail and hard seltzer growth is pulling alcoholic flavor demand toward natural extract formulations, even as craft distillers push flavor houses toward specific botanical profiles mass-market spirits never required.

Lead Analyst

Lisa Gevelber

Published

September 2026

Make Smarter Decisions with Customized Research Insights

Request a free sample report and evaluate market opportunities, growth trends, and competitive dynamics relevant to your business needs.

2025 MARKET VALUE$2.1BMarket Size 2025
2036 FORECAST VALUE$4.4BBase Case , 2026 to 2036
CAGR 2026 TO 20367.0 %Bull 8.2% / Bear 5.8%
INCREMENTAL OPPORTUNITY$2.2BNet 10- year value creation
EXPANSION MULTIPLE1.97x2036 value over 2026 base
Strategic Levers
M&A Pipeline
Regional Outlook
Country Rankings
Competitive Intelligence
Segmental Deep-dive
Call-Us : 91 93563 13602

Executive Snapshot and Market Trajectory

Ready-to-drink cocktail and hard seltzer growth is redirecting alcoholic flavor demand toward natural extract formulations, even as flavored spirits, the category's traditional volume base, keep growing steadily as craft distillers push toward increasingly specific botanical profiles across nearly every major producing market. Buyers evaluate on speed and natural credentials.
Ready-to-drink cocktails and hard seltzers now drive the fastest volume growth as beverage brands launch new flavor variants rapidly to capture retail shelf space. Flavored spirits still represent a substantial share given the category's established position across mainstream liquor brands. North America anchors both flavor house innovation and ready-to-drink consumption, tied closely to the segment's origin and continued retail expansion there. Craft distilling flavor extracts add a further fast-growing demand pool as independent distilleries multiply.
Givaudan and IFF dominate through integrated natural extraction and flavor compounding scale that smaller regional flavor houses cannot easily match on cost or product breadth. Consumer demand for natural over artificial flavor labeling and rapid ready-to-drink product cycle turnover are the two forces most likely to reshape flavor house competitive positioning across the next decade specifically. Regional Asian flavor houses are also expanding standard compound capacity rapidly to compete on price.
Market Definition
The alcoholic flavors market covers commercial production and sale of flavor compounds, extracts, and concentrates used to flavor spirits, ready-to-drink cocktails, flavored malt beverages, wine, and cider. It excludes the finished alcoholic beverages themselves and non-alcoholic flavor compounds sold for food, confectionery, or soft drink applications outside the alcoholic beverage industry.
Base Year Value
$2.1B in 2025 (MMA Primary Research Dataset, August 2026)
Forecast Period
2026 to 2036, eleven discrete annual values
CAGR
7.0% base case. Bull 8.2%. Bear 5.8%.
Fastest Growth Segment
Ready-to-Drink Cocktails and Hard Seltzers: 10.8% CAGR
Fastest Growth Country
India: 9.4% CAGR
Fastest Growth Region
South Asia and Pacific: 9.0% CAGR
Largest Region
North America: 30% of 2025 global value
Market Leaders
Givaudan, IFF, Symrise AG, Sensient Technologies, Robertet Group. Source: MMA Analysis based on company annual reports.
Primary Survey
n=3,800 procurement and R&D decision-makers, Q4 2025, six countries
Methodology
Demand-side build-up, cross-validated against public data, 47 expert interviews

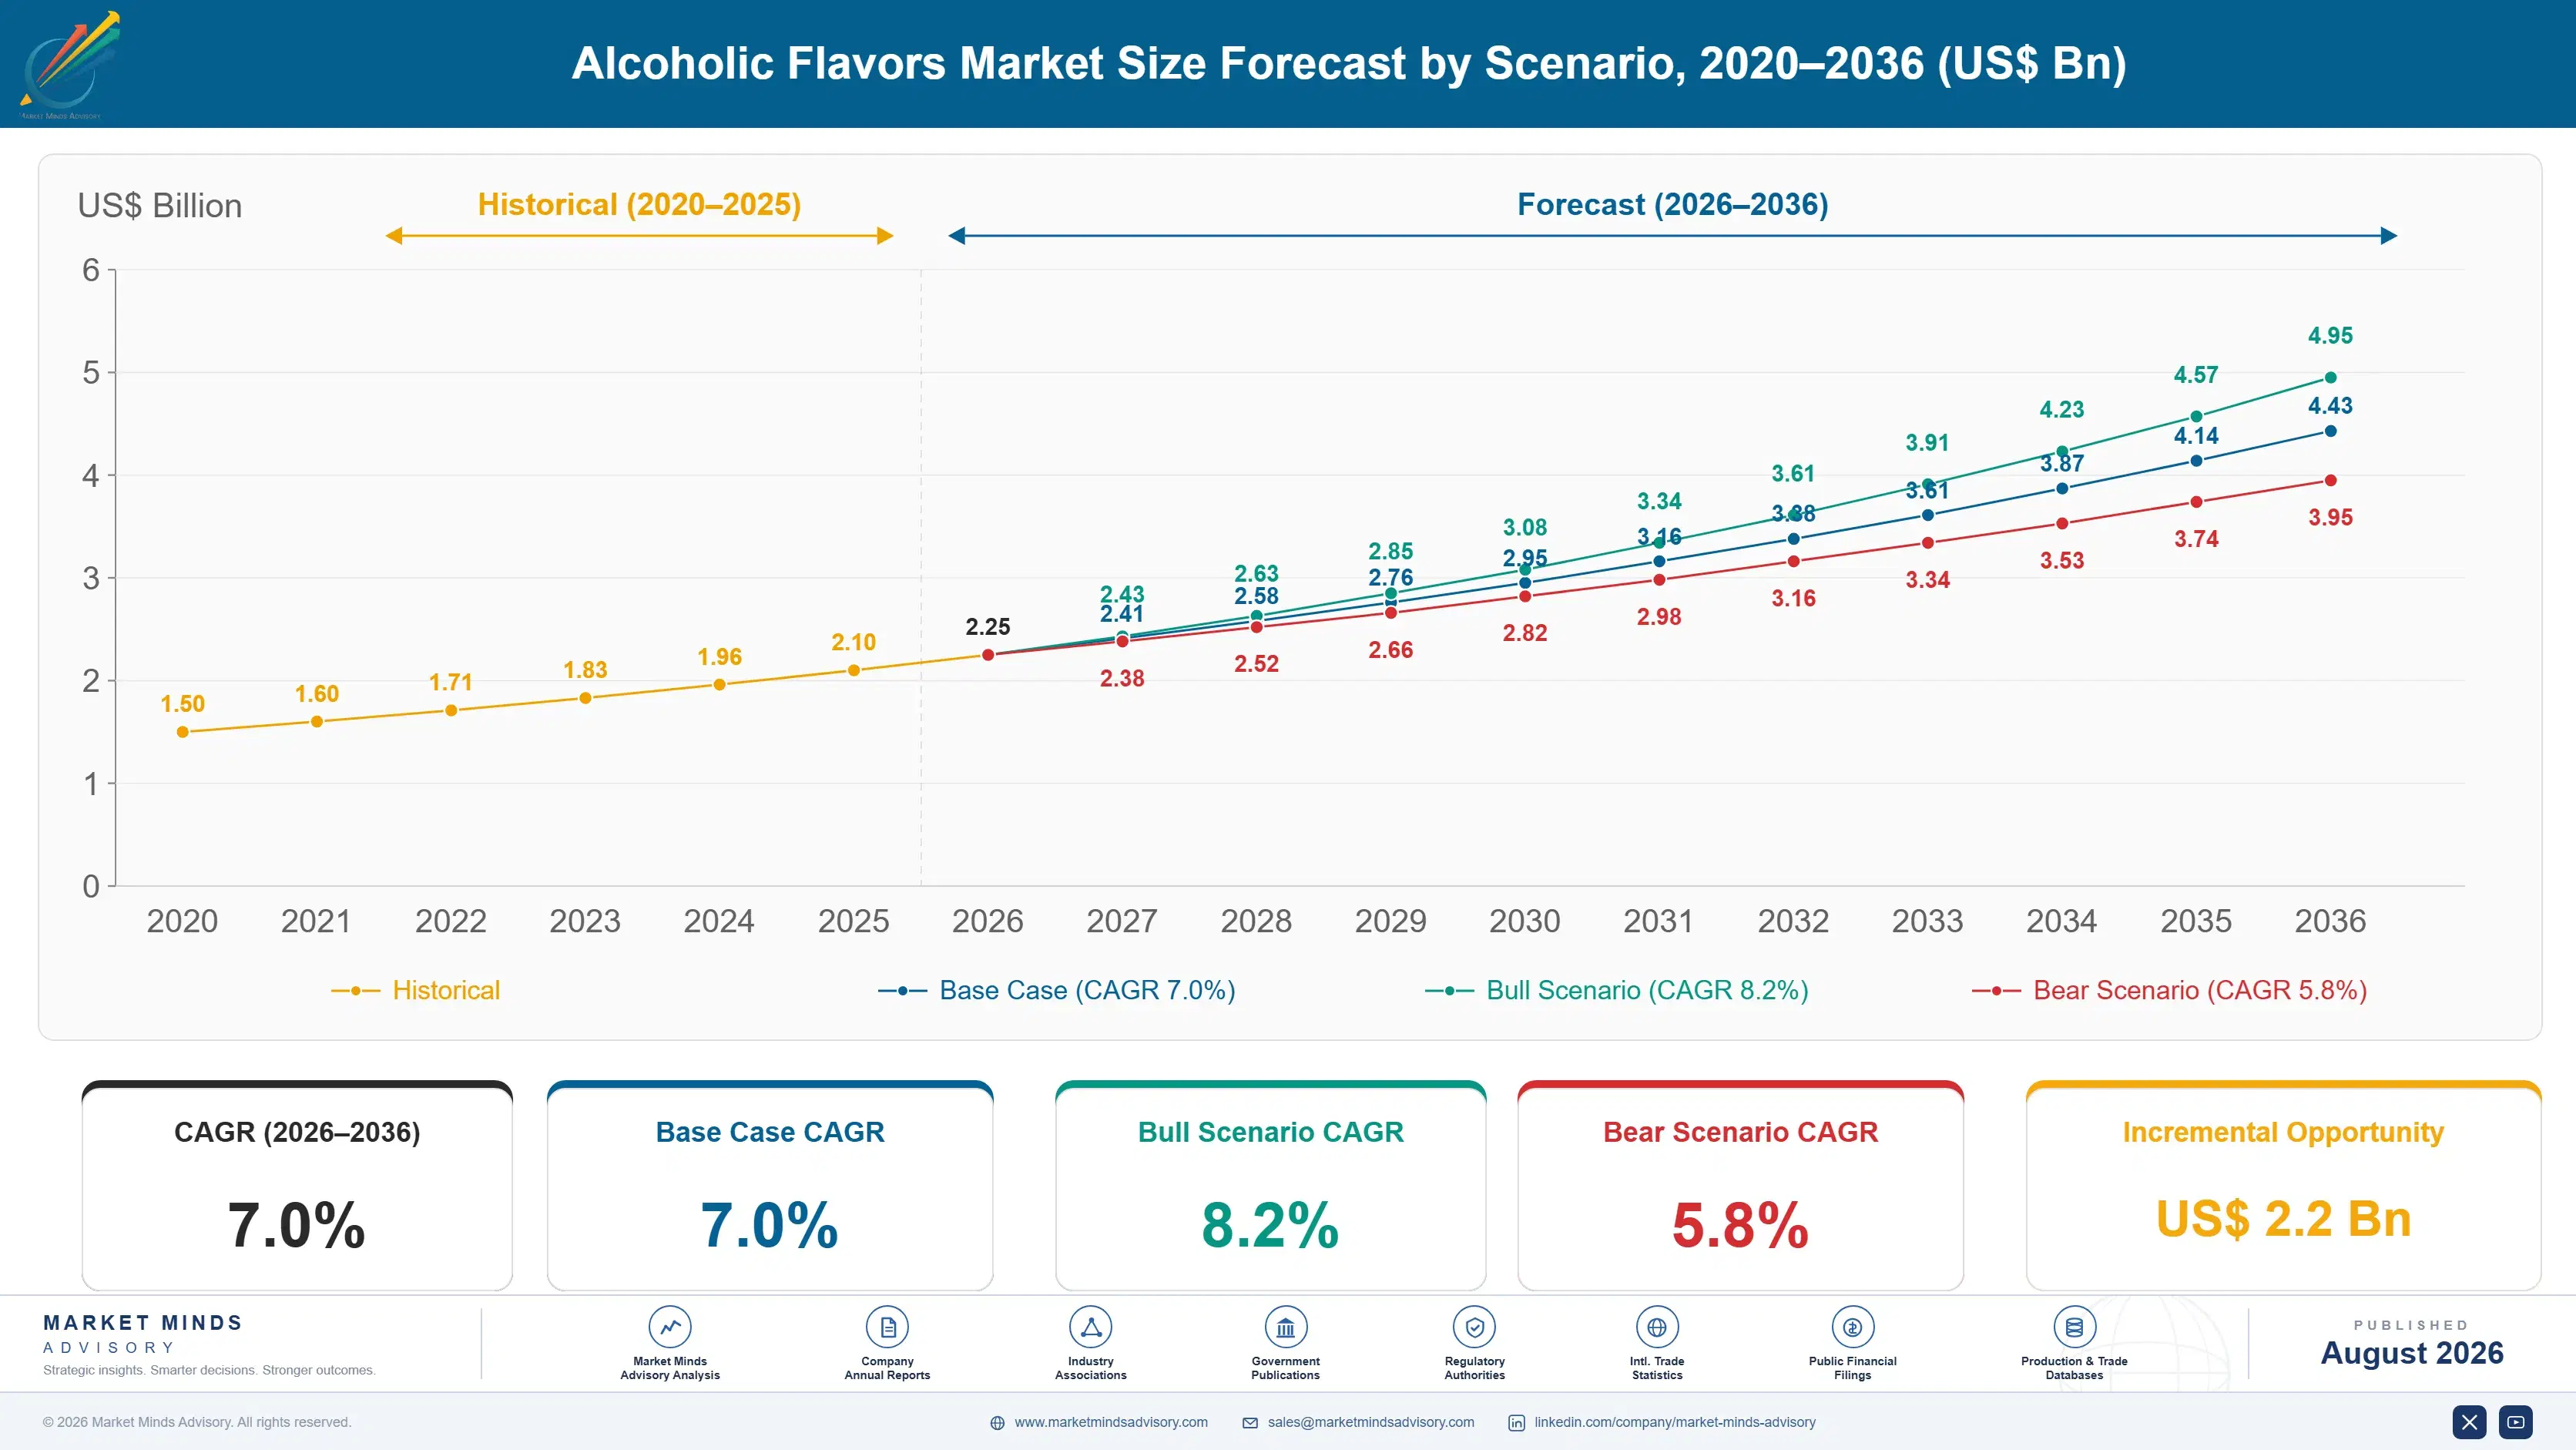
Alcoholic Flavors Market Forecast Scenarios

alcoholic-flavors-market-size-forecast-scenario-1787461391961
Between 2020 and 2025 the market grew at a somewhat slower pace than the current forecast implies, as pandemic-era on-premise closures temporarily slowed craft distilling and cocktail bar demand, before ready-to-drink retail growth accelerated sharply and pulled overall category growth well above its earlier trajectory through the historical period. Flavor houses serving both segments saw fairly stable development relationships.
The base case through 2036 rests on three mechanisms: continued ready-to-drink cocktail and hard seltzer product launches sustaining rapid flavor variant turnover, craft distilling expansion across North America and Western Europe driving demand for increasingly specific botanical flavor profiles, and rising consumer preference for natural over artificial labeling pushing flavor houses toward higher-margin natural extract formulations across nearly every beverage category. None of these mechanisms depends on a single beverage category, supporting the base case holding under most plausible scenarios.
The bull case turns on ready-to-drink category growth accelerating faster than currently expected across additional international markets, pulling flavor variant demand well above current base case assumptions. The bear risk is ready-to-drink category growth decelerating sharply as retail shelf space consolidates around fewer proven flavors, slowing the rapid variant turnover that currently drives much of the category's above-average growth.

Ready-to-Drink Innovation and Natural Extract Dynamics

Two forces are reshaping alcoholic flavors at once: ready-to-drink product proliferation demanding rapid flavor variant turnover, and craft distilling growth demanding increasingly specific botanical profiles. Each pulls flavor house development priorities in a somewhat different direction, splitting what was once a fairly stable flavor category into a market with genuinely faster innovation cycles across nearly every application. Flavor houses slow to recognize this split risk losing relevance in both segments.
MARKET CONCENTRATIONCR5 48%reflects moderately concentrated global production among flavor leaders
AVERAGE SELLING PRICE$18/kgnatural extract formulations command a substantial premium generally
TOP PRODUCING COUNTRY SHAREUSA 28%reflects concentrated flavor house innovation and manufacturing capacity
CAPACITY UTILIZATION73%production lines running comfortably below their practical processing ceiling
FEEDSTOCK COGS SHARE39%botanical extract and specialty aroma inputs dominate production cost
TRADE INTENSITY44%share of global production moving across national export borders
Commercially, alcoholic flavor supply behaves like a specialty ingredient relationship rather than a bulk commodity trade. Beverage brands brief flavor houses on target taste profiles months before launch, qualify samples against sensory panels before committing, and natural extract formulations have held pricing even through periods when synthetic alternatives faced margin pressure, evidence that labeling claims now matter as much as raw flavor performance. Buyers treat validated data as a reliability signal.
The next decade will be shaped by how fast ready-to-drink retail shelf space continues expanding relative to slower-growing spirits and beer categories, whether craft distilling growth sustains its recent pace, and how quickly flavor houses can develop natural extract alternatives to the synthetic compounds still used across price-sensitive mainstream beverage segments. How fast extraction technology advances will also matter.
"A ready-to-drink brand used to launch one flavor and defend it for years. Now half the category calendar is built around a rotating seasonal flavor drop."
Director, Beverage Flavors Practice · MMA Specialty Flavors & Beverage Ingredients Practice · August 2026

Market Trends

Ready-to-Drink Brands Accelerate Flavor Variant Turnover

Ready-to-drink cocktail and hard seltzer brands increasingly launch new flavor variants on a seasonal rather than annual cycle, forcing flavor houses to compress development timelines considerably while still meeting the sensory consistency retail buyers require before committing shelf space. Several major beverage brands have publicly disclosed accelerated flavor development partnerships with Givaudan and IFF over the past few years specifically to support this faster cycle. Independent industry surveys report ready-to-drink flavor variant counts growing considerably faster than unit volume itself, meaning flavor development has become a larger share of total brand marketing spend than in any prior beverage category cycle.
Market Impact: Adds 140 million dollars demand
Natural Labeling Preference Reshapes Flavor Formulation

Consumer preference for natural over artificial flavor labeling has pushed beverage brands across North America and Western Europe to specify natural botanical extract formulations even where synthetic alternatives cost meaningfully less and perform comparably in blind sensory testing. Symrise and Robertet have both expanded natural extraction capacity considerably over recent years specifically to meet this demand, and several major spirits brands have publicly reformulated existing products to remove artificial flavor compounds entirely. This has pulled premium pricing for natural extracts further away from synthetic compounds than at any point in the past decade.
Market Impact: Adds 210 million dollars ready-to-drink demand

Market Opportunities and Growth Drivers

Craft Distilling Expansion Drives Botanical Flavor Demand

The proliferation of independent craft distilleries across the United States, United Kingdom, and Australia continues to expand demand for increasingly specific botanical flavor profiles, as smaller producers seek differentiated taste positioning against mass-market spirits brands. The Distilled Spirits Council of the United States has documented steady growth in the number of operating craft distilleries over the past several years, directly expanding the addressable flavor house customer base beyond the handful of large multinational spirits companies that historically dominated purchasing. Sensory research consultancies have also begun publishing dedicated craft spirits flavor trend reports, reflecting this customer segment's growing planning significance.
Market Impact: Limits natural share to 46 percent

Retail Ready-to-Drink Category Continues Rapid Expansion

Retail ready-to-drink cocktail and hard seltzer sales have continued expanding rapidly across North America and increasingly Western Europe, with major retailers dedicating growing shelf space to the category as consumer preference shifts away from traditional beer and wine toward convenient, lower-calorie alcoholic options. Several large beverage conglomerates have launched multiple new ready-to-drink brands over the past several years specifically to capture this shelf space, sustaining strong flavor variant demand growth across the category. Independent beverage industry data shows ready-to-drink unit growth consistently outpacing beer and wine category growth by a wide margin across nearly every major retail market tracked.
Market Impact: Cuts development margin by 9 points

Market Restraints and Challenges

Natural Extract Costs Limit Adoption in Price-Sensitive Segments

Natural botanical extract formulations cost meaningfully more than synthetic alternatives, a gap rooted in the agricultural sourcing and extraction yield limits that natural production inherently faces compared with chemical synthesis. In price-sensitive mainstream beer and value spirits segments, brand owners continue to specify synthetic flavor compounds wherever labeling regulations permit it, since the cost differential outweighs the natural labeling premium that has not yet reached those price tiers with the same intensity as premium spirits and ready-to-drink categories. Flavor houses are mitigating this through tiered product lines that blend natural and synthetic components to soften the cost step.
Market Impact: Adds 165 million dollars ready-to-drink demand

Rapid Product Cycles Compress Flavor House Margins

The accelerated flavor variant turnover that ready-to-drink brands now demand forces flavor houses to absorb development costs across a shorter revenue-generating window than the multi-year product cycles flavor houses historically relied on to recoup development investment. Several flavor houses have reported margin compression on ready-to-drink specific development work as a result, even as overall segment volume continues growing. The root cause is that beverage brands, not flavor houses, control the pace of variant turnover, leaving flavor houses with limited ability to negotiate longer amortization periods for development costs. Some flavor houses now negotiate minimum development fees to offset this.
Market Impact: Lifts natural pricing by 22 percent
3 additional market trends, 3 additional growth drivers, and 4 additional restraints and challenges are covered in the full report. Contact sales@marketmindsadvisory.com to access the complete intelligence.

Segment CAGR and Growth Architecture

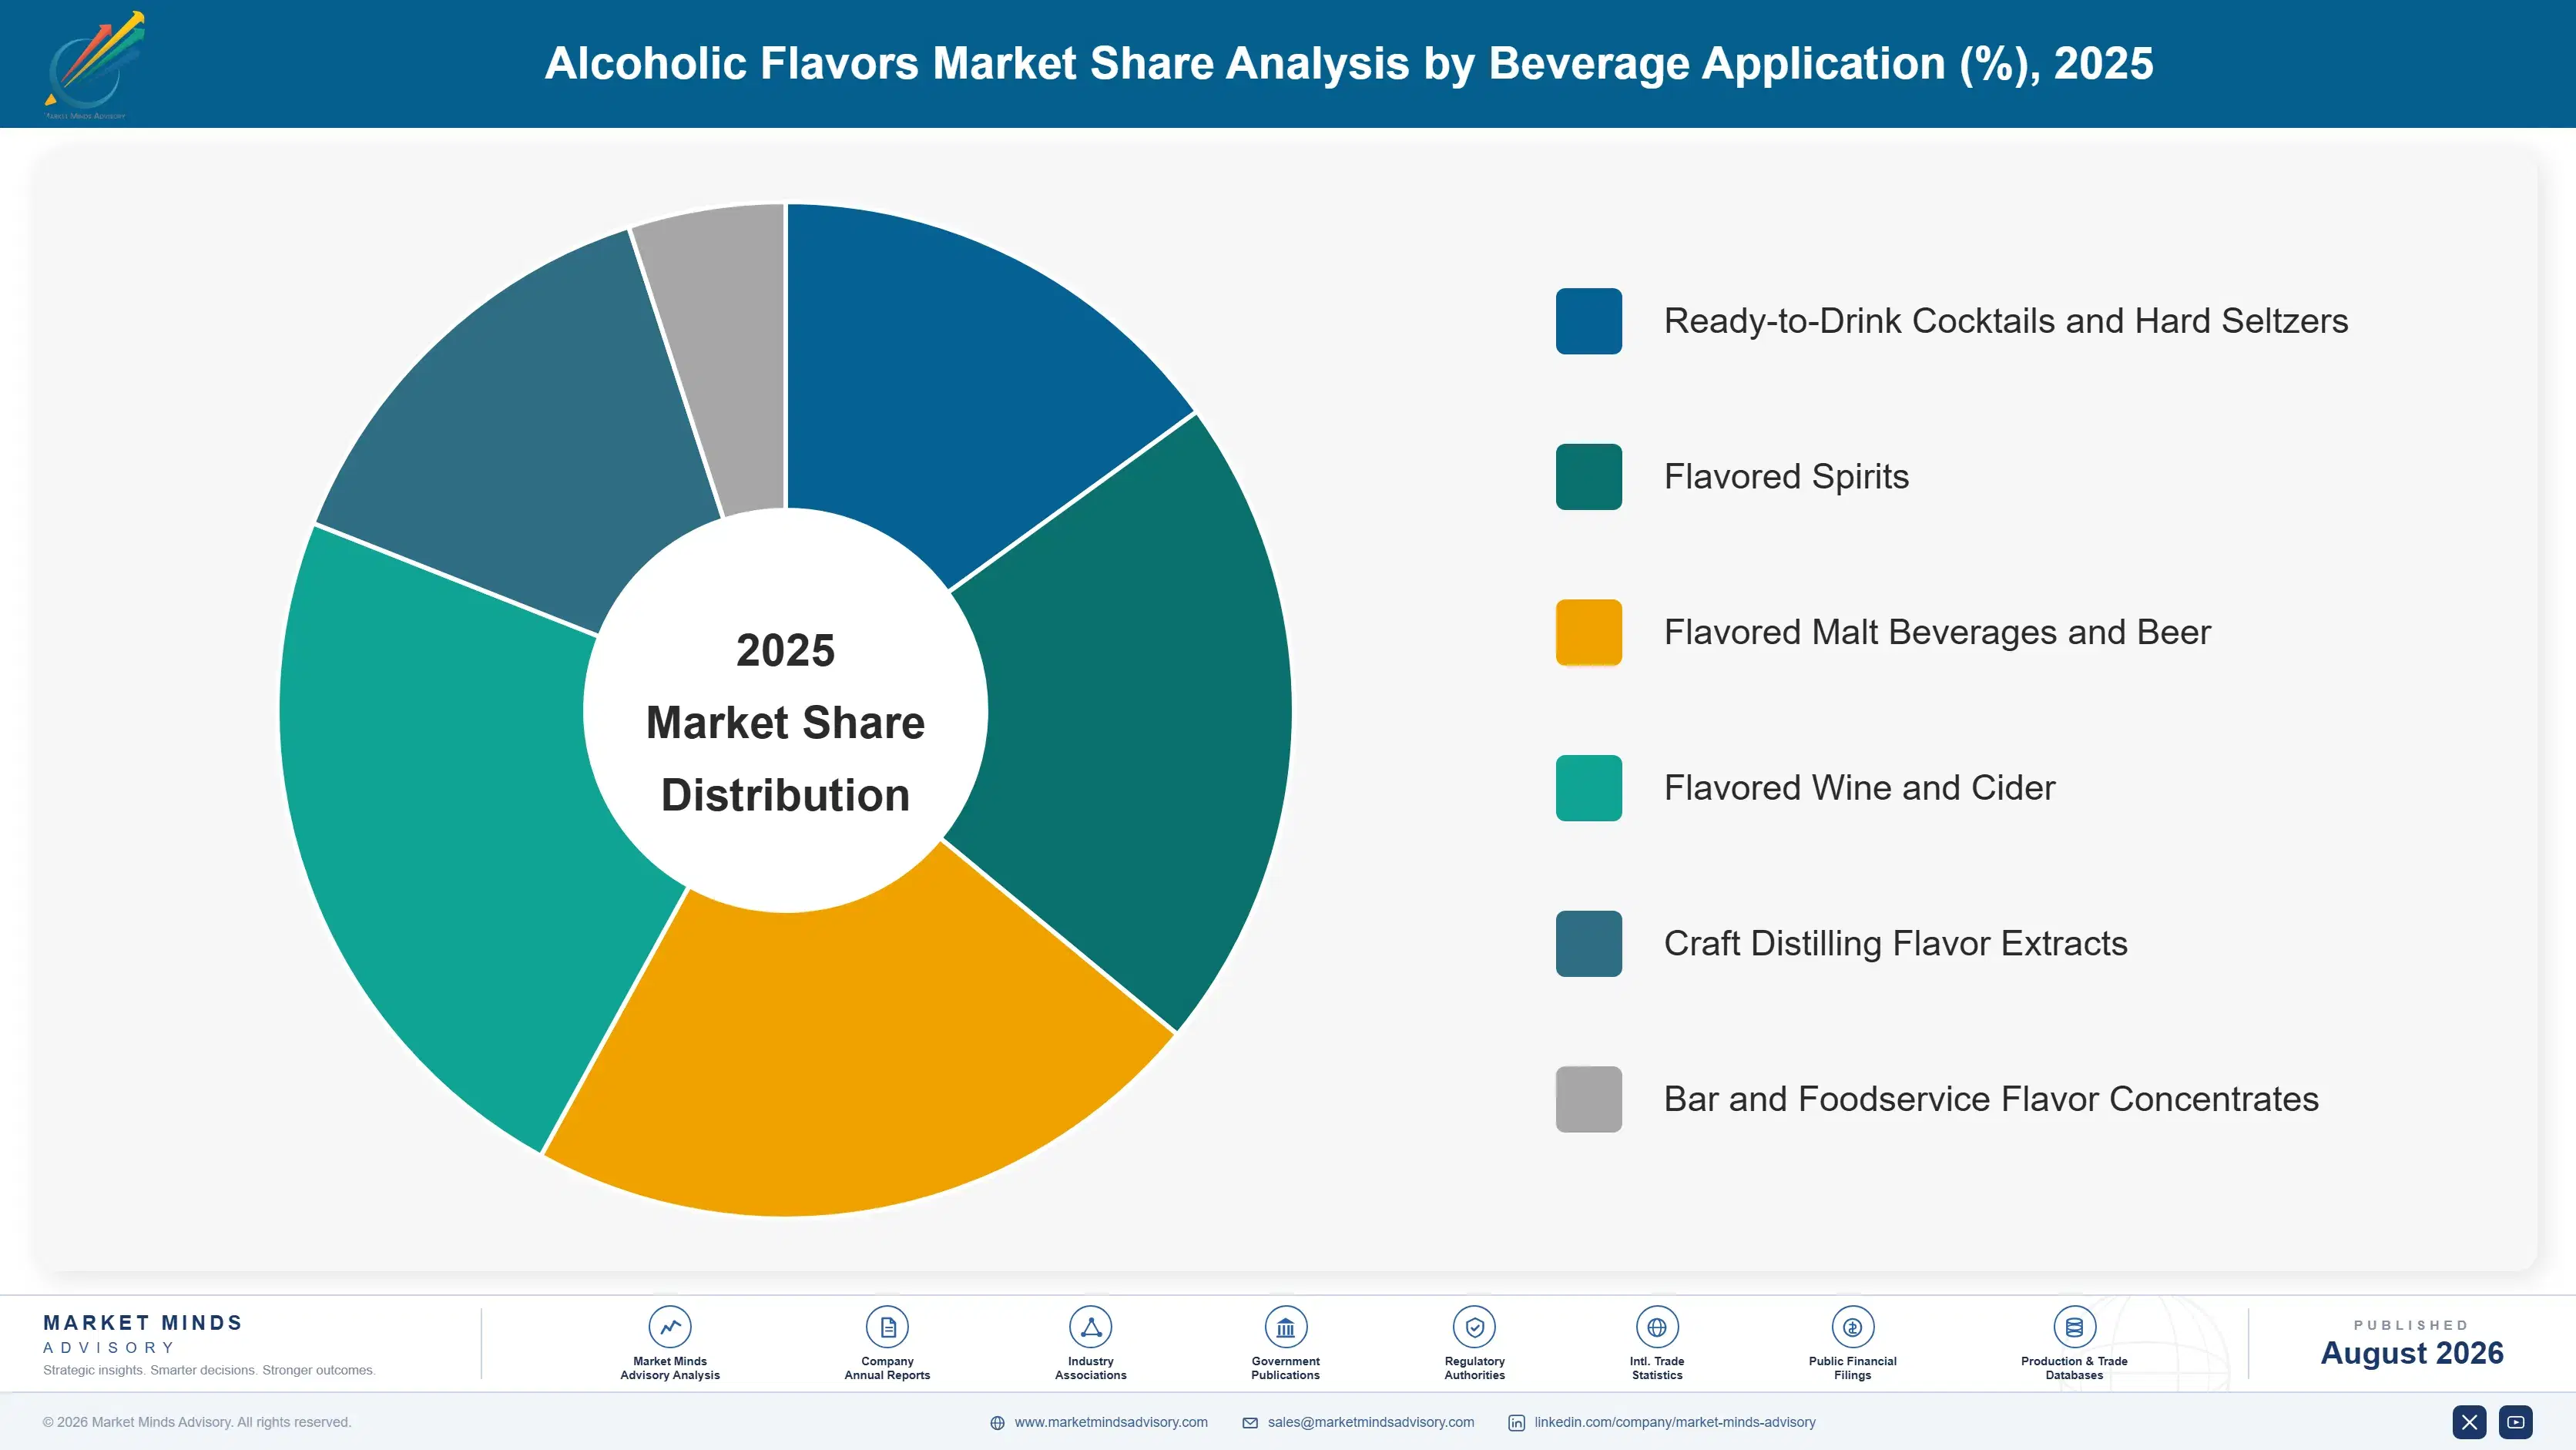
Alcoholic flavors are segmented here by beverage application rather than by flavor chemistry, distribution channel, formulation grade, sourcing method, or the underlying producing geography, since ready-to-drink, spirits, malt beverage, wine, and craft distilling customers each specify distinct sensory profiles and regulatory requirements that shape demand largely independent of the underlying flavor compound actually used.
alcoholic-flavors-market-market-share-analysis-1787461392516

Ready-to-Drink Cocktails and Hard Seltzers

This segment is growing fastest as beverage brands launch new flavor variants on an accelerated seasonal cycle to capture retail shelf space ahead of competitors, a pace of innovation the category has not previously required from flavor house partners. Givaudan and IFF have both prioritized dedicated ready-to-drink development teams specifically to serve this demand, given its scale and rapid growth trajectory relative to more mature beverage categories. Contract cycles here run shorter than in most other segments, since brands frequently rotate flavor partners between seasonal launches rather than committing to a single supplier relationship for multiple years. Pricing reflects the compressed timelines flavor houses absorb, with brands increasingly paying a premium for speed alongside sensory quality.
CAGR 10.8%

Craft Distilling Flavor Extracts

Independent craft distillery proliferation across the United States, United Kingdom, and Australia is driving this segment's above-average growth, as smaller producers seek increasingly specific botanical flavor profiles to differentiate against mass-market spirits brands. Robertet and Symrise dominate supply to this segment, benefiting from natural extraction expertise that smaller regional flavor houses lack entirely. This segment faces less price sensitivity than mainstream spirits, since craft distillers position on flavor distinctiveness rather than competing purely on cost against larger competitors. Margins here remain comfortably above the ready-to-drink segment given the smaller order volumes but higher per-unit customization value that craft distillers consistently demand from their flavor house partners across every product launch.
CAGR 8.6%
Full segment breakdown across 6 segments available in the complete report.

Regional Architecture and Country Demand Map

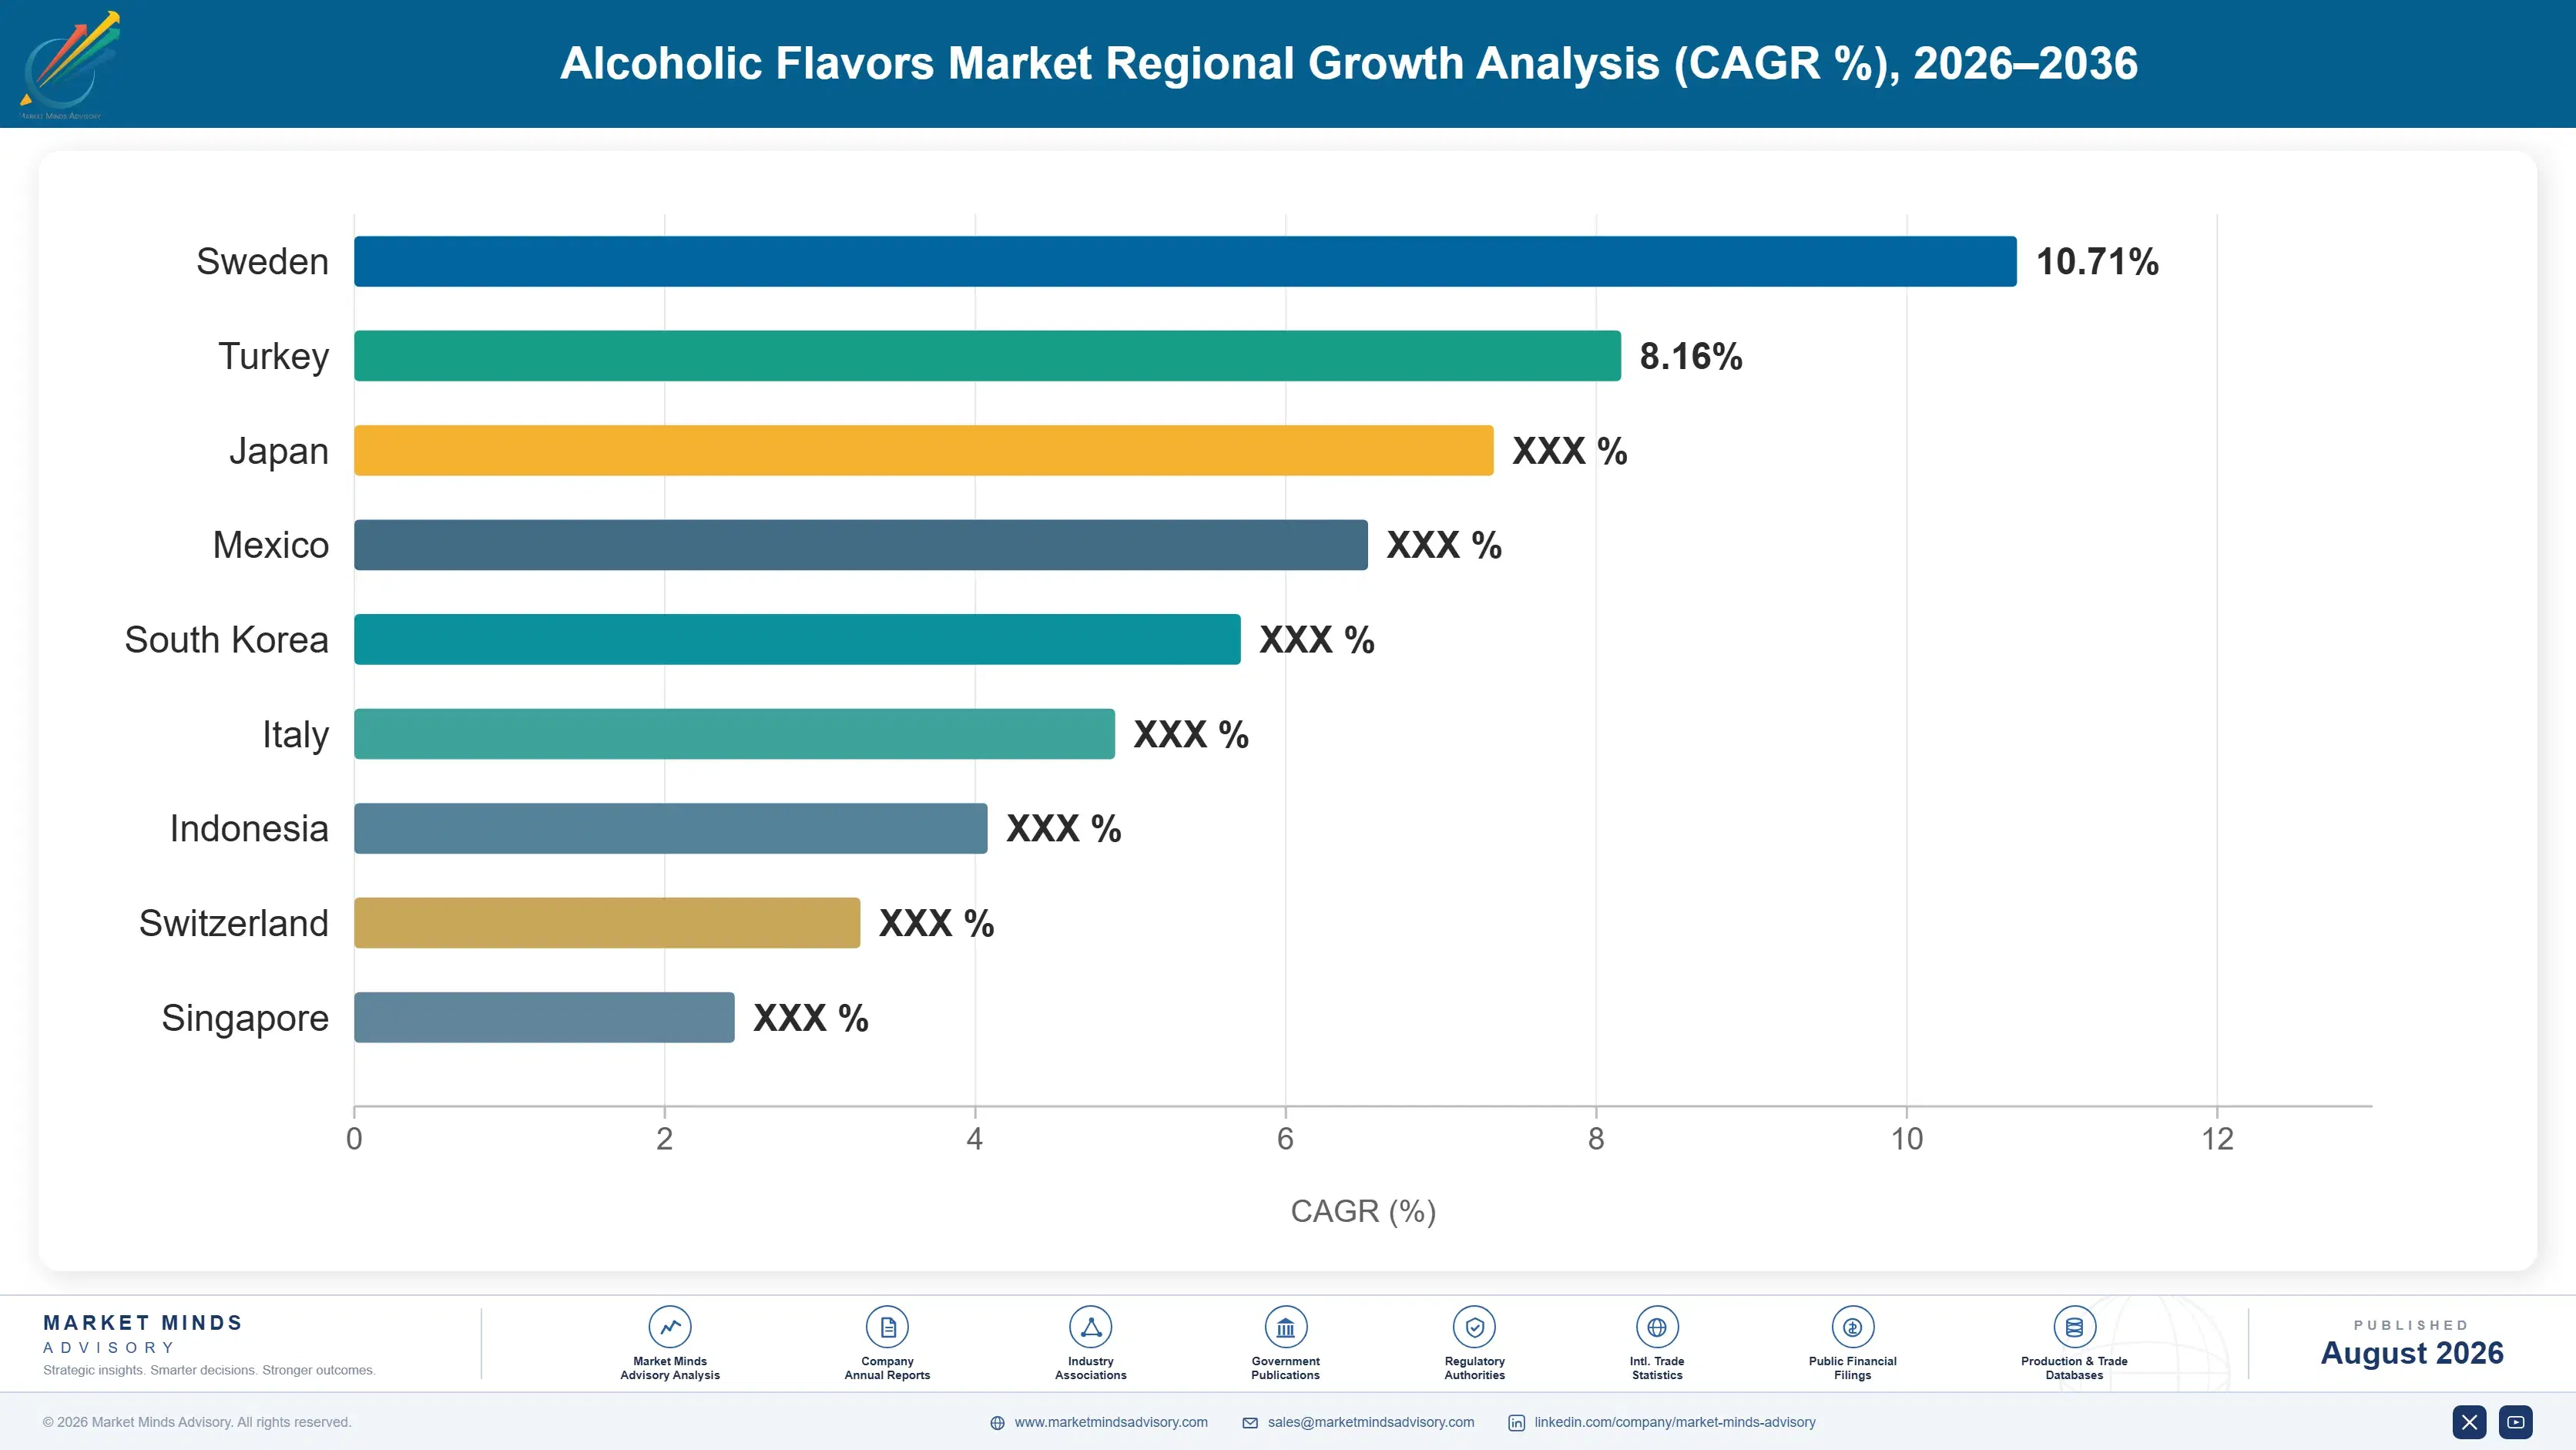
North America and East Asia together account for over half of global alcoholic flavor demand, reflecting large ready-to-drink and spirits consumption bases across both regions, while South Asia and Pacific posts the fastest regional growth on expanding premium spirits adoption nationally. across every major beverage segment

North America

Ready-to-drink cocktail and hard seltzer growth originated in and continues to anchor the largest share of regional demand, with major beverage brands headquartered across the United States and Canada driving rapid flavor variant turnover industry-wide. Craft distilling expansion adds a substantial secondary demand channel, as independent distilleries multiply across both countries and seek increasingly specific botanical flavor profiles. The region hosts significant flavor house innovation and manufacturing capacity through Givaudan and IFF's North American facilities, giving regional beverage brands relatively short development cycles compared with brands reliant on flavor houses located elsewhere. Mexico contributes further demand tied to its own growing tequila and ready-to-drink sector. Growing hard seltzer launches continue expanding flavor variant demand steadily.
Share: 30% | CAGR: 7.8% (2026 to 2036)

Western Europe

Established spirits and craft cocktail culture across the United Kingdom, France, and Germany anchors regional demand, with premium gin and craft distilling brands driving strong demand for natural botanical flavor extracts specifically. Ready-to-drink category growth has followed North America's lead but at a somewhat slower pace, reflecting different retail alcohol regulations and consumer purchasing habits across the region. Natural labeling preference remains particularly strong here, pushing flavor houses toward premium extract formulations even in mainstream spirits categories. Import dependence on North American ready-to-drink flavor innovation has declined as regional flavor houses build comparable dedicated development capability. Cosmetic and personal care applications remain outside this market's defined scope entirely. Nordic countries add smaller craft spirits demand tied to growing distillery activity.
Share: 23% | CAGR: 5.5% (2026 to 2036)
Regional intelligence for 5 additional markets available in the complete report: East Asia, South Asia and Pacific, Latin America, Middle East and Africa, Eastern Europe. Contact sales@marketmindsadvisory.com.
alcoholic-flavors-market-country-cagr-analysis-1787461393040

Where Alcoholic Flavor Houses Can Capture Margin

Flavor houses can lift margin capture by shifting mix toward natural extract formulations serving premium and craft segments, building dedicated ready-to-drink development capability for rapid turnover cycles, and expanding botanical sourcing partnerships that support increasingly specific craft distilling flavor requests. Building long-term development partnerships further strengthens customer retention during periods of rapid category turnover.

Natural Extract Formulation Mix Shift Strategy

Flavor houses who shift production mix toward natural botanical extracts capture meaningfully better margins than those still concentrated in synthetic compounds, since premium and craft beverage brands are often willing to pay a premium of 18 to 24 percent for validated natural labeling claims. Symrise and Robertet, which made this shift earliest, now command pricing consistently above flavor houses still weighted toward synthetic formulations. The capital investment in extraction capability is significant, but the payback period has compressed as natural labeling preference continues expanding across additional beverage categories. Smaller flavor houses without extraction capacity risk exclusion from this segment.
Market Impact: Lifts blended margin by 18 to 24 percentage points

Dedicated Ready-to-Drink Development Team Investment Program

Flavor houses who establish dedicated ready-to-drink development teams capable of compressing timelines to match seasonal launch cycles capture volume from beverage brands that competitors lacking equivalent speed cannot credibly serve, since brands increasingly select flavor partners based on turnaround time alongside sensory quality. Several flavor houses report winning 25 to 30 percent more ready-to-drink customer accounts after making this investment. Building this dedicated capability takes 1 to 2 years before this lever converts fully into volume, but resulting brand relationships prove considerably stickier than one-off project work. Flavor houses building this early lock in trusted relationships before competitors catch up.
Market Impact: Adds 25 to 30 percent ready-to-drink customer accounts

Botanical Sourcing and Partnership Expansion Strategy

Flavor houses who build direct sourcing relationships with botanical growers and specialty aroma chemical producers capture more consistent supply and better cost visibility than those relying purely on spot market purchasing, an advantage that becomes especially valuable when craft distillers request increasingly rare or specific botanical profiles. Producers with such partnerships report meaningfully faster development cycles for novel flavor requests than competitors without equivalent sourcing relationships. Building credible botanical sourcing partnerships takes 2 to 3 years before this lever fully converts into differentiated capability. Flavor houses building this capability early are locking in advisor relationships before rivals catch up.
Market Impact: Cuts novel flavor development time by 30 percent

Long-Term Development Partnerships With Major Brands

Locking multi-year development partnership agreements with large beverage conglomerates trades some project-by-project pricing upside for guaranteed development volume and dramatically reduced customer acquisition cost, an arrangement brands increasingly prefer too since it insulates them from flavor supply disruption during critical seasonal launch windows. Flavor houses with such partnerships report considerably lower customer churn than those competing purely on individual project bids, and the visibility supports more confident capacity planning 3 to 5 years ahead of anticipated demand. Flavor houses pursuing this approach report the strongest long-term account visibility across their entire portfolio.
Market Impact: Cuts customer churn by roughly 19 percentage points

Who Controls the Margin Pool

The market sits at moderate concentration, with the top five flavor houses controlling forty-eight percent of global capacity on a production basis. Givaudan and IFF lead by a meaningful margin over the next tier of challengers, both benefiting from integrated natural extraction and flavor compounding scale that smaller regional flavor houses cannot easily replicate on cost or product breadth grounds. Regional challengers largely compete on price alone.
Current competitive activity centers on three fronts: shifting production mix toward natural extract formulations serving premium and craft segments, building dedicated ready-to-drink development capability for rapid seasonal turnover cycles, and expanding botanical sourcing partnerships that support increasingly specific craft distilling flavor requests. Regional Asian flavor houses are also expanding domestic capacity rapidly to compete on price. These fronts determine which flavor houses retain their best accounts.

Emerging pressure comes from Asian flavor houses who have scaled standard compound production considerably faster than Western incumbents anticipated, and from boutique flavor developers targeting niche craft distilling and ready-to-drink startup customers directly. Rankings could shift meaningfully if regional Asian producers close the natural extraction technology gap with the established leaders before Givaudan and IFF complete their own next generation of botanical sourcing investment.
alcoholic-flavors-market-company-positioning-matrix-1787461393565

Competitive Moat and Risk Dimensions

GIVAUDAN

Moat: Broad flavor portfolio and scale

Givaudan's combined natural extraction, synthetic compounding, and dedicated beverage flavor development capability lets it serve customers across every application and price tier from a single commercial relationship, a breadth advantage narrower competitors specializing in just one flavor chemistry class cannot offer during rapid product cycles.
GIVAUDAN

Risk: Complexity managing rapid product cycles

Givaudan's broad customer base across ready-to-drink, spirits, and craft distilling requires managing many more simultaneous development projects than a focused competitor, a complexity that can slow response time to any single fast-growing customer segment relative to more specialized rivals. This exposure is already visible in longer response times to niche craft distilling requests.
IFF

Moat: Integrated natural extraction scale

IFF's integrated natural botanical extraction and sourcing network gives it direct cost and consistency advantages that smaller regional flavor houses lacking equivalent upstream integration cannot easily match, particularly in premium natural extract chemistries where sourcing represents a large share of total production cost. This upstream advantage becomes especially valuable during periods of botanical feedstock price volatility.
IFF

Risk: Integration complexity following acquisitions

IFF continues working through integration complexity following its major flavor industry acquisitions, and any operational disruption during this process could create an opening for Givaudan or regional Asian challengers to win contested customer accounts during the transition period. This exposure is already visible in the company's development pipeline delays during recent transitions.

Players Tracked

Prominent Players

Givaudan
IFF
Symrise AG
Sensient Technologies
Robertet Group

Other Key Players

dsm-firmenich
Kerry Group
Takasago International
T. Hasegawa
Mane SA
Bell Flavors and Fragrances
Comax Flavors
Flavorchem Corporation
Synergy Flavors
Virginia Dare
Ungerer and Company
David Michael and Co
WILD Flavors
Prova Flavors
Huabao International

Recent Developments

MARCH 2025

Givaudan launches dedicated ready-to-drink development studio

Givaudan opened a dedicated ready-to-drink flavor development studio aimed at compressing development timelines for beverage brands launching seasonal flavor variants. The launch followed years of growing customer demand for faster turnaround on flavor development projects tied to accelerated retail launch cycles. Several brands have committed initial projects to it.
Signal: Signals flavor houses investing ahead of confirmed long-term speed requirements across every major ready-to-drink brand portfolio worldwide
SEPTEMBER 2024

Symrise expands natural botanical extraction capacity

Symrise commissioned an expansion of natural botanical extraction capacity at one of its European facilities, aimed at meeting growing demand from premium spirits and craft distilling customers seeking natural labeling claims. The expansion followed years of order growth from brands reformulating toward natural formulations. Several spirits brands signed agreements already.
Signal: Confirms natural labeling preference reshaping flavor house investment across the broader premium spirits category worldwide overall
JANUARY 2026

Regional Asian flavor house commissions new compound facility

A leading Asian flavor producer brought online a new standard flavor compound production facility, materially increasing domestic capacity to serve both local beverage manufacturers and export customers across South Asia and Latin America seeking lower-cost alternatives. The facility adds meaningful competitive pricing pressure globally. Regional buyers welcomed the sourcing option.
Signal: Signals regional producers closing the capacity gap with incumbents rapidly well ahead of what most industry analysts had expected

Botanical Sourcing and Aroma Chemical Cost Exposure

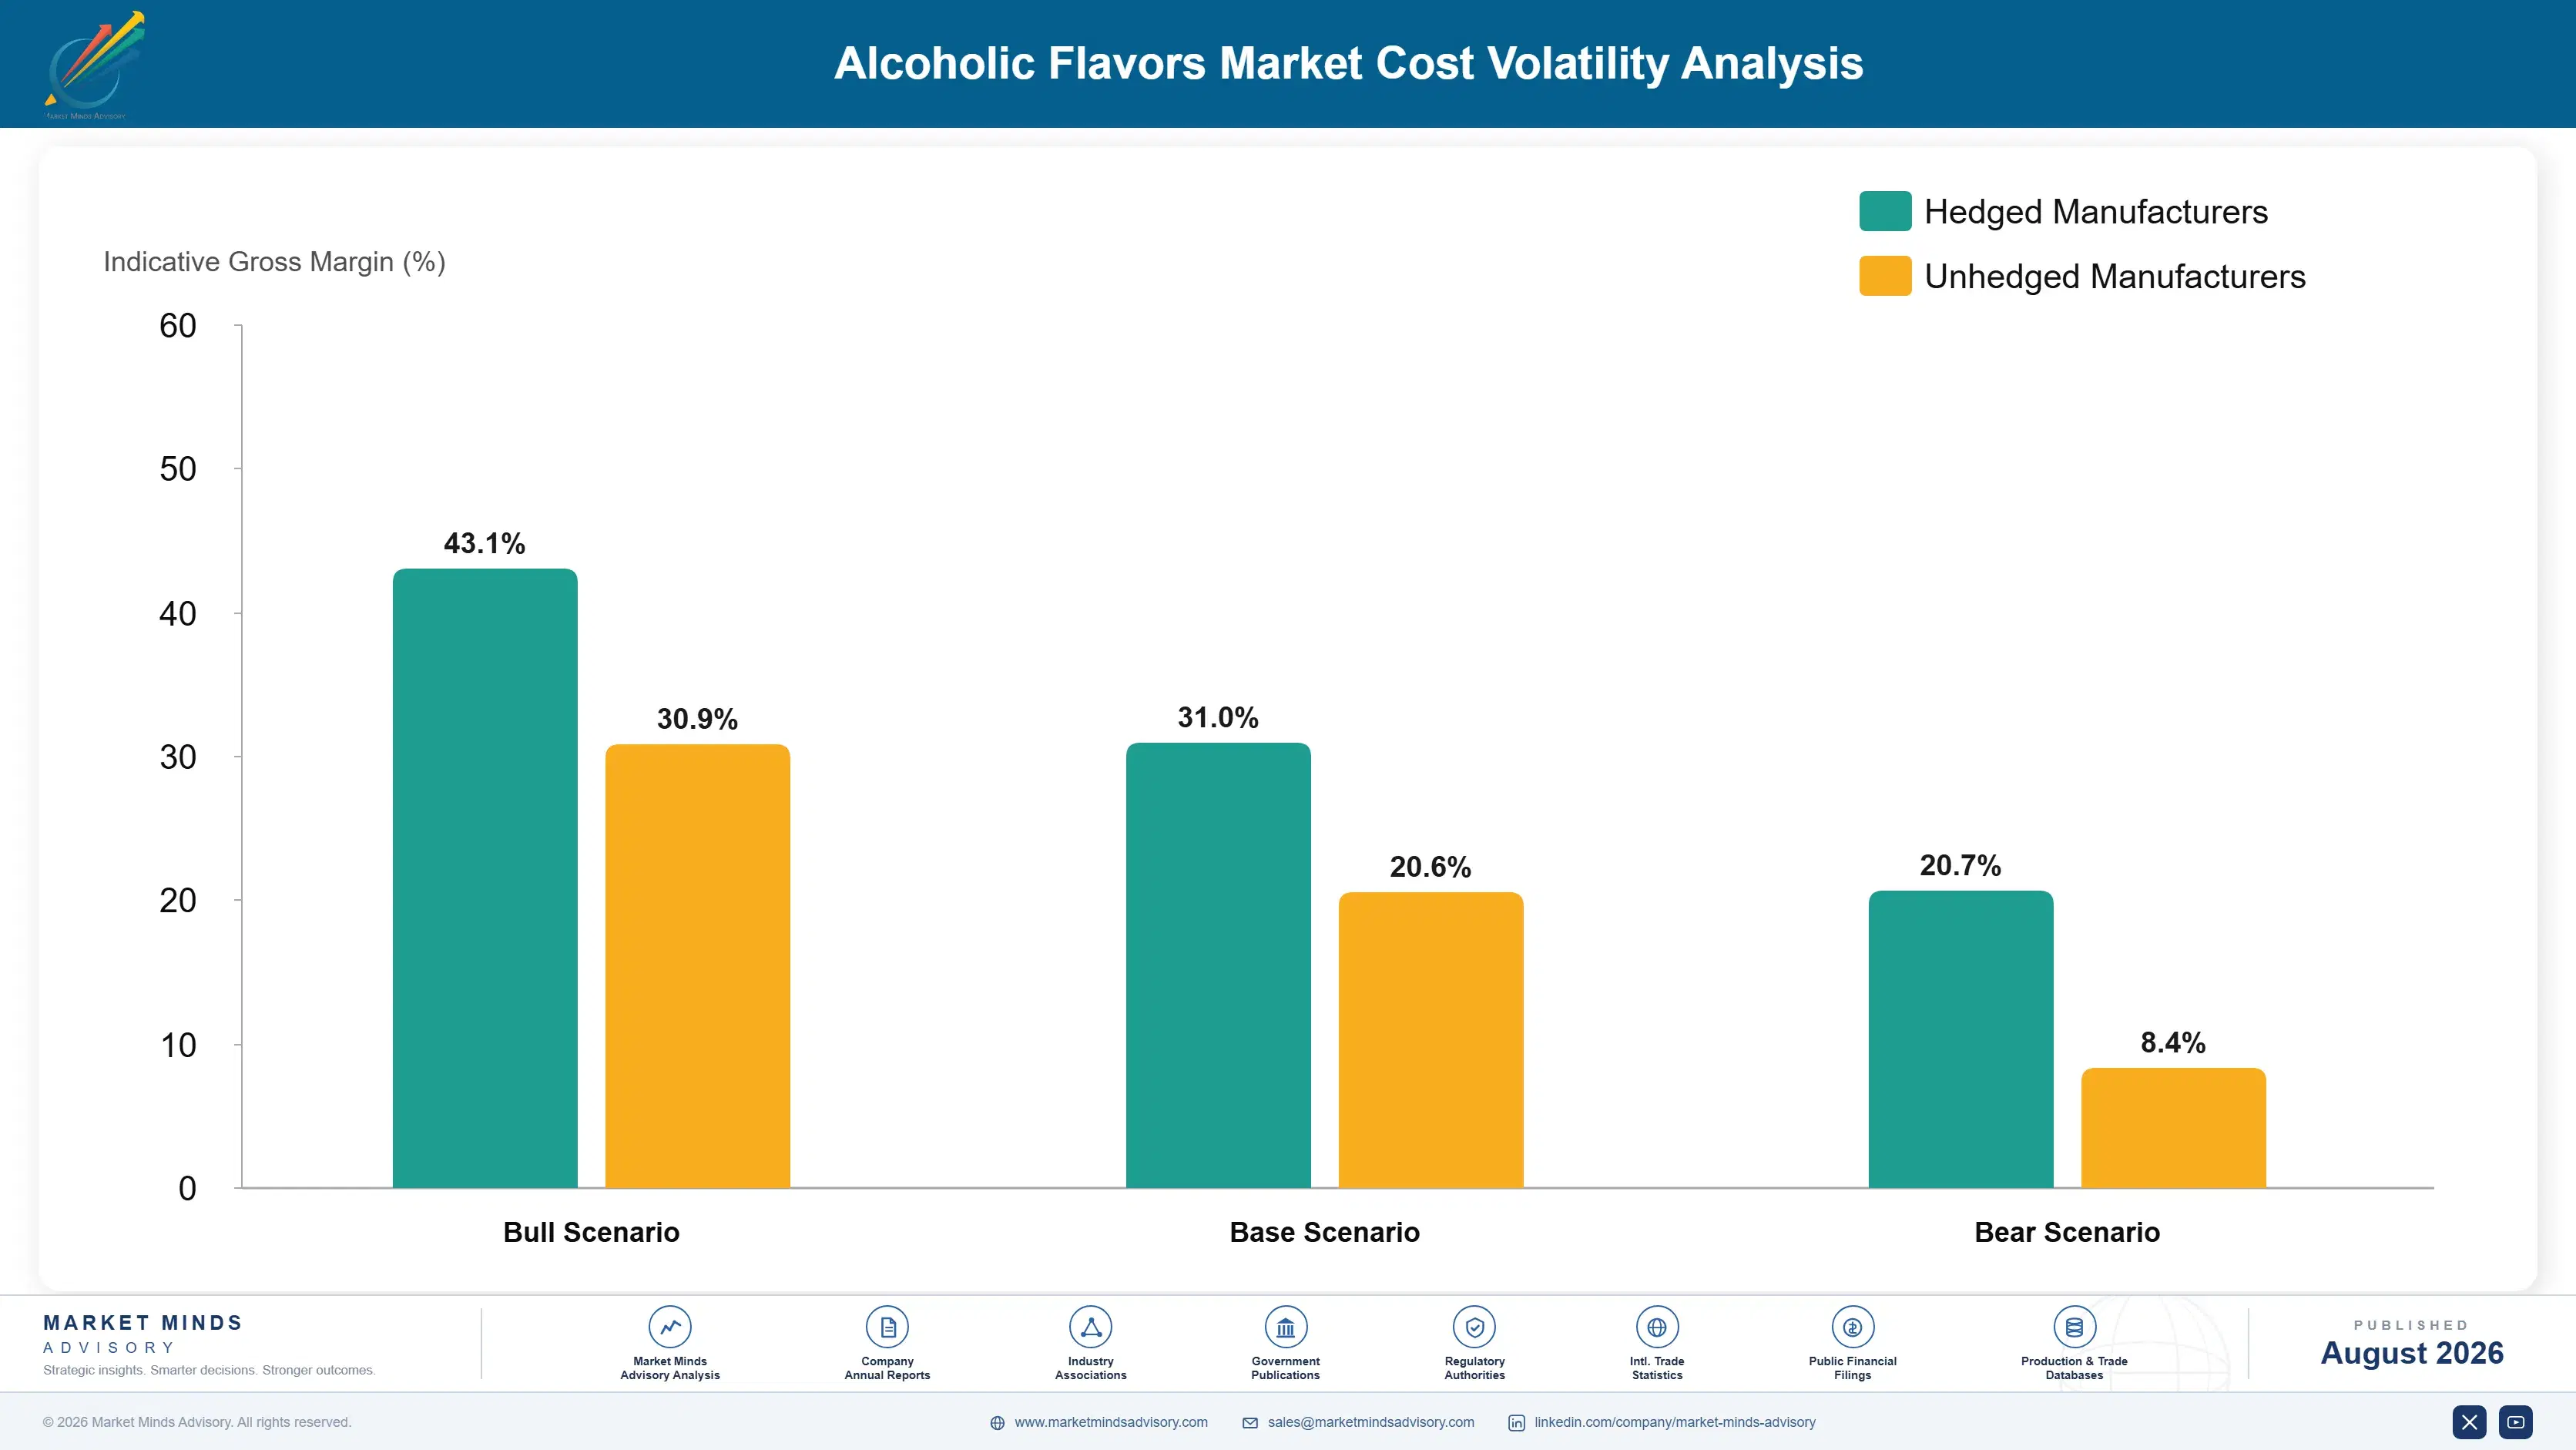
Botanical extract feedstock, including citrus, berry, and specialty aromatic plant sourcing, together with synthetic aroma chemical inputs, account for roughly thirty-nine percent of production cost of goods sold for most alcoholic flavor manufacturers. Energy costs for extraction and compounding processes add a further meaningful input for producers running continuous production at scale across multiple facilities.
Botanical feedstock prices spiked sharply in 2022 following the broader agricultural commodity volatility documented in the USDA's specialty crop reporting, pushing natural extract production costs up by an estimated twenty percent within a single year before gradually easing through 2023 and 2024. Several mid-tier flavor houses reported margin compression during this period severe enough to delay planned natural extraction capacity expansions. Producers with unhedged spot-market purchasing bore the brunt of this spike more severely than integrated rivals.

Cost exposure varies considerably by flavor house scale and formulation mix. Large integrated producers like Givaudan, which source botanical feedstock through direct grower relationships, absorb volatility more easily than standalone flavor specialists reliant on spot market purchasing. Geographically, flavor houses sourcing from diversified growing regions face less concentrated weather risk than those dependent on a single botanical sourcing region for a key flavor input.
alcoholic-flavors-market-cost-volatility-analysis-1787461393762

Long-Term Botanical Grower Supply Agreements

Several flavor houses have moved to multi-year botanical purchase agreements directly with growers, trading some pricing flexibility for protection against the kind of sharp spikes documented during the 2022 agricultural commodity volatility, reducing quarter-to-quarter cost unpredictability meaningfully for finance and planning teams. Several buyers now cite this pricing stability as a factor when evaluating long-term supplier relationships directly.

Diversified Botanical Sourcing Region Strategy

Flavor houses are diversifying botanical sourcing across multiple growing regions to reduce dependence on any single region's weather or harvest conditions, trading some logistics complexity for meaningfully improved supply security during regional disruption events specifically. This diversification has already reduced exposure meaningfully during recent regional harvest disruption events. Several flavor houses report improved delivery reliability from this approach already.

Synthetic Backup Formulation Development

Producers are maintaining validated synthetic backup formulations for key natural flavor profiles, allowing them to temporarily substitute during natural feedstock shortages without disrupting customer delivery schedules, though this remains a secondary rather than primary sourcing strategy. Producers pursuing this path report meaningfully smoother customer delivery during recent supply disruption periods. Adoption remains limited given the validation work backups require.

Portfolio Architecture for Margin Defence

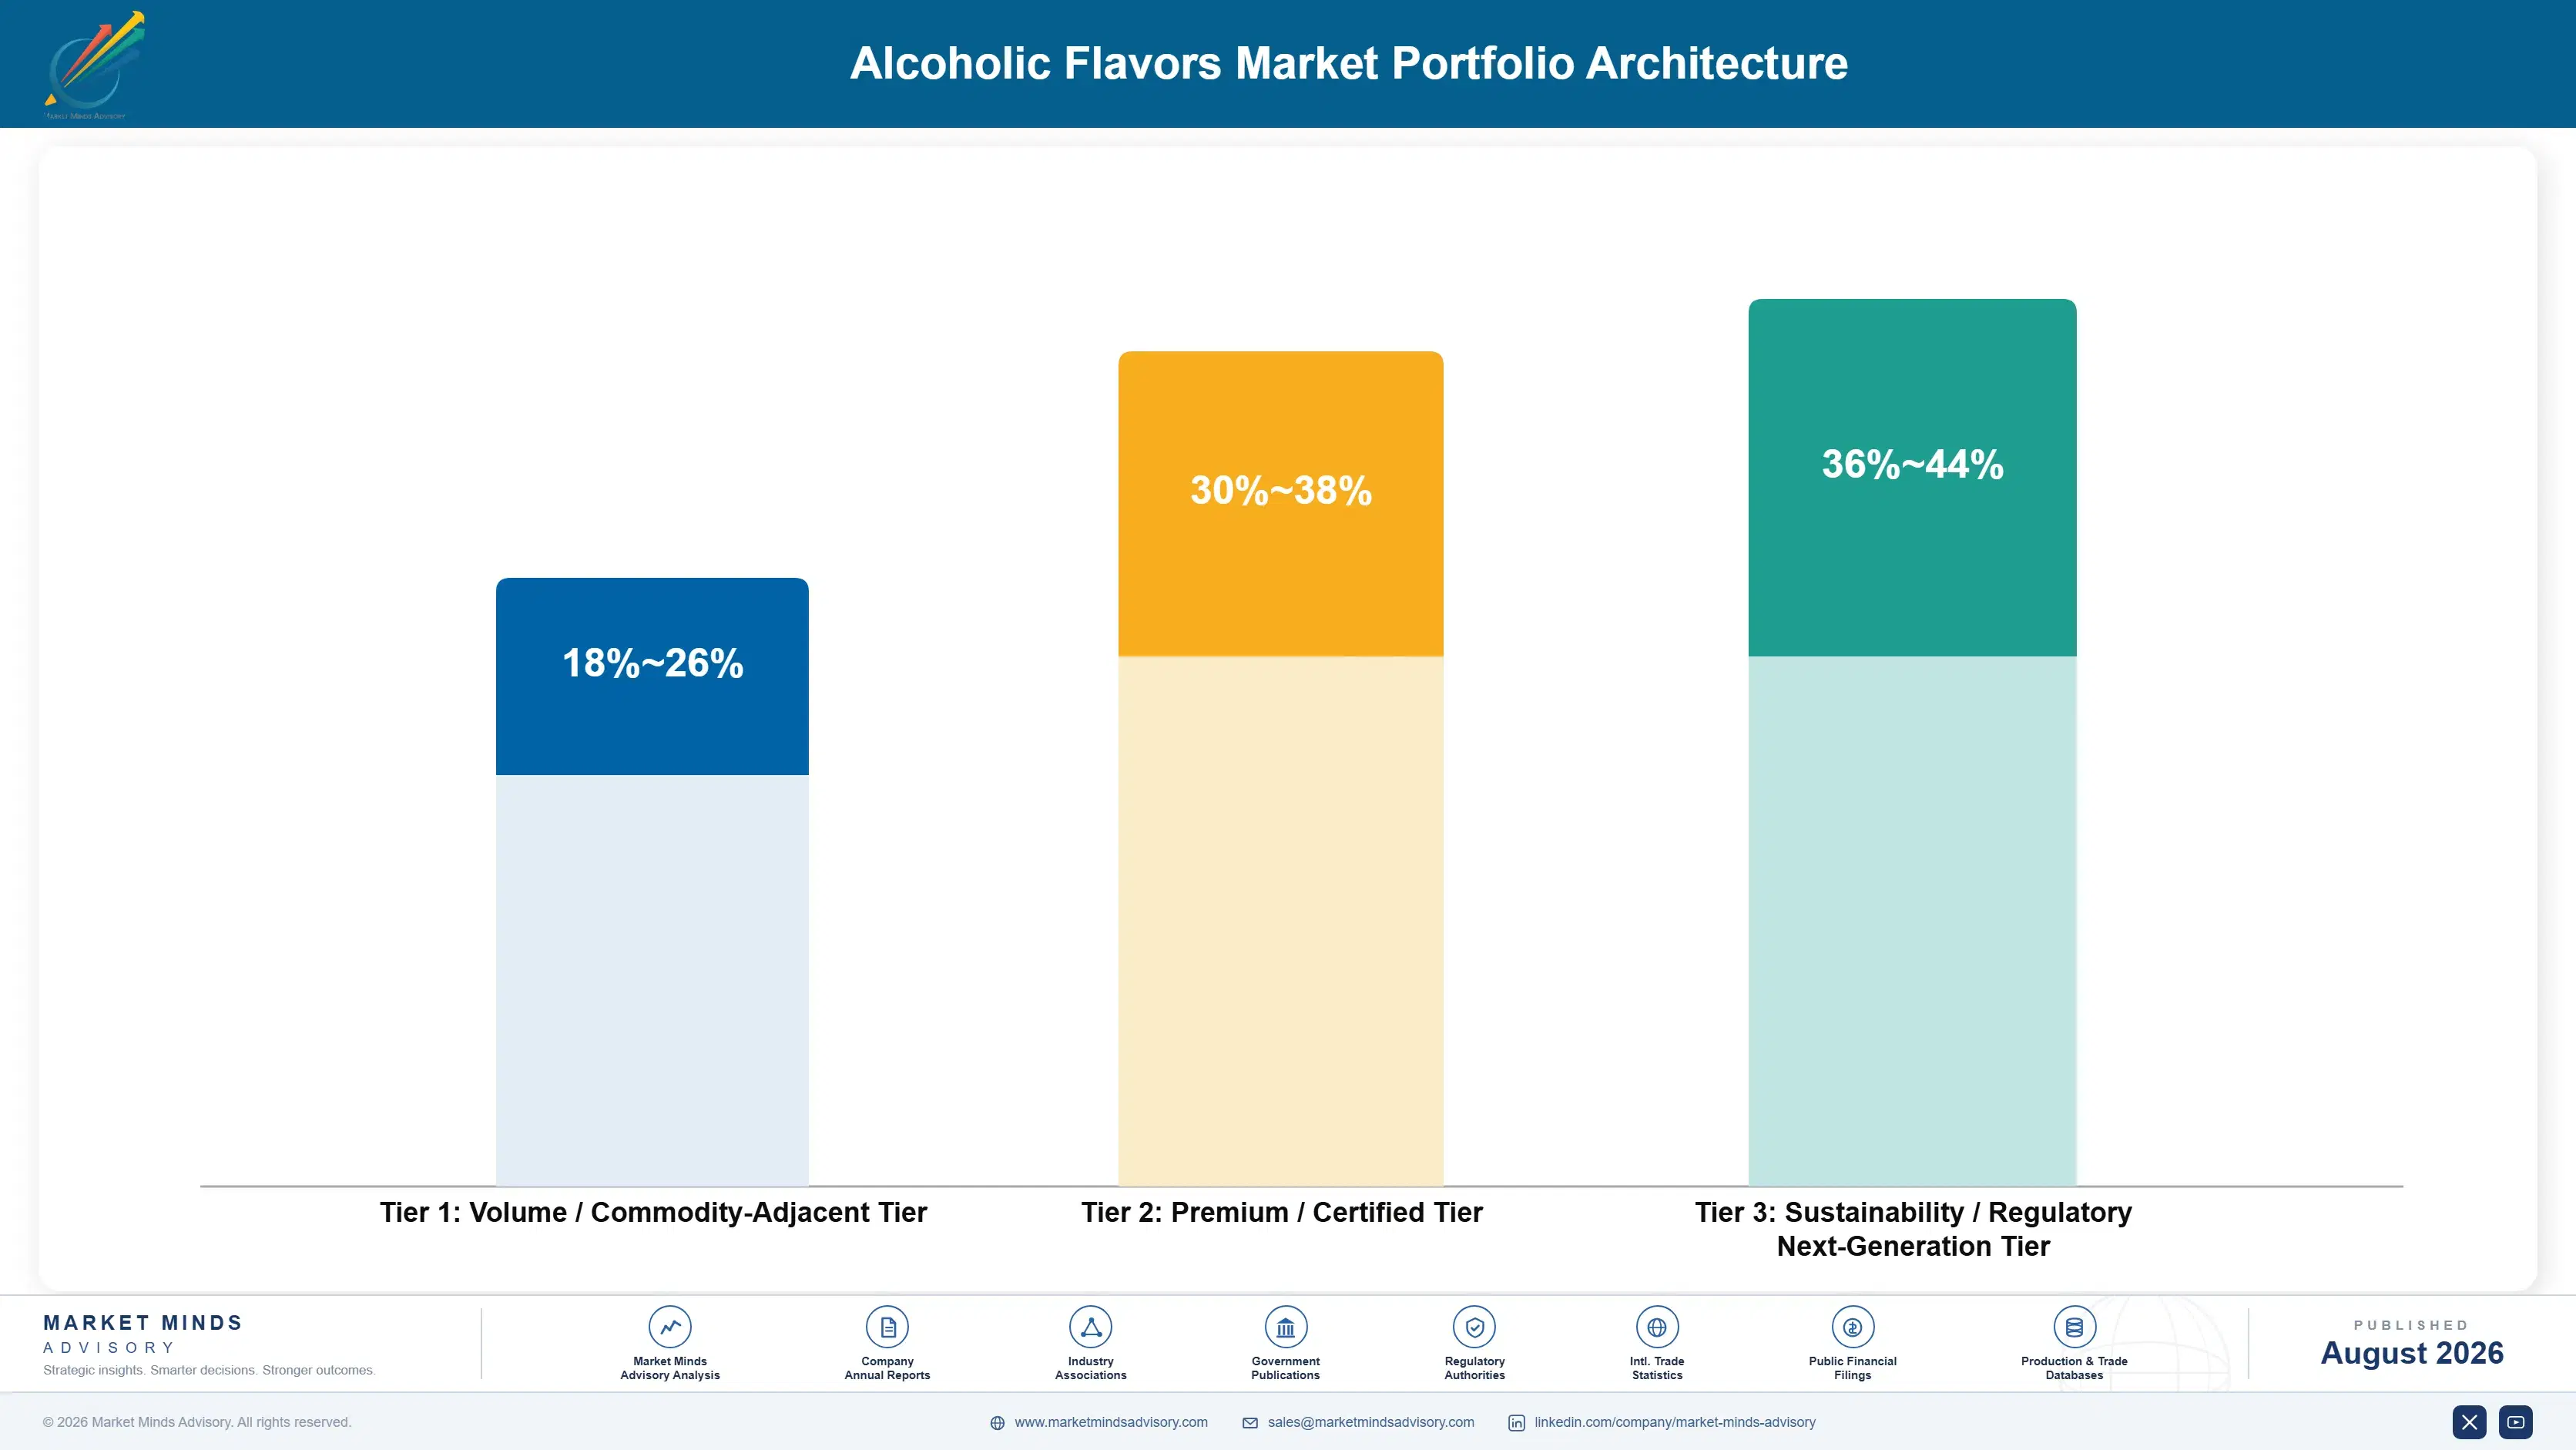
The portfolio splits into three tiers with distinct margin economics. Volume commodity-adjacent synthetic compounds compete largely on price against natural alternatives, premium natural extracts command a durable pricing advantage tied to labeling claims, and a smaller next-generation tier built on rapid ready-to-drink development services sits above both on a per-project margin basis. This means margin depends more on mix shift than on growing total volume.
The volume versus premium tension is real: synthetic compounds still represent meaningful global tonnage across price-sensitive mainstream beer and value spirits categories, but nearly all incremental margin growth is concentrated in natural extracts and ready-to-drink development services, creating pressure on flavor houses to shift capacity mix even where legacy demand remains a stable base business. Flavor houses who delay risk ceding relationships to rivals already positioned in the premium tier.

High-value margin pools concentrate in natural botanical extracts for premium and craft segments and dedicated ready-to-drink development capability, both of which reward flavor houses able to demonstrate validated speed and sensory quality consistently across demanding customer qualification cycles rather than simply offering the lowest per-kilogram price. Flavor houses demonstrating this consistency command a durable pricing advantage over rivals.

Volume / Commodity-Adjacent Tier

Standard synthetic flavor compounds sold into mainstream beer and value spirits applications where price competition against natural alternatives dominates purchasing decisions broadly. Little differentiation exists among flavor houses competing for this cost-sensitive business today.
Gross Margin: 18-26%

Premium / Certified Tier

Natural botanical extract formulations sold to premium spirits and craft distilling customers requiring validated natural labeling claims and distinctive flavor profiles. Buyers here validate labeling claims thoroughly before committing to a chosen supplier.
Gross Margin: 30-38%

Sustainability / Regulatory / Next-Generation Tier

Dedicated ready-to-drink development services and rapid-cycle flavor variant creation serving beverage brands with the most demanding turnaround requirements. Growth here outpaces both other tiers as ready-to-drink launches accelerate. This tier's premium should widen further as ready-to-drink development scales.
Gross Margin: 36-44%
alcoholic-flavors-market-portfolio-architecture-1787461394257

High-value Sub-segments and Strategic Watch-out

Ready-to-Drink Rapid Development Services

This segment combines the fastest volume growth with strong margins in the category, driven by seasonal flavor variant turnover across North America and rewarding flavor houses with dedicated development capability already in place today. Few competitors currently match this combination of growth and pricing power.
Gross Margin: 36-44%

Premium Natural Botanical Extracts

Craft distillers and premium spirits brands increasingly demand validated natural labeling here, supporting the strongest margins in the category, though volume remains smaller than mainstream synthetic categories overall currently. Producers here compete primarily on validated natural credentials rather than price. This edge should persist for several more years.
Gross Margin: 30-38%

Standard Synthetic Flavor Compounds

This remains a large volume base in the category, with pricing under continuous pressure from Asian competitors, leaving margins thinner than the premium natural and ready-to-drink tiers by a wide margin overall. Little brand differentiation exists among suppliers competing here today. Volume here should remain steady but unremarkable.
Gross Margin: 18-26%

Ready-to-Drink Category Growth Deceleration Risk

A strategic watch-out segment where ready-to-drink category growth could decelerate sharply as retail shelf space consolidates around fewer proven flavors, slowing the rapid turnover currently driving above-average category growth. Diversified flavor houses are watching this risk closely across their broader portfolios. Timing here remains genuinely difficult to predict.
Gross Margin: 20-28%

Rapid Cycles and Craft Loyalty Dynamics

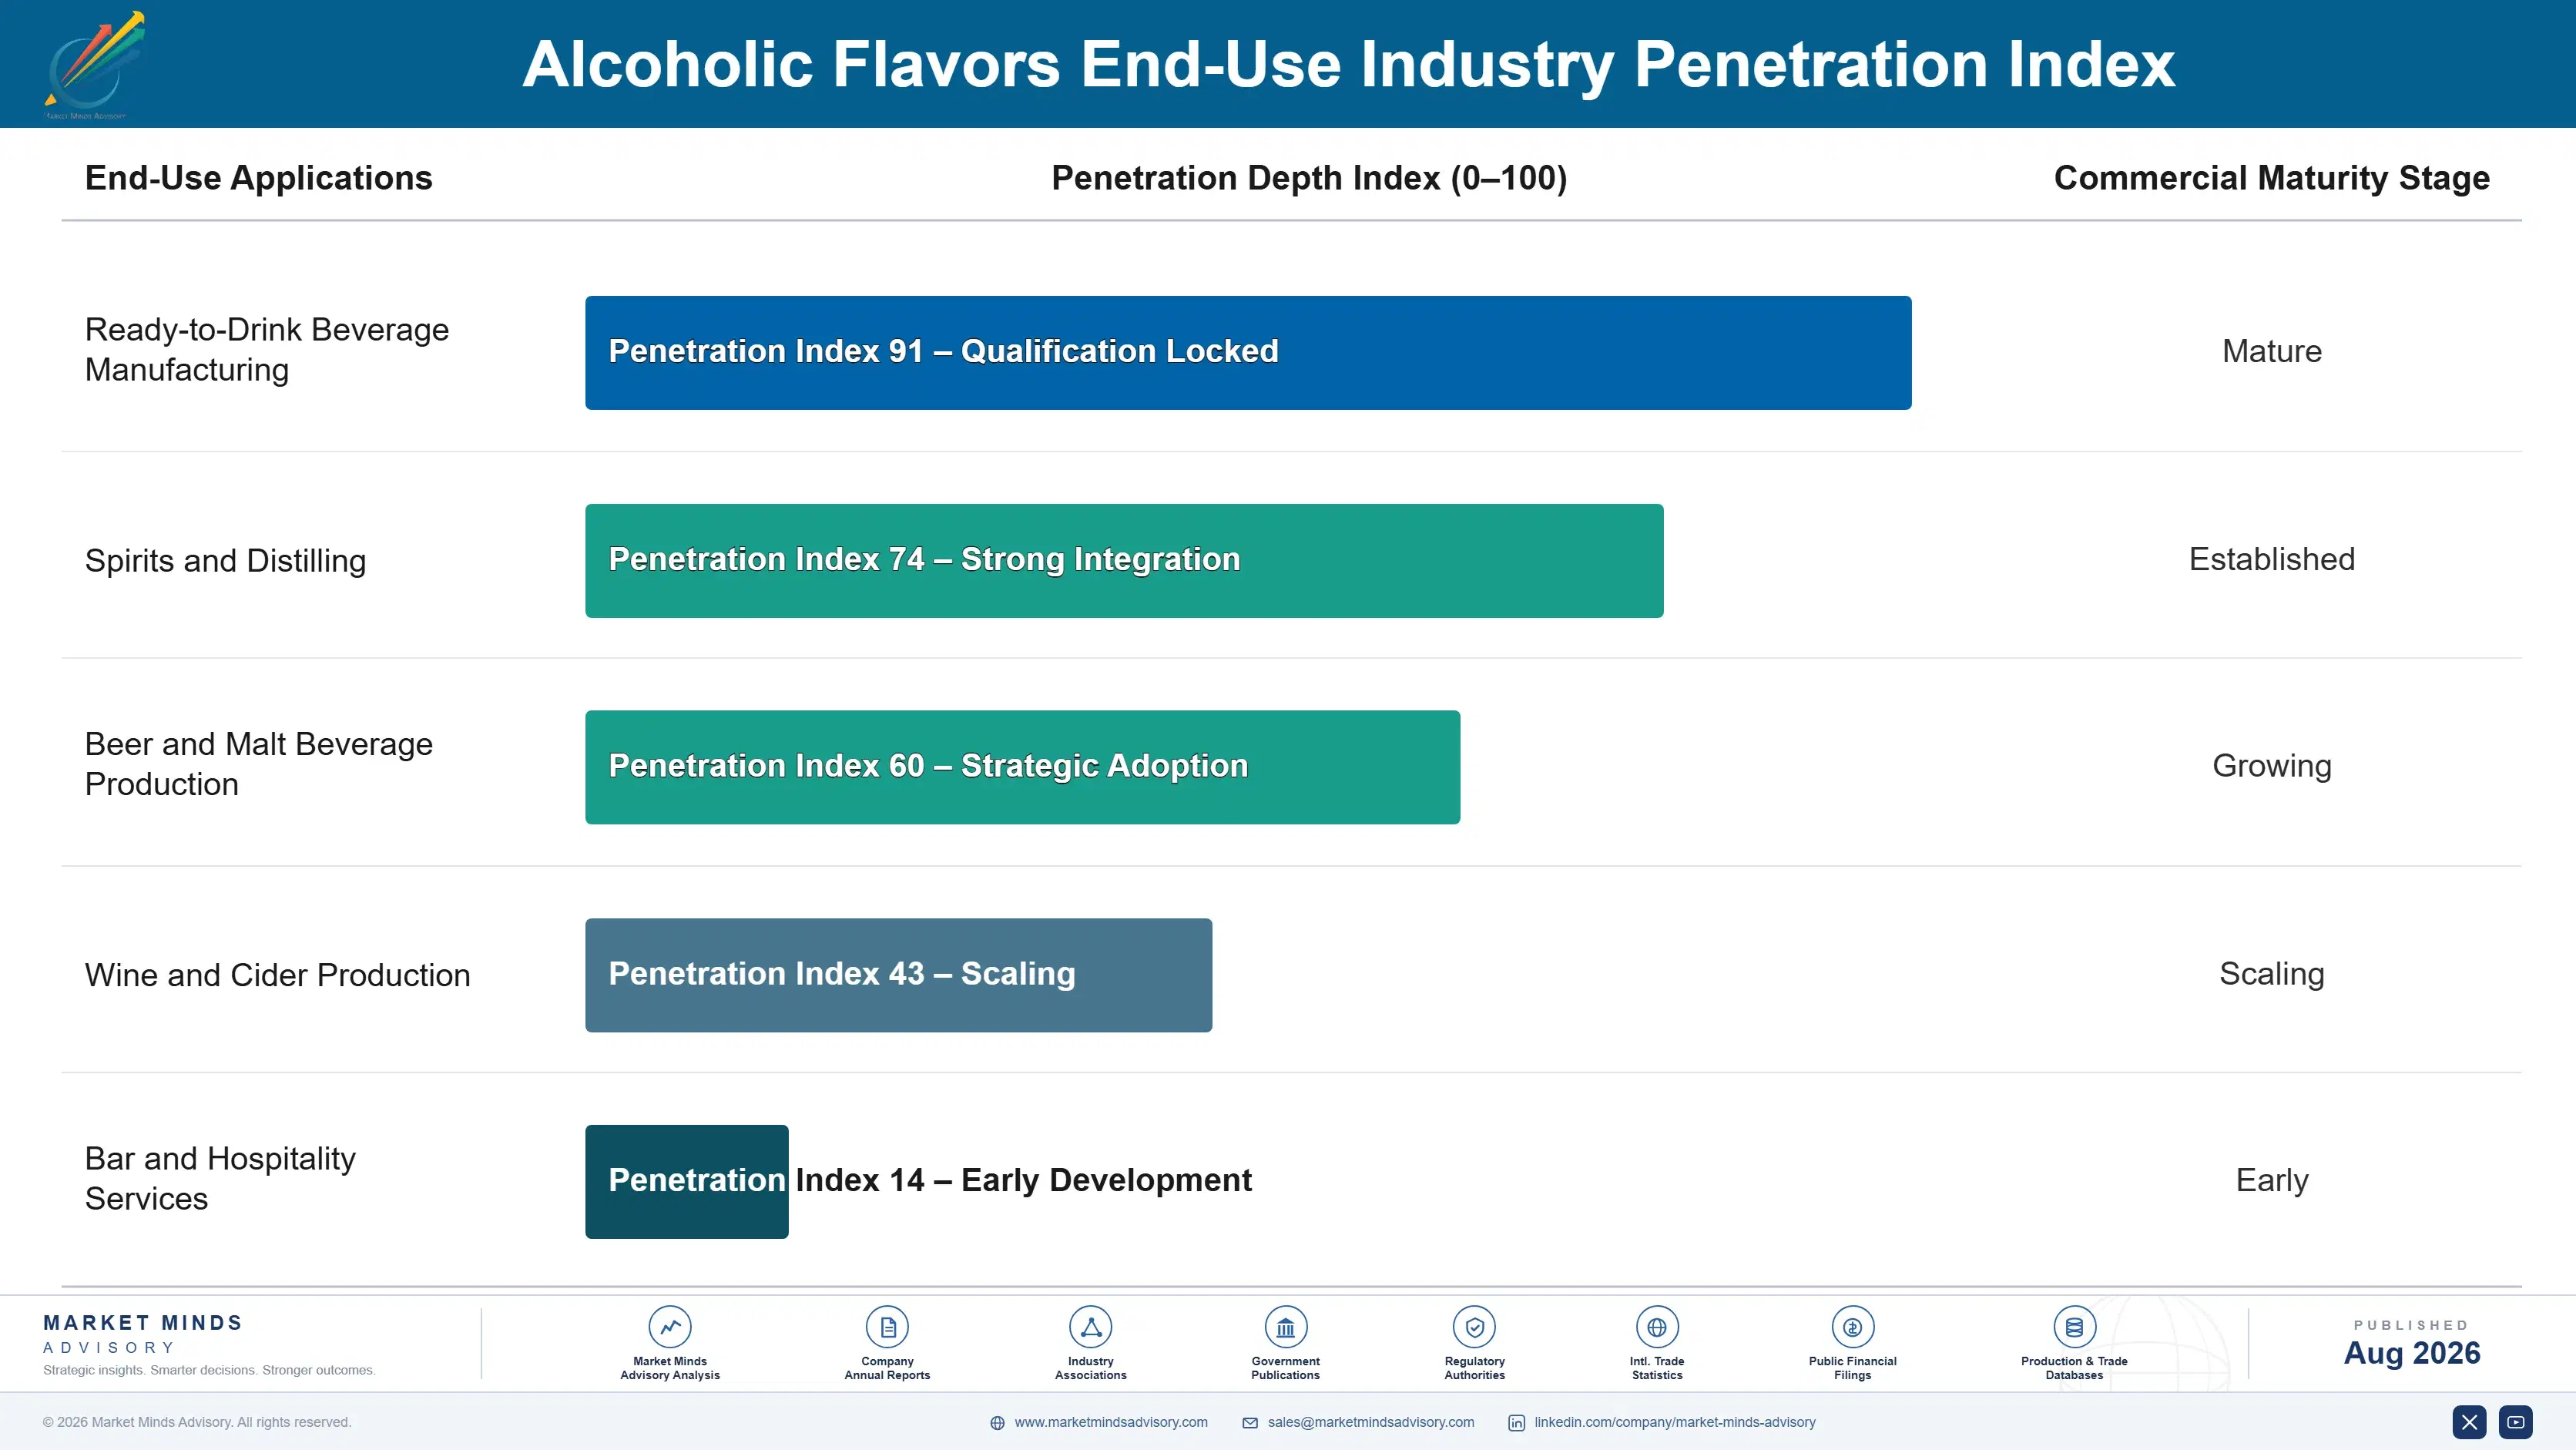
Alcoholic flavor demand behaves less like a single unified cycle and more like two distinct architectures running side by side, since ready-to-drink demand follows rapid seasonal turnover while craft distilling and premium spirits demand follows a slower, relationship-driven cycle, and the two require genuinely different flavor house capabilities to serve well simultaneously. Buyers rarely reverse a formulation decision once sensory outcomes are validated positively across trials.
Adoption depth varies considerably by end-use vertical. Craft distillers commit deepest, often single-sourcing a qualified flavor house across multiple product lines for years given the reputational risk of an inconsistent botanical profile. Premium spirits brands commit almost as deeply once a flavor profile is validated, since reformulating recipes disrupts brand consistency that loyal consumers notice immediately. Ready-to-drink brands show shallower commitment and switch partners more readily between seasonal cycles.

A generational shift in buyer profile is underway too. Younger beverage brand managers increasingly treat rapid flavor development turnaround as a default purchasing requirement rather than a negotiable specification, a mindset shift that is reshaping flavor house capability investment even independent of near-term commodity price swings. This shift persists even where near-term commodity price action seems uncertain.
alcoholic-flavors-market-end-use-penetration-index-1787461394745

Where Alcoholic Flavor Value Concentrates Next

These are among the four positions where our research anticipates prominent divergence between winners and laggards over the coming forecast period. Each is grounded in the demand model, the regulatory perimeter, and the announced capacity pipeline.
01 / NATURAL EXTRACT STRATEGY

Prioritize natural extraction capacity over synthetic expansion

Natural extract demand is compounding well above the category average, and flavor houses who have already shifted mix toward natural formulations report meaningfully better margins than those still weighted toward synthetic compounds. Flavor houses still expanding synthetic capacity are chasing a shrinking margin pool relative to natural alternatives gaining share. The economics of this mix shift now clear payback thresholds that looked marginal only a few years ago, making it the clearest capital allocation priority for flavor houses with flexibility to reallocate capacity toward natural extraction.
02 / READY-TO-DRINK SPEED POSITIONING

Build dedicated development capability before rivals close the gap

Ready-to-drink brands increasingly select flavor partners based on turnaround speed alongside proven sensory quality and consistency, and early movers on dedicated development capability report winning meaningfully more ready-to-drink customer accounts than competitors lacking equivalent speed. Flavor houses without this infrastructure risk losing this fast-growing segment entirely as brands finalize preferred supplier relationships over the coming several years across every major retail launch cycle. This window will not stay open indefinitely once ambitious rivals close the speed gap first across the industry.
03 / BOTANICAL SOURCING RISK MANAGEMENT

Diversify botanical sourcing before the next weather disruption

The 2022 botanical feedstock spike showed how exposed unhedged flavor houses are to agricultural commodity volatility affecting specialty aromatic plant sourcing across nearly every major producing region worldwide. Flavor houses without diversified sourcing or dedicated long-term grower agreements remain especially vulnerable to a repeat event, and margin compression during the last spike was severe enough to delay planned natural extraction expansions at several mid-tier competitors. Diversifying sourcing now costs considerably less than repeating that same costly mistake a second time.
04 / REGIONAL GROWTH SEQUENCING

Prioritize South Asia and Pacific expansion ahead of slower regions

South Asia and Pacific is growing faster than every other region tracked in this report, on the strength of India's expanding premium spirits consumption and Australia's growing craft distilling sector. Flavor houses sequencing expansion should weight this region ahead of slower-growing Eastern Europe or Middle East and Africa markets, where alcohol consumption restrictions and slower retail growth remain comparatively limiting for now. Early positioning here compounds advantage as regional brands finalize long-term flavor house relationships over the next several years.

Engagement Snapshot From the Field

A live engagement with an industry participant carrying material or product regulatory and market exposure ahead of a defining policy shift, showing how our research translates into a defensible multi-year portfolio strategy.
MARKET MINDS ADVISORY · CLIENT ENGAGEMENT SUMMARY
Alcoholic Flavors Producer Strategic Portfolio Review and Transition Roadmap 2026·Investment Scenario on Alcoholic Flavors Exposure Evaluation 2025-26
CLIENT PROFILE
The client, a mid-tier alcoholic flavor house headquartered in Western Europe with reported annual revenue of approximately 165 million dollars (client-reported, unverified by MMA), operates production facilities supplying standard synthetic flavor compounds primarily into regional mainstream spirits and beer markets, with limited presence in higher-margin natural extract and ready-to-drink development segments relative to established leaders.
STRATEGIC CHALLENGE
The client faced sustained margin compression from Asian import competition on its core synthetic compound business, while lacking the natural extraction capability and ready-to-drink development infrastructure needed to compete for higher-margin contracts, leaving it uncertain whether to compete on cost or pivot toward premium segments entirely. a decision that would shape its competitive positioning for years to come.
MMA APPROACH
MMA conducted a comparative margin analysis across flavor categories using primary survey data and expert interviews with ready-to-drink and craft distilling buyers, benchmarked the client's cost structure against integrated competitors, and modeled portfolio shift scenarios weighted by projected demand growth across each segment through 2036, drawing on this report's underlying dataset.
KEY FINDINGS
  1. Natural extract conversion offered a projected eighteen to twenty-four point margin improvement over the client's existing synthetic product line within three years of sustained investment.
  2. Regional ready-to-drink brands were actively seeking additional qualified flavor development partners, an opportunity the client had not yet pursued despite relevant infrastructure.
  3. The client's existing production capacity was reasonably well suited to natural extraction with moderate process modifications rather than entirely new facility investment.
  4. Competing regional flavor houses had not yet made equivalent portfolio shifts, giving the client a meaningful first-mover window in its home market region.
CLIENT PROFILE
The client, a mid-tier alcoholic flavor house headquartered in Western Europe with reported annual revenue of approximately 165 million dollars (client-reported, unverified by MMA), operates production facilities supplying standard synthetic flavor compounds primarily into regional mainstream spirits and beer markets, with limited presence in higher-margin natural extract and ready-to-drink development segments relative to established leaders.
STRATEGIC CHALLENGE
The client faced sustained margin compression from Asian import competition on its core synthetic compound business, while lacking the natural extraction capability and ready-to-drink development infrastructure needed to compete for higher-margin contracts, leaving it uncertain whether to compete on cost or pivot toward premium segments entirely. a decision that would shape its competitive positioning for years to come.
MMA APPROACH
MMA conducted a comparative margin analysis across flavor categories using primary survey data and expert interviews with ready-to-drink and craft distilling buyers, benchmarked the client's cost structure against integrated competitors, and modeled portfolio shift scenarios weighted by projected demand growth across each segment through 2036, drawing on this report's underlying dataset.
KEY FINDINGS
  1. Natural extract conversion offered a projected eighteen to twenty-four point margin improvement over the client's existing synthetic product line within three years of sustained investment.
  2. Regional ready-to-drink brands were actively seeking additional qualified flavor development partners, an opportunity the client had not yet pursued despite relevant infrastructure.
  3. The client's existing production capacity was reasonably well suited to natural extraction with moderate process modifications rather than entirely new facility investment.
  4. Competing regional flavor houses had not yet made equivalent portfolio shifts, giving the client a meaningful first-mover window in its home market region.
RECOMMENDED STRATEGY
Phase 1: Phase 1 (0-6 months): Commission process modifications to enable natural extraction alongside existing synthetic compound capacity. with priority given to its largest existing customer relationships. Phase 2: Phase 2 (6-18 months): Pursue development partnerships with regional ready-to-drink brands seeking faster flavor turnaround. while validating sensory outcomes across multiple flavor variant trials. Phase 3: Phase 3 (18-36 months): Scale natural extraction based on qualification success and expand dedicated development team capacity. while monitoring customer conversion rates closely throughout the rollout.
OUTCOME
Within eighteen months of implementing the phased strategy, the client reported securing several new natural extract supply contracts and a reported blended gross margin improvement of roughly eight percentage points across its product portfolio (client-reported, unverified by MMA), partially offsetting continued synthetic compound volume pressure.

Frequently Asked Questions

Foundational context covering the market sizes, CAGR, scope, country, region and competition that inform every finding below. This section is provided to cover basics and most often pre-purchase conversations, answered from the MMA Primary Research Dataset.

What is the current size of the Alcoholic Flavors Market?

The global alcoholic flavors market was valued at approximately 2.1 billion dollars in 2025. Growth is concentrated in ready-to-drink and natural extract segments rather than legacy synthetic compound demand.

How large will the Alcoholic Flavors Market be by 2036?

The market is projected to reach approximately 4.43 billion dollars by 2036. This represents roughly a 1.97 times expansion from 2026 levels over the forecast period.

What is the CAGR for the Alcoholic Flavors Market 2026 to 2036?

The market is forecast to grow at a compound annual growth rate of 7.0 percent between 2026 and 2036. Bull and bear scenarios range from 5.8 to 8.2 percent depending on ready-to-drink category conditions.

Which segment is growing fastest?

Ready-to-drink cocktails and hard seltzers are the fastest-growing segment, expanding at approximately 10.8 percent annually. This is roughly 1.54 times the overall market growth rate, driven by rapid flavor variant launches.

Who are the major companies in the Alcoholic Flavors Market?

Leading flavor houses include Givaudan, IFF, Symrise AG, Sensient Technologies, and Robertet Group. These five companies together control roughly forty-eight percent of global production capacity.

Which country is growing fastest?

India is the fastest-growing national market, expanding at approximately 9.4 percent annually. Growth is driven by expanding premium spirits consumption and changing social attitudes toward alcohol among urban consumers.

Report Segmentation Architecture

The full report scope spans multiple orthogonal segmentation dimensions, with cross-tabulated demand data provided for each dimension pair. Coverage extends further to regional breakdowns, trend trajectories, and the competitive detail needed to support segment-level decision-making.

By Beverage Application

  • Ready-to-Drink Cocktails and Hard Seltzers
  • Flavored Spirits
  • Flavored Malt Beverages and Beer
  • Flavored Wine and Cider
  • Craft Distilling Flavor Extracts
  • Bar and Foodservice Flavor Concentrates

By End-Use Industry

  • Ready-to-Drink Beverage Manufacturing
  • Spirits and Distilling
  • Beer and Malt Beverage Production
  • Wine and Cider Production
  • Bar and Hospitality Services

By Commercial Dimension

  • Direct Manufacturer Supply
  • Distributor Channel Sales
  • Development Partnership Contracts
  • Project-Based Flavor Commissioning

By Region

  • North America
  • Western Europe
  • East Asia
  • South Asia and Pacific
  • Latin America
  • Middle East and Africa
  • Eastern Europe

Scope, Methodology, and Coverage

Every figure in this report is reproducible from documented input assumptions. The scope below maps the historical period, the forecast horizon, the segmentation dimensions, and the countries covered, alongside the underlying primary and qualitative methodology.
Historical Period
2020 to 2025
Forecast Period
2026 to 2036
Base Year
2025 (USD billions; MMA Primary Research Dataset, August 2026)
Market Definition
The alcoholic flavors market covers commercial production and sale of flavor compounds, extracts, and concentrates used to flavor spirits, ready-to-drink cocktails, flavored malt beverages, wine, and cider. It excludes the finished alcoholic beverages themselves and non-alcoholic flavor compounds sold for food, confectionery, or soft drink applications outside the alcoholic beverage industry.
Quantitative Units
USD billions (current prices); metric tons of flavor compound volume where applicable
Segmentation Dimensions
By Beverage Application; By End-Use Industry; By Commercial Dimension; By Region
Regions Covered
North America, Western Europe, East Asia, South Asia and Pacific, Latin America, Middle East and Africa, Eastern Europe
Countries Covered
USA, China, Germany, France, UK, Japan, South Korea, India, Australia, Canada, Brazil, Mexico, Indonesia, Vietnam, Thailand, Malaysia, UAE, Saudi Arabia, South Africa, Nigeria, Turkey, Poland, Netherlands, Italy, Spain, Sweden, Switzerland, Argentina, Colombia, Singapore, and additional markets relevant to this sector
Key Companies Profiled
Givaudan, IFF, Symrise AG, Sensient Technologies, Robertet Group, dsm-firmenich, Kerry Group, Takasago International, T. Hasegawa, Mane SA, Bell Flavors and Fragrances, Comax Flavors, Flavorchem Corporation, Synergy Flavors, Virginia Dare, Ungerer and Company, David Michael and Co, WILD Flavors, Prova Flavors, Huabao International
Quantitative Methodology
Primary survey, n=3,800 respondents, Q4 2025, six countries; demand-side model with trade association cross-validation
Qualitative Methodology
47 expert interviews, Q4 2025; applied to validate demand model assumptions, identify emerging dynamics, and assess competitive positioning
Report Format
PDF and XLSX data workbook (Word format preview document)
Publisher
Market Minds Advisory
Report Code
MMA-2026-CHM-105
Published
August 2026
Contact
sales@marketmindsadvisory.com | www.marketmindsadvisory.com

Purchase the full Alcoholic Flavors Market Report (2026 to 2036).

This report delivers a complete commercial assessment of the global alcoholic flavors market across beverage applications, competitive dynamics, and seven world regions. It includes detailed segmentation analysis, competitive benchmarking of twenty profiled companies, and quantified feedstock cost and category growth risk assessments across every major producing geography. Analysts combine primary survey data from 3,800 respondents with 47 expert interviews conducted in the fourth quarter of 2025 to validate demand forecasts running through 2036. The report is designed to support portfolio strategy, capacity planning, and customer segment prioritization decisions for flavor houses.
Ten-year quantitative market forecast across all segments
Detailed application-level segmentation analysis and pricing
Seven-region demand breakdown with share and CAGR data
Twenty-company competitive profiles with moat and risk analysis
Botanical sourcing risk assessment with mitigation strategies
Ready-to-drink and craft distilling opportunity analysis

Built For The People Who Decide

From boardroom strategy to bench-side execution, this report is read cover-to-cover by leaders shaping the next decade of their industry, turning demand scenarios, market dynamics and valuation benchmarks into decisions.
CXOs/ Presidents/ VPs/ Managers
M&A and Corporate Development
Strategy Teams and R&D Heads
Procurement and Product Directors
Regulatory and Compliance Leaders
Investor Relations and Equity Analysts