Market Minds Advisory
APAC Air Pollution Control Systems Market

APAC Air Pollution Control Systems Market: Retrofit Economics, Nitrogen Oxide Compliance and Aftermarket Capture, 2026 to 2036

Emission limits right across Asia now bite hardest on nitrogen oxides, and each of the catalyst-based systems that meet them carries a consumable replacement cycle that changes supplier economics completely.

Lead Analyst

David Horsley

Published

September 2026

Make Smarter Decisions with Customized Research Insights

Request a free sample report and evaluate market opportunities, growth trends, and competitive dynamics relevant to your business needs.

2025 MARKET VALUE$31.0BMarket Size 2025
2036 FORECAST VALUE$61.3BBase Case , 2026 to 2036
CAGR 2026 TO 20366.4 %Bull 7.6% / Bear 5.2%
INCREMENTAL OPPORTUNITY$28.4BNet 10- year value creation
EXPANSION MULTIPLE1.86x2036 value over 2026 base
Strategic Levers
M&A Pipeline
Regional Outlook
Country Rankings
Competitive Intelligence
Segmental Deep-dive
Call-Us : 91 93563 13602

Executive Snapshot and Market Trajectory

Compliance has shifted from particulate toward nitrogen oxides, and that shift changes who actually wins. Dust removal was a capital sale with a long quiet life afterwards; catalytic reduction is a capital sale followed by catalyst replacement every three to five years, which is a fundamentally better business.
Selective catalytic reduction and DeNOx systems grow at 9.6%, a full 1.50 times the market rate, pulled by Chinese ultra-low emission standards for coal and cement and by Indian norms that finally moved from deadline extension into enforcement. East Asia holds 54% of value within this Asia Pacific scope, far outside the standard global band, because Chinese industrial emission spending dwarfs everything else in the region.
Concentration is low at 26% for the top five, which is normal for engineering-led project markets where local fabrication and site access matter more than technology ownership. Retrofit rather than new build now accounts for 58% of spending, and retrofit is where the commercial difficulty sits: working inside an operating plant with a two-week outage window is an entirely different business from building the same equipment on a green field site.
Market Definition
The market covers engineered air pollution control systems supplied and installed across Asia Pacific for industrial and power generation stack emissions, spanning electrostatic precipitators, fabric filtration, flue gas desulphurisation, selective catalytic and non-catalytic reduction, wet scrubbers, mist eliminators, and thermal and catalytic oxidisers. It excludes indoor air quality equipment, vehicle exhaust aftertreatment, carbon capture systems, water and wastewater treatment, continuous emission monitoring instrumentation sold separately, and consumables purchased outside a system contract.
Base Year Value
$31.0B in 2025 (MMA Primary Research Dataset, August 2026)
Forecast Period
2026 to 2036, eleven discrete annual values
CAGR
6.4% base case. Bull 7.6%. Bear 5.2%.
Fastest Growth Segment
Selective Catalytic Reduction and DeNOx Systems: 9.6% CAGR
Fastest Growth Country
India: 9.4% CAGR
Fastest Growth Region
South Asia and Pacific: 8.7% CAGR
Largest Region
East Asia: 54% of 2025 global value
Market Leaders
Mitsubishi Heavy Industries, Fujian Longking, Doosan Enerbility, Hitachi Zosen, Ducon Technologies. Source: MMA Primary Research Dataset, July 2026.
Primary Survey
n=3,800 procurement and R&D decision-makers, Q4 2025, six countries
Methodology
Demand-side build-up, cross-validated against public data, 47 expert interviews

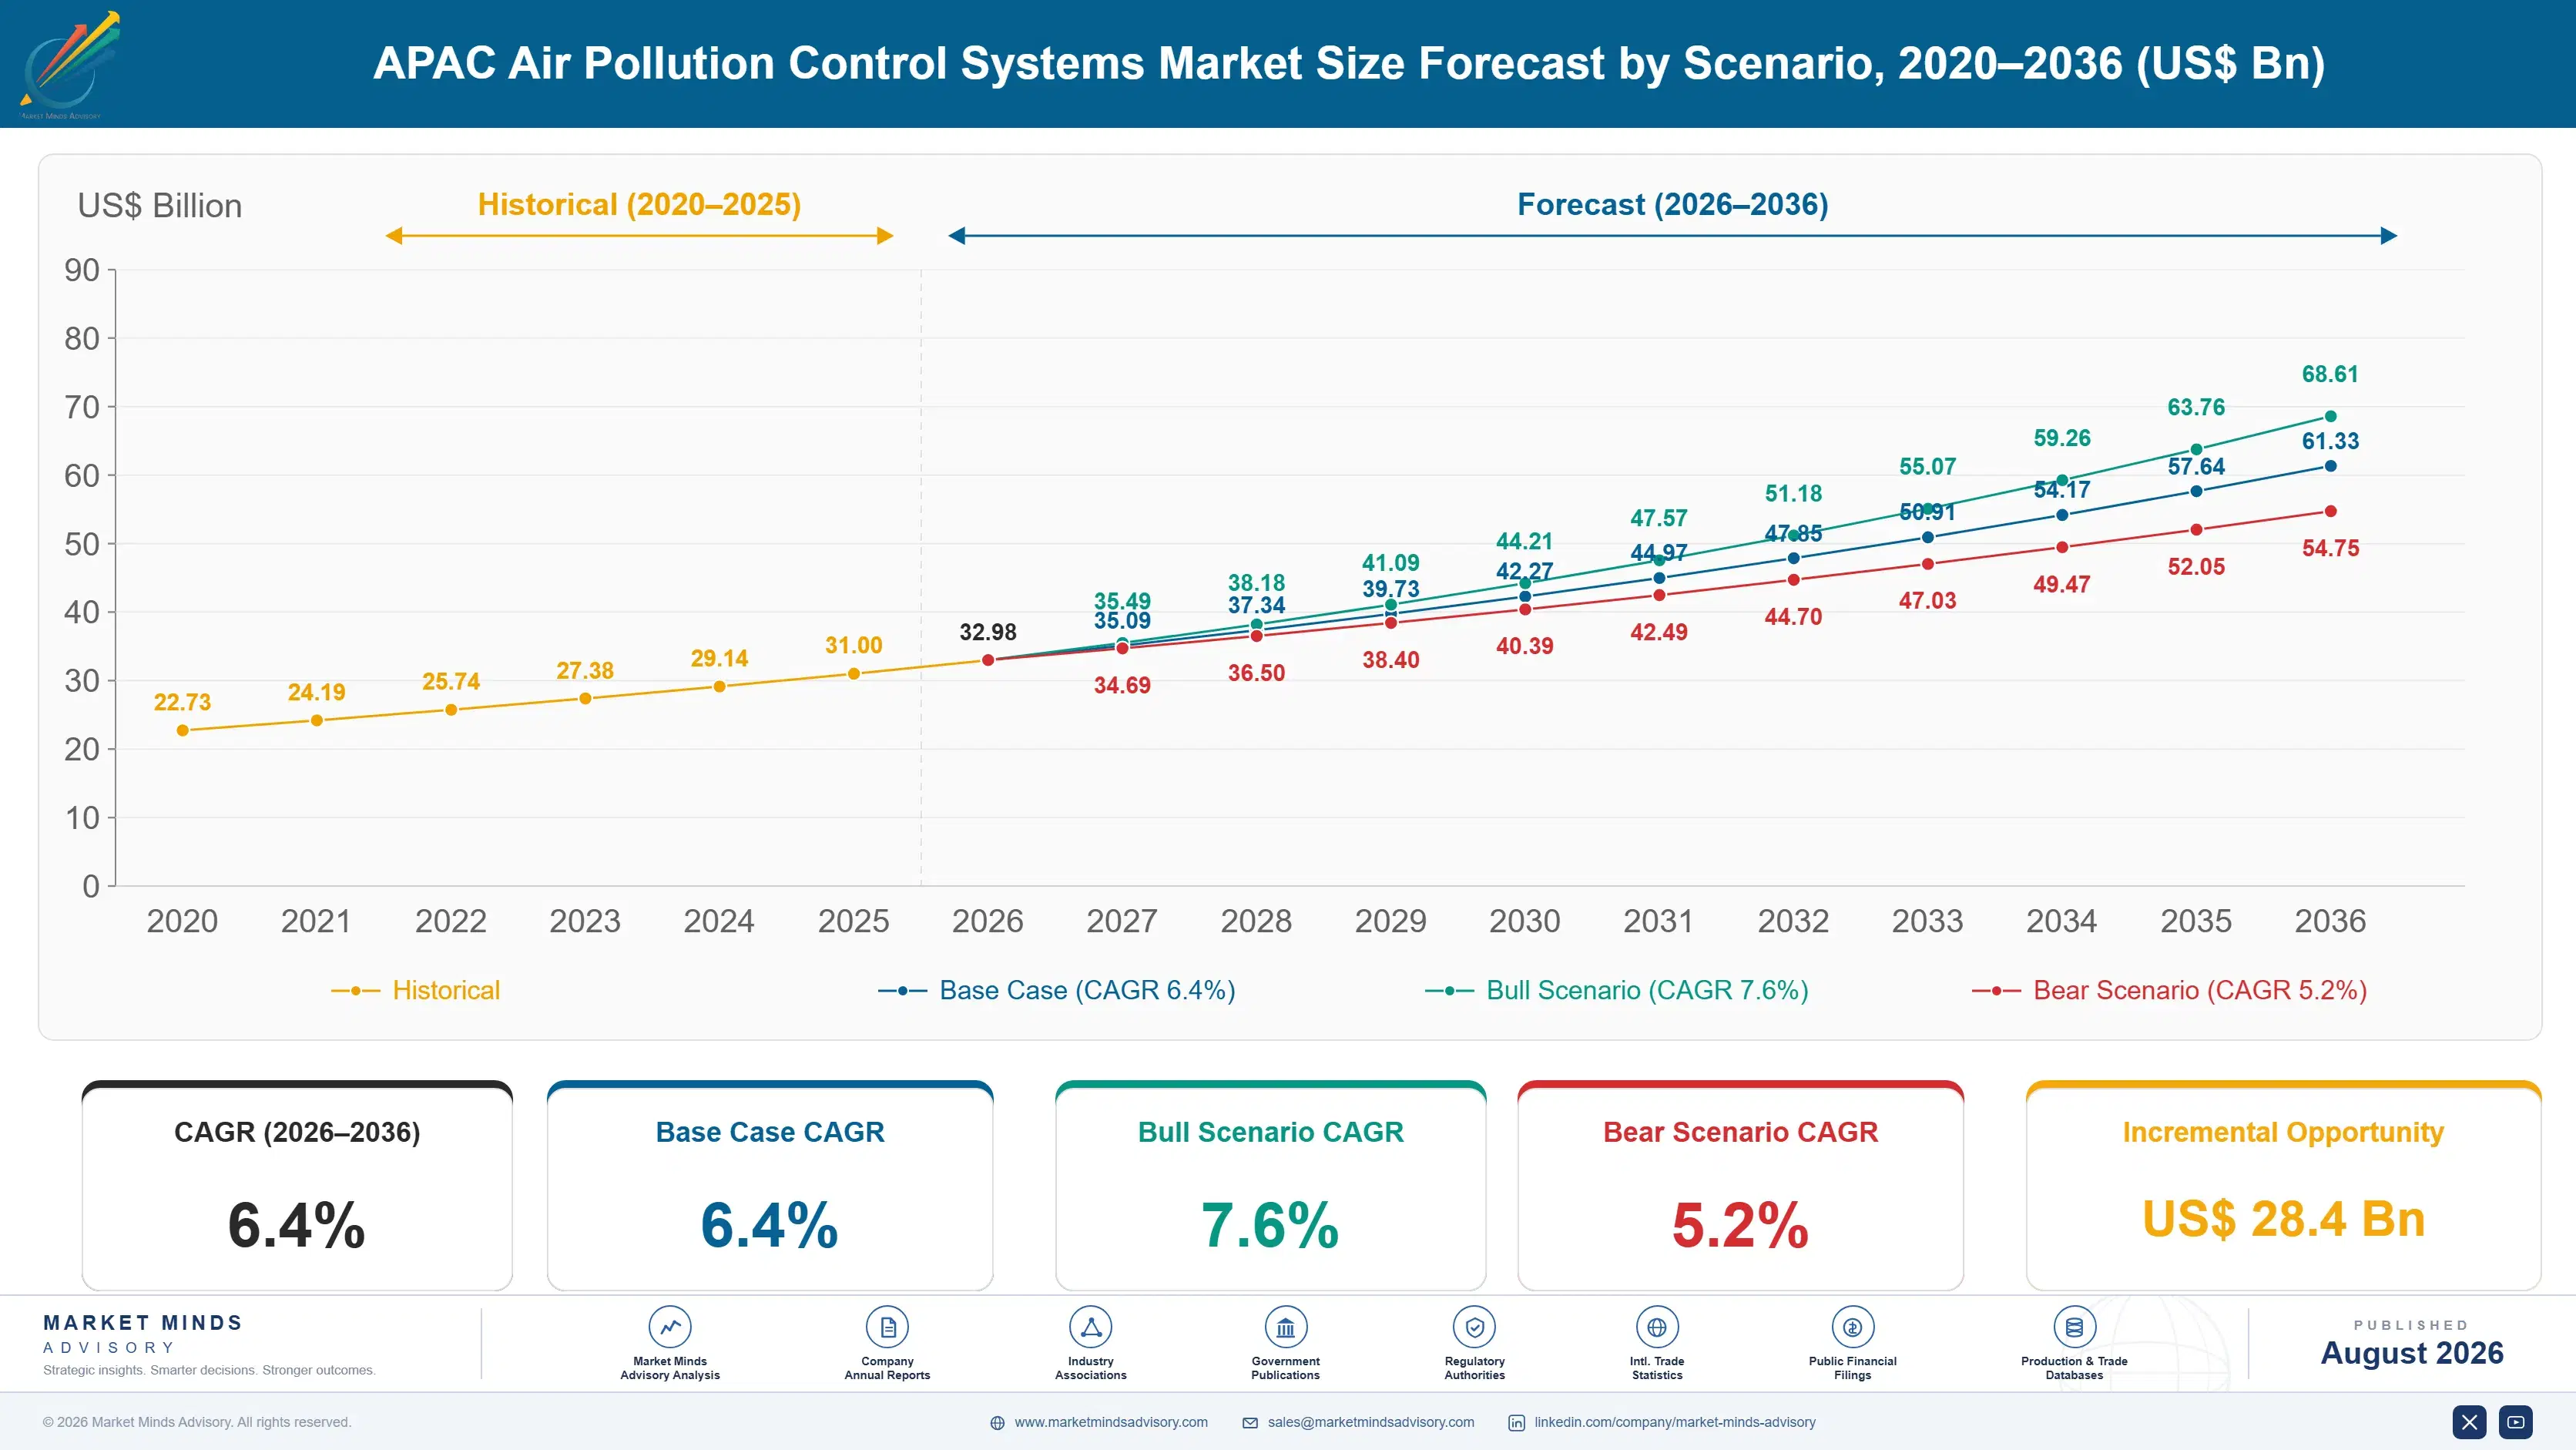
APAC Air Pollution Control Systems Market Forecast Scenarios

air-pollution-control-systems-market-trend-size-forecast-scenario-1787311654149
The market compounded at 5.2% between 2020 and 2025, and regulatory timing rather than industrial growth set the pace. Chinese ultra-low emission retrofit spending peaked around 2021 as the coal fleet programme completed, then softened. Indian thermal plant compliance deadlines were extended repeatedly, which deferred a very large spending pool rather than removing it. Cement and steel emission work grew steadily throughout.
The 6.4% base case rests on three mechanisms. First, Indian enforcement has finally begun and the deferred retrofit pool is substantial, covering a large installed coal fleet. Second, nitrogen oxide limits are tightening across cement, steel, glass and waste incineration in every major regional market, and catalytic systems carry recurring catalyst revenue. Third, aftermarket service and consumables now represent 29% of supplier revenue and grow faster than new equipment sales do.
The bull case at 7.6% assumes Indian deadlines hold this time and Southeast Asian standards tighten as announced across Vietnam and Indonesia. The bear case at 5.2% turns on coal retirement: if regional utilities accelerate plant closures rather than retrofitting, the largest single spending pool shrinks before the equipment is ever ordered, and cement and steel demand alone cannot replace that volume.

Why Retrofit Access Decides Project Economics

Air pollution control is sold as technology and won on logistics. Every credible supplier can meet a specified outlet concentration; the question is whether the system can be installed inside a fourteen-day plant outage, threaded through congested existing structures, and commissioned without a second shutdown.
TOP FIVE CONCENTRATION26%Combined position of the five largest regional system integrators
AVERAGE PROJECT VALUE$18 millionTypical contract value for a single installed control system
LEADING COUNTRY SHARE47%Chinese share of regional installed control system spending
RETROFIT DEMAND SHARE58%Portion of spending on existing rather than new installations
STEEL INPUT SHARE31% of COGSFabricated steel and alloy share of delivered system cost
AFTERMARKET REVENUE SHARE29%Share of supplier revenue from parts and service contracts
That is why the market stays fragmented at 26% for the top five despite decades of consolidation elsewhere in industrial equipment. Local fabrication shortens delivery, local erection crews cost less and understand site conditions, and a regional integrator who has already worked at a particular cement plant knows where the ducting actually runs rather than where the drawings say it does. Technology licensors without that presence end up supplying components to somebody else's contract.
The catalyst business has changed supplier economics more than any regulation did. A precipitator sold in 2015 generated almost no revenue afterwards. A selective catalytic reduction system generates catalyst replacement every three to five years, ammonia or urea supply, and performance guarantee work, and that recurring stream now represents 29% of supplier revenue across the region. Suppliers who structured contracts to capture it are worth considerably more than those who sold the box and walked away.
"The best air pollution control business in Asia is not the one with the best technology. It is the one that installed a hundred systems at cement plants across two provinces and now sells catalyst, bags and service to all of them on annual contracts. Nobody wins that installed base from you, because winning it means someone else's plant taking an outage."
Principal Analyst, Industrial Environmental Systems Practice · MMA Construction

Market Trends

Nitrogen Oxide Limits Displace Particulate As Binding Constraint

Regional regulation has largely settled the particulate question, with most large emitters now meeting limits through precipitators or fabric filters already installed. Nitrogen oxides are where the current tightening happens, across coal power, cement kilns, glass furnaces and waste incineration alike. Chinese ultra-low emission limits now require outlet concentrations below 50 milligrams per cubic metre on coal units, and Indian norms have moved toward comparable levels. That shift moves spending decisively toward catalytic systems carrying recurring consumable revenue rather than the one-off dust removal equipment that dominated the previous decade.
Market Impact: Covers 140 gigawatts of coal capaci

Aftermarket Contracts Reshape Supplier Revenue Quality

Catalyst replacement, filter bag changes, reagent supply and performance guarantee work now generate 29% of regional supplier revenue, and that share rises every year as the installed base ages. The revenue is stickier and considerably higher margin than project work, because an operator changing service supplier risks a guarantee dispute during its next compliance test. Suppliers who wrote multi-year service terms into their original equipment contracts capture it almost automatically. Those who did not now find independent service providers competing for exactly that work at prices they cannot realistically match.
Market Impact: Spans roughly 1,400 operating kilns

Market Opportunities and Growth Drivers

Indian Enforcement Releases A Deferred Retrofit Pool

Indian thermal plant emission norms were notified in 2015 and their compliance deadlines extended repeatedly, deferring rather than removing a very large retrofit spending pool. Enforcement has now begun in earnest, with penalty mechanisms attached and closure threats that operators finally treat as credible. Roughly 140 gigawatts of installed Indian coal capacity still requires flue gas desulphurisation or DeNOx work of some kind. Utilities that spent a decade waiting are now ordering simultaneously, which creates delivery constraints that heavily favour suppliers holding local fabrication capacity over anyone importing fabricated modules.
Market Impact: Allows 14 days of installation acce

Cement And Steel Emission Rules Broaden Beyond Power

Emission regulation across the region has extended well beyond power generation into cement kilns, steel sintering, glass furnaces and waste incineration, and those sectors present harder engineering problems than a coal boiler does. Cement kiln gas is dusty, variable and chemically aggressive, which favours suppliers with sector-specific reference lists rather than general capability. Regional cement production alone generates emission control demand across roughly 1,400 operating kilns. Industrial rather than utility work now grows faster and carries better margins, because the buyer in those sectors has far fewer qualified suppliers to choose between.
Market Impact: Removes 8% of pipeline annually

Market Restraints and Challenges

Outage Windows Constrain What Retrofit Work Is Possible

Retrofit accounts for 58% of spending, and retrofit must happen inside a planned plant outage that operators keep as short as commercially possible. The root cause is production economics: a cement kiln or power unit earns nothing while shut, so a fourteen-day window is generous and eight is common. Commercially this excludes suppliers who cannot pre-fabricate and stage modules for rapid installation. Participants are addressing it through modular pre-assembly, through digital survey and clash detection before shutdown, and by scheduling phased installations that spread the work across two consecutive annual outages.
Market Impact: Requires outlet below 50 milligrams

Coal Retirement Risk Undermines Retrofit Investment Cases

Operators facing a compliance requirement on an ageing coal unit must weigh retrofit capital against the plant's remaining life, and increasingly they choose closure. The root cause is that emission retrofit costs a substantial fraction of a new plant while adding no generating capacity or efficiency. Commercially this removes projects from the supplier pipeline before they are ever tendered at all. Participants are responding with leased and build-own-operate structures converting that capital requirement into operating cost, and with phased solutions meeting interim limits at lower capital cost while deferring the full installation.
Market Impact: Generates 29% of supplier revenue
4 additional market trends, 2 additional growth drivers, and 3 additional restraints and challenges are covered in the full report. Contact sales@marketmindsadvisory.com to access the complete intelligence.

Segment CAGR and Growth Architecture

Segmentation here follows control technology, meaning the physical mechanism by which each pollutant is removed or chemically converted. That single dimension determines the engineering discipline required, the recurring consumable content a supplier can capture, which regulatory limit the system addresses, and consequently how the whole commercial relationship with that operator behaves for years afterwards.
air-pollution-control-systems-market-trend-market-share-analysis-1787311654689

Selective Catalytic Reduction and DeNOx Systems

The fastest segment at 9.6%, a full 1.50 times the market rate, covering catalytic and non-catalytic nitrogen oxide reduction systems for coal boilers, cement kilns, glass furnaces and waste incineration plants. Regulation is doing all the work: particulate limits are largely satisfied across the region while nitrogen oxide limits keep tightening toward outlet concentrations below 50 milligrams per cubic metre. The commercial attraction is the catalyst itself, which requires replacement every three to five years and converts a project sale into a recurring revenue relationship. Reagent supply and performance guarantee work add further recurring content that dust removal equipment never generated at all, which is why supplier valuations now differ sharply by technology mix.
CAGR 9.6%

Fabric Filtration and Baghouse Systems

Growing at 8.0% annually on fabric filtration systems replacing or supplementing electrostatic precipitators in applications where outlet particulate limits have tightened well beyond what electrostatic collection reliably achieves. Cement, steel, waste incineration and industrial boiler applications together drive most of the demand here, and filter bag replacement every two to four years provides recurring revenue that precipitators do not. Bag material selection against gas temperature and chemistry is where suppliers here genuinely differentiate themselves, since a wrongly chosen specification fails within months rather than lasting years. Pressure drop and the fan power consumption that follows from it are the arguments operators raise against conversion, and both are entirely legitimate objections.
CAGR 8.0%
Full segment breakdown across 6 segments available in the complete report.

Regional Architecture and Country Demand Map

This market is scoped to Asia Pacific alone, so demand concentrates overwhelmingly within the East Asia and South Asia and Pacific regions. Remaining regional shares reflect only that portion of Asia Pacific projects which is contracted, engineered or supplied through entities based entirely outside the region.

East Asia

Fifty-four percent of value within this Asia Pacific scope. Note: this sits far outside the standard global band because the report covers Asia Pacific only, and Chinese industrial emission spending dwarfs every other regional market. China alone accounts for roughly 47% of regional installed system spending, driven by ultra-low emission standards applied across coal power, cement, steel and glass. Japanese and Korean demand is smaller but technically demanding, weighted toward waste incineration and industrial process work rather than power generation. Growth of 7.6% reflects the shift from particulate to nitrogen oxide compliance alongside an ageing installed base requiring service and catalyst replacement. Service and consumable revenue now grows faster than new equipment sales.
Share: 54% | CAGR: 7.6% (2026 to 2036)

South Asia and Pacific

Thirty-three percent of value within this Asia Pacific scope. Note: this sits far outside the standard global band for the same scoping reason, and it reflects Indian thermal plant compliance moving from deferral into enforcement. Roughly 140 gigawatts of Indian coal capacity still requires desulphurisation or DeNOx work, and utilities that waited a decade are now ordering simultaneously. Indonesian and Vietnamese standards are tightening on coal and cement, though enforcement remains uneven. Australian demand is smaller and weighted toward mining, minerals processing and waste incineration. Growth of 8.7% is the fastest anywhere within the region. Local fabrication capacity has become the binding delivery constraint as orders cluster against compliance deadlines.
Share: 33% | CAGR: 8.7% (2026 to 2036)
Regional intelligence for 5 additional markets available in the complete report: North America, Western Europe, Latin America, Middle East and Africa, Eastern Europe. Contact sales@marketmindsadvisory.com.
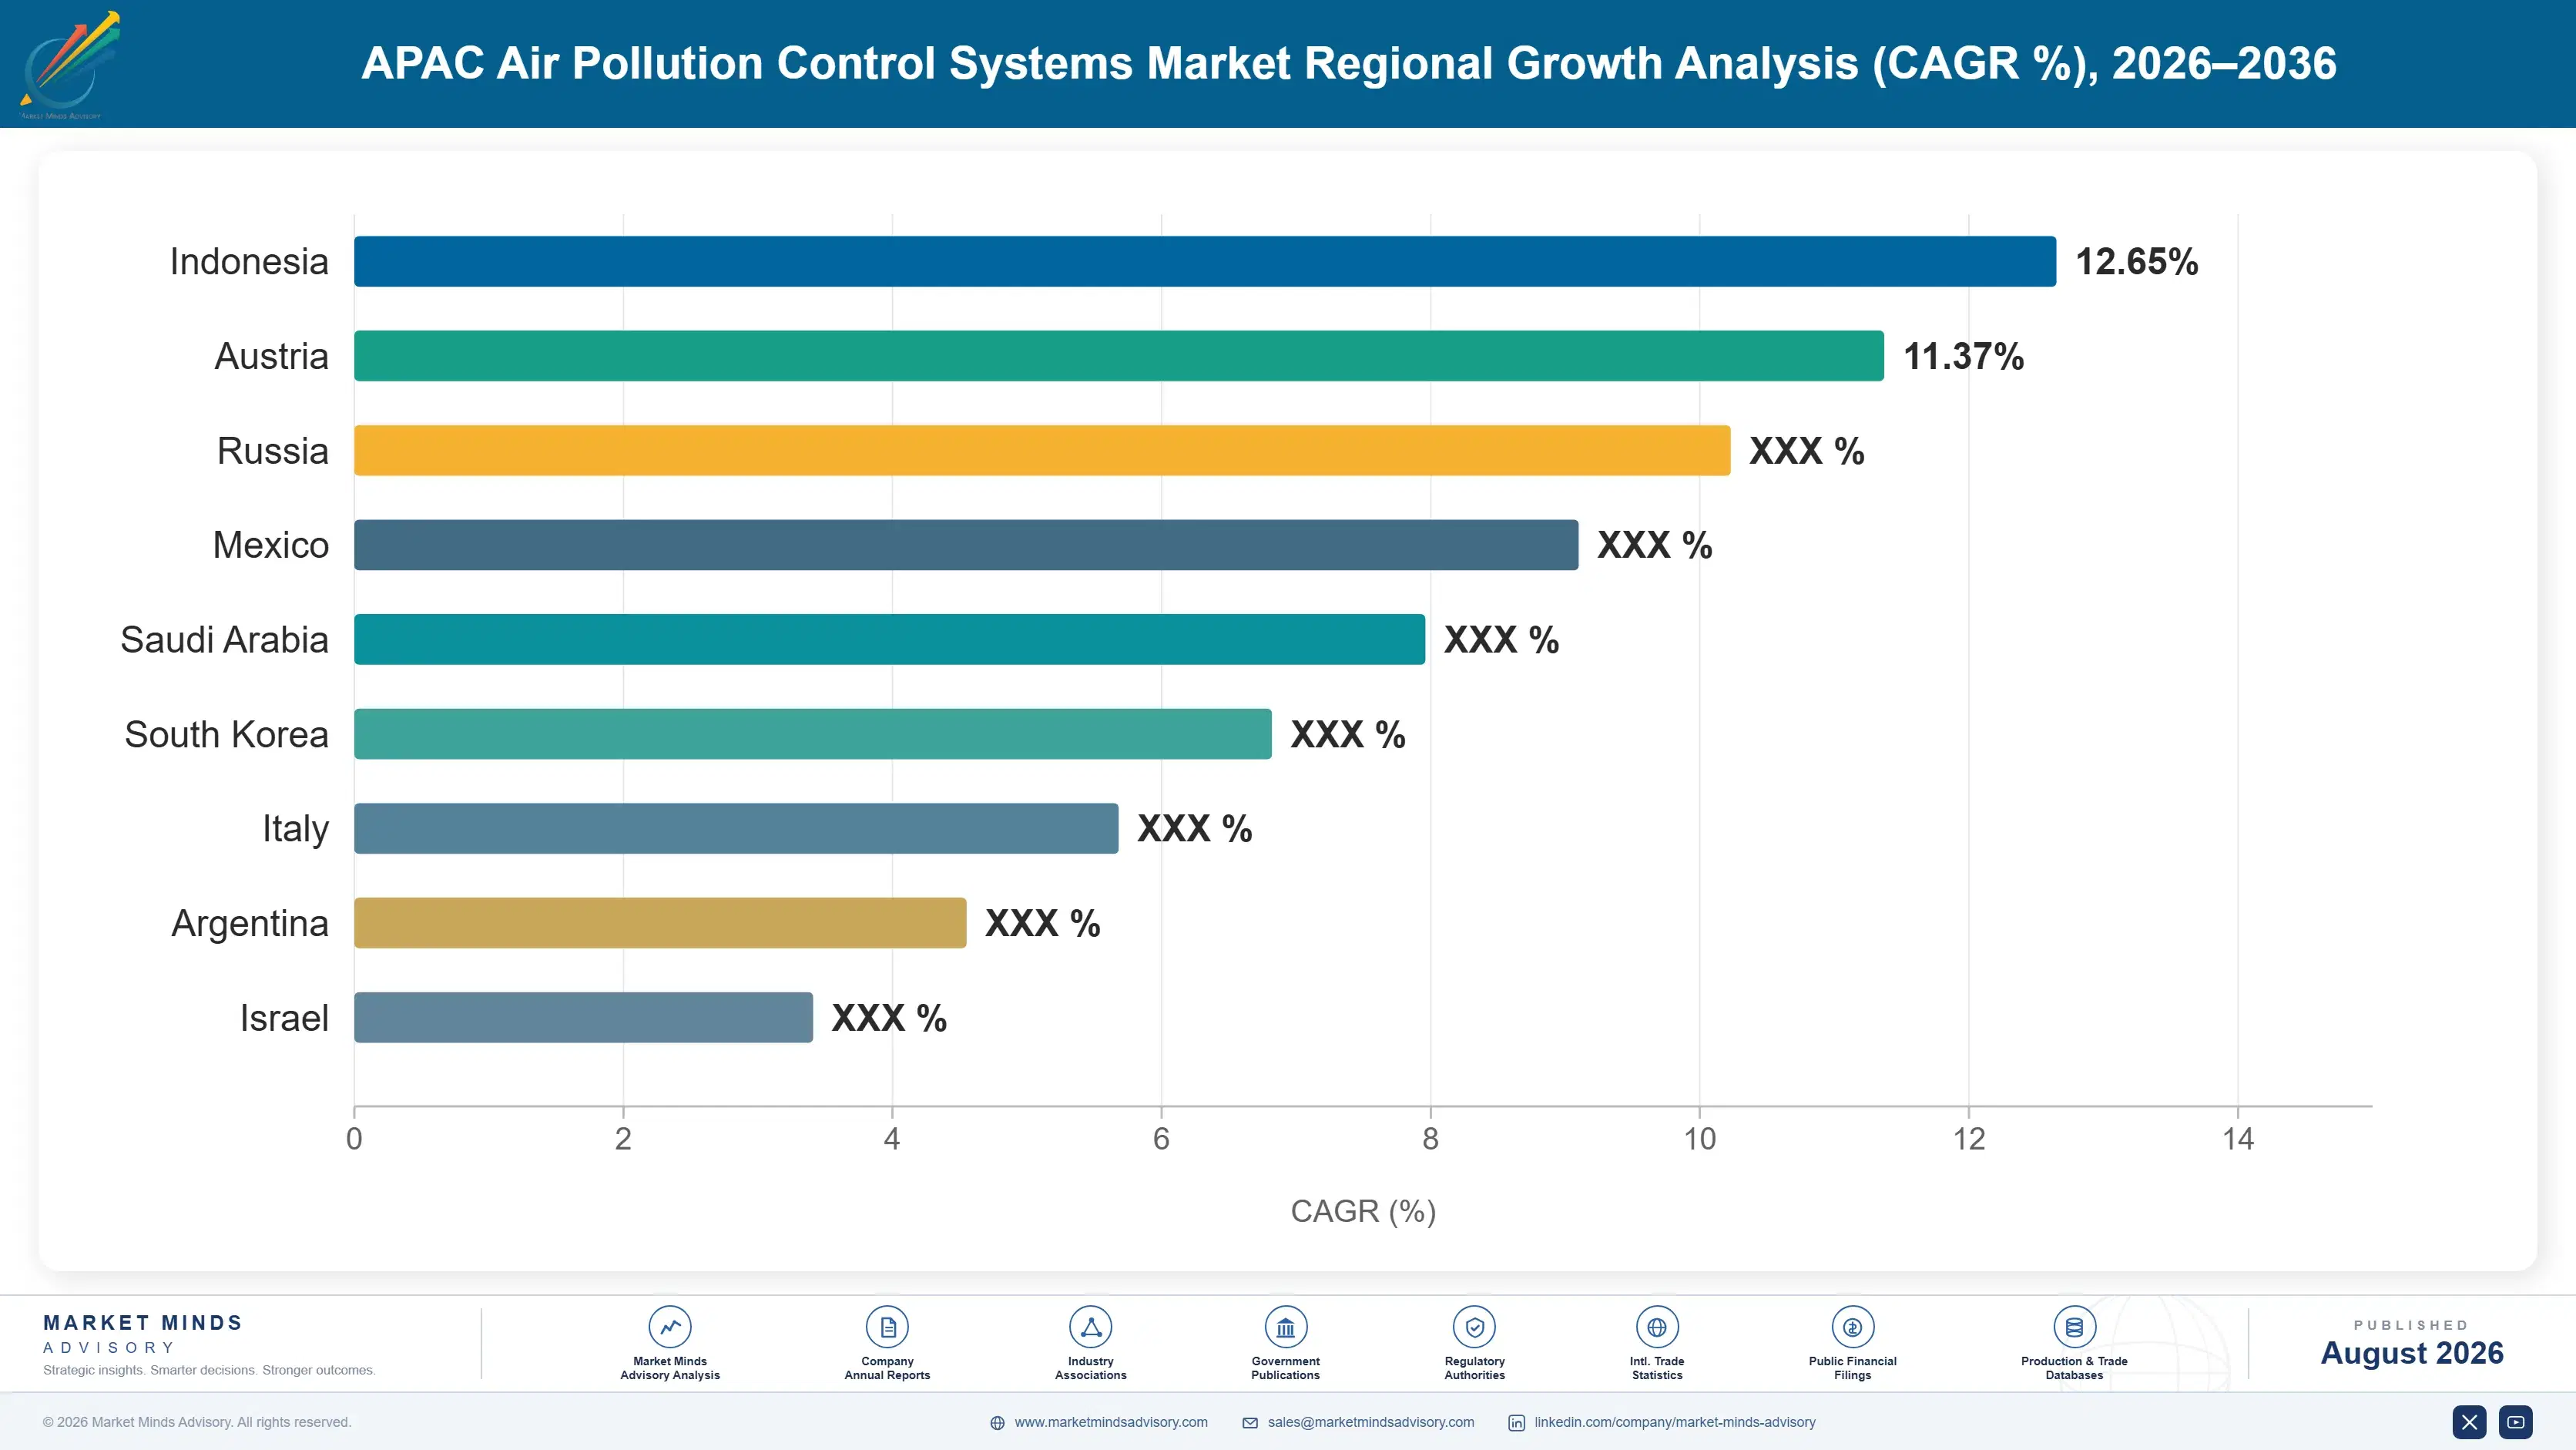
air-pollution-control-systems-market-trend-country-cagr-analysis-1787311655209

Where Project Margin Actually Accumulates

Four commercial moves separate the integrators earning genuine service margins from those merely bidding equipment at contractor pricing. Each depends on holding something an operator cannot obtain by retendering: an installed base under service contract, modular installation capability, sector-specific reference lists, or the local fabrication capacity that shortens delivery enough to hit an outage window.

Write Multi-Year Service Terms Into Original Contracts

Catalyst replacement, bag changes and reagent supply generate 29% of regional supplier revenue at margins roughly double project work, and the operator cannot easily change service supplier without risking a performance guarantee dispute during its next compliance test. Suppliers who wrote five to seven year service terms into the original equipment contract capture that stream almost automatically. Those who sold equipment alone find independent service providers competing at prices they cannot match. The commercial work that decides all of this happens at contract signature rather than years later when the catalyst is due.
Market Impact: Captures 29% of revenue at roughly

Pre-Fabricate Modules For Short Outage Installation

Retrofit work must complete inside an outage window of eight to fourteen days, and operators award contracts substantially on installation duration rather than on equipment price. Suppliers who pre-assemble modules off site and use digital survey to eliminate clashes before shutdown complete installations in roughly 60% of conventional stick-built duration. That capability wins contracts at price premiums of 10% to 15%, because a saved outage day is worth far more to a cement or power operator than the premium costs. The investment required is planning discipline and survey capability considerably more than capital.
Market Impact: Cuts installation duration by rough

Build Sector Reference Depth Quite Deliberately

Cement kiln gas, steel sinter offgas and glass furnace exhaust each present chemistry and variability problems that general capability handles badly, and operators in those sectors buy almost entirely on demonstrated reference lists. Suppliers concentrating deliberately on two or three sectors rather than bidding everything win roughly 45% of the tenders they enter, against under 20% for generalists. The narrowing costs addressable market and returns it in both win rate and realised pricing, because a buyer holding three qualified suppliers negotiates very differently from one holding a dozen of them.
Market Impact: Wins roughly 45% of sector tenders

Own Local Fabrication Near The Installed Base

Fabricated steel is 31% of delivered system cost and dominates delivery lead time, so fabrication location decides both price competitiveness and whether a committed outage date can be met at all. Integrators owning regional fabrication capacity quote delivery four to six weeks shorter than those importing modules, and they hold roughly 8% better gross margin on the same contract value. Yard capacity also becomes a genuine physical constraint during regulatory deadline clusters, when every operator in a market orders at once and independent yards allocate slots to whoever pays most.
Market Impact: Holds about 8% better gross margin

Who Controls the Margin Pool

Concentration is low at 26% for the five largest suppliers, measured on installed system revenue across all participants within the region, and that fragmentation is a feature rather than a phase. Mitsubishi Heavy Industries leads on technology breadth and large utility references, while Fujian Longking leads on Chinese installed volume, and the gap between those two positions describes the whole market.
Competition runs on three dimensions. Installation duration inside an outage window decides most retrofit awards, because a saved outage day outweighs equipment price differences entirely. Sector reference depth decides industrial work, since cement and steel operators buy on demonstrated performance in their own gas conditions. Price competition is fiercest on new-build utility projects, where specifications are standardised and Chinese and Indian integrators compete hard against Japanese and European engineering.

Two pressures are building. Regional integrators have absorbed the engineering capability they once licensed from Western and Japanese firms, which is steadily removing technology licensing revenue from the market. Meanwhile independent service providers are attacking the aftermarket that suppliers assumed was theirs, particularly on ageing systems where the original performance guarantee has expired. Rankings shift where installed base density meets service contract coverage, since one without the other invites competition.
air-pollution-control-systems-market-trend-company-positioning-matrix-1787311655730

Competitive Moat and Risk Dimensions

MITSUBISHI HEAVY INDUSTRIES

Moat: Broadest proven technology portfolio

Positions across desulphurisation, catalytic reduction, precipitation and filtration with large utility reference installations across Japan, Korea and Southeast Asia let the company bid integrated multi-pollutant scope that single-technology competitors cannot. Utility buyers awarding whole-plant compliance packages value that breadth considerably more than they value component-level pricing advantages.
MITSUBISHI HEAVY INDUSTRIES

Risk: Exposure to coal fleet retirement

A substantial share of the reference base and forward pipeline sits on coal-fired generation across markets now weighing retirement against retrofit. Every closure decision removes a project before tender. Industrial and waste incineration work is growing but carries smaller contract values, and it cannot absorb the volume that regional coal retrofit deferral or cancellation would remove.
FUJIAN LONGKING

Moat: Largest Chinese installed base

An installed base built through the Chinese ultra-low emission programme gives the company service and consumable access across an enormous population of operating systems, and no competitor takes that work without an operator accepting an outage to change equipment. Local fabrication and erection cost position reinforces it on new tenders.
FUJIAN LONGKING

Risk: Narrow geographic concentration

Revenue depends overwhelmingly on Chinese industrial and utility spending, and the domestic retrofit programme that built the company has largely completed. Export expansion into India and Southeast Asia meets entrenched local integrators with better site access and political relationships. Domestic service revenue is defensible but cannot deliver the growth the equipment business once did.

Players Tracked

Prominent Players

Mitsubishi Heavy Industries
Fujian Longking
Doosan Enerbility
Hitachi Zosen
Ducon Technologies

Other Key Players

Thermax
Andritz
Babcock and Wilcox
Valmet
CECO Environmental
Feida Environmental Science and Technology
Sinoma Technology and Equipment
Sumitomo Heavy Industries
IHI Corporation
Nederman
Donaldson
Elex
Kawasaki Heavy Industries
Beijing SPC Environment Protection Technology
Zhejiang Tiandi Environmental Protection

Recent Developments

FEBRUARY 2025

Thermax secures Indian thermal plant DeNOx retrofit awards

Multiple selective catalytic reduction retrofit contracts were awarded to the company across Indian thermal generating units, reflecting how enforcement of long-deferred emission norms has finally moved a very large deferred spending pool from what looked like indefinite postponement into genuine procurement activity across multiple generating utilities.
Signal: Indian deferral has ended and the deferred
JUNE 2025

Fujian Longking expands catalyst regeneration service capacity

Additional catalyst regeneration and replacement service capacity entered operation across several Chinese provinces, aimed squarely at the ageing installed base created by the ultra-low emission programme where the original catalyst charges installed a decade ago are now reaching the end of their useful service lives.
Signal: Suppliers are now building service capacit
OCTOBER 2025

Mitsubishi Heavy Industries wins Southeast Asian waste incineration package

A multi-pollutant control package covering acid gas, dioxin and nitrogen oxide removal was awarded to the company for a Southeast Asian waste-to-energy facility, reflecting how integrated multi-pollutant scope rather than component supply is what utility and municipal buyers increasingly choose to put out to tender.
Signal: Integrated multi-pollutant scope is now st

What Drives Delivered System Cost

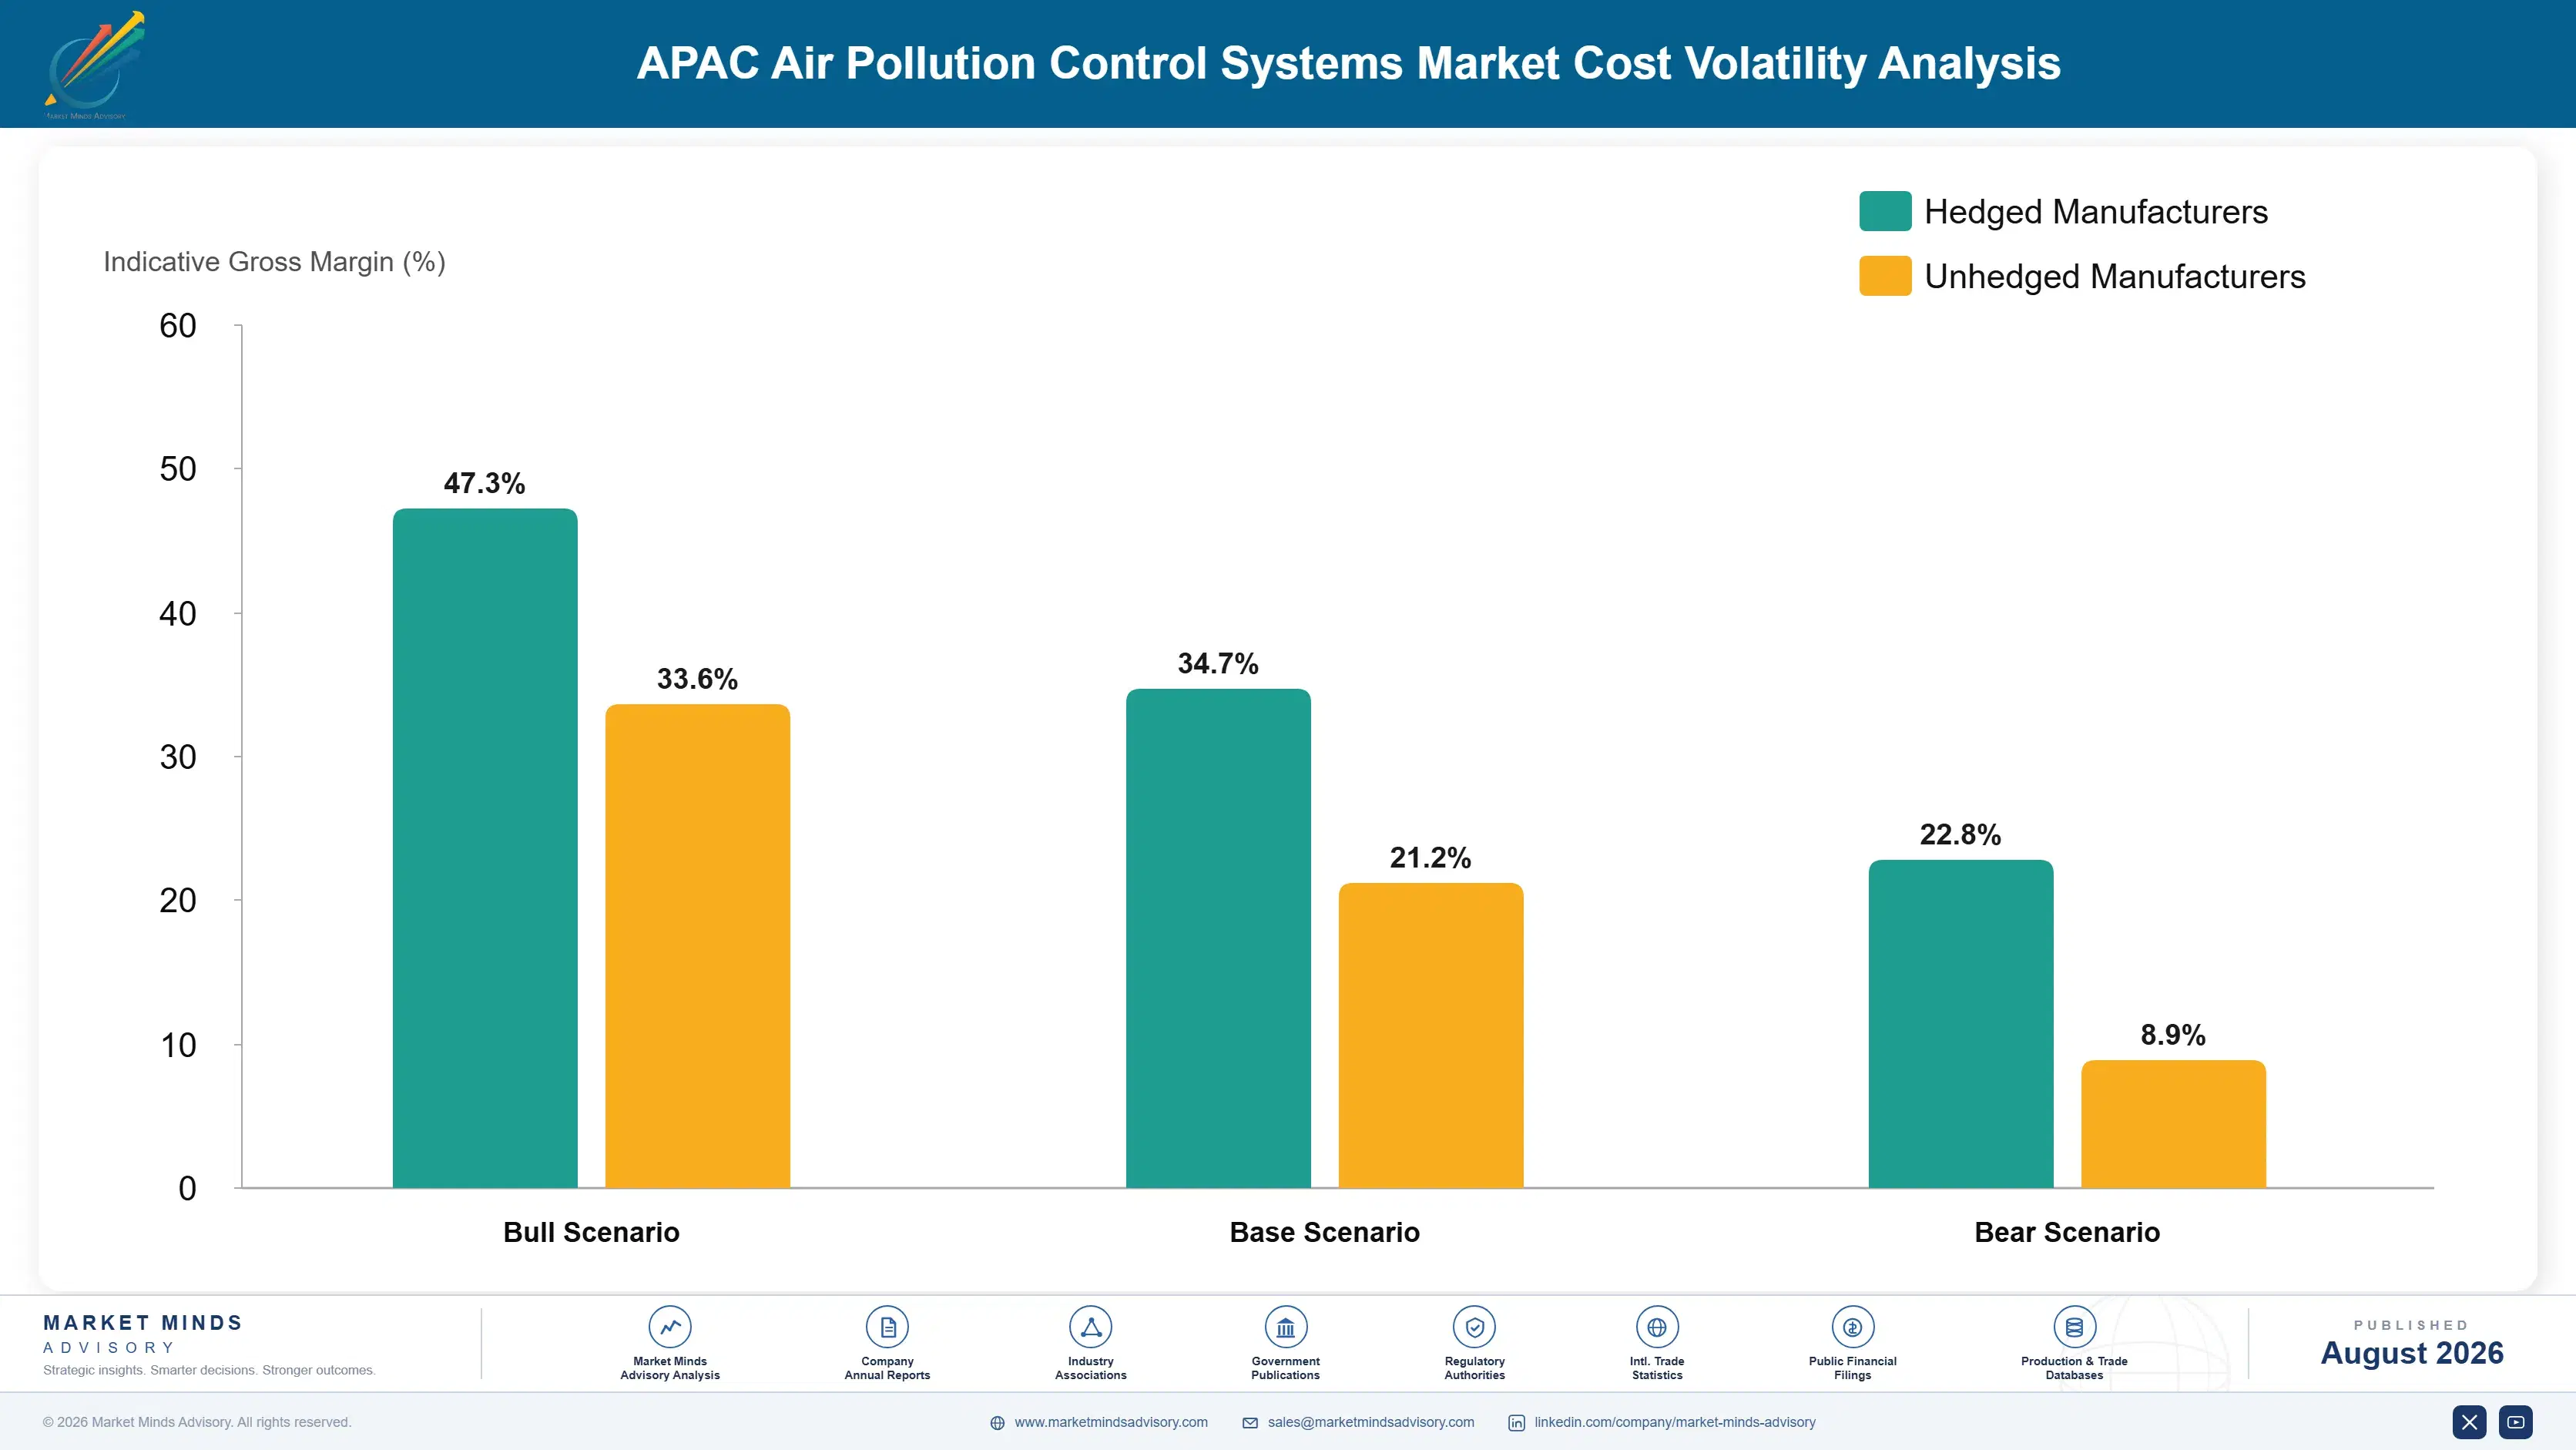
Fabricated steel and corrosion-resistant alloy account for roughly 31% of cost of goods, and that share rises on wet scrubbing systems where nickel alloys are unavoidable. Site erection labour contributes 22%, catalyst and filter media 14% on the relevant technologies. Engineering and project management add 11%, and freight on large fabricated assemblies a further 8% of the total. Alloy selection drives most of the variation between projects.
The 2021 to 2022 steel episode damaged fixed-price project margins across the region badly. Hot rolled coil and plate pricing roughly doubled within a year, and integrators holding lump-sum turnkey contracts signed before the movement absorbed the entire increase. Thermax annual reporting documented substantial input cost pressure on order backlog executed across that window. Several regional integrators reported project losses rather than merely compressed margins.

The competitive disadvantage mechanism runs through contract form, not purchasing. An integrator on lump-sum turnkey terms carries steel, alloy and labour escalation across the whole execution period, which on a large retrofit runs two years. One working on escalation-indexed terms carries almost none of it. Chinese integrators with captive fabrication absorb less again. Indian and Southeast Asian integrators bidding lump-sum against imported plate are worst exposed of all.
air-pollution-control-systems-market-trend-cost-volatility-analysis-1787311655925

Index long execution contracts to steel benchmarks

Lump-sum turnkey pricing across a two-year execution period against continuously moving plate cost is where most project losses originate in this business. Integrators now negotiate escalation clauses referencing published hot rolled coil and plate benchmarks, typically with a quarterly reset and a collar limiting total movement to ten percent across the whole contract term.

Lock fabrication capacity before contract award

Regulatory deadline clusters cause every operator in a market to order simultaneously, and independent fabrication yards then allocate capacity to whoever pays most. Integrators reserving yard slots before bidding secure both delivery dates and pricing, typically at a booking premium of four to six percent that the fixed delivery commitments they carry comfortably justify.

Shift scope toward modular pre-assembly

Site erection labour is 22% of delivered cost and the least controllable element, since productivity inside a congested operating plant is poor and unpredictable. Moving assembly work into a fabrication shop cuts erection hours by roughly a third and transfers the work to an environment where output can actually be measured and managed properly.

Portfolio Architecture for Margin Defence

Margin architecture divides between project execution and everything that follows it. Lump-sum turnkey equipment supply on standardised utility specifications runs at gross margins in the low teens, because specifications are comparable and a dozen integrators can bid. Service, catalyst and consumable revenue earns three times that.
The volume-versus-premium tension is unusual because project work is what creates the service annuity. An integrator cannot sell catalyst replacement without having installed the system, so low-margin project execution buys access to high-margin recurring revenue afterwards. Suppliers who price projects for standalone margin lose the installed base to competitors willing to bid thinner, and then lose the service revenue that made the whole exercise worthwhile. The project is a customer acquisition cost more than a profit centre.

Value concentrates where an operator cannot switch without taking an outage. Service and catalyst contracts on installed systems sit at the top, because changing supplier risks a guarantee dispute during the next compliance test and physically requires plant downtime. Sector-specific industrial work sits below on reference-list logic. Standardised utility equipment tendering sits at the other extreme, where the specification is public and price decides almost everything.

Volume / Commodity-Adjacent

Standardised equipment supply on utility and large industrial tenders where specifications are public and comparable. A dozen integrators can bid credibly and price decides the award. This work exists largely to build the installed base that service revenue later depends on entirely.
Gross Margin: 11-18%

Premium / Certified

Sector-specific industrial retrofit in cement, steel, glass and waste incineration where gas chemistry is difficult and buyers award on demonstrated reference performance. Fewer qualified suppliers and shorter outage windows both support pricing. Range reflects the spread across sectors and outage constraints.
Gross Margin: 20-30%

Sustainability / Regulatory / Next-Generation

Multi-year service, catalyst replacement, filter media and reagent supply contracts on the installed base, plus integrated multi-pollutant compliance packages. Switching cost measured in plant outage days, rather than any technology advantage, justifies the pricing achieved here.
Gross Margin: 32-46%
air-pollution-control-systems-market-trend-portfolio-architecture-1787311656421

High-value Sub-segments and Strategic Watch-out

Catalyst And Service Contracts

High value on genuinely high growth, and the only revenue in this market an operator cannot retender without taking a plant outage. Guarantee dispute risk during the next compliance test deters switching considerably more effectively than any commercial term a supplier could actually write into a contract.
Gross Margin: 34-46%

Industrial Sector Retrofit

Strong margins on solid growth, protected by reference lists that cement, steel and glass operators genuinely rely upon when gas conditions are aggressive. Fewer qualified suppliers means the buyer here negotiates from a much weaker position than it ever does on a standardised utility tender.
Gross Margin: 22-30%

Utility Equipment Tendering

The installed base builder, unavoidable because service annuities cannot exist without it, yet earning gross margins in the low teens. Public specifications and a dozen credible bidders mean price decides awards, and treating this work as a profit centre in its own right loses the installed base entirely.
Gross Margin: 11-18%

Coal Fleet DeNOx Retrofit

The strategic watch-out sitting in this portfolio. Indian enforcement has released a very large deferred pool, but operators weighing retrofit capital against remaining plant life increasingly choose closure, and every one of those closure decisions removes a project before it ever reaches the tender stage.
Gross Margin: 16-26%

How This Demand Actually Recurs

Revenue here behaves as an annuity attached to an installed system rather than to a customer relationship. Once a supplier has erected equipment inside an operating plant, catalyst charges, filter media and reagent flow against it for the system's whole life, because replacing the equipment itself requires an outage nobody will authorise.
Stickiness varies considerably by technology. Catalytic systems are the tightest, since catalyst formulation is matched to specific gas conditions and a performance guarantee dispute during a compliance test is a serious commercial risk. Fabric filtration sits close behind, held by bag specification that fails within months if wrongly chosen. Electrostatic precipitators are barely sticky at all, with almost no consumable content and independent service providers competing freely for maintenance work.

Buyer profiles have shifted noticeably. Procurement once sat with plant engineering teams comparing equipment specifications and lump-sum prices. It now frequently involves environmental compliance officers, corporate sustainability functions and in listed companies the audit committee, all of whom weight guarantee reliability and supplier durability above capital cost. Suppliers whose commercial approach still leads with the lowest tendered price find themselves talking to buyers whose real fear is a failed compliance test.
air-pollution-control-systems-market-trend-end-use-penetration-index-1787311656910

Where To Commit Capital

These are among the four positions where our research anticipates prominent divergence between winners and laggards over the coming forecast period. Each is grounded in the demand model, the regulatory perimeter, and the announced capacity pipeline.
01 / SERVICE CONTRACT CAPTURE

Win the annuity at signature, not afterwards

Catalyst, media and reagent revenue generates 29% of regional supplier income at roughly double the project margin, and it is close to impossible for an operator to retender, because switching supplier risks a performance guarantee dispute during its next compliance test. Suppliers who wrote five to seven year service terms into the original equipment contract capture that stream automatically. Those who sold equipment alone end up watching independent providers take exactly that work at prices they simply cannot match afterwards.
02 / OUTAGE EXECUTION CAPABILITY

Installation days beat equipment price on retrofit

Retrofit accounts for 58% of regional spending and must complete inside an outage window of eight to fourteen days, which means operators award contracts substantially on installation duration rather than on equipment cost at all. Modular pre-assembly combined with digital clash detection completes the work in roughly 60% of stick-built duration and commands price premiums of 10% to 15%. The investment required is planning discipline and digital survey capability far more than any capital equipment purchase a board would recognise.
03 / SECTOR REFERENCE CONCENTRATION

Narrow the sectors, widen the win rate

Cement kiln, steel sinter and glass furnace gas each present chemistry problems that general capability handles badly, and operators in those sectors buy almost entirely on demonstrated reference performance. Suppliers concentrating on two or three sectors win roughly 45% of the tenders they enter, against under 20% for generalists bidding everything. Narrowing costs addressable market and returns it in both win rate and pricing, because a buyer holding three qualified bidders negotiates very differently from one holding twelve of them.
04 / PROJECT MARGIN REALISM

Price projects as acquisition cost, not profit

Standardised utility equipment tendering earns gross margins in the low teens and cannot realistically be improved, because the specifications are public and a dozen integrators bid credibly on every single job. It nonetheless buys the installed base that every service annuity in this market depends on entirely. Suppliers pricing projects for standalone margin lose the installed base to thinner bidders, and then go on to lose the recurring service revenue that would have justified the whole exercise in the first place.

Engagement Snapshot From the Field

A live engagement with an industry participant carrying material or product regulatory and market exposure ahead of a defining policy shift, showing how our research translates into a defensible multi-year portfolio strategy.
MARKET MINDS ADVISORY · CLIENT ENGAGEMENT SUMMARY
APAC Air Pollution Control Systems Producer Strategic Portfolio Review and Transition Roadmap 2026·Investment Scenario on APAC Air Pollution Control Systems Exposure Evaluation 2025-26
CLIENT PROFILE
An Indian air pollution control systems integrator with annual revenue near $240 million (client-reported, unverified by MMA), executing electrostatic precipitator, fabric filter and desulphurisation projects for thermal power and cement customers. Roughly 88% of revenue came from lump-sum turnkey project execution, with almost no multi-year service contracts and no catalyst or media supply position on its own installed base.
STRATEGIC CHALLENGE
Project margins had fallen into single digits as competition intensified ahead of the Indian compliance deadline cluster, while independent service providers were selling maintenance and media into an installed base the company had built itself. Management wanted to know whether pursuing aftermarket revenue was realistic given contracts that granted it no service rights whatsoever.
MMA APPROACH
MMA sized the recoverable aftermarket across the client's installed base, assessed which contracts could support retrospective service agreements, and modelled the margin effect of bidding future projects with embedded multi-year service terms. Findings were tested against 47 expert interviews covering operator procurement practice, catalyst replacement cycles and independent service provider economics across India.
KEY FINDINGS
  1. The client's installed base was generating an estimated $54 million of annual aftermarket spending (client-reported, unverified by MMA) of which the company captured under nine percent.
  2. Contracts signed without service rights could not be retrofitted retrospectively in most cases, but roughly a third of operators would negotiate service terms alongside a new project award.
  3. Bidding future projects with embedded seven-year service terms raised tendered price by about four percent and reduced win rate slightly, while more than trebling lifetime contract margin.
  4. Independent service providers competed on price alone and held no performance guarantee obligation, which gave the client a genuine differentiation argument it had never actually deployed.
CLIENT PROFILE
An Indian air pollution control systems integrator with annual revenue near $240 million (client-reported, unverified by MMA), executing electrostatic precipitator, fabric filter and desulphurisation projects for thermal power and cement customers. Roughly 88% of revenue came from lump-sum turnkey project execution, with almost no multi-year service contracts and no catalyst or media supply position on its own installed base.
STRATEGIC CHALLENGE
Project margins had fallen into single digits as competition intensified ahead of the Indian compliance deadline cluster, while independent service providers were selling maintenance and media into an installed base the company had built itself. Management wanted to know whether pursuing aftermarket revenue was realistic given contracts that granted it no service rights whatsoever.
MMA APPROACH
MMA sized the recoverable aftermarket across the client's installed base, assessed which contracts could support retrospective service agreements, and modelled the margin effect of bidding future projects with embedded multi-year service terms. Findings were tested against 47 expert interviews covering operator procurement practice, catalyst replacement cycles and independent service provider economics across India.
KEY FINDINGS
  1. The client's installed base was generating an estimated $54 million of annual aftermarket spending (client-reported, unverified by MMA) of which the company captured under nine percent.
  2. Contracts signed without service rights could not be retrofitted retrospectively in most cases, but roughly a third of operators would negotiate service terms alongside a new project award.
  3. Bidding future projects with embedded seven-year service terms raised tendered price by about four percent and reduced win rate slightly, while more than trebling lifetime contract margin.
  4. Independent service providers competed on price alone and held no performance guarantee obligation, which gave the client a genuine differentiation argument it had never actually deployed.
RECOMMENDED STRATEGY
Phase 1: Phase one: embed multi-year service and media supply terms in every new tender, accepting a modest win rate reduction for the lifetime margin gained. Phase 2: Phase two: approach the third of existing operators willing to negotiate service terms, bundling those agreements with upcoming compliance retrofit awards. Phase 3: Phase three: build catalyst and media stocking capability near the densest installed base clusters, removing the lead time argument independent providers use.
OUTCOME
The client embedded service terms in all new tenders within six months and reported aftermarket capture rising from nine percent to roughly twenty-two percent of its installed base spending within two years (client-reported, unverified by MMA). Blended gross margin improved by five points despite project pricing remaining under the same competitive pressure throughout.

Frequently Asked Questions

Foundational context covering the market sizes, CAGR, scope, country, region and competition that inform every finding below. This section is provided to cover basics and most often pre-purchase conversations, answered from the MMA Primary Research Dataset.

What is the current size of the APAC Air Pollution Control Systems Market?

The market was worth $31.0 billion in 2025 and is forecast to reach $32.98 billion in 2026. This covers Asia Pacific demand for engineered stack emission control systems only.

How large will the APAC Air Pollution Control Systems Market be by 2036?

MMA forecasts $61.34 billion by 2036, an expansion multiple of 1.86 times the 2026 base. That represents $28.36 billion of incremental value across the forecast period.

What is the CAGR for the APAC Air Pollution Control Systems Market 2026 to 2036?

The base case compound annual growth rate is 6.4%, with a bull case of 7.6% and a bear case of 5.2%. Historical growth from 2020 to 2025 also ran at 5.2%.

Which segment is growing fastest?

Selective catalytic reduction and DeNOx systems at 9.6%, a full 1.50 times the market rate. Tightening nitrogen oxide limits across power, cement and waste incineration drive it.

Who are the major companies in the APAC Air Pollution Control Systems Market?

Mitsubishi Heavy Industries, Fujian Longking, Doosan Enerbility, Hitachi Zosen and Ducon Technologies lead with 26% between them. Fifteen further integrators hold meaningful regional or sector positions.

Which country is growing fastest?

India at 9.4%, as long-deferred thermal plant emission norms finally move into enforcement. Roughly 140 gigawatts of coal capacity still requires desulphurisation or DeNOx work.

Report Segmentation Architecture

The full report scope spans multiple orthogonal segmentation dimensions, with cross-tabulated demand data provided for each dimension pair. Coverage extends further to regional breakdowns, trend trajectories, and the competitive detail needed to support segment-level decision-making.

By Control Technology

  • Selective Catalytic Reduction and DeNOx Systems
  • Fabric Filtration and Baghouse Systems
  • Thermal and Catalytic Oxidisers
  • Wet and Dry Flue Gas Desulphurisation
  • Wet Scrubbers and Mist Eliminators
  • Electrostatic Precipitators

By End-Use Industry

  • Coal and Gas Power Generation
  • Cement and Lime Manufacture
  • Iron, Steel and Non-Ferrous Metals
  • Waste to Energy and Incineration
  • Chemicals, Refining and Petrochemicals
  • Glass, Ceramics and Industrial Boilers

By Commercial Dimension

  • Lump-Sum Turnkey Project Contracts
  • Equipment Supply to Main Contractors
  • Multi-Year Service and Media Contracts
  • Technology Licensing to Local Integrators
  • Build-Own-Operate and Leased Structures

By Region

  • North America
  • Western Europe
  • East Asia
  • South Asia and Pacific
  • Latin America
  • Middle East and Africa
  • Eastern Europe

Scope, Methodology, and Coverage

Every figure in this report is reproducible from documented input assumptions. The scope below maps the historical period, the forecast horizon, the segmentation dimensions, and the countries covered, alongside the underlying primary and qualitative methodology.
Historical Period
2020 to 2025
Forecast Period
2026 to 2036
Base Year
2025 (USD billions; MMA Primary Research Dataset, August 2026)
Market Definition
This report covers engineered air pollution control systems supplied and installed across Asia Pacific for industrial and power generation stack emissions, spanning electrostatic precipitators, fabric filtration, wet and dry flue gas desulphurisation, selective catalytic and non-catalytic reduction, wet scrubbers, mist eliminators, and thermal and catalytic oxidisers. Coverage includes multi-year service, catalyst and media supply contracts attached to installed systems. Indoor air quality equipment, vehicle exhaust aftertreatment, carbon capture systems, water and wastewater treatment, standalone emission monitoring instrumentation and consumables bought outside a system contract are excluded from scope.
Quantitative Units
USD billions at contracted installed value; project counts and installed capacity served; gross margin percentages by commercial tier.
Segmentation Dimensions
Control technology, end-use industry, commercial dimension, region.
Regions Covered
North America, Western Europe, East Asia, South Asia and Pacific, Latin America, Middle East and Africa, Eastern Europe
Countries Covered
China, India, Japan, South Korea, Taiwan, Indonesia, Vietnam, Thailand, Malaysia, Philippines, Australia, Bangladesh, Pakistan, Singapore, plus supplier-origin coverage of the United States, Germany, Denmark, Poland, Brazil and the United Arab Emirates.
Key Companies Profiled
Mitsubishi Heavy Industries, Fujian Longking, Doosan Enerbility, Hitachi Zosen, Ducon Technologies, Thermax, Andritz, Valmet, Sumitomo Heavy Industries, IHI Corporation, and ten further integrators.
Quantitative Methodology
Primary survey, n=3,800 respondents, Q4 2025, six countries; demand-side model with trade association cross-validation
Qualitative Methodology
47 expert interviews, Q4 2025; applied to validate demand model assumptions, identify emerging dynamics, and assess competitive positioning
Report Format
PDF and XLSX data workbook (Word format preview document)
Publisher
Market Minds Advisory
Report Code
MMA-2026-CON-760
Published
August 2026
Contact
sales@marketmindsadvisory.com | www.marketmindsadvisory.com

Purchase the full APAC Air Pollution Control Systems Market Report (2026 to 2036).

The full report sets out ten-year forecasts for Asia Pacific air pollution control systems by control technology, end-use industry and commercial model. It sizes the recoverable aftermarket across the regional installed base and quantifies catalyst and media replacement cycles technology by technology. Competitive assessment covers twenty integrators on a consistent installed revenue basis, separating project execution capability from service contract coverage. The Indian deferred retrofit pool is modelled unit by unit against realistic enforcement and closure scenarios. Findings draw on a quantitative survey of 3,800 respondents across six countries and 47 expert interviews conducted during the fourth quarter of 2025.
Ten-year Asia Pacific forecasts by control technology
Recoverable aftermarket sized across the installed base
Indian deferred retrofit pool modelled unit by unit
Twenty-integrator assessment on consistent revenue basis
Outage window constraints mapped against installation methods
Margin architecture across three commercial contract tiers

Built For The People Who Decide

From boardroom strategy to bench-side execution, this report is read cover-to-cover by leaders shaping the next decade of their industry, turning demand scenarios, market dynamics and valuation benchmarks into decisions.
CXOs/ Presidents/ VPs/ Managers
M&A and Corporate Development
Strategy Teams and R&D Heads
Procurement and Product Directors
Regulatory and Compliance Leaders
Investor Relations and Equity Analysts