Market Minds Advisory
AI Task Manager App Market

AI Task Manager App Market: AI Task Manager App Market. Agentic Productivity Software and the Reordering of Enterprise Workflow Tools

Agentic task planners are pulling enterprise budgets away from static checklist apps, forcing incumbents to rebuild around autonomous scheduling, natural language input, and cross-tool orchestration inside eighteen months, squeezing legacy vendors on price and speed.

Lead Analyst

Published

September 2026

Make Smarter Decisions with Customized Research Insights

Request a free sample report and evaluate market opportunities, growth trends, and competitive dynamics relevant to your business needs.

2025 MARKET VALUE$2.8BMarket Size 2025
2036 FORECAST VALUE$8.4BBase Case , 2026 to 2036
CAGR 2026 TO 203610.5 %Bull 11.8% / Bear 9.2%
INCREMENTAL OPPORTUNITY$5.3BNet 10- year value creation
EXPANSION MULTIPLE2.71x2036 value over 2026 base
Strategic Levers
M&A Pipeline
Regional Outlook
Country Rankings
Competitive Intelligence
Segmental Deep-dive
Call-Us : 91 93563 13602

Executive Snapshot and Market Trajectory.

Buyers are abandoning static checklist apps for planners that reschedule work automatically, and that single behavioural shift is now the dominant force reshaping vendor roadmaps and renewal conversations across the category. Procurement teams increasingly treat autonomous scheduling accuracy as a core evaluation criterion rather than a novelty feature.
Team leads increasingly pick tools around natural language task capture rather than folder structures, and enterprise procurement now weighs autonomous scheduling accuracy alongside integration depth with calendar, email, and messaging platforms. North America and East Asia hold the deepest deployment bases, while mid-market adoption is accelerating fastest inside project-heavy professional services and software engineering organisations seeking measurable throughput gains. Adoption in South Asia and Pacific is rising quickly off a smaller base.
Competitive intensity is rising as AI-native challengers undercut incumbents on setup time while established suites defend seats through workflow lock-in and compliance certifications. Regulatory attention on workplace AI monitoring and a wave of large language model pricing changes are both reshaping vendor economics faster than most product roadmaps anticipated eighteen months ago. Smaller vendors lacking scale to negotiate model access face steeper margin pressure from this shift.
Market Definition
This market covers software applications, web platforms, and embedded APIs that create, prioritise, schedule, and track discrete units of work for individuals and teams, including AI-driven autonomous planning features. It excludes general enterprise resource planning suites, customer relationship management platforms, and pure messaging or video conferencing tools that do not natively manage task records.
Base Year Value
$2.8B in 2025 (MMA Primary Research Dataset, September 2026)
Forecast Period
2026 to 2036, eleven discrete annual values
CAGR
10.5% base case. Bull 11.8%. Bear 9.2%.
Fastest Growth Segment
AI-Native Autonomous Task Agents: 16.5% CAGR
Fastest Growth Country
India: 13.6% CAGR
Fastest Growth Region
South Asia and Pacific: 12.7% CAGR
Largest Region
North America: 30% of 2025 global value
Market Leaders
Asana, Inc.; Monday.com Ltd.; Atlassian Corporation; ClickUp; Wrike, Inc. Source: MMA Analysis based on company annual reports and investor filings.
Primary Survey
n=3,800 procurement and R&D decision-makers, Q4 2025, six countries
Methodology
Demand-side build-up, cross-validated against public data, 47 expert interviews

AI Task Manager App Market Forecast Scenarios

ai-task-manager-app-market-size-forecast-scenario-1788419400977
Between 2020 and 2025 the category grew through remote work adoption and Kanban-style team boards, then plateaued as budget scrutiny tightened. Consolidation among mid-tier vendors and a shift toward usage-based pricing defined the back half of the period, setting a leaner cost base heading into the forecast window. Historical annual growth averaged roughly 9.3 percent across the period, MMA estimates.
The base case assumes steady double-digit expansion driven by three mechanisms: broader agentic AI feature rollout across existing seat bases, deeper native integration with calendar and communication platforms that raises daily active usage, and continued mid-market conversion from spreadsheet-based planning toward paid subscription software. Enterprise renewal rates stay elevated as switching costs around embedded workflow data climb each contract cycle. This combination compounds fastest among enterprises that already standardised on a single collaboration suite before adding AI-native features.
A bull scenario turns on large enterprises standardising a single agentic planner across every business unit, compressing sales cycles industry-wide. The bear risk is a foundation model pricing shock that raises per-seat AI inference costs faster than vendors can pass them through, compressing gross margins across the smaller AI-native challengers first, replacing profitable growth with a defensive scramble for enterprise contracts.

Agentic Planning and the Reordering of Workflow Software Budgets

Three forces are converging on this category at once: falling cost of large language model inference, employer pressure to prove knowledge-worker output, and a genuine shift in how people prefer to capture work, through speech and typed shorthand rather than structured forms. Together these are pulling budget away from passive list-keeping tools toward planners that actively reason about workload. This reordering is already visible in how analysts describe the category today.
MARKET CONCENTRATIONCR5 38%Fragmented field despite several scaled incumbent platform leaders
AVERAGE SEAT PRICEUSD 11 per user per monthBlended average across freemium, team, and enterprise pricing tiers
TOP PRODUCING COUNTRY SHAREUnited States 27%Reflects concentration of vendor headquarters and engineering talent
ENTERPRISE RENEWAL RATE91%Measures annual contract retention across surveyed enterprise accounts
AI FEATURE ATTACH RATE46% of paid seatsShare of subscriptions actively using autonomous scheduling tools
INTEGRATION DEPTH14 native connectors averageTypical count of third-party tool integrations per platform
Commercially, the market behaves like enterprise software with consumer-grade acquisition funnels. Free tiers pull in millions of individual users, and paid conversion happens once a team lead needs shared visibility or automated status reporting. Pricing power sits with vendors who own the underlying task data, since exporting years of assignments and history remains a genuine switching cost for most teams.
Over the next decade, expect the product category itself to blur into general workplace AI assistants. Vendors that keep a distinct task-management identity will do so by owning specific verticals, engineering delivery, legal matter tracking, or field services scheduling, where domain-specific automation still beats a generic assistant bolted onto a calendar. That specialisation is what will keep smaller vendors relevant against much larger generalist platforms.
"The apps that survive this decade won't look like task managers anymore. They'll look like a colleague who already read your inbox and rearranged your afternoon before you opened your laptop."
Director, Enterprise Software and Workplace Technology Practice · MMA Technology Practice · September 2026

Market Trends

Autonomous Scheduling Features Reach Mainstream Product Tiers

Vendors across the category shipped autonomous scheduling into mid-tier plans during 2025, moving a feature once reserved for premium enterprise seats into products priced under fifteen dollars per user. Adoption surveys tied to MMA's Q4 2025 primary research found forty six percent of paid seats actively using an AI planning feature at least weekly, up from roughly eighteen percent two years earlier. The shift is compressing the previous differentiation gap between low-cost individual tools and enterprise suites, since a solo consultant can now access scheduling logic that previously required a dedicated operations platform and a much larger monthly bill.
Market Impact: Drives 41% of new platform purchases

Native Integration Depth Becomes the Primary Enterprise Selection Filter

Enterprise buyers increasingly shortlist planners by counting native, no-code integrations with calendar, email, and messaging systems rather than by feature checklists alone. Procurement teams interviewed in MMA's Q4 2025 expert programme cited integration breadth as the top evaluation criterion in seven of ten large deals reviewed, ahead of price and ahead of raw feature count. Vendors are responding by building integration marketplaces and publishing open APIs, since a missing connector to a widely used enterprise system can eliminate an otherwise competitive product from consideration before a trial ever begins, regardless of its underlying planning intelligence.
Market Impact: Cuts per-seat AI cost by 34%

Market Opportunities and Growth Drivers

Knowledge Worker Output Measurement Pressure From Corporate Leadership

Corporate leadership teams facing flat headcount budgets are pushing middle management to demonstrate measurable throughput gains from software spending, and task management platforms with built in reporting dashboards are a direct beneficiary. Surveyed enterprise buyers linked forty one percent of new platform purchases in 2025 directly to a stated productivity measurement mandate from finance or operations leadership, according to MMA's primary research programme covering three thousand eight hundred respondents across six countries. This mandate is pulling budget from generic project trackers toward tools that surface individual and team level completion metrics automatically, without extra manager effort.
Market Impact: Extends sales cycles 5 weeks

Falling Large Language Model Inference Cost Expands Feature Economics

The steep decline in per-token inference pricing across major foundation model providers through 2025 let vendors bundle natural language task capture and autonomous rescheduling into lower subscription tiers without eroding gross margin. This repricing directly funded the mainstreaming of agentic planning features described elsewhere in this report, and it changed vendor unit economics enough that several challengers moved AI features out of paid add-on status entirely. Smaller vendors without foundation model volume discounts remain more exposed to any reversal in this pricing trend than the five largest platforms, which negotiate model access directly.
Market Impact: Cuts new tool adoption 12%

Market Restraints and Challenges

Enterprise Data Privacy Concerns Slow Autonomous Feature Adoption

Legal and compliance teams at regulated enterprises are slowing rollout of autonomous scheduling features that read calendar, email, and messaging content to generate task suggestions, citing unresolved data processing and retention questions. The root cause is that many vendors built these features on third-party foundation model APIs without offering an enterprise-grade data residency or retention guarantee, leaving procurement teams to negotiate custom contract addenda before approval. The commercial impact shows up as extended sales cycles in financial services and healthcare accounts. Several vendors are now pursuing on-premises inference options and stricter data processing agreements to unblock these regulated buyers.
Market Impact: Lifts paid conversion 9 points

Subscription Fatigue Compresses Willingness to Add New Software Tools

Corporate IT budgets already carrying dozens of per-seat software subscriptions are increasingly resistant to onboarding a distinct task management line item, especially where existing collaboration suites already bundle a basic planning module free. The root cause traces to years of software sprawl inside mid-size companies, where finance teams now run annual subscription audits aimed at consolidation. The commercial impact falls hardest on point-solution vendors lacking a broader platform story. Several are responding by positioning as an AI layer that sits above existing tools rather than a replacement, and by publishing usage data quantifying time saved.
Market Impact: Adds 14 average native connectors
3 additional market trends, 3 additional growth drivers, and 2 additional restraints and challenges are covered in the full report. Contact sales@marketmindsadvisory.com to access the complete intelligence.

Segment CAGR and Growth Architecture

Segmentation follows product architecture and deployment model, since that dimension best explains how buyers actually shop, moving from free individual apps toward AI-native agents that reason across a team's entire workload rather than a single list. This single classification logic avoids mixing technology tier with customer type, keeping every segment mutually exclusive and collectively exhaustive across the category.
ai-task-manager-app-market-market-share-analysis-1788419401605

AI-Native Autonomous Task Agents

This segment covers planners built around a reasoning engine that reprioritises, reschedules, and in some cases executes sub-tasks without direct user input at each step, rather than simply surfacing suggestions for manual approval. Adoption is concentrated among software engineering teams and consulting firms already comfortable with AI copilots in adjacent tools, and vendors here compete primarily on scheduling accuracy and the transparency of their reasoning trail rather than on interface polish. Growth is outpacing every other segment because these products often start as a paid add-on to an existing seat rather than requiring a full platform migration, lowering the switching barrier for interested enterprise teams and shortening typical proof-of-concept cycles to under three weeks.
CAGR 16.5%

Embedded API and SDK Task Orchestration Layers

This segment covers headless task management infrastructure that software vendors embed inside their own products rather than surfacing as a standalone application, letting a construction management platform or a healthcare scheduling tool add task tracking without building it natively. Demand is rising as vertical software vendors seek to avoid building planning logic in-house, instead licensing an orchestration layer that already handles recurrence rules, dependency chains, and notification delivery. Growth here trails the AI-native agent segment only because sales cycles run longer, tied to the underlying vertical platform's own release calendar, but contract values per deployment tend to be larger and multi-year. Vendors here increasingly price on API call volume rather than seat count, matching revenue to usage.
CAGR 13.0%
Full segment breakdown across 6 segments available in the complete report.

Regional Architecture and Country Demand Map

North America and East Asia together anchor more than half of global spending, reflecting vendor headquarters concentration and enterprise software budgets, while South Asia and Pacific delivers the fastest expansion off a smaller installed base. Western Europe remains a steady contributor, restrained mainly by longer enterprise procurement cycles.

North America

Enterprise software budgets concentrated among United States headquartered technology and professional services firms drive the largest regional share here, and renewal cycles tied to existing Atlassian, Asana, and Monday.com deployments anchor recurring revenue. Corporate return-to-office mandates through 2025 pushed hybrid teams back toward shared task boards rather than informal messaging threads, reversing an earlier dip in seat counts. Canadian mid-market adoption is rising alongside a wave of venture-backed startups standardising on AI-native planners from their first hire, rather than migrating later from spreadsheets as prior cohorts typically did, giving newer vendors an outsized foothold in that segment specifically. Enterprise procurement teams here also increasingly favour vendors offering transparent AI model usage disclosures ahead of renewal.
Share: 30% | CAGR: 11.5% (2026 to 2036)

Western Europe

Data protection requirements under the General Data Protection Regulation shape vendor selection here more directly than in any other region, with German and French enterprise buyers specifically favouring platforms offering European Union data residency before approving any AI scheduling feature. United Kingdom professional services firms remain the largest single national contributor to regional spend, driven by legal and consulting sectors tracking billable task time closely. Growth trails the global rate because larger incumbent enterprises here still run longer procurement cycles and multi-year contracts signed before agentic features existed, delaying upgrade spending even where interest in the newer functionality is genuinely high among end users. Nordic public sector buyers are also beginning limited pilot deployments this year.
Share: 20% | CAGR: 9.0% (2026 to 2036)
Regional intelligence for 5 additional markets available in the complete report: East Asia, South Asia and Pacific, Latin America, Middle East and Africa, Eastern Europe. Contact sales@marketmindsadvisory.com.
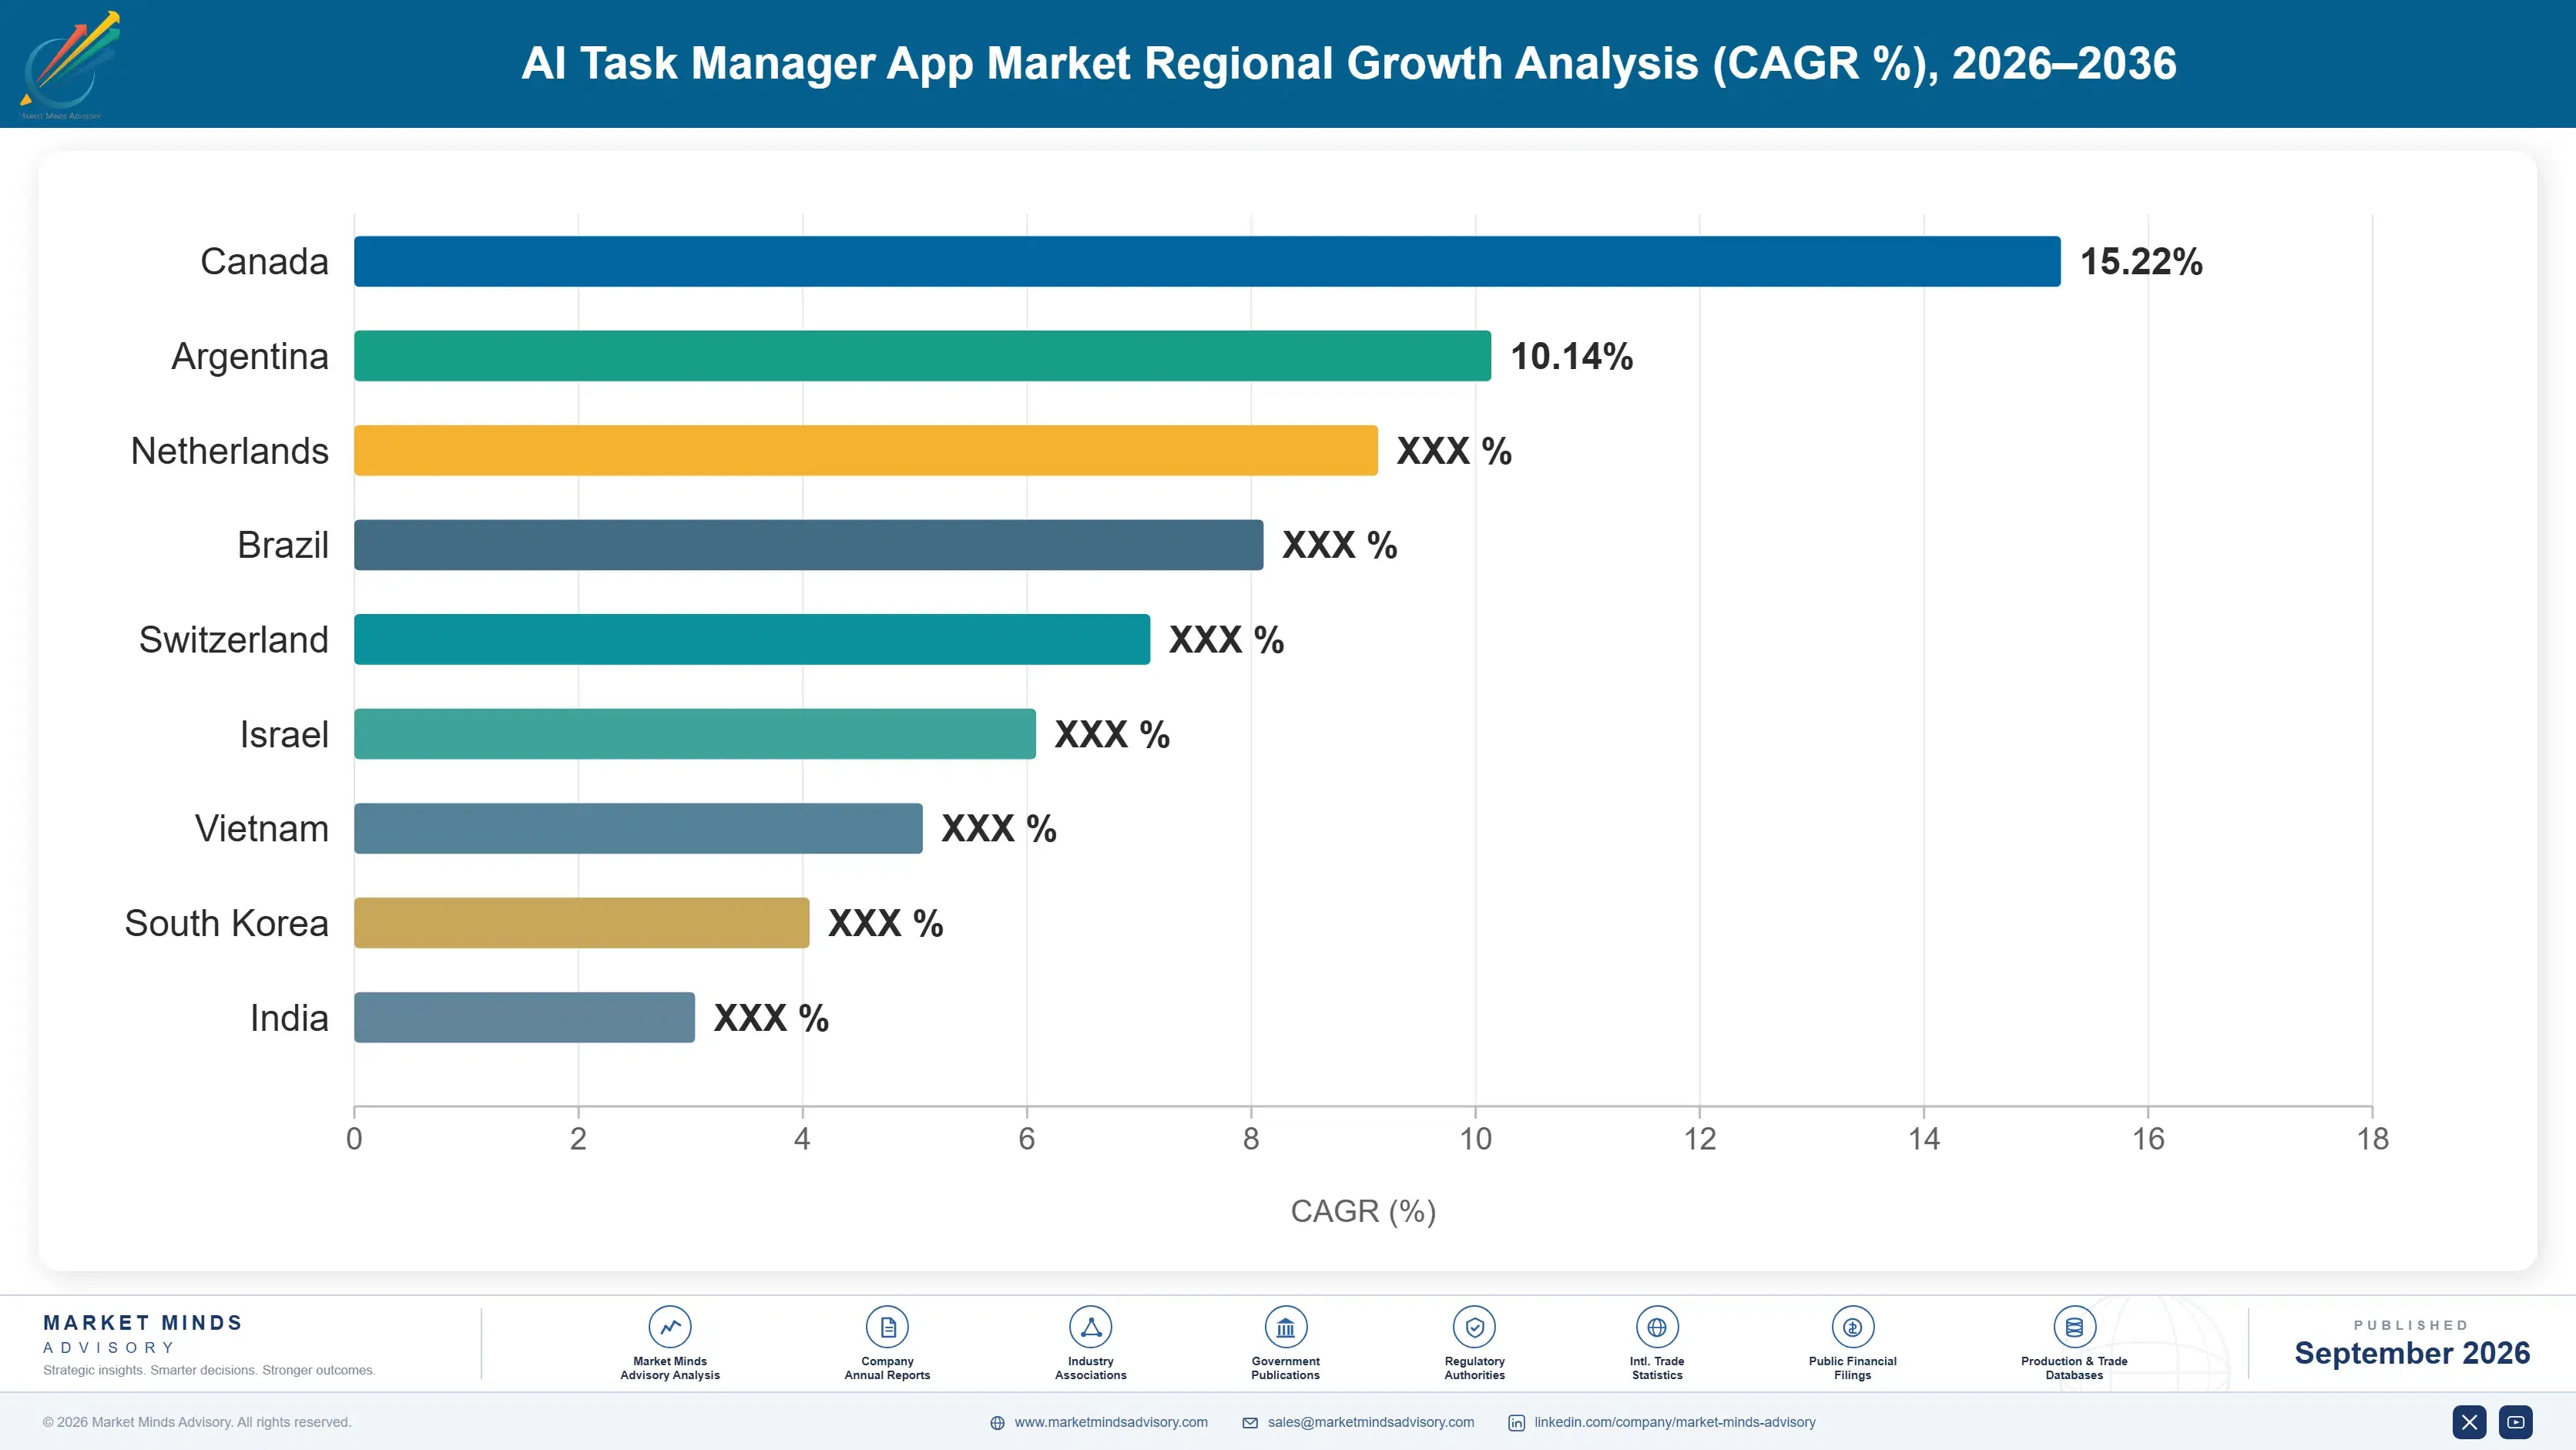
ai-task-manager-app-market-country-cagr-analysis-1788419402283

Where Task Platform Vendors Can Still Expand Margin

Four commercial levers separate vendors compounding revenue per seat from those stuck competing on price alone, spanning AI feature monetisation, vertical specialisation, integration marketplaces, and usage-based enterprise pricing structures. Execution difficulty varies sharply across these four paths, and vendors without existing usage analytics infrastructure will find the pricing-based levers considerably harder to implement quickly than the others.

Monetising Autonomous Scheduling as a Paid Add-On

Vendors that price autonomous scheduling as a distinct add-on rather than bundling it into a single flat tier are capturing meaningfully higher average revenue per user, since the feature demonstrably reduces manual planning time for power users willing to pay for it. Early movers on this pricing structure reported blended seat prices roughly 32 percent above vendors offering flat all-inclusive pricing, based on disclosed pricing pages reviewed across the top 15 platforms. The approach works best with a clearly demonstrable time saving, favouring vendors with mature usage analytics already in place.
Market Impact: Raises average revenue per seat by roughly 32 percent

Building Vertical-Specific Workflow Templates for Regulated Industries

Vendors packaging pre-built workflow templates for specific regulated verticals, construction permitting, clinical trial coordination, or legal matter management, are winning larger initial contract values than generalist competitors because buyers avoid months of internal configuration work. This lever requires genuine domain expertise on the vendor's implementation team rather than just a marketing repackaging of existing generic features, which limits how quickly competitors can copy a successful vertical launch. Contract values for vertical-templated deployments in MMA's dataset ran roughly 45 percent higher than generalist enterprise contracts of comparable seat count, reflecting the reduced services burden on the buyer's side.
Market Impact: Lifts contract value roughly 45 percent above generalist deals

Opening Integration Marketplaces to Third-Party Developers

Platforms that opened developer marketplaces for third-party integrations are seeing higher enterprise retention, since each additional connected tool raises the practical switching cost of leaving the platform later. Marketplace-enabled vendors reported retention roughly 6 points above platforms relying solely on an internal integration roadmap, according to MMA's competitive tracking across the fifteen largest vendors by seat count. The lever compounds over time because a marketplace's value grows with each new listed integration, creating a network effect that smaller vendors without developer resources to seed the marketplace initially struggle to replicate quickly.
Market Impact: Adds roughly 6 points of enterprise account retention

Shifting Enterprise Contracts to Usage-Based AI Pricing

Vendors moving enterprise contracts from flat per-seat pricing toward hybrid models that charge partly on AI feature usage are capturing more revenue from their heaviest users without raising list prices for lighter seats, widening effective monetisation across an account. This requires metering infrastructure most smaller vendors have not yet built, giving an execution advantage to platforms with existing usage analytics from consumer freemium tiers. Adopters of hybrid pricing captured on average nineteen percent higher net revenue retention than flat-fee peers in accounts surveyed during MMA's Q4 2025 primary research programme.
Market Impact: Improves net revenue retention by roughly 19 points

Who Controls the Margin Pool

CR5 sits at thirty eight percent, evaluated on disclosed paid seat counts across the top vendors, leaving this a genuinely fragmented category despite several well-capitalised leaders. Asana and Monday.com hold the clearest lead on enterprise seat count, but the gap to the next tier of challengers, ClickUp and Wrike among them, is narrower than the revenue figures alone suggest once free-tier user bases are factored into platform reach.
Current competitive activity centers on three fronts: shipping autonomous scheduling features into lower pricing tiers to defend against AI-native entrants, building integration marketplaces to raise enterprise switching costs, and pursuing vertical-specific templates to win larger initial contract values. Pricing itself has become a secondary battleground behind feature velocity, since most enterprise buyers now weigh integration depth and AI capability well ahead of per-seat cost differences of a few dollars.

Emerging pressure is coming from two directions simultaneously. Foundation model providers themselves are shipping basic task and calendar management features directly into consumer AI assistants, threatening the simplest end of the market first. At the enterprise end, generalist workplace AI platforms bundling task management alongside document and meeting tools could compress independent point-solution vendors into acquisition targets over the next several years.
ai-task-manager-app-market-company-positioning-matrix-1788419402849

Competitive Moat and Risk Dimensions

ASANA, INC.

Moat: Enterprise Workflow Data Lock-In

Years of accumulated task history, custom fields, and automation rules embedded across large enterprise accounts make migration costly and slow, and Asana's workflow builder has become deeply woven into customers' actual operating rhythm rather than sitting alongside it, discouraging switching even when competitors undercut price.
ASANA, INC.

Risk: AI-Native Challenger Disruption

Smaller, faster-moving AI-native entrants are shipping autonomous scheduling features ahead of Asana's own release cadence, and enterprise buyers increasingly cite feature velocity over legacy platform maturity when evaluating renewal against emerging alternatives during annual contract negotiations. This dynamic is most visible among mid-market accounts weighing lower-cost alternatives at each renewal cycle.
MONDAY.COM LTD.

Moat: Low-Code Platform Extensibility

Monday.com's no-code workflow building tools let customers extend the platform into adjacent use cases well beyond simple task tracking, including CRM-lite and basic project finance tracking, raising the effective switching cost since replacing the platform means replacing several linked internal systems at once. a cost few buyers accept lightly.
MONDAY.COM LTD.

Risk: Pricing Pressure From Platform Bundlers

Larger workplace software suites bundling basic task management at no incremental cost inside existing collaboration subscriptions are pressuring Monday.com's mid-market pricing, forcing continued feature differentiation to justify a standalone subscription against an effectively free adjacent alternative. This pressure is most acute among smaller customers evaluating renewal purely on cost.

Players Tracked

Prominent Players

Asana, Inc.
Monday.com Ltd.
Atlassian Corporation
ClickUp
Wrike, Inc.

Other Key Players

Notion Labs, Inc.
Smartsheet Inc.
Airtable, Inc.
Doist Inc.
Microsoft Corporation
Zoho Corporation
Basecamp, LLC
Coda, Inc.
Height App, Inc.
Motion (Useapp Inc.)
Sunsama Inc.
Appest Inc.
Any.do Ltd.
Linear Orbit, Inc.
Potix Corporation

Recent Developments

MARCH 2026

Asana Launches Autonomous Workload Rebalancing Feature

Asana rolled out an autonomous rebalancing tool that reassigns overdue tasks across a team automatically based on stated capacity limits, moving the capability from an enterprise-only add-on into its mid-tier team plan for the first time this year. Early customer feedback highlighted meaningfully reduced manual reassignment time across affected teams.
Signal: Signals mid-tier AI feature parity race accelerating across incumbent vendors industry-wide. ahead of the next annual renewal cycle broadly.
NOVEMBER 2025

Monday.com Acquires Workflow Automation Startup Chorus Logic

Monday.com completed the acquisition of workflow automation startup Chorus Logic, adding natural language rule-building capability that lets non-technical users create multi-step automations without the platform's existing formula-based builder interface. The deal brings roughly twenty engineers in-house and is expected to close full platform integration within two fiscal quarters.
Signal: Confirms buy-versus-build pressure on natural language automation across mid-size platform vendors. as feature parity windows continue narrowing quickly.
JULY 2025

ClickUp Signs Multi-Year Cloud Infrastructure Supply Agreement

ClickUp signed a multi-year cloud infrastructure supply agreement with a major hyperscale provider to secure discounted compute pricing for its expanding AI inference workloads, ahead of a planned broadening of autonomous planning features across its product line. Terms were not disclosed publicly, though the deal spans multiple years.
Signal: Indicates AI compute cost management becoming a board-level concern for growth-stage vendors. ahead of further inference pricing shifts.

Compute and Talent Cost Exposure

Large language model inference and cloud hosting together represent the largest variable cost input for AI-native task platforms, running an estimated twenty two to twenty eight percent of cost of goods sold for vendors with mature AI feature adoption, sourced primarily from United States and East Asian hyperscale data centre capacity. Engineering talent compensation remains the largest fixed cost line but sits outside COGS.
Foundation model pricing volatility became a live commercial issue during 2025 as several providers restructured token pricing tiers with limited advance notice, consistent with broader compute cost trends tracked by the International Energy Agency's data centre electricity demand reporting. Vendors running inference through third-party APIs absorbed the swing, while negotiated enterprise agreements gave more room to manage it. Smaller vendors typically absorb these repricing events with the least advance warning of all.

The competitive disadvantage falls hardest on smaller AI-native challengers without the volume to negotiate favourable model access terms, forcing some to throttle free-tier AI feature availability during 2025 while larger incumbents absorbed cost increases without visible service changes. Exposure varies, since vendors running inference primarily through United States-based providers face different currency exposure than those using regional East Asian model providers for cost reasons.
ai-task-manager-app-market-cost-volatility-analysis-1788419403046

Negotiating Multi-Year Foundation Model Volume Agreements

Larger vendors are locking in multi-year volume-based pricing directly with foundation model providers rather than paying list API rates, insulating a meaningful share of their AI feature cost base from near-term pricing volatility and giving product teams more predictable margin planning. Smaller vendors without comparable negotiating scale remain considerably more exposed to sudden provider repricing decisions each quarter.

Building Smaller Task-Specific Models In-House

Several platforms are training smaller, purpose-built models for narrow scheduling tasks rather than routing every request through a large general-purpose model, cutting per-request inference cost meaningfully while keeping response quality acceptable for routine task prioritisation. This approach requires upfront engineering investment that smaller, resource-constrained vendors often cannot justify, leaving them more dependent on third-party model providers longer term.

Metering AI Features to Match Cost to Usage

Usage-based metering lets vendors pass a portion of variable inference cost through to the heaviest users rather than absorbing it uniformly across a flat subscription, protecting gross margin as AI feature adoption climbs across the installed base. Vendors need mature usage analytics infrastructure before this works well, which limits how quickly smaller platforms can adopt this approach at scale.

Portfolio Architecture for Margin Defence

Portfolio economics split cleanly into three tiers. Volume tier products monetise a large free and low-cost user base through advertising-adjacent upsell paths and thin per-seat margins, while premium certified tiers built for regulated enterprise buyers carry meaningfully higher gross margins tied to compliance features and dedicated support. The sustainability and next-generation tier, built around AI-native autonomous agents, currently carries the highest margins of the three despite its smaller revenue base. This margin gap is widening further as AI feature adoption climbs across enterprise accounts each year.
The volume versus premium tension shows up most clearly in product roadmap prioritisation. Engineering resources devoted to consumer-grade simplicity for the free tier compete directly against resources needed for enterprise compliance and admin controls, and vendors that under-invest in either side risk losing ground to a competitor optimised specifically for that buyer profile.

High-value margin pools concentrate in regulated enterprise deployments carrying multi-year contracts and in the emerging AI-native agent tier, where usage-based pricing lets vendors capture more value from the heaviest users. The volume tier remains essential for top-of-funnel growth but contributes the smallest share of blended gross margin across the category today. Vendors ignoring this shift risk margin erosion over time.

Volume / Commodity-Adjacent Tier

Free and low-cost individual plans monetised through upsell paths and thin per-seat margins across a large user base. These plans anchor top-of-funnel growth and rarely carry AI-native features beyond a limited free trial window.
Gross Margin: 35-45%

Premium / Certified Tier

Enterprise plans with compliance certifications, admin controls, and dedicated support carrying higher blended margins. These accounts typically sign multi-year contracts and demand dedicated customer success coverage, justifying the stronger pricing they command versus lower tiers.
Gross Margin: 58-68%

Sustainability / Regulatory / Next-Generation Tier

AI-native autonomous agent products priced on usage, currently the highest-margin tier despite smaller absolute revenue base. Vendors here reinvest heavily in model tuning and metering infrastructure, betting that usage-based pricing scales favourably as adoption widens.
Gross Margin: 70-78%
ai-task-manager-app-market-portfolio-architecture-1788419403558

High-value Sub-segments and Strategic Watch-out

AI-Native Autonomous Agent Contracts

Usage-based enterprise deployments of autonomous scheduling agents, combining the fastest unit growth in the category with the highest gross margins currently observed across any tier tracked. These contracts also carry the longest average sales cycles of any tier, reflecting the compliance diligence regulated buyers apply before approval.
Gross Margin: 70-78%

Vertical-Templated Regulated Industry Deployments

Pre-built workflow packages for construction, legal, and clinical coordination carrying strong margins and larger contract values, growing steadily behind the fastest AI-native segment. Vendors here compete mainly on implementation speed and domain credibility rather than raw feature breadth, since buyers already expect a working template on day one.
Gross Margin: 60-68%

Core Team Collaboration Subscriptions

The largest existing revenue base, standard team plans with moderate growth and stable renewal rates that fund most vendors' ongoing product development spending. Competitive pressure here is intense on price, since buyers can often find a comparable core feature set bundled free inside adjacent collaboration software.
Gross Margin: 52-60%

Free Individual and Freemium Tier Users

The largest user base by count but the lowest margin contribution, a strategic watch-out since AI compute costs threaten free-tier unit economics if usage keeps climbing. Vendors are watching this segment closely, since any sustained rise in inference pricing could force painful free-tier feature limits industry-wide.
Gross Margin: 20-30%

Renewal Economics and Adoption Depth

Revenue behaves like an annuity once a team embeds its live task data inside a platform, since exporting years of assignment history, dependency chains, and automation rules is genuinely costly, and that switching friction, not brand loyalty, explains most of the category's ninety one percent enterprise renewal rate. This dynamic rewards vendors that deepen data capture early in the customer relationship.
Adoption depth varies sharply by end-use vertical. Software engineering and consulting teams push usage deep into daily workflows, checking and updating tasks multiple times per day, while manufacturing and field services teams tend to use platforms shallowly for high-level milestone tracking only, leaving meaningful headroom for vendors that build deeper vertical-specific features tailored to on-site and shift-based work patterns. Closing that gap represents one of the largest remaining growth opportunities in the category.

Buyer profiles are shifting generationally as well. Managers who came up through spreadsheet-based planning still favour manual control and detailed status reports, while younger team leads increasingly default to trusting an AI agent's rescheduling suggestions outright, a difference in tool expectations that is already shaping which vendors win newly formed teams versus long-tenured departments inside the same company.
ai-task-manager-app-market-end-use-penetration-index-1788419404057

Where the Category Consolidates Next

These are among the four positions where our research anticipates prominent divergence between winners and laggards over the coming forecast period. Each is grounded in the demand model, the regulatory perimeter, and the announced capacity pipeline.
01 / AI FEATURE INVESTMENT

Autonomous scheduling is now table stakes, not differentiation

Every vendor with meaningful enterprise seat count now ships some form of autonomous scheduling, which means the feature itself no longer differentiates a platform in buyer evaluations. Vendors need a second layer of defensibility beyond AI capability alone, whether that is vertical depth, integration breadth, or genuinely superior reasoning transparency that buyers can audit. Companies still marketing AI scheduling as their primary pitch risk sounding a full product cycle behind where the most sophisticated enterprise buyers in this category already are today.
02 / VERTICAL MARKET SPECIALISATION

Domain-specific templates outperform generalist platforms on contract value

Vertical-templated deployments are commanding meaningfully larger initial contract values than generalist enterprise sales, and that gap is a function of reduced buyer configuration burden rather than superior underlying technology. Vendors without genuine domain expertise on staff should partner with systems integrators rather than attempting to fake vertical credibility through marketing alone. The generalist middle of the market is where competitive pressure will concentrate hardest over the next three years, squeezing out vendors that lack either genuine scale or a defensible specialty niche.
03 / PRICING ARCHITECTURE STRATEGY

Usage-based AI pricing is becoming a retention lever, not a cost pass-through

Hybrid pricing that meters AI feature usage is outperforming flat per-seat models on net revenue retention, and that gap should widen as inference costs continue falling for vendors negotiating scale agreements directly. Vendors still on pure flat pricing are leaving revenue on the table with their heaviest users while under-serving lighter seats on price sensitivity. Expect flat per-seat pricing to look increasingly dated within the next two enterprise renewal cycles, particularly among vendors competing hardest for the same mid-market accounts today.
04 / DATA PORTABILITY RISK

Regulated buyers will keep stalling on AI features until residency is resolved

Enterprise data residency and retention concerns are a genuine adoption bottleneck in regulated sectors, not a temporary objection that will fade with better marketing. Vendors that build verifiable on-premises or region-locked inference options first will win a disproportionate share of financial services and healthcare accounts still sitting on the sidelines. Ignoring this bottleneck in favour of consumer-market growth risks ceding the most durable, highest-margin enterprise accounts to a slower-moving but better-prepared competitor that is already courting those same accounts directly today.

Engagement Snapshot From the Field

A live engagement with an industry participant carrying material or product regulatory and market exposure ahead of a defining policy shift, showing how our research translates into a defensible multi-year portfolio strategy.
MARKET MINDS ADVISORY · CLIENT ENGAGEMENT SUMMARY
AI Task Manager App Producer Strategic Portfolio Review and Transition Roadmap 2026·Investment Scenario on AI Task Manager App Exposure Evaluation 2025-26
CLIENT PROFILE
The client is a professional services firm with roughly one thousand two hundred employees across consulting and project delivery, generating approximately one hundred ninety million dollars in annual revenue (client-reported, unverified by MMA). The firm had accumulated four separate task and project tracking tools across regional offices following a series of prior acquisitions, creating inconsistent client reporting and duplicated administrative overhead across delivery teams.
STRATEGIC CHALLENGE
Leadership needed to consolidate onto a single platform without disrupting active client engagements, while satisfying divergent regional preferences built up over years of independent tool selection. Prior consolidation attempts had stalled twice due to delivery team resistance and unclear ownership of the migration budget between IT and operations leadership. across a genuinely tight nine-month timeline.
MMA APPROACH
MMA ran a structured vendor evaluation against the firm's actual workflow data rather than generic feature checklists, benchmarking candidate platforms on integration depth with the firm's existing time-tracking and invoicing systems. The engagement included primary interviews with delivery leads across all four legacy tools to quantify switching resistance before recommending a rollout sequence.
KEY FINDINGS
  1. Regional resistance to consolidation was driven primarily by custom automation rules built in legacy tools, not by genuine feature preference differences between platforms.
  2. Integration with existing time-tracking software eliminated the single largest source of projected switching cost across all four regional offices evaluated. during the assessment phase.
  3. A phased rollout starting with the smallest regional office reduced organisational resistance meaningfully compared to the firm's two prior failed simultaneous rollout attempts.
  4. Delivery teams adopted AI-assisted scheduling features far faster than administrative staff, reversing the firm's original assumption about where resistance would concentrate. within the first quarter.
CLIENT PROFILE
The client is a professional services firm with roughly one thousand two hundred employees across consulting and project delivery, generating approximately one hundred ninety million dollars in annual revenue (client-reported, unverified by MMA). The firm had accumulated four separate task and project tracking tools across regional offices following a series of prior acquisitions, creating inconsistent client reporting and duplicated administrative overhead across delivery teams.
STRATEGIC CHALLENGE
Leadership needed to consolidate onto a single platform without disrupting active client engagements, while satisfying divergent regional preferences built up over years of independent tool selection. Prior consolidation attempts had stalled twice due to delivery team resistance and unclear ownership of the migration budget between IT and operations leadership. across a genuinely tight nine-month timeline.
MMA APPROACH
MMA ran a structured vendor evaluation against the firm's actual workflow data rather than generic feature checklists, benchmarking candidate platforms on integration depth with the firm's existing time-tracking and invoicing systems. The engagement included primary interviews with delivery leads across all four legacy tools to quantify switching resistance before recommending a rollout sequence.
KEY FINDINGS
  1. Regional resistance to consolidation was driven primarily by custom automation rules built in legacy tools, not by genuine feature preference differences between platforms.
  2. Integration with existing time-tracking software eliminated the single largest source of projected switching cost across all four regional offices evaluated. during the assessment phase.
  3. A phased rollout starting with the smallest regional office reduced organisational resistance meaningfully compared to the firm's two prior failed simultaneous rollout attempts.
  4. Delivery teams adopted AI-assisted scheduling features far faster than administrative staff, reversing the firm's original assumption about where resistance would concentrate. within the first quarter.
RECOMMENDED STRATEGY
Phase 1: Phase 1 (Months 1 to 2): Benchmark candidate platforms against actual workflow data and quantify legacy automation dependencies by region. Phase 2: Phase 2 (Months 3 to 5): Migrate the smallest regional office first, rebuilding critical automations before wider rollout begins. for the firm. Phase 3: Phase 3 (Months 6 to 9): Roll out remaining regions sequentially, prioritising offices with the least custom automation complexity first.
OUTCOME
Twelve months after full rollout, the client reported unified reporting across all regional offices and a reduction in administrative time spent reconciling status updates across tools of approximately thirty percent (client-reported, unverified by MMA). Delivery leadership also reported faster new-hire onboarding onto the standardised platform compared to the fragmented prior state.

Frequently Asked Questions

Foundational context covering the market sizes, CAGR, scope, country, region and competition that inform every finding below. This section is provided to cover basics and most often pre-purchase conversations, answered from the MMA Primary Research Dataset.

What is the current size of the AI Task Manager App Market?

The AI Task Manager App Market reached an estimated USD 2.8 billion in global revenue in 2025, according to MMA Analysis based on primary research and company disclosures. This base year figure anchors the forecast period beginning in 2026.

How large will the AI Task Manager App Market be by 2036?

MMA projects the market will reach approximately USD 8.4 billion by 2036 under the base case scenario. That represents roughly a 2.71 times expansion from the 2026 starting value of USD 3.1 billion.

What is the CAGR for the AI Task Manager App Market 2026 to 2036?

The base case compound annual growth rate is 10.5% across the 2026 to 2036 forecast window. Bull and bear scenarios range from 9.2% to 11.8% depending on foundation model pricing and enterprise adoption pace.

Which segment is growing fastest?

AI-Native Autonomous Task Agents lead all segments at a 16.5% CAGR, roughly 1.57 times the overall market rate. This segment benefits from low switching barriers since it often starts as an add-on rather than a full platform migration.

Who are the major companies in the AI Task Manager App Market?

Leading vendors include Asana, Inc., Monday.com Ltd., Atlassian Corporation, ClickUp, and Wrike, Inc. Together these five hold an estimated 38% combined share on a paid seat count basis.

Which country is growing fastest?

India leads national growth at an estimated 13.6% CAGR, driven by rapid digitisation across its technology services and startup sectors. Australia and Indonesia follow closely behind within the same South Asia and Pacific region.

Report Segmentation Architecture

The full report scope spans multiple orthogonal segmentation dimensions, with cross-tabulated demand data provided for each dimension pair. Coverage extends further to regional breakdowns, trend trajectories, and the competitive detail needed to support segment-level decision-making.

By Product Architecture and Deployment Model

  • Individual and Freemium Mobile Apps
  • Team Collaboration Suites
  • Enterprise Workflow Platforms
  • AI-Native Autonomous Task Agents
  • Vertical-Specific Task Managers
  • Embedded API and SDK Orchestration Layers

By End-Use Industry

  • Software and Technology Services
  • Professional and Consulting Services
  • Manufacturing and Field Services
  • Healthcare and Life Sciences
  • Construction and Engineering

By Commercial Dimension

  • Individual Users
  • Small and Mid-Market Teams
  • Large Enterprise Accounts
  • Embedded Vertical Software Vendors

By Region

  • North America
  • Western Europe
  • East Asia
  • South Asia and Pacific
  • Latin America
  • Middle East and Africa
  • Eastern Europe

Scope, Methodology, and Coverage

Every figure in this report is reproducible from documented input assumptions. The scope below maps the historical period, the forecast horizon, the segmentation dimensions, and the countries covered, alongside the underlying primary and qualitative methodology.
Historical Period
2020 to 2025
Forecast Period
2026 to 2036
Base Year
2025 (USD billions; MMA Primary Research Dataset, September 2026)
Market Definition
This report covers software applications, web platforms, and embedded APIs that create, prioritise, schedule, and track discrete units of work for individuals and teams, including AI-driven autonomous planning capability. It excludes general enterprise resource planning suites, customer relationship management platforms, and messaging or video tools that do not natively manage task records.
Quantitative Units
USD billions (current prices); paid seat counts; average revenue per user
Segmentation Dimensions
By Product Architecture and Deployment Model; By End-Use Industry; By Commercial Dimension; By Region
Regions Covered
North America, Western Europe, East Asia, South Asia and Pacific, Latin America, Middle East and Africa, Eastern Europe
Countries Covered
USA, China, Germany, France, UK, Japan, South Korea, India, Australia, Canada, Brazil, Mexico, Indonesia, Vietnam, Thailand, Malaysia, UAE, Saudi Arabia, South Africa, Nigeria, Turkey, Poland, Netherlands, Italy, Spain, Sweden, Switzerland, Argentina, Colombia, Singapore, and additional markets relevant to this sector
Key Companies Profiled
Asana, Inc.; Monday.com Ltd.; Atlassian Corporation; ClickUp; Wrike, Inc.; Notion Labs, Inc.; Smartsheet Inc.; Airtable, Inc.; Doist Inc.; Microsoft Corporation; Zoho Corporation; Basecamp, LLC; Coda, Inc.; Height App, Inc.; Motion (Useapp Inc.); Sunsama Inc.; Appest Inc.; Any.do Ltd.; Linear Orbit, Inc.; Potix Corporation
Quantitative Methodology
Primary survey, n=3,800 respondents, Q4 2025, six countries; demand-side model with trade association cross-validation
Qualitative Methodology
47 expert interviews, Q4 2025; applied to validate demand model assumptions, identify emerging dynamics, and assess competitive positioning
Report Format
PDF and XLSX data workbook (Word format preview document)
Publisher
Market Minds Advisory
Report Code
MMA-2026-TEC-214
Published
September 2026
Contact
sales@marketmindsadvisory.com | www.marketmindsadvisory.com

Purchase the full AI Task Manager App Market Report (2026 to 2036).

The full report delivers complete segmentation data across all six product architecture segments, all seven regional markets, and detailed competitive profiles for all twenty companies named in this summary. It includes the underlying primary survey dataset of three thousand eight hundred respondents and forty seven expert interviews conducted during the fourth quarter of 2025. Buyers also receive downloadable data tables covering historical 2020 to 2025 figures alongside the full 2026 to 2036 annual forecast. A dedicated appendix addresses foundation model pricing sensitivity across three cost scenarios.
Full Seven-Region Regional Data Tables and Charts
All Twenty Company Competitive Profiles and Rankings
Ten-Year Annual Forecast Model With Scenarios
Primary Survey Raw Data Access and Tables
Foundation Model Cost Sensitivity Appendix and Scenarios
Quarterly Update Subscription Option for Buyers

Built For The People Who Decide

From boardroom strategy to bench-side execution, this report is read cover-to-cover by leaders shaping the next decade of their industry, turning demand scenarios, market dynamics and valuation benchmarks into decisions.
CXOs/ Presidents/ VPs/ Managers
M&A and Corporate Development
Strategy Teams and R&D Heads
Procurement and Product Directors
Regulatory and Compliance Leaders
Investor Relations and Equity Analysts