Market Minds Advisory
AI-powered Wealth Management Solution Market

AI-powered Wealth Management Solution Market: AI-powered Wealth Management Solutions: Advisor Capacity, Suitability Evidence and the Succession Problem Driving Adoption

An ageing advisor base and rising household counts made capacity the binding constraint, so firms buy artificial intelligence to serve more clients per advisor rather than to pick better investments.

Lead Analyst

Published

September 2026

Make Smarter Decisions with Customized Research Insights

Request a free sample report and evaluate market opportunities, growth trends, and competitive dynamics relevant to your business needs.

2025 MARKET VALUE$3.8BMarket Size 2025
2036 FORECAST VALUE$19.8BBase Case , 2026 to 2036
CAGR 2026 TO 203616.2 %Bull 17.4% / Bear 15.0%
INCREMENTAL OPPORTUNITY$15.4BNet 10- year value creation
EXPANSION MULTIPLE4.49x2036 value over 2026 base
Strategic Levers
M&A Pipeline
Regional Outlook
Country Rankings
Competitive Intelligence
Segmental Deep-dive
Call-Us : 91 93563 13602

Executive Snapshot and Market Trajectory.

The investing part of this market has disappointed for a decade and the administrative part is transforming quickly. Advisors spend roughly 41% of their working hours on preparation, notes and compliance, and that is where the money is going. Investment intelligence is not what firms are buying.
Capacity is the reason. The median practising advisor is 56, headcount is flat at best, and household counts keep rising, so firms buy to serve more relationships per advisor rather than to improve returns. Advisor productivity and meeting intelligence grows at 24.3%, half again the market rate of 16.2%. North America takes 44% of spending because it holds the largest advised asset pool and the independent channel that buys software directly. No pipeline replaces them.
The field is fragmented at roughly 31% across the top five on measured software subscription revenue, and it is splitting into platform incumbents defending workflow and specialists attacking single tasks. Around 63% of contracts still price against client assets rather than seats, which puts the vendor in direct competition with the advisor's own margin. That tension is unresolved. Nobody has resolved that tension yet, and departmental budgets keep moving toward specialists.
Market Definition
This market covers software applying machine learning and generative techniques to wealth advisory workflow, including advisor productivity and meeting intelligence, client onboarding and identity verification, portfolio construction and rebalancing intelligence, compliance surveillance and suitability monitoring, digital advice delivery and prospecting data enrichment. Revenue is measured as software subscription and attributable implementation services. Custody, brokerage execution, banking core systems, asset management fees and direct-to-consumer investing applications are excluded.
Base Year Value
$3.8B in 2025 (MMA Primary Research Dataset, September 2026)
Forecast Period
2026 to 2036, eleven discrete annual values
CAGR
16.2% base case. Bull 17.4%. Bear 15.0%.
Fastest Growth Segment
Advisor Productivity and Meeting Intelligence: 24.3% CAGR
Fastest Growth Country
India: 22.6% CAGR
Fastest Growth Region
South Asia and Pacific: 18.4% CAGR
Largest Region
North America: 44% of 2025 global value
Market Leaders
Envestnet, SS&C Technologies, Broadridge Financial Solutions, InvestCloud and Addepar lead on measured wealth management software subscription revenue. Source: MMA Primary Research Dataset, July 2026.
Primary Survey
n=3,800 procurement and R&D decision-makers, Q4 2025, six countries
Methodology
Demand-side build-up, cross-validated against public data, 47 expert interviews

AI-powered Wealth Management Solution Market Forecast Scenarios

ai-powered-wealth-management-solution-market-size-forecast-scenario-1788417697817
Growth ran at 14.8% between 2020 and 2025 and the composition changed completely across those five years. The early period was dominated by digital advice and portfolio automation, most of which failed to displace human advisors and quietly became a feature rather than a category. From 2023 the growth came from language models applied to meeting capture, note generation and client correspondence, which addressed a problem advisors actually complained about.
The base case at 16.2% rests on three mechanisms. Advisor capacity is genuinely constrained, with a median practitioner age of 56 and no pipeline replacing retirements, so serving more households per advisor is an operating necessity rather than an efficiency ambition. Suitability and record-keeping obligations have tightened in every major jurisdiction, and evidencing them manually does not scale. Third, the independent advisory channel buys software directly and switches more readily than bank-owned wealth businesses do.
The bull case at 17.4% assumes regulators accept model-generated suitability documentation with defined controls, which would move compliance surveillance from a monitoring tool to a system of record. The bear case at 15.0% is a supervisory intervention on explainability. One enforcement action against generated advice documentation would freeze procurement across the sector for several quarters.

Capacity, Not Investment Skill, Drives This Spending

Wealth management has spent fifteen years being told that software would replace the advisor and it has not happened. Digital advice took a share of low-balance accounts and stalled. What actually changed is less dramatic and considerably more valuable: the administrative load around an advisory relationship has become the constraint on how many households one person can serve, and machine-generated notes, summaries and correspondence lift that ceiling directly.
TOP FIVE CONCENTRATION31%Fragmented field spanning platform incumbents and productivity specialists
ADVISOR ADMIN TIME41%Working hours consumed by preparation, notes and compliance
MEDIAN ADVISOR AGE56 yearsAgeing practitioner base facing an unresolved succession problem
HOUSEHOLDS PER ADVISOR94Average client relationships carried by a single practising advisor
DEPLOYMENT ABANDONMENT RATE29%Pilots discontinued before ever reaching firmwide production use
ASSET BASED PRICING SHARE63%Contracts priced against client assets rather than user seats
The arithmetic behind the demand is straightforward. A median advisor age of 56, flat headcount and rising household counts mean firms face a capacity shortfall they cannot hire their way out of. Each advisor currently carries around 94 relationships. Raising that number is the only available response, and every percentage point of administrative time recovered translates into servicing capacity that would otherwise require recruitment nobody can complete.
Commercially the awkward feature is pricing. Roughly 63% of contracts are priced against client assets, a convention inherited from platform software, which means the vendor's revenue rises with markets and competes directly against the advisor's own basis point margin. Productivity specialists arriving with seat-based pricing look cheap on that comparison and are winning departmental budgets accordingly. Incumbents defending asset-based pricing are defending revenue, not value.
"Every conversation in this market starts with investment intelligence and ends with meeting notes. The advisors are not asking for a better allocation model; they are asking for their evenings back, and the vendors who took that seriously have grown faster than anyone selling portfolio construction."
Director, Wealth and Investment Technology Practice · MMA Technology Practice · September 2026

Market Trends

Meeting Intelligence Becomes the Entry Product for Everything

Generated meeting notes and client summaries have become the way artificial intelligence enters a wealth firm, because the benefit is immediate, the risk is contained and an advisor can evaluate it personally within a week. That has made it the fastest segment at 24.3% and, more importantly, the beachhead from which vendors expand into compliance, prospecting and portfolio workflow. Incumbent platforms underestimated this. A specialist that captures the meeting record holds the data that everything downstream depends on, which is a considerably stronger position than the entry price suggests. The entry price disguises how much position it creates.
Market Impact: Median advisor age reaches 56
Seat Pricing Displaces Asset-Based Pricing on New Purchases

Wealth software has priced against client assets for two decades, which suited platform vendors and infuriated firms whose costs rose with markets rather than with usage. Productivity specialists arrived with per-advisor pricing and found an unexpectedly receptive audience among chief operating officers comparing a fixed seat cost against basis points. Roughly 63% of installed contracts remain asset-based while a clear majority of new departmental purchases are not. Incumbents face an uncomfortable choice between defending a pricing model and defending a customer, and most have chosen the model so far. That choice is becoming harder to defend each year.
Market Impact: Segment grows at 20.8% yearly

Market Opportunities and Growth Drivers

Advisor Demographics Make Capacity a Board-Level Problem

A median practising advisor age of 56 combined with flat industry headcount produces a servicing shortfall that recruitment cannot close, and firms have been told this repeatedly for a decade without acting. What changed is that household counts kept rising while advisor numbers did not, so the arithmetic became visible in service quality rather than in a workforce planning slide. Firms now buy productivity software as a capacity substitute, which reaches the chief operating officer and the board rather than a technology committee, and moves considerably faster. Service quality complaints reached boards before workforce planning ever did.
Market Impact: Confines 71% to internal use

Suitability Evidence Requirements Tighten Across Every Jurisdiction

Consumer duty obligations in the United Kingdom, suitability and record-keeping rules under American securities regulation and product governance requirements in Europe all demand documented evidence that advice matched a client's circumstances. Producing that evidence manually across thousands of relationships does not scale, and firms have been penalised for gaps rather than for bad advice. Compliance surveillance and suitability monitoring accordingly grows at 20.8%. The buyer is a chief compliance officer with a defensible budget, which makes this the most reliable demand in the category. Enforcement history predicts how quickly a firm buys.
Market Impact: Abandonment reaches 29% of pilots

Market Restraints and Challenges

Explainability Requirements Limit What Can Reach a Client

Generated content that informs an investment recommendation must be explainable to a supervisor and defensible to a regulator, and current models are poor at producing an audit trail of their own reasoning. The root cause is technical rather than procedural, which means it cannot be resolved by policy alone. Commercially this confines most deployments to internal preparation and documentation rather than client-facing recommendation, capping the value that can be claimed. Vendors are mitigating with retrieval-grounded generation, mandatory advisor review steps and full provenance logging on every generated statement. Supervisory guidance is easing this slowly rather than resolving it.
Market Impact: Grows at 24.3% annually

Pilot Abandonment Runs High and Damages Vendor References

Roughly 29% of deployments are discontinued before reaching firmwide production, usually because the pilot ran with enthusiastic early adopters whose workflow bears no resemblance to the wider advisor population. The root cause is selection rather than product: firms test with the people most willing to change and then discover the median advisor will not alter a routine built over twenty years. Vendors are responding with mandatory representative pilot cohorts, adoption-linked pricing and embedded change management, all of which raise delivery cost and improve conversion substantially. Conversion improves markedly once the pilot cohort genuinely represents the wider population.
Market Impact: Affects 63% of installed contracts
3 additional market trends, 4 additional growth drivers, and 2 additional restraints and challenges are covered in the full report. Contact sales@marketmindsadvisory.com to access the complete intelligence.

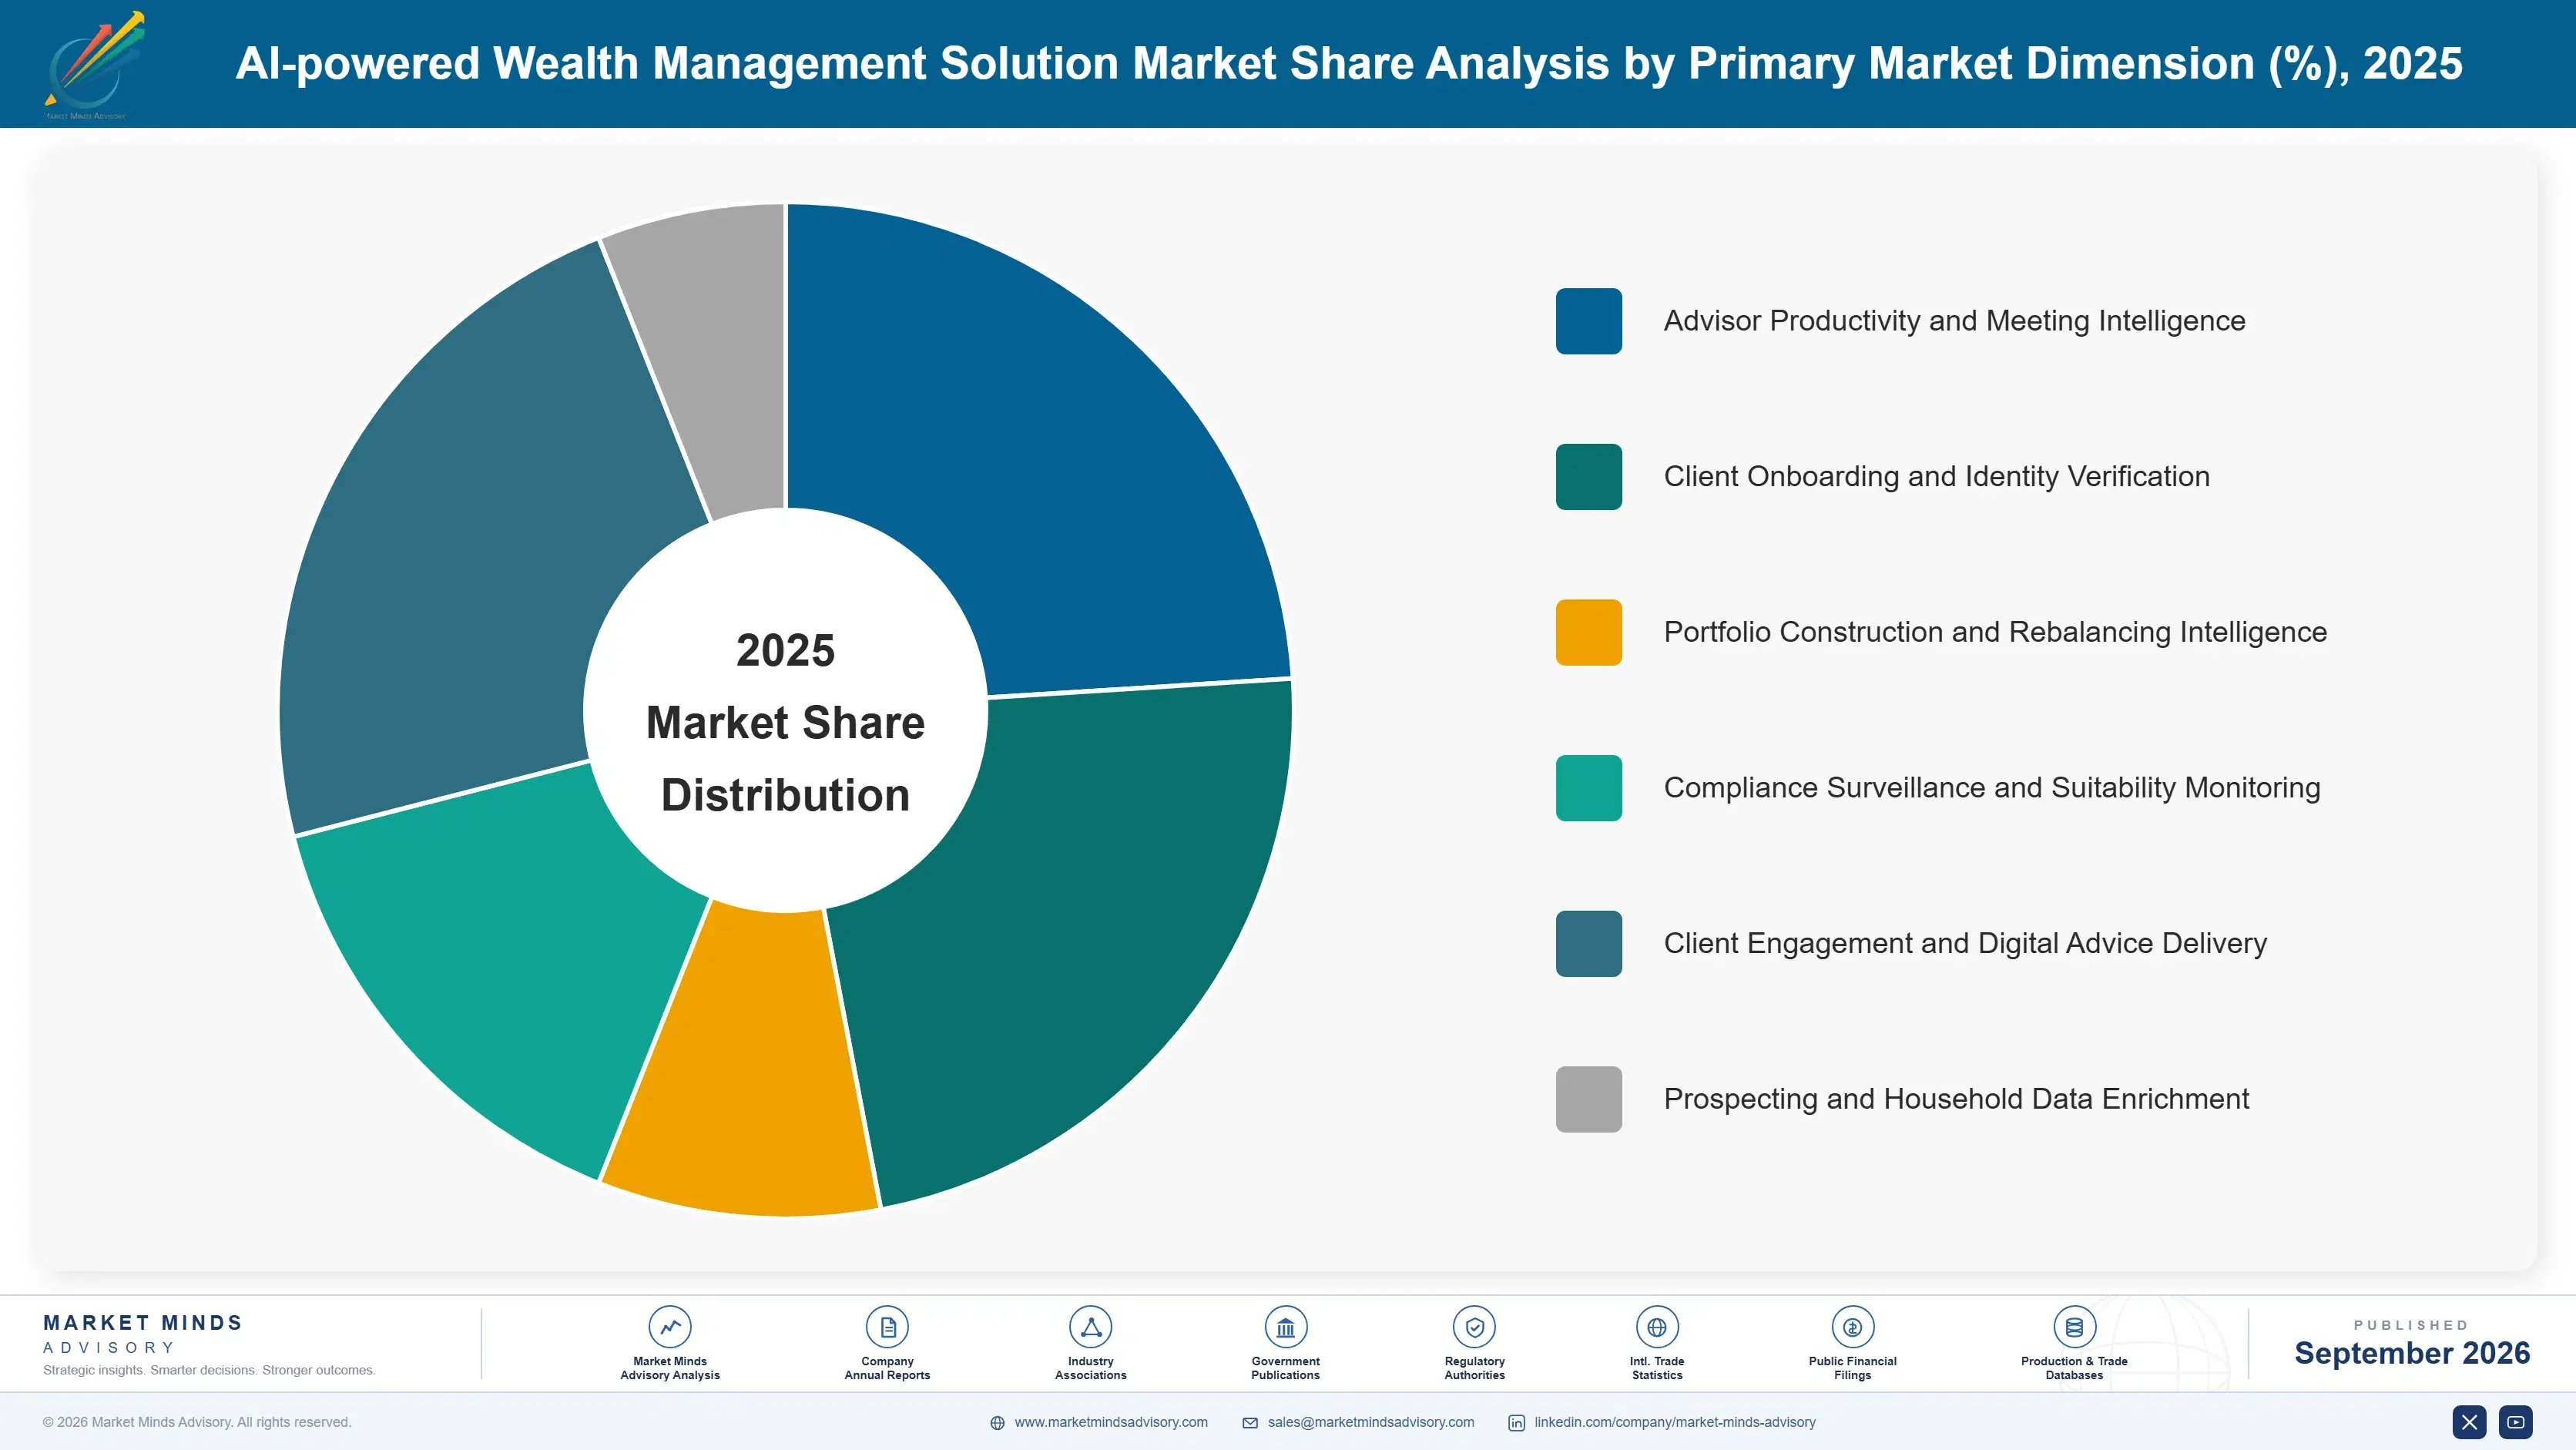
Segment CAGR and Growth Architecture

Segmentation follows the workflow the software addresses, since that determines which budget funds it and how much regulatory scrutiny the output attracts. Internal preparation tasks move quickly because the risk is contained, while anything touching a client recommendation moves at the pace supervisory comfort allows, and that gap governs relative growth. Regulatory scrutiny sets the pace.
ai-powered-wealth-management-solution-market-market-share-analysis-1788417698348

Advisor Productivity and Meeting Intelligence

Meeting capture, note generation, client correspondence drafting and follow-up task creation form the fastest part of this market at 24.3%, half again the market rate of 16.2%. The appeal is that an advisor can evaluate the benefit personally inside a week, the output stays internal until reviewed, and the purchase can be made departmentally without an enterprise programme. Pricing is typically per advisor rather than against assets, which makes the comparison against incumbent platform economics unflattering for incumbents. The segment matters beyond its size because whoever captures the meeting record holds the data layer that compliance, prospecting and portfolio workflow all depend upon. Custodial bundling has already set a low reference price for the capability itself.
CAGR 24.3%

Compliance Surveillance and Suitability Monitoring

Surveillance and suitability monitoring applies classification and anomaly detection to advice records, communications and portfolio changes, producing the evidence that supervisory regimes now require across every major jurisdiction. Growth at 20.8% reflects a buyer with a defensible budget and an obligation that does not soften in a downturn, which makes this the most durable demand in the category. Deployment is slower than productivity tooling because supervisory sign-off is required and false positive rates determine whether a compliance team gains capacity or loses it. Firms that have been through an enforcement action buy considerably faster and negotiate considerably less. False positive tuning is where deployments succeed or fail, and it takes months rather than weeks to get right.
CAGR 20.8%
Full segment breakdown across 6 segments available in the complete report.

Regional Architecture and Country Demand Map

Regional demand follows advised asset pools and the degree to which advisors buy their own technology. Markets with large independent advisory channels purchase directly and frequently; markets where wealth sits inside universal banks buy through long enterprise programmes instead. Channel structure decides almost everything here.

North America

North America holds 44%, well above the regional band, and the reason is the independent advisory channel rather than asset volume alone. Registered investment advisers and independent broker-dealer practices number in the tens of thousands and each buys its own technology, producing far more separate purchasing decisions than any other market generates. Custodial platforms compete on advisor technology as a retention instrument, which pulls capability into the market faster. Canadian demand is smaller and slower, since wealth sits more heavily inside bank-owned businesses that procure through enterprise programmes. Nearly every significant vendor in this category is American. Contract values in the independent channel are modest individually and larger in aggregate than every other region combined.
Share: 44% | CAGR: 15.4% (2026 to 2036)

Western Europe

European demand is shaped by consumer protection obligations rather than by advisor economics. United Kingdom consumer duty requirements have made evidencing good client outcomes a supervisory expectation with real consequences, and firms buy surveillance and suitability tooling against it. Swiss and Liechtenstein private banking buys sophisticated relationship management capability with high data residency requirements. German and Italian wealth sits mostly inside universal banks, which procure slowly through enterprise programmes. Nordic firms adopt quickly relative to size. Data protection rules constrain what client information may be processed, which shapes vendor architecture more than in any other region. Regional growth at 14.6% is the slowest of the larger markets, held back by bank-intermediated wealth that procures on multi-year enterprise cycles.
Share: 22% | CAGR: 14.6% (2026 to 2036)
Regional intelligence for 5 additional markets available in the complete report: East Asia, South Asia and Pacific, Latin America, Middle East and Africa, Eastern Europe. Contact sales@marketmindsadvisory.com.
ai-powered-wealth-management-solution-market-country-cagr-analysis-1788417698871

Where This Software Can Charge Well

Asset-based pricing is being challenged from below by seat-priced specialists, and defending it protects revenue rather than value. The positions worth holding are the meeting data layer, compliance evidence that a supervisor will accept, and adoption itself, since a deployment nobody uses renews at a rate no pricing model can rescue. Everything else follows from those three.

Capture the Meeting Record Before Competitors Do

Whoever holds the meeting transcript, summary and follow-up record holds the input that compliance surveillance, prospecting and portfolio review all consume. Vendors that entered through meeting intelligence expand into adjacent modules at roughly 3 times the attach rate achieved by vendors entering elsewhere, because the data dependency runs in their favour. The entry price looks modest against platform contracts and the position it creates does not. Incumbents treating meeting notes as a minor feature have consistently misread what the capability actually controls downstream. The dependency runs one way and it does not reverse easily.
Market Impact: Achieves roughly 3 times the module attach rate

Price Per Advisor and Attack Asset-Based Incumbents

Roughly 63% of installed contracts price against client assets, which means an incumbent's revenue rises with markets while a firm's advisor count stays flat. Chief operating officers comparing a fixed seat cost against rising basis points reach an obvious conclusion, and specialists pricing per advisor win departmental budgets that never reach an enterprise evaluation. The commercial discipline required is resisting asset-based pricing when a large firm offers it, because accepting once establishes the precedent that competitors will then attack in exactly the same way. One exception establishes a precedent competitors will attack immediately.
Market Impact: Displaces 63% of the asset-priced contracts currently installed

Sell Supervisory Acceptance Not Model Capability

Compliance buyers are purchasing something a supervisor will accept, and the model's technical quality is only one input into that. Vendors shipping documented controls, provenance logging on every generated statement and evidence packs reviewed with regulators close compliance deals around 40% faster and hold price far better than those demonstrating capability. This is unglamorous documentation work rather than engineering. It is also the single clearest separator between vendors winning enterprise compliance mandates and those stuck in perpetual proof of concept. Capability demonstrations impress engineers and rarely move a compliance committee. Documentation does.
Market Impact: Closes compliance deals roughly 40% faster than competitors

Link Commercial Terms to Measured Adoption

With 29% of deployments abandoned before firmwide rollout, the risk a buyer actually fears is paying for software the advisor population ignores. Vendors offering adoption-linked pricing, where fees step up as measured usage rises, convert pilots at roughly twice the rate of fixed-fee competitors and gain access to usage data that improves the product. It requires confidence in the product and tolerance for slower initial revenue. Firms unwilling to offer it are effectively asking the buyer to carry a risk the vendor understands considerably better. Sophisticated buyers now price that refusal into negotiations.
Market Impact: Doubles pilot conversion against a 29% abandonment rate

Who Controls the Margin Pool

Concentration sits near 31% across the top five on measured wealth software subscription revenue, which is low for enterprise software and reflects a market splitting rather than consolidating around anyone. Platform incumbents hold the workflow and the asset-based contracts, while productivity specialists hold the fastest-growing capability and price differently. The gap is narrower in influence than in revenue, because a specialist holding the meeting record shapes what incumbents can do downstream.
Competition runs on three dimensions. Adoption is the first and most decisive, since a deployment advisors ignore fails regardless of capability, and 29% do exactly that. The second is supervisory acceptance, meaning whether generated output carries controls and provenance a compliance officer will defend. The third is workflow integration with custody, portfolio accounting and relationship systems, where incumbents hold a genuine advantage.

Two pressures are reshaping the field. Custodial platforms are bundling productivity capability into advisor technology stacks at no incremental charge as a retention instrument, compressing what specialists can price. Meanwhile large firms are building internally against foundation models, reasoning that the workflow is specific and the capability is now accessible. Rankings will move toward vendors holding the meeting data layer and supervisory credibility.
ai-powered-wealth-management-solution-market-company-positioning-matrix-1788417699393

Competitive Moat and Risk Dimensions

ENVESTNET

Moat: Advisor workflow and data breadth

Envestnet sits inside the daily workflow of a very large advisor population and holds portfolio, proposal and account data that gives applied intelligence something substantial to work with. Replacing it means replacing the operating platform rather than a point tool, which few firms will contemplate. Its account and planning data creates analytical possibilities specialists cannot reach from outside.
ENVESTNET

Risk: Asset-based pricing exposure

A large share of revenue prices against client assets, which specialists attack directly by offering fixed seat costs to chief operating officers watching basis points rise with markets. Defending the model protects revenue while conceding departmental purchases. Platform integration commitments also slow how quickly new capability reaches advisors compared with a single-workflow specialist.
SS&C TECHNOLOGIES

Moat: Operations and administration depth

SS&C's position runs through fund administration, transfer agency and portfolio operations that wealth firms depend on regardless of which advisory tools they choose, which makes its relationships unusually durable. Applying automation to document handling, reconciliation and onboarding uses proprietary process data that pure software vendors do not possess. Scale across operations lets it absorb development cost that smaller competitors cannot.
SS&C TECHNOLOGIES

Risk: Limited advisor desktop presence

The company's strength sits in operations and administration rather than at the advisor desktop where meeting intelligence and client engagement products are winning budget and shaping the data layer. Reaching practising advisors requires a different commercial motion than institutional operations selling. Independent advisory practices, the most accessible demand pool here, are not a natural constituency for an operations-led franchise.

Players Tracked

Prominent Players

Envestnet
SS&C Technologies
Broadridge Financial Solutions
InvestCloud
Addepar

Other Key Players

Orion Advisor Solutions
Salesforce
Morningstar
BlackRock
Temenos
Avaloq
FNZ
Charles River Development
Practifi
Nitrogen
Jump
Zocks
Vise
Objectway
Comarch

Recent Developments

JUNE 2025

Custodial platforms bundle meeting intelligence into advisor technology stacks

Several large custodians added generated meeting notes and summary capability to the technology offered to affiliated advisory practices at no incremental charge, positioning it as a retention instrument. The capability was licensed from specialists rather than acquired outright by any of the custodians involved. Specialist pricing adjusted quickly.
Signal: Bundling compresses specialist pricing at the entry level while leaving the underlying licensing relationships commercially intact.
FEBRUARY 2025

United Kingdom supervisor publishes expectations on automated advice documentation

The guidance set out control expectations for firms using automated tooling to generate suitability records, requiring human review, provenance retention and periodic sampling. It did not prohibit generated documentation, which the industry had considered a genuine possibility beforehand. Firms had deferred procurement while awaiting the guidance.
Signal: Supervisory clarity rather than permission was the constraint, and its arrival released procurement that had been deliberately deferred.
OCTOBER 2025

Addepar expands data intelligence capability through internal development

The company released portfolio analytics and reporting intelligence built on its own aggregated position data, developed internally rather than acquired. The release targets family offices and large registered investment advisers where data complexity across private and illiquid holdings exceeds what conventional reporting tools handle. No acquisition was involved.
Signal: Proprietary position data is proving more defensible than model capability, which any vendor can now access commercially.

What Delivering These Products Costs

Cost structure is dominated by two lines most software businesses carry lightly. Model inference runs between 14% and 26% of cost of goods depending on how much generation happens per interaction, a range wide enough to matter at gross margin. Implementation and adoption support take roughly 29%, far above enterprise norms, because deployment failure rather than product failure is the risk. Assurance work adds the remainder.
Inference pricing has moved sharply and unpredictably. Model providers cut published prices repeatedly through 2024 and 2025 while capability tiers shifted underneath, so vendors architected around a specific model found cost and quality moving in ways contracts had not anticipated. Several rebuilt around smaller fine-tuned models for routine work. Broadridge and SS&C both referenced elevated technology investment in 2024 reporting. Bureau of Labor Statistics data confirms advisory employment stayed flat throughout.

Exposure varies by architecture rather than by size. Vendors generating heavily per interaction carry inference cost that scales with usage, uncomfortable against a fixed seat fee. Retrieval-led products carry far less. Compliance vendors carry the highest assurance cost and recover it in price; productivity vendors cannot. Small vendors lack both the volume to negotiate inference pricing and the margin to absorb it.
ai-powered-wealth-management-solution-market-cost-volatility-analysis-1788417699588

Route routine generation to smaller fine-tuned models

Meeting summarisation and correspondence drafting rarely require frontier capability, and routing those tasks to smaller fine-tuned models cuts inference cost by around 70% with no measurable quality difference in advisor evaluation. Reserving larger models for genuinely complex reasoning preserves the perceived quality that buyers assess during selection while removing most of the cost that scales with usage.

Recover implementation cost through adoption-linked fees

Deployment support is the second largest cost line and vendors traditionally absorb it to win the deal, which is exactly backwards when 29% of pilots fail. Adoption-linked pricing recovers that cost as usage rises and aligns both parties behind the outcome the buyer actually wants. It slows initial revenue recognition, which finance functions dislike, and improves lifetime value substantially.

Build assurance documentation once across all customers

Every regulated buyer requests model controls, provenance handling and validation evidence, and answering each separately consumes senior compliance and engineering time during procurement. A standardised assurance pack reviewed with supervisors and major audit firms cuts that effort by roughly 60% and shortens compliance sales cycles materially. It also becomes the deciding factor in enterprise evaluations where capability is broadly comparable.

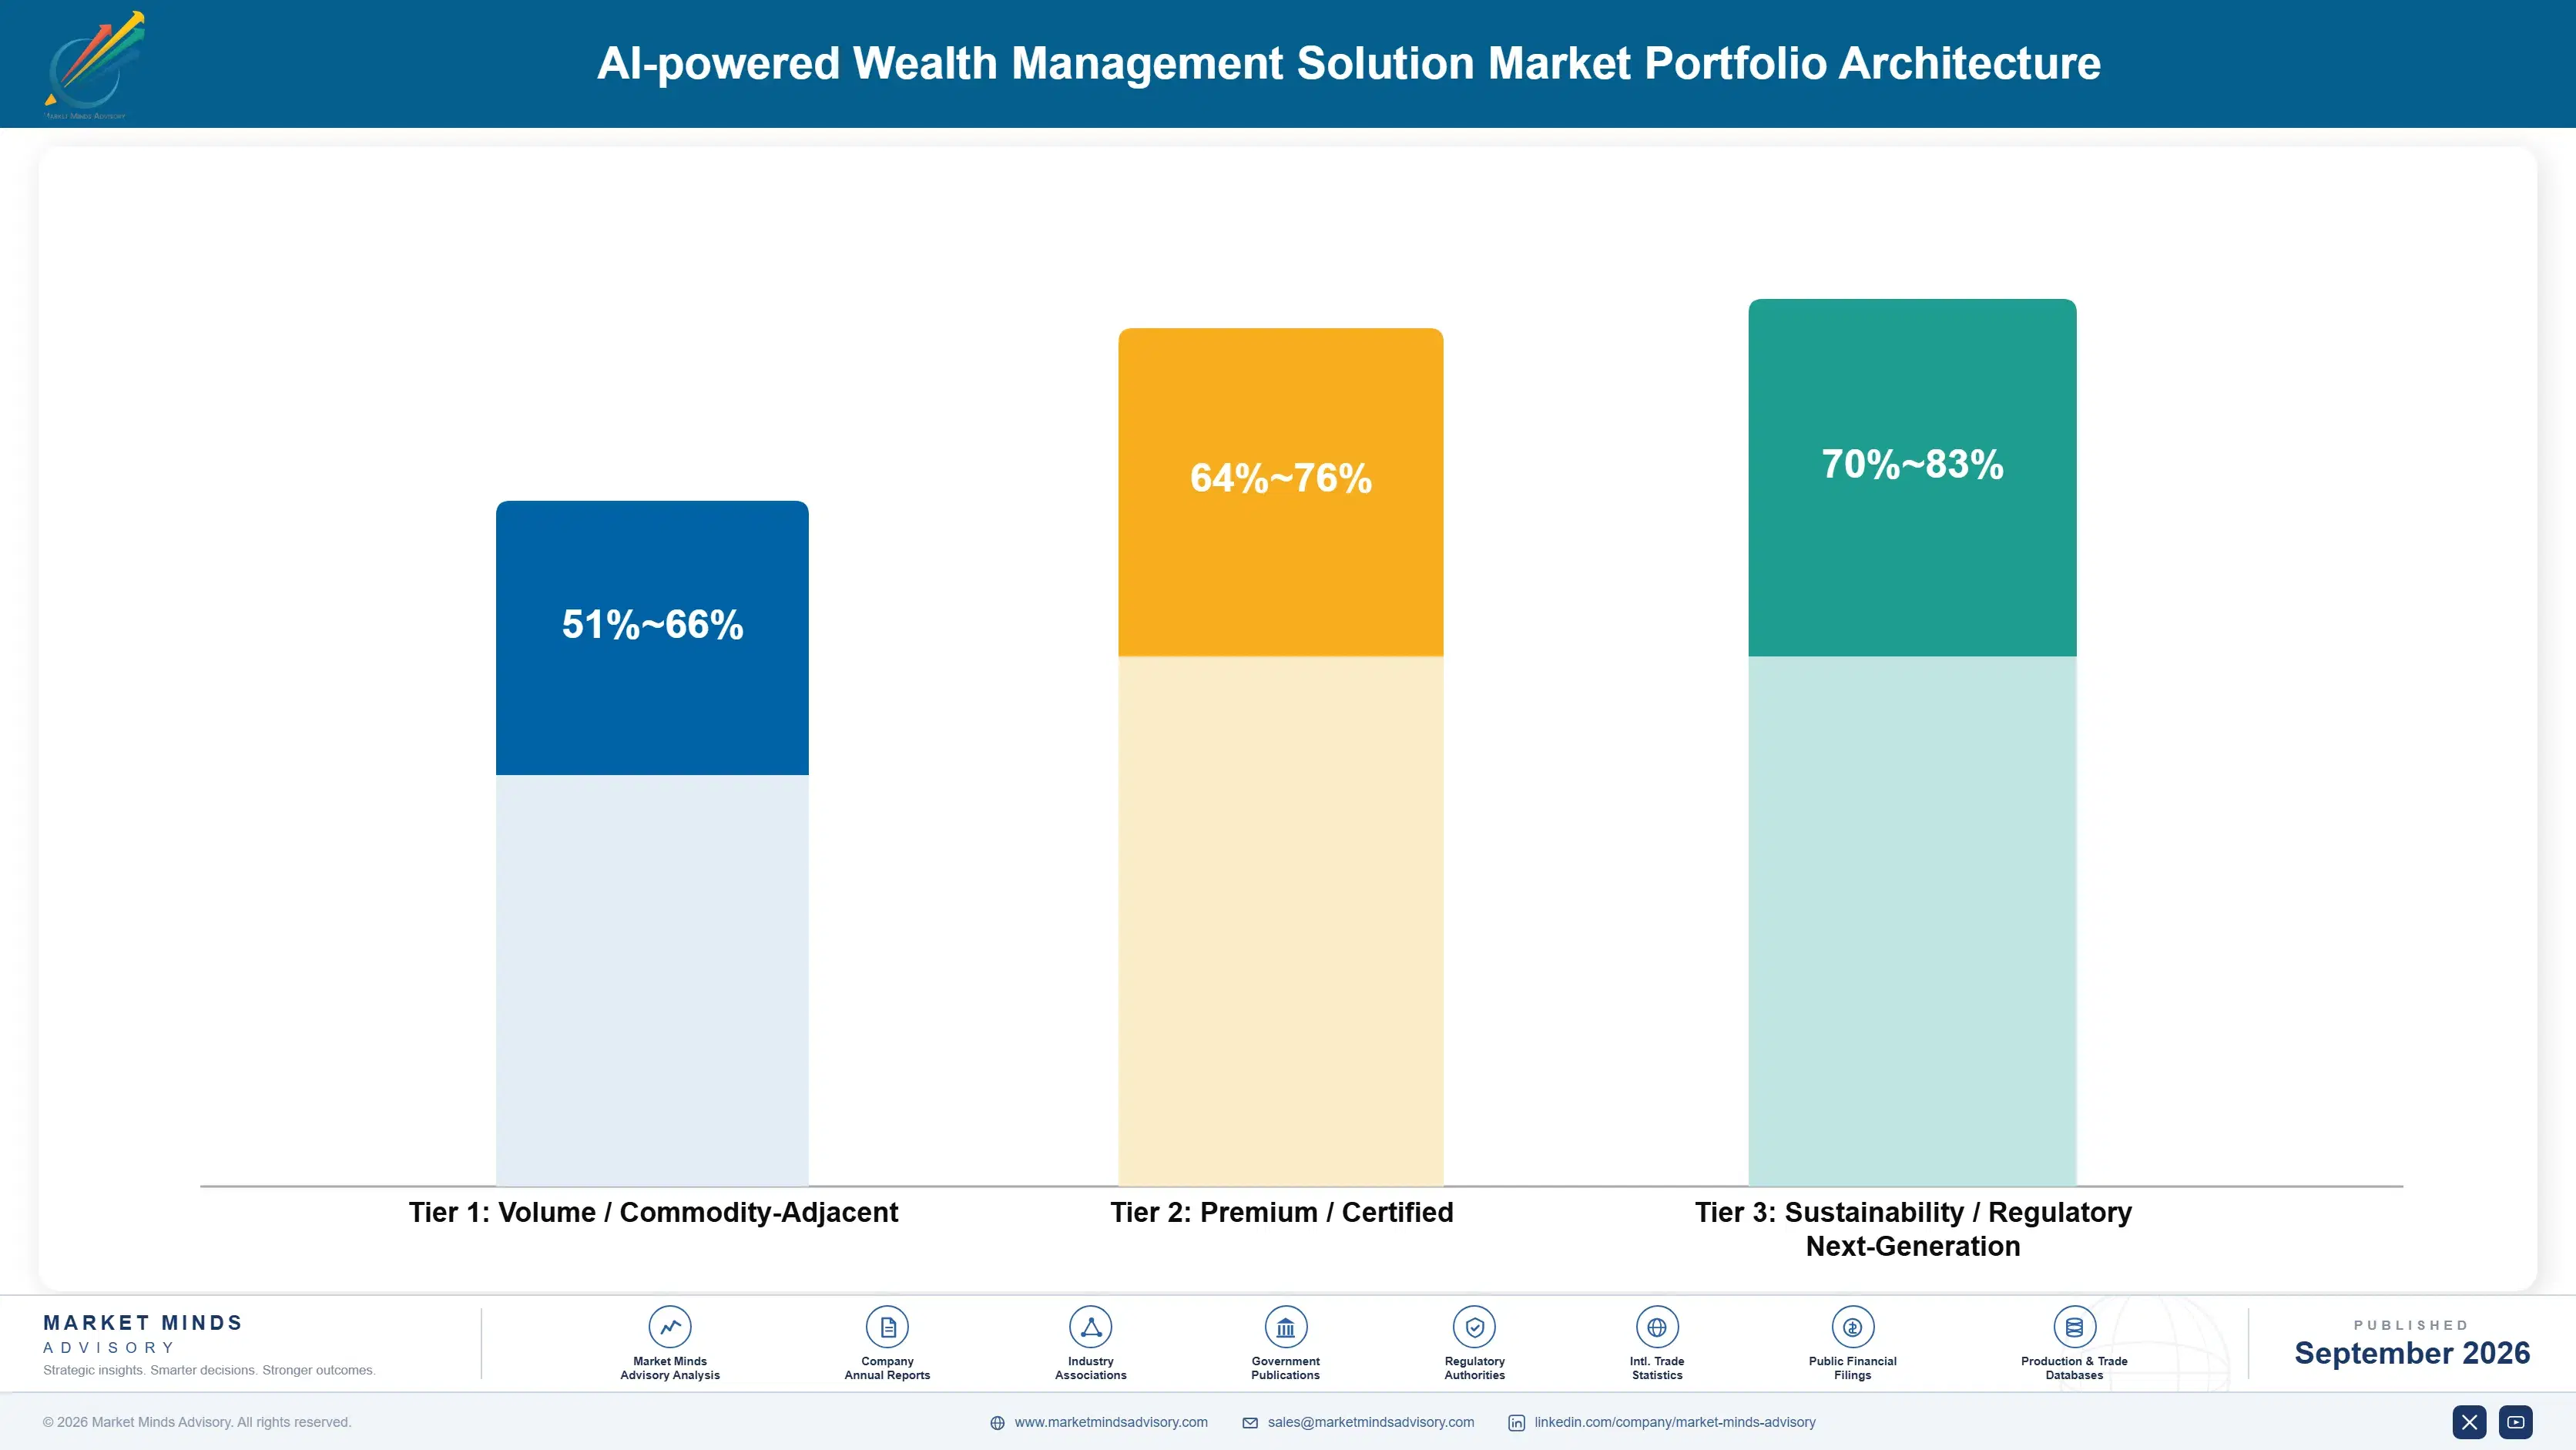
Portfolio Architecture for Margin Defence

Margin architecture separates on inference intensity and on who carries deployment risk. Products generating heavily per client interaction run materially thinner than retrieval-led ones, and the difference widens whenever pricing is a fixed seat fee rather than usage-based. Compliance products earn best because the buyer is purchasing supervisory defensibility and price sensitivity falls sharply once an enforcement action sits in the firm's history.
The volume tension is between departmental productivity purchases and enterprise platform contracts. Departmental deals close in weeks, price modestly and churn when a champion leaves. Enterprise contracts take quarters, price against assets and renew reliably. Most vendors need both, because departmental revenue funds growth while enterprise contracts fund the compliance and integration work that departmental buyers never pay for, and neither alone supports the cost base this category carries.

High-value revenue concentrates in compliance surveillance and in data positions that competitors cannot replicate, such as aggregated position data across private and illiquid holdings. Both share the property that the alternative to buying is building something genuinely difficult. Meeting intelligence generates the customer count and the strategic data layer but faces custodial bundling that has already established a low reference price, and that ceiling will not lift.

Volume / Commodity-Adjacent

Meeting intelligence, note generation and correspondence drafting sold per advisor into departmental budgets. The wide range separates retrieval-led architectures from generation-heavy ones, which differ substantially in inference cost. Custodial bundling has set a low reference price that specialists find difficult to argue against.
Gross Margin: 51-66%

Premium / Certified

Integrated advisory platforms covering proposal, portfolio and client workflow, typically priced against client assets. Margin holds because replacement means changing the operating platform rather than a point tool. Seat-priced specialists are attacking the pricing convention rather than the capability itself.
Gross Margin: 64-76%

Sustainability / Regulatory / Next-Generation

Compliance surveillance, suitability monitoring and supervisory evidence tooling. The widest range in the portfolio, reflecting how much assurance documentation and supervisory engagement is bundled into the contract. Highest margin and the most durable demand, since obligations do not soften in a downturn.
Gross Margin: 70-83%
ai-powered-wealth-management-solution-market-portfolio-architecture-1788417700089

High-value Sub-segments and Strategic Watch-out

Compliance Surveillance and Evidence

High value and high growth together, funded by compliance budgets that survive cost reviews because the alternative is supervisory exposure. The margin range reflects assurance documentation content, which varies by jurisdiction. Firms that have experienced an enforcement action buy considerably faster and negotiate far less on price.
Gross Margin: 72-83%

Proprietary Position Data Intelligence

High value with moderate growth, resting on aggregated holdings data across private, illiquid and alternative assets that competitors cannot assemble independently. The range reflects how much analytical work is bundled against raw data access. Family offices and large advisory firms pay well because no substitute exists at any price.
Gross Margin: 68-79%

Advisor Productivity Tooling

The volume core of the market and its most exposed part, with custodial bundling having established a low reference price before specialists could set their own. It generates customer count and the meeting data layer that everything downstream depends on. Vendors need it and increasingly struggle to price it properly.
Gross Margin: 48-62%

Internally Built Firm Capability

The strategic watch-out, carried at zero because it displaces vendor revenue rather than generating any. Large firms with engineering capability are building against foundation models, reasoning that workflow is firm-specific and capability is now purchasable. Vendors assuming this will fail are ignoring how much has already reached production.
Gross Margin: 0-0%

How This Revenue Repeats

Renewal here depends almost entirely on measured advisor usage rather than on contracted value. Products embedded in daily workflow renew automatically, because removing them visibly reduces servicing capacity firms cannot replace. Products bought on a capability argument and used by a minority renew once and lapse, which is why 29% never reach firmwide rollout. The contract tells you very little; the usage telemetry tells you everything.
Adoption depth varies sharply by firm type. Independent practices adopt fastest and deepest, because the principal buying also uses the product. Bank-owned wealth businesses adopt broadly and shallowly, with capability rolled out firmwide and used inconsistently. Private banks use surveillance intensively and productivity tooling lightly, given confidentiality constraints on recording. Family offices adopt data intelligence deeply and little else, since their complexity sits in holdings rather than relationship volume.

The buyer has moved from technology committees toward operating and compliance leadership. A decade ago wealth technology was evaluated by a committee assessing platform capability against a roadmap. Today a chief operating officer facing a capacity shortfall or a compliance officer facing a supervisory expectation buys directly and quickly. Vendors still selling a platform vision address a committee that no longer sets the pace.
ai-powered-wealth-management-solution-market-end-use-penetration-index-1788417700581

Where This Market Rewards Focus

These are among the four positions where our research anticipates prominent divergence between winners and laggards over the coming forecast period. Each is grounded in the demand model, the regulatory perimeter, and the announced capacity pipeline.
01 / MEETING DATA OWNERSHIP

Own the meeting record and expand outward from there

Whoever captures the meeting transcript and summary holds the input that compliance surveillance, prospecting and portfolio review each consume afterwards, and the dependency does not reverse. Vendors that enter through meeting intelligence attach adjacent modules at roughly 3 times the rate achieved by those entering elsewhere, because the underlying data dependency runs entirely in their own favour. Incumbents that treated note generation as a minor convenience feature have consistently misread how much downstream commercial position that one capability quietly controls.
02 / PRICING MODEL DEFENCE

Move to seat pricing before specialists take the budget

Around 63% of installed contracts price against client assets, which means incumbent revenue rises with markets while the customer's own advisor headcount stays flat and its cost per seat climbs. Chief operating officers making that comparison reach a fairly obvious conclusion quickly, and seat-priced specialists are quietly winning departmental purchases that never reach an enterprise evaluation at all. Defending asset-based pricing protects reported revenue in the short run while conceding precisely the accounts that generate future growth for everybody else.
03 / SUPERVISORY ACCEPTANCE WORK

Sell controls and provenance, not model capability

Compliance buyers are purchasing something a supervisor will accept, and technical model quality is only one of several contributors to that judgment. Vendors shipping documented controls, full provenance logging and evidence packs reviewed with regulators close compliance deals around 40% faster and hold price considerably better than competitors demonstrating raw capability. The work involved is documentation rather than engineering, which is precisely why so few vendors have done it properly and why it separates winners from the rest so cleanly.
04 / ADOPTION RISK TRANSFER

Price against measured usage rather than contracted seats

With 29% of deployments abandoned before firmwide rollout, the risk buyers genuinely fear is paying for software that their own advisor population simply ignores in practice. Adoption-linked pricing converts those pilots at roughly twice the rate of fixed-fee alternatives and it hands the vendor usage telemetry that improves the product materially over time. Refusing to offer it asks the buyer to carry a risk that the vendor understands far better, which sophisticated buyers now recognise and price directly into their negotiations.

Engagement Snapshot From the Field

A live engagement with an industry participant carrying material or product regulatory and market exposure ahead of a defining policy shift, showing how our research translates into a defensible multi-year portfolio strategy.
MARKET MINDS ADVISORY · CLIENT ENGAGEMENT SUMMARY
AI-powered Wealth Management Solution Producer Strategic Portfolio Review and Transition Roadmap 2026·Investment Scenario on AI-powered Wealth Management Solution Exposure Evaluation 2025-26
CLIENT PROFILE
An independent advisory network with roughly USD 62 billion in advised assets across 380 affiliated practices (client-reported, unverified by MMA), operating a central technology stack that affiliated advisors could adopt or decline. Median advisor age across the network was 58, and 41 practices had no identified succession arrangement, concentrating relationship risk in a group approaching retirement.
STRATEGIC CHALLENGE
The network had deployed meeting intelligence firmwide and measured active usage at 23% of advisors after fourteen months (client-reported, unverified by MMA), well below the business case. Leadership needed to know whether the product was inadequate, the rollout was flawed, or the advisor population simply would not change routine, and whether to renew a contract worth several million annually.
MMA APPROACH
MMA analysed usage telemetry by practice rather than by advisor, which the network had not done, then interviewed 22 advisors split between heavy users, lapsed users and non-adopters. We assessed the pilot cohort composition against the wider population and reviewed the deployment support model. Vendor capability was compared against three alternatives on adoption outcomes rather than on feature comparison.
KEY FINDINGS
  1. Adoption clustered by practice rather than by individual, with 84% of active users concentrated in 61 practices, indicating a practice-level decision the rollout had never addressed.
  2. The original pilot ran entirely with volunteer early adopters whose administrative workflow bore little resemblance to the median practice in the network.
  3. Lapsed users abandoned the product at the point where generated notes required more editing than writing from scratch, which happened predominantly in complex planning conversations.
  4. No competing product measured materially better on capability, but two offered adoption-linked pricing and embedded practice-level change support that the incumbent did not.
CLIENT PROFILE
An independent advisory network with roughly USD 62 billion in advised assets across 380 affiliated practices (client-reported, unverified by MMA), operating a central technology stack that affiliated advisors could adopt or decline. Median advisor age across the network was 58, and 41 practices had no identified succession arrangement, concentrating relationship risk in a group approaching retirement.
STRATEGIC CHALLENGE
The network had deployed meeting intelligence firmwide and measured active usage at 23% of advisors after fourteen months (client-reported, unverified by MMA), well below the business case. Leadership needed to know whether the product was inadequate, the rollout was flawed, or the advisor population simply would not change routine, and whether to renew a contract worth several million annually.
MMA APPROACH
MMA analysed usage telemetry by practice rather than by advisor, which the network had not done, then interviewed 22 advisors split between heavy users, lapsed users and non-adopters. We assessed the pilot cohort composition against the wider population and reviewed the deployment support model. Vendor capability was compared against three alternatives on adoption outcomes rather than on feature comparison.
KEY FINDINGS
  1. Adoption clustered by practice rather than by individual, with 84% of active users concentrated in 61 practices, indicating a practice-level decision the rollout had never addressed.
  2. The original pilot ran entirely with volunteer early adopters whose administrative workflow bore little resemblance to the median practice in the network.
  3. Lapsed users abandoned the product at the point where generated notes required more editing than writing from scratch, which happened predominantly in complex planning conversations.
  4. No competing product measured materially better on capability, but two offered adoption-linked pricing and embedded practice-level change support that the incumbent did not.
RECOMMENDED STRATEGY
Phase 1: Renegotiate to adoption-linked pricing at renewal, transferring deployment risk to the vendor and aligning fees with measured usage across practices. Phase 2: Redeploy through practice-level onboarding rather than firmwide enablement, targeting the 61 successful practices as references for comparable peers elsewhere in the network. Phase 3: Restrict generated notes to routine review meetings initially, and exclude the complex planning conversations where editing burden appears to drive abandonment.
OUTCOME
Active usage reached 58% of advisors within nine months of the redeployment, and the renegotiated contract cut fixed annual cost by roughly USD 1.9 million while adding usage-linked steps (client-reported, unverified by MMA). Two practices without succession arrangements were absorbed using the released servicing capacity.

Frequently Asked Questions

Foundational context covering the market sizes, CAGR, scope, country, region and competition that inform every finding below. This section is provided to cover basics and most often pre-purchase conversations, answered from the MMA Primary Research Dataset.

What is the current size of the AI-powered Wealth Management Solution Market?

The market was worth USD 3.8 billion in 2025 and reaches USD 4.42 billion in 2026. Advisor productivity and compliance applications account for most of the recent growth.

How large will the AI-powered Wealth Management Solution Market be by 2036?

MMA forecasts USD 19.83 billion by 2036, an expansion of 4.49 times over the forecast period. That represents USD 15.41 billion of incremental annual revenue against 2026.

What is the CAGR for the AI-powered Wealth Management Solution Market 2026 to 2036?

The base case is 16.2% compound annual growth, with a bull case at 17.4% and a bear case at 15.0%. Supervisory treatment of generated advice documentation separates the scenarios.

Which segment is growing fastest?

Advisor productivity and meeting intelligence grows at 24.3%, half again the market rate of 16.2%. Advisors spend roughly 41% of working hours on administrative tasks the technology addresses directly.

Who are the major companies in the AI-powered Wealth Management Solution Market?

Envestnet, SS&C Technologies, Broadridge Financial Solutions, InvestCloud and Addepar lead on measured software subscription revenue. Together they hold roughly 31%, which is low for enterprise software.

Which country is growing fastest?

India grows fastest at 22.6%, driven by domestic wealth management expanding from a small base without legacy workflow, and by capability centres running advisory operations for Western firms.

Report Segmentation Architecture

The full report scope spans multiple orthogonal segmentation dimensions, with cross-tabulated demand data provided for each dimension pair. Coverage extends further to regional breakdowns, trend trajectories, and the competitive detail needed to support segment-level decision-making.

By Primary Market Dimension

  • Advisor Productivity and Meeting Intelligence
  • Client Onboarding and Identity Verification
  • Portfolio Construction and Rebalancing Intelligence
  • Compliance Surveillance and Suitability Monitoring
  • Client Engagement and Digital Advice Delivery
  • Prospecting and Household Data Enrichment

By End-Use Industry

  • Registered Investment Advisers
  • Independent Broker-Dealer Practices
  • Bank-Owned Wealth Businesses
  • Private Banks and Family Offices
  • Insurance-Affiliated Advisory
  • Retirement and Workplace Advice Providers

By Commercial Dimension

  • Per Advisor Seat Subscription
  • Asset-Based Platform Contracts
  • Custodial Platform Bundling
  • Enterprise Compliance Mandates
  • Usage and Adoption Linked Pricing
  • Implementation and Advisory Services

By Region

  • North America
  • Western Europe
  • East Asia
  • South Asia and Pacific
  • Latin America
  • Middle East and Africa
  • Eastern Europe

Scope, Methodology, and Coverage

Every figure in this report is reproducible from documented input assumptions. The scope below maps the historical period, the forecast horizon, the segmentation dimensions, and the countries covered, alongside the underlying primary and qualitative methodology.
Historical Period
2020 to 2025
Forecast Period
2026 to 2036
Base Year
2025 (USD billions; MMA Primary Research Dataset, September 2026)
Market Definition
This market covers software applying machine learning and generative techniques to wealth advisory workflow, spanning advisor productivity and meeting intelligence, client onboarding and identity verification, portfolio construction and rebalancing intelligence, compliance surveillance and suitability monitoring, digital advice delivery and prospecting data enrichment. Revenue is measured as software subscription, usage fees and directly attributable implementation and adoption services at vendor level. Custody, brokerage execution, banking core systems, asset management fees, insurance administration and direct-to-consumer investing applications are excluded.
Quantitative Units
USD billions, software subscription and attributable services revenue
Segmentation Dimensions
Advisory workflow capability, firm type, commercial model, region
Regions Covered
North America, Western Europe, East Asia, South Asia and Pacific, Latin America, Middle East and Africa, Eastern Europe
Countries Covered
United States, Canada, United Kingdom, Switzerland, Germany, France, Italy, Netherlands, Sweden, Luxembourg, Poland, Czechia, Japan, South Korea, China, Hong Kong, Taiwan, Singapore, India, Australia, Brazil, Mexico, Chile, United Arab Emirates, Saudi Arabia, South Africa
Key Companies Profiled
Envestnet, SS&C Technologies, Broadridge Financial Solutions, InvestCloud, Addepar, Orion Advisor Solutions, Salesforce, Morningstar, BlackRock, Temenos, Avaloq, FNZ, Charles River Development, Practifi, Nitrogen, Jump, Zocks, Vise, Objectway, Comarch
Quantitative Methodology
Primary survey, n=3,800 respondents, Q4 2025, six countries; demand-side model with trade association cross-validation
Qualitative Methodology
47 expert interviews, Q4 2025; applied to validate demand model assumptions, identify emerging dynamics, and assess competitive positioning
Report Format
PDF and XLSX data workbook (Word format preview document)
Publisher
Market Minds Advisory
Report Code
MMA-2026-TEC-781
Published
September 2026
Contact
sales@marketmindsadvisory.com | www.marketmindsadvisory.com

Purchase the full AI-powered Wealth Management Solution Market Report (2026 to 2036).

The full MMA report examines why advisor capacity rather than investment intelligence drives spending in this category, and what that means for pricing, product priority and competitive position. It sizes the market to 2036 across six workflow segments, seven regions and 26 countries, with segment growth rates and regional demand mechanisms set out in full. Competitive analysis covers 20 participants assessed on measured software subscription revenue, including moat and risk assessment for the two leaders. The report quantifies inference and deployment cost structure, adoption economics and margin architecture across three portfolio tiers. It closes with four strategic verdicts and an anonymised advisory network engagement.
Six advisory workflow segments sized to 2036
Seven regions with demand mechanism analysis
Twenty vendors on consistent subscription revenue basis
Inference cost and adoption rate benchmarks
Margin architecture across three portfolio tiers
Anonymised advisory network adoption strategy engagement

Built For The People Who Decide

From boardroom strategy to bench-side execution, this report is read cover-to-cover by leaders shaping the next decade of their industry, turning demand scenarios, market dynamics and valuation benchmarks into decisions.
CXOs/ Presidents/ VPs/ Managers
M&A and Corporate Development
Strategy Teams and R&D Heads
Procurement and Product Directors
Regulatory and Compliance Leaders
Investor Relations and Equity Analysts