Market Minds Advisory
AI PC Market

AI PC Market: AI PC Market: Neural Silicon, the Windows Refresh Cycle and What On-Device Inference Is Actually Worth

Neural processing silicon arrived several years ahead of the software that would justify it, so an operating system support deadline rather than any AI feature is what moves these units today.

Lead Analyst

Published

September 2026

Make Smarter Decisions with Customized Research Insights

Request a free sample report and evaluate market opportunities, growth trends, and competitive dynamics relevant to your business needs.

2025 MARKET VALUE$92.0BMarket Size 2025
2036 FORECAST VALUE$273.3BBase Case , 2026 to 2036
CAGR 2026 TO 203610.4 %Bull 11.6% / Bear 9.2%
INCREMENTAL OPPORTUNITY$171.7BNet 10- year value creation
EXPANSION MULTIPLE2.69x2036 value over 2026 base
Strategic Levers
M&A Pipeline
Regional Outlook
Country Rankings
Competitive Intelligence
Segmental Deep-dive
Call-Us : 91 93563 13602

Executive Snapshot and Market Trajectory.

The neural processor in an AI PC is used for roughly 7% of device runtime. That single figure explains why this category sells on a support deadline and a battery life claim rather than on anything the silicon was designed to do. Everything else follows from it.
Commercially the category works anyway. Neural silicon carries an average price premium near USD 310 over comparable systems without it, and 64% of commercial units are bought against an operating system support cut-off that would have forced replacement regardless. Mobile workstations and creator systems grow fastest at 15.6%, half again the market rate of 10.4%. East Asia takes 33% of shipments by value. Value rather than units is where this shift shows itself most clearly.
Concentration is high at roughly 78% across the top five on measured shipment revenue at brand level, and it has not moved in a decade. What has changed is who supplies the silicon inside, where a third architecture entered a market that had held two for twenty years. Brand positions look stable and the value inside the chassis is being redistributed. Brand positions look more stable than the economics beneath them.
Market Definition
This market covers personal computers shipped with a dedicated neural processing unit capable of on-device machine learning inference, spanning notebooks, desktops, all-in-one systems, detachable tablets, mobile workstations and ruggedised field devices. Revenue is measured as system shipment value at brand level. Servers, smartphones, tablets without keyboard-first designs, standalone accelerator cards, component-level silicon sales and cloud-delivered artificial intelligence services are excluded.
Base Year Value
$92.0B in 2025 (MMA Primary Research Dataset, September 2026)
Forecast Period
2026 to 2036, eleven discrete annual values
CAGR
10.4% base case. Bull 11.6%. Bear 9.2%.
Fastest Growth Segment
Mobile Workstations and Creator Systems: 15.6% CAGR
Fastest Growth Country
India: 16.8% CAGR
Fastest Growth Region
South Asia and Pacific: 12.6% CAGR
Largest Region
East Asia: 33% of 2025 global value
Market Leaders
Lenovo, HP, Dell Technologies, Apple and ASUS lead on measured AI PC shipment revenue at brand level. Source: MMA Primary Research Dataset, July 2026.
Primary Survey
n=3,800 procurement and R&D decision-makers, Q4 2025, six countries
Methodology
Demand-side build-up, cross-validated against public data, 47 expert interviews

AI PC Market Forecast Scenarios

ai-pc-market-size-forecast-scenario-1788419575017
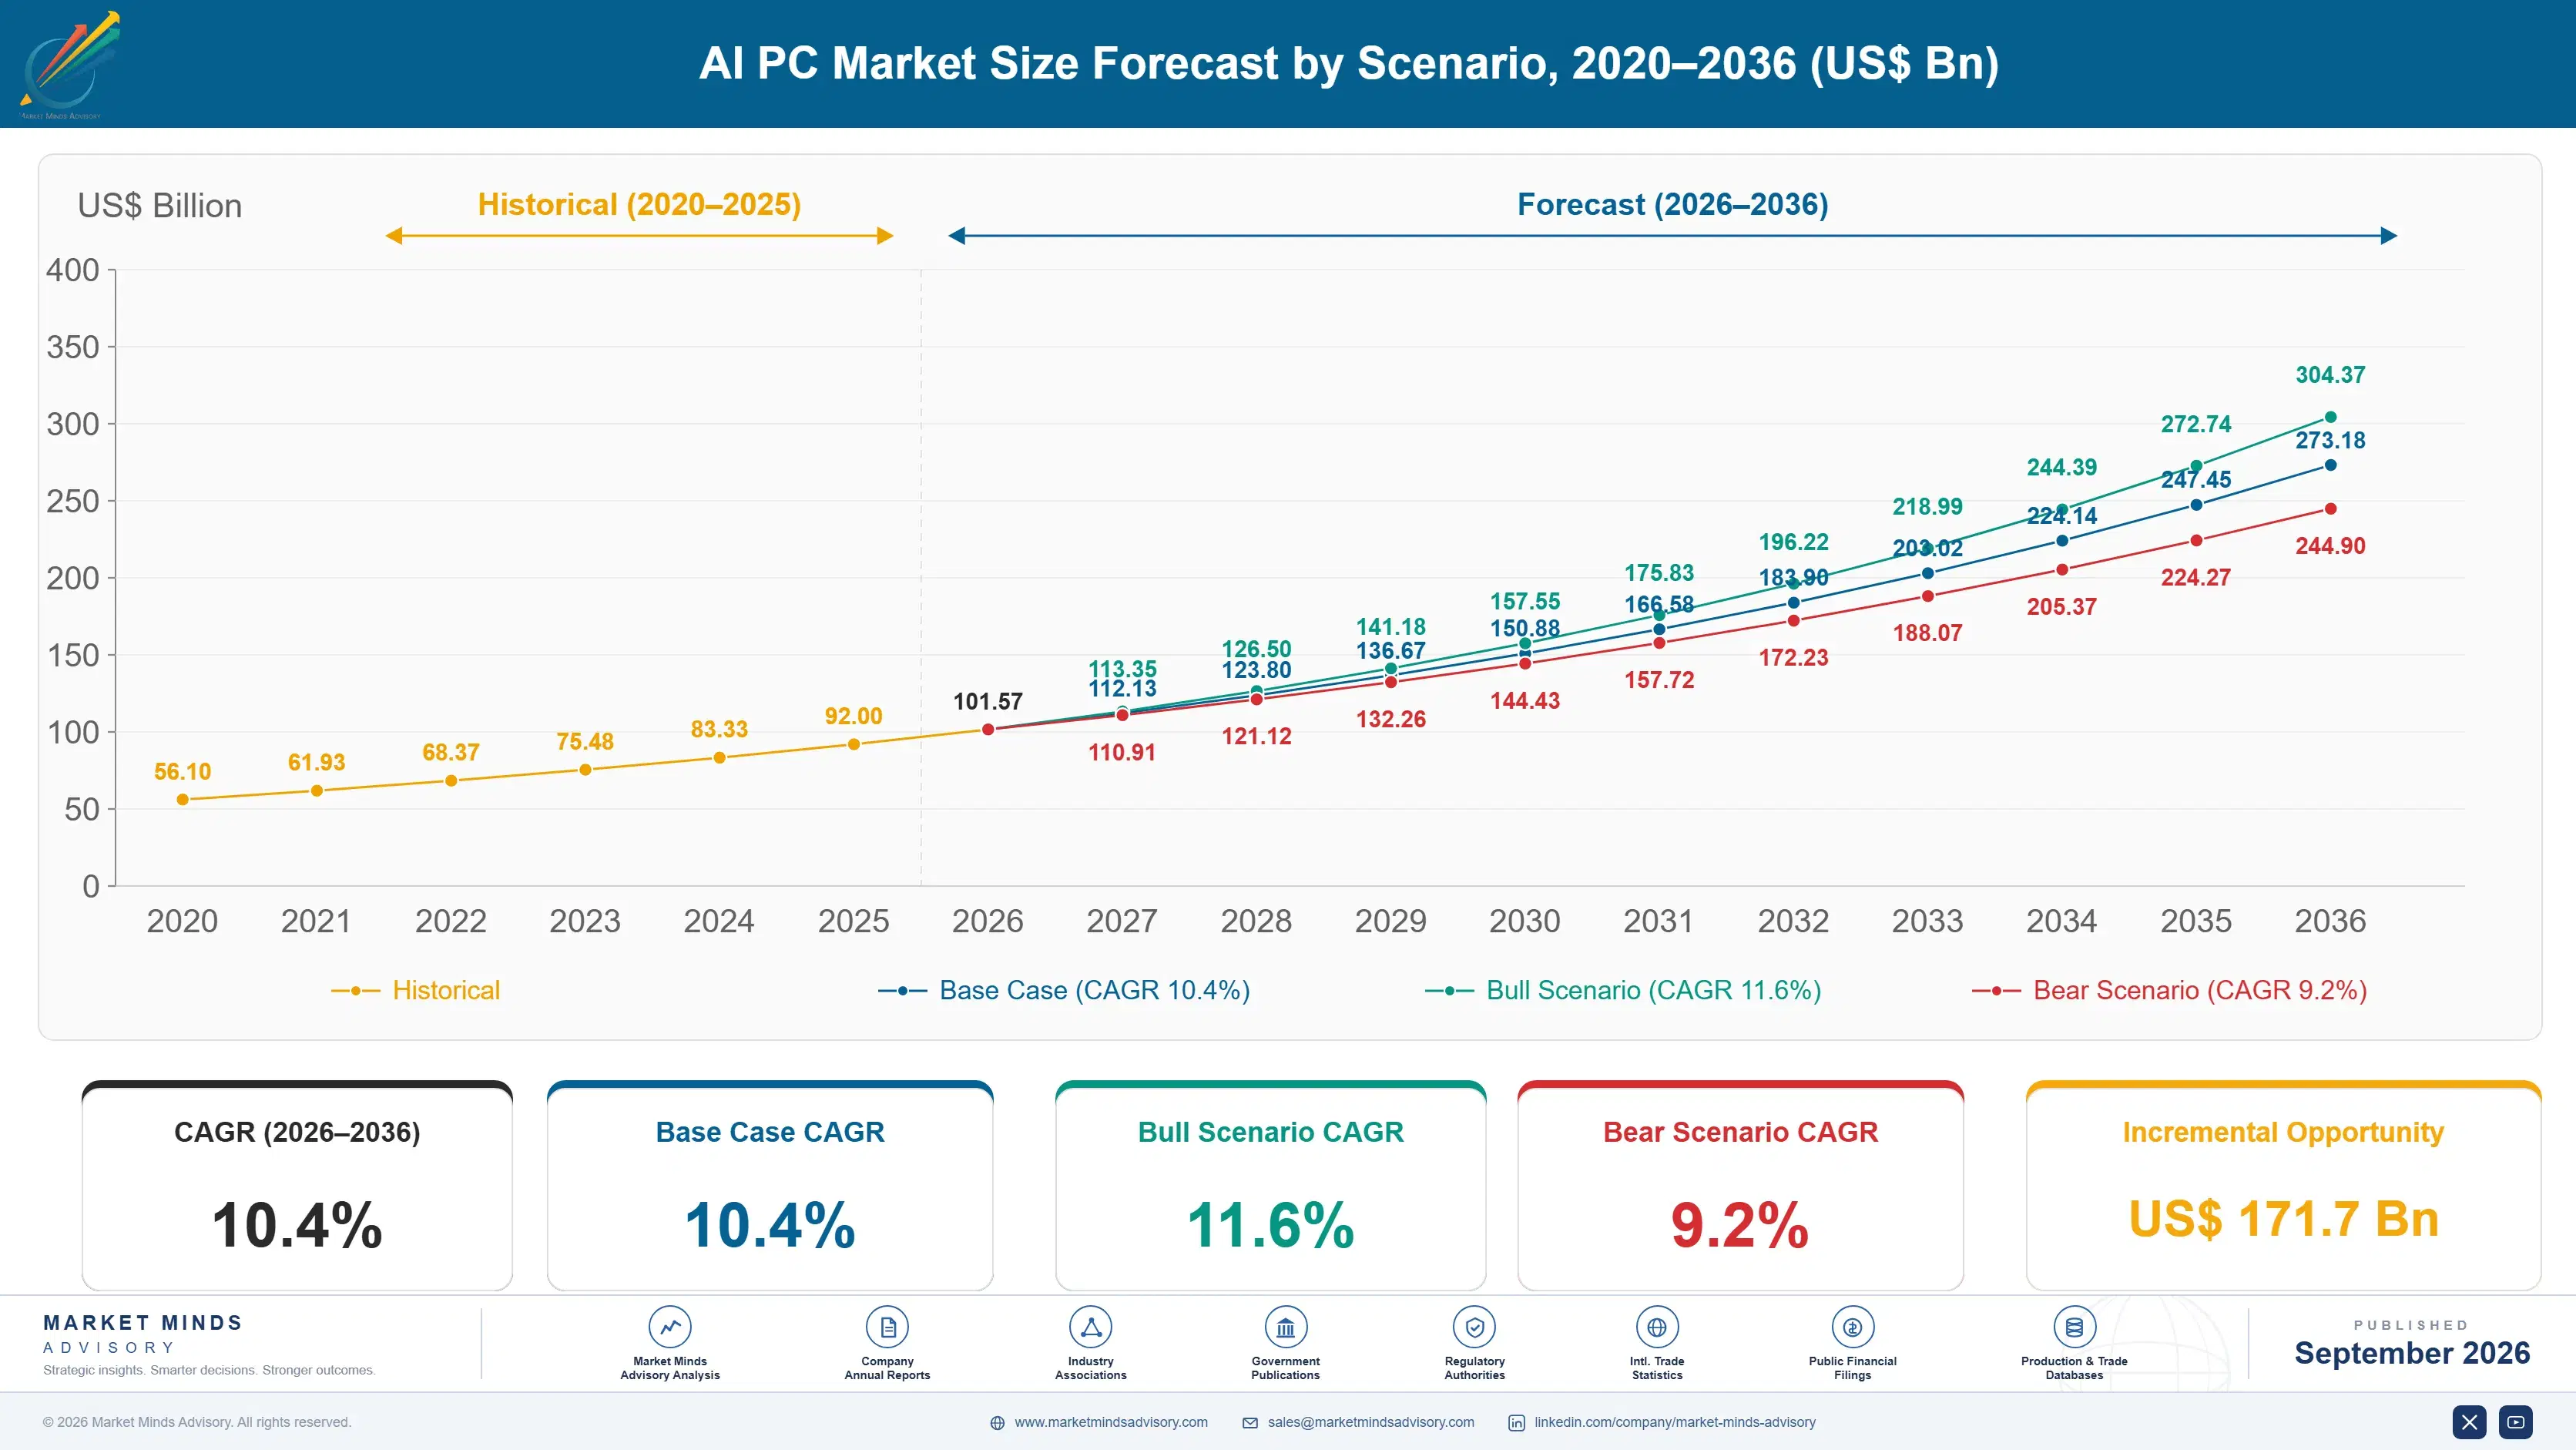
The 2020 to 2025 period ran at 9.4% measured across the premium and commercial systems that became this category, and it contained two quite different episodes. Pandemic demand pulled several years of replacement forward into 2020 and 2021, then collapsed through 2022 and 2023 as that base had no reason to refresh. Neural silicon arrived in 2024 into a market that was already due a cycle.
The base case at 10.4% rests on three mechanisms rather than on software adoption. The commercial installed base averages 4.6 years and an operating system support deadline removed the option of deferring further, which makes a discretionary purchase a scheduled one. Neural silicon sustains an average price premium near USD 310, lifting revenue faster than units. Third, enterprise interest in keeping sensitive prompts on the device rather than in a cloud service is beginning to appear in procurement specifications.
The bull case at 11.6% assumes a genuinely compelling local application emerges, which would turn the neural processor from a specification line into a reason to buy. The bear case at 9.2% is that the refresh completes on schedule and 2028 arrives with no replacement demand and no software argument. That is the likelier outcome.

The Silicon Arrived Before the Reason to Buy It

Two things are true at once and the industry only says one of them out loud. Neural silicon in a personal computer is real, capable and genuinely more efficient than inference on the main processor. It is also mostly idle, because the applications people use send requests to a cloud service with far more capability than any laptop holds. Utilisation sits near 7% of runtime.
TOP FIVE CONCENTRATION78%Highly concentrated brand field with entrenched channel positions
NPU UTILISATION RATE7%Share of device runtime actually using the neural processor
SELLING PRICE PREMIUMUSD 310Additional price captured over comparable systems without neural silicon
COMMERCIAL REFRESH SHARE64%Units purchased against an operating system support deadline
BATTERY LIFE GAIN23%Improvement from offloading inference away from the processor
INSTALLED BASE AGE4.6 yearsAverage age of commercial systems awaiting replacement now
What sells these machines is more prosaic. A support deadline removed the ability to defer replacement on a commercial base averaging 4.6 years, and 64% of units are moving for that reason. The AI label was attached to a refresh that was going to happen. Where the silicon earns its place is battery life, roughly 23% better when inference is offloaded, which buyers value more than any demonstration.
The interesting shift is not at brand level, where the top five have held roughly 78% for a decade, but inside the chassis. A third processor architecture entered a market that ran on two for twenty years, and that competition has widened OEM negotiating room for the first time since the netbook era. Brands capture a USD 310 average premium while paying less than the specification implies.
"The most honest thing anyone in this industry could say is that the neural processor is a battery life feature that happens to be marketed as an intelligence feature. Buyers worked that out faster than the marketing did, and the ones who bought for battery life are the satisfied customers."
Director, Client Computing and Devices Practice · MMA Technology Practice · September 2026

Market Trends

A Third Silicon Architecture Reopens Component Negotiation

Personal computing ran on two processor architectures for twenty years and now runs on three, with Arm-based designs holding a defensible position in thin notebooks on efficiency grounds. The consequence for brands is not primarily technical. It is that a genuine third bidder exists for the first time since the netbook period, which has widened negotiating room on the single largest line in the bill of materials. Brands are capturing better silicon terms while charging a premium for the capability, and that spread is where most of the incremental margin in this category currently sits.
Market Impact: Drives 64% of commercial units
Local Inference Becomes a Data Residency Argument

The consumer case for on-device artificial intelligence remains weak, and the enterprise case is arriving from an entirely different direction. Regulated firms that will not send client information, patient records or legal drafts to an external inference service are beginning to specify on-device processing capability in procurement documents. The workloads involved are narrow, mostly summarisation and drafting, and the volumes are small. But the buyer is a compliance function with a defensible budget rather than a user choosing a feature, which makes this the most durable demand argument the category has produced.
Market Impact: Delivers 23% battery improvement

Market Opportunities and Growth Drivers

Operating System Support Deadline Forces a Scheduled Refresh

End of security support for a widely deployed operating system version removed the option of deferring replacement on a commercial installed base averaging 4.6 years, and information security functions rather than technology budgets made that call. Roughly 64% of commercial units now moving are attributable to it. The effect is a genuine demand pull rather than a marketing one, and it is finite by construction: every unit replaced this cycle is a unit that will not need replacing again until the early 2030s. Vendors are treating a deadline as a trend.
Market Impact: Utilisation stalls near 7%

Battery Life Improvement Rather Than Feature Capability Closes Sales

Offloading inference workloads from the main processor to dedicated neural silicon improves battery life by roughly 23% in mixed use, and that is the single benefit buyers verify for themselves rather than take on trust. Thin notebook designs that previously traded runtime for weight no longer have to. Commercial fleet buyers value it because charging behaviour drives support calls and device satisfaction scores. The category markets intelligence and sells endurance, which is an awkward position for product marketing and a perfectly good one commercially. Support call volumes fall when devices last a full working day.
Market Impact: Trough expected within 3 years

Market Restraints and Challenges

Software Has Not Arrived to Justify the Hardware

Neural processor utilisation near 7% of runtime is the central commercial problem in this category, and it has persisted across three silicon generations. The root cause is that cloud inference is simply more capable, and application developers optimise for the largest addressable base rather than for silicon present in a minority of installed machines. Commercially this caps what can be claimed and invites scepticism from technical buyers. Vendors are responding by funding developer programmes, shipping local model runtimes and, more effectively, repositioning around battery life and data residency instead. Repositioning has worked better than developer funding.
Market Impact: Covers 3 competing processor architectures

The Refresh Cycle Is Finite and Ends Around 2028

Replacement demand created by an operating system deadline exhausts itself once the installed base has moved, and the units bought in this cycle will not need replacing until the early 2030s. The root cause is that nothing in this category creates a shorter replacement interval; neural silicon does not wear out faster than what it replaced. Commercially that implies a demand trough that most vendor planning does not acknowledge. Mitigation is being sought through subscription device models, attach services and expanding the ruggedised and workstation categories that refresh on their own schedules.
Market Impact: Appears in 22% of tenders
3 additional market trends, 4 additional growth drivers, and 2 additional restraints and challenges are covered in the full report. Contact sales@marketmindsadvisory.com to access the complete intelligence.

Segment CAGR and Growth Architecture

Segmentation follows device class, because that determines who buys, what the neural silicon is actually used for and how much premium the specification supports. The categories where inference does real work behave quite differently from the volume notebook business, and the gap between the two is what governs relative growth across the forecast period.
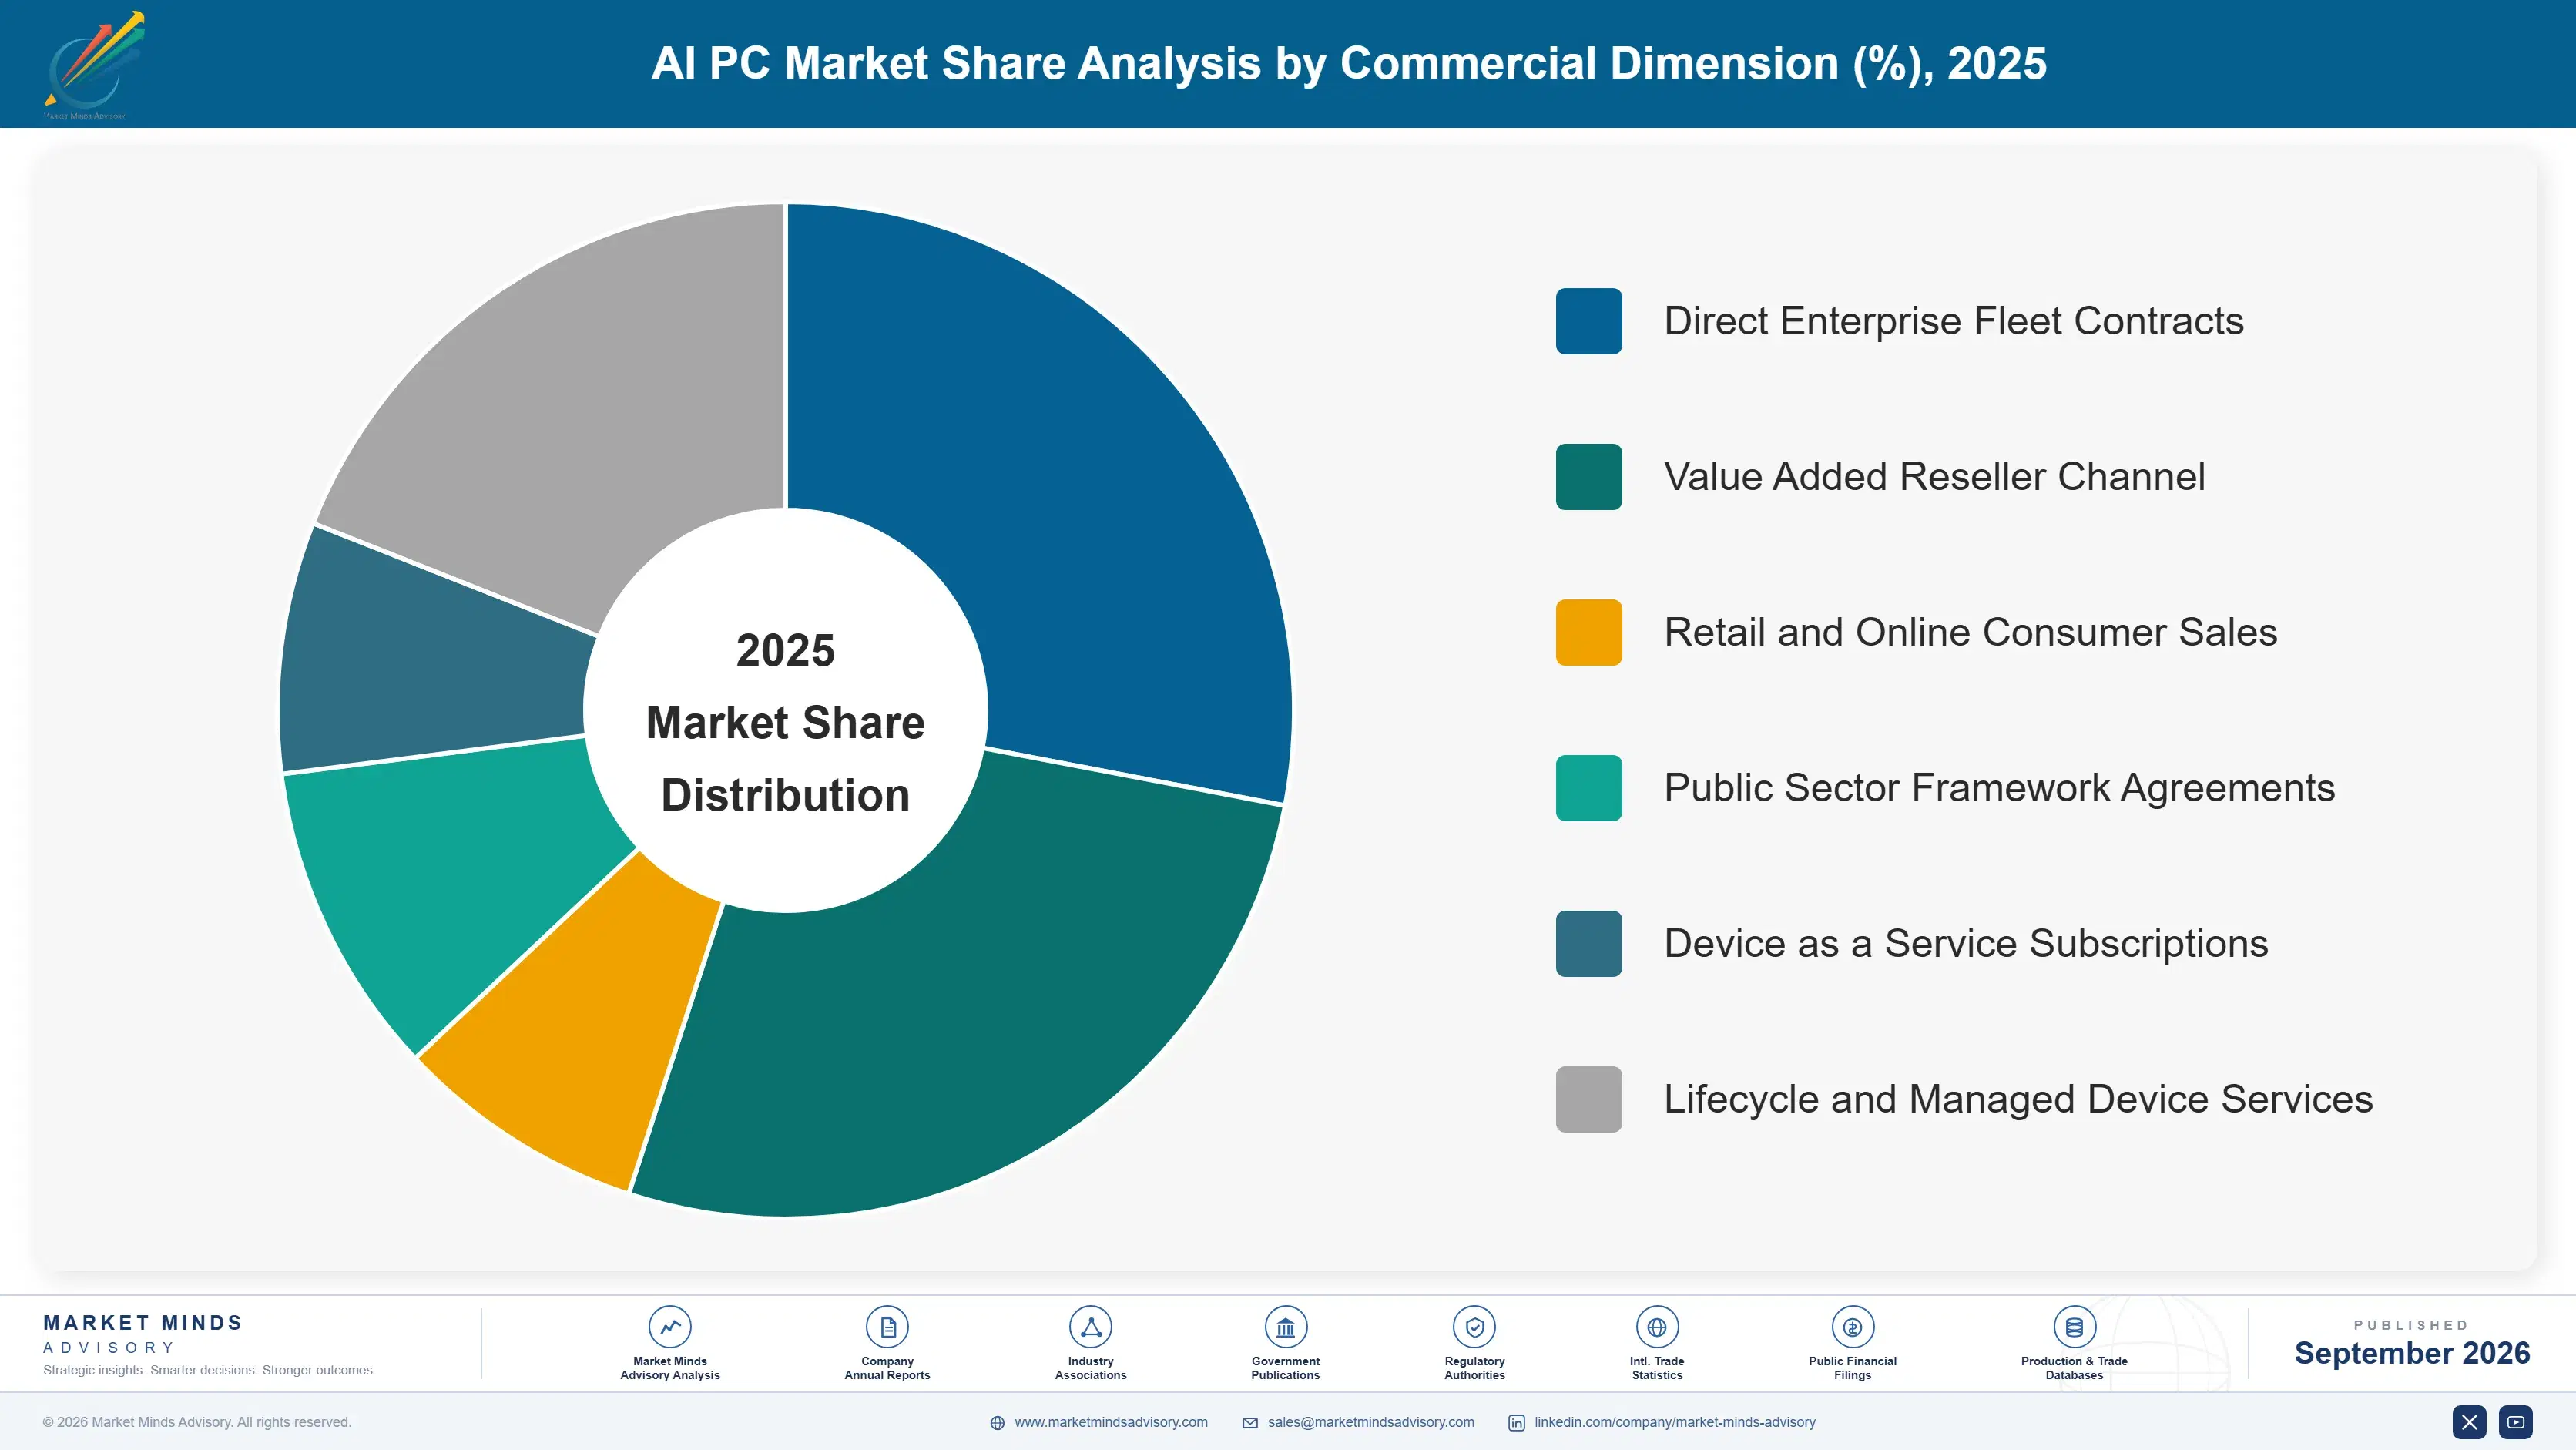
ai-pc-market-market-share-analysis-1788419575550

Mobile Workstations and Creator Systems

This is the one part of the market where the neural processor earns its place, growing at 15.6%, half again the market rate of 10.4%. Video editing, photo processing, computer-aided design, simulation preview and local model development all produce measurable time savings from on-device inference rather than a specification line nobody exercises. Buyers here pay premiums well above the USD 310 average and specify sustained rather than peak performance, since thermal behaviour over an hour matters more than a benchmark figure. The population is small against total shipments, refreshes on its own professional cycle rather than an operating system deadline, and is the only group that would notice if the silicon disappeared tomorrow.
CAGR 15.6%

Ruggedised and Industrial Field Systems

Ruggedised notebooks and tablets used in field service, utilities, defence, logistics and public safety grow at 13.8% for a reason specific to their operating conditions: connectivity is unreliable or absent, so inference genuinely has to happen locally or not at all. Document capture, damage assessment, translation and voice transcription all work without a network on this hardware. Unit volumes are modest and average selling prices run several times a mainstream commercial notebook, which makes the segment far more valuable than its shipment share suggests. Replacement cycles are long, procurement is contractual rather than discretionary, and the buyer set is dominated by a small number of specialist brands. Certification requirements keep new entrants out almost entirely.
CAGR 13.8%
Full segment breakdown across 6 segments available in the complete report.

Regional Architecture and Country Demand Map

Regional demand tracks commercial installed base age, premium purchasing capacity and the pace of domestic brand promotion. Consumer volumes matter less to revenue than the commercial refresh does, since business systems carry the specifications that command a premium. Consumer volume tells you very little about value.

East Asia

East Asia holds 33% of shipment value, above the regional band, and the justification is that China alone rivals the United States for personal computer consumption while Japan and Korea add premium commercial demand at high average selling prices. Chinese brands have promoted neural silicon more aggressively than anyone, treating it as a differentiation instrument in a domestic market where specification competition is intense and margins are thin. Government and state enterprise procurement has moved toward domestically designed silicon, which creates a parallel demand stream. Japanese commercial refresh is disciplined and scheduled, and Korean buyers skew toward premium thin notebooks where the battery argument lands hardest. Regional growth at 11.4% runs ahead of the market.
Share: 33% | CAGR: 11.4% (2026 to 2036)

North America

The commercial refresh is sharper here than anywhere else, because information security functions treat operating system support cut-offs as non-negotiable and hold the authority to force replacement. Large enterprises and federal agencies buy in scheduled tranches, which makes demand unusually forecastable across the cycle. Premium consumer purchasing supports the highest average selling prices of any region, and creator and professional systems sell in volume that no other market matches. Regulated industries are the earliest adopters of the on-device data residency argument, with financial services and healthcare procurement beginning to specify local inference capability rather than merely accepting it. Regional growth at 9.8% sits below the market rate, since the installed base refreshed earlier and more completely than elsewhere.
Share: 27% | CAGR: 9.8% (2026 to 2036)
Regional intelligence for 5 additional markets available in the complete report: Western Europe, South Asia and Pacific, Latin America, Middle East and Africa, Eastern Europe. Contact sales@marketmindsadvisory.com.
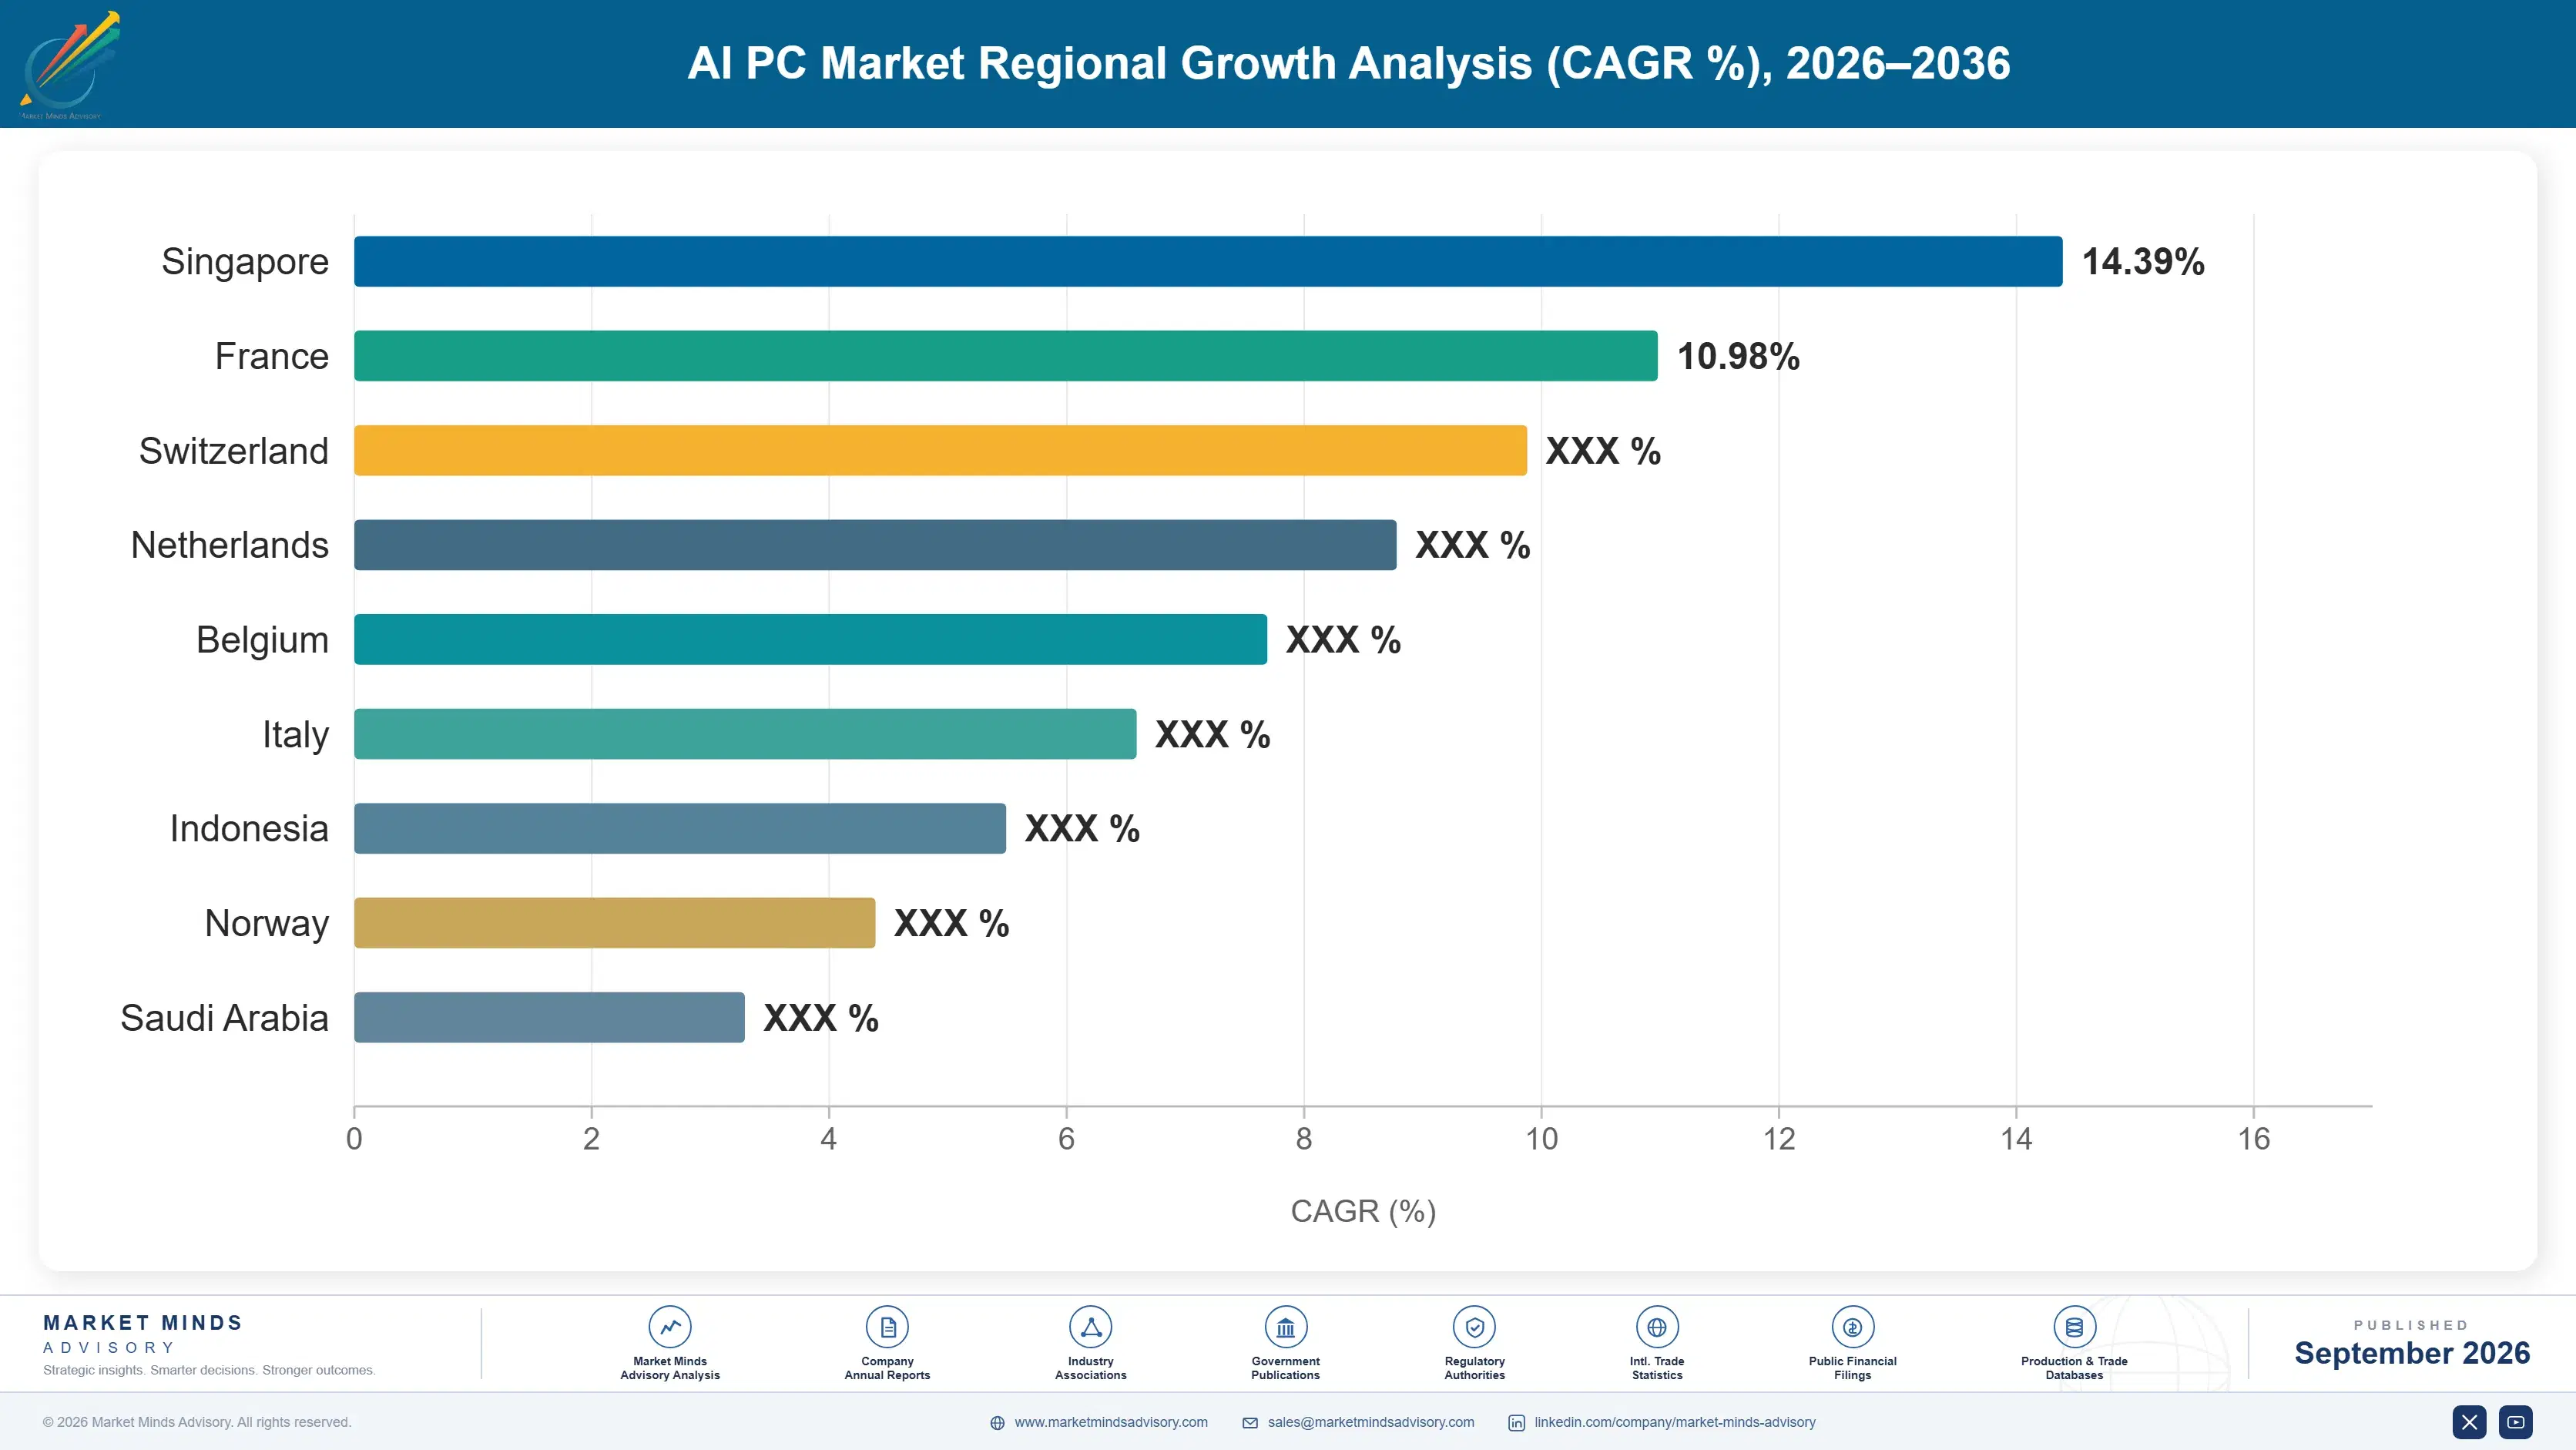
ai-pc-market-country-cagr-analysis-1788419576071

Where AI PC Margin Is Actually Made

Brand share has been static for a decade, so incremental profit comes from the spread between what neural silicon costs and what it lets a brand charge, from attaching services to a scheduled refresh, and from the categories that replace on their own timetable rather than on an operating system deadline. Brand share itself is not moving anywhere.

Bank the Silicon Spread Before Competition Closes It

A third processor architecture in the market has widened negotiating room on the largest line in the bill of materials, while the neural specification supports an average price premium near USD 310. That spread is the single largest source of incremental margin available in this category and it is temporary, because component competition eventually reaches the shelf price. Brands treating the premium as permanent are misreading it. The ones converting it into fleet contracts and service attach while it lasts will hold the advantage after the specification becomes universal and stops earning anything.
Market Impact: Captures a USD 310 average unit price premium

Attach Services to a Deadline-Driven Fleet Replacement

A refresh forced by a support deadline moves entire fleets in a compressed window, which is the one moment a brand can attach deployment, imaging, asset recovery and lifecycle management to a hardware transaction. Attach rates during forced replacement run roughly 2 times those achieved in discretionary cycles, and service revenue holds margin long after the hardware premium erodes. The window closes when the fleet has moved. Brands treating this cycle as a hardware volume opportunity rather than a services conversion are leaving the durable revenue on the table entirely.
Market Impact: Attach rates run 2 times discretionary cycle levels

Build Position in Categories With Independent Refresh Cycles

Mobile workstations, creator systems and ruggedised field devices replace on professional and contractual schedules rather than on an operating system deadline, which means they will still be selling in 2029 when mainstream commercial demand troughs. They also carry average selling prices several times a standard commercial notebook and grow at 15.6% and 13.8% respectively. Building position there costs engineering investment in thermal design and certification that volume brands avoid. That barrier is exactly why the segments hold margin when everything else compresses. These are the categories still growing when the mainstream refresh ends.
Market Impact: Two segments growing at 15.6% and 13.8% respectively

Sell Data Residency to Compliance Rather Than Features to Users

The consumer case for on-device inference is weak and the regulated enterprise case is strengthening, appearing now in roughly 22% of large tenders. A compliance function that will not send client records to an external inference service is a buyer with a defensible budget and no interest in feature demonstrations. Brands positioning local processing as a control rather than a capability reach that budget and hold price against specification comparison. It requires security documentation and attestation work that product marketing organisations are poorly equipped to produce. Attestation documentation is what actually wins these tenders.
Market Impact: Now appears in 22% of large regulated tenders

Who Controls the Margin Pool

Brand concentration is high and stable, with the top five holding roughly 78% of shipment revenue measured at brand level, a figure that has barely moved in a decade. The gap between the leaders and the next tier is one of scale in channel and supply rather than product, since design and manufacture flow through the same contract manufacturers. What separates leaders is purchasing terms, service infrastructure and channel depth, none assembled quickly.
Competition runs on three dimensions this cycle. Component cost position is the first, and a third silicon architecture has made it a live variable for the first time in years. Commercial fleet services capability is second, since a deadline-driven refresh is won on deployment and lifecycle management. Third is the professional and ruggedised categories, where thermal engineering and certification create differentiation volume notebooks cannot support.

Two pressures are building. Silicon suppliers capture a growing share of chassis value by defining the platform specification, narrowing what brands differentiate. Meanwhile the refresh ends, and brands treating a deadline as a growth trend meet a trough with cost structures built for higher volumes. Rankings will move toward brands holding services depth and independently refreshing categories.
ai-pc-market-company-positioning-matrix-1788419576599

Competitive Moat and Risk Dimensions

LENOVO

Moat: Scale and supply integration

Lenovo combines the largest shipment volume in the industry with owned manufacturing alongside contract capacity, which gives it component purchasing terms and supply flexibility competitors cannot match. Its commercial channel depth across both mature and emerging markets is unusually broad. The domestic Chinese position provides a volume base that supports pricing aggression in contested markets elsewhere without damaging overall profitability.
LENOVO

Risk: Thin margin on volume

Leading on volume in a market with static brand shares means competing largely on price, and the resulting margin leaves limited room to absorb component cost shocks. Services attach rates trail the strongest commercial competitors, which matters more as hardware premium erodes. Procurement restrictions in some government and defence markets constrain access to the highest-priced segments.
HP

Moat: Commercial fleet services depth

HP's position rests on lifecycle services, deployment capability and managed device offerings sold alongside hardware to large commercial fleets, which is exactly what a deadline-driven refresh is won on. Those contracts renew independently of hardware cycles and hold margin as device premiums erode. Long-standing enterprise and public sector relationships shorten procurement considerably against brands selling primarily on specification.
HP

Risk: Consumer exposure and cyclicality

A substantial consumer business carries thinner margins and swings harder with discretionary spending than the commercial franchise does. The company is more exposed than competitors to the demand trough that follows a completed refresh, given the share of revenue tied to mainstream commercial notebooks. Its position in independently refreshing workstation and ruggedised categories is narrower than its scale suggests.

Players Tracked

Prominent Players

Lenovo
HP
Dell Technologies
Apple
ASUS

Other Key Players

Acer
Samsung Electronics
Microsoft
Huawei
Honor
Dynabook
Fujitsu
NEC
LG Electronics
MSI
Framework Computer
Getac
Panasonic
Xiaomi
Razer

Recent Developments

OCTOBER 2025

Security support ends for widely deployed operating system version

The withdrawal of security updates removed the option of deferring replacement across a large commercial installed base, transferring the replacement decision from technology budgets to information security functions. Extended support arrangements were offered at a cost most organisations declined to carry across whole fleets. Fleet replacement compressed accordingly.
Signal: This deadline rather than any capability argument is what moved commercial volume through the second half of the year.
MAY 2025

Arm-based notebook silicon secures broader commercial design wins

Additional commercial notebook platforms from major brands adopted Arm-based processors, extending a position previously confined to consumer thin notebooks. The wins were organic design decisions rather than the result of any acquisition, joint venture or exclusive supply arrangement between the parties involved. Volume commitments were not disclosed.
Signal: A credible third architecture has widened brand negotiating room on silicon for the first time since the netbook era.
MARCH 2025

Regulated sector tenders begin specifying on-device inference capability

Financial services and healthcare procurement documents in several markets started requiring local processing capability for sensitive content rather than merely permitting it, reflecting reluctance to send client and patient information to external inference services under existing data protection obligations. The requirement applies to defined document categories only.
Signal: Compliance functions rather than users are becoming the durable buyer for on-device capability, which changes how it should be sold.

What Sits Inside an AI PC Price

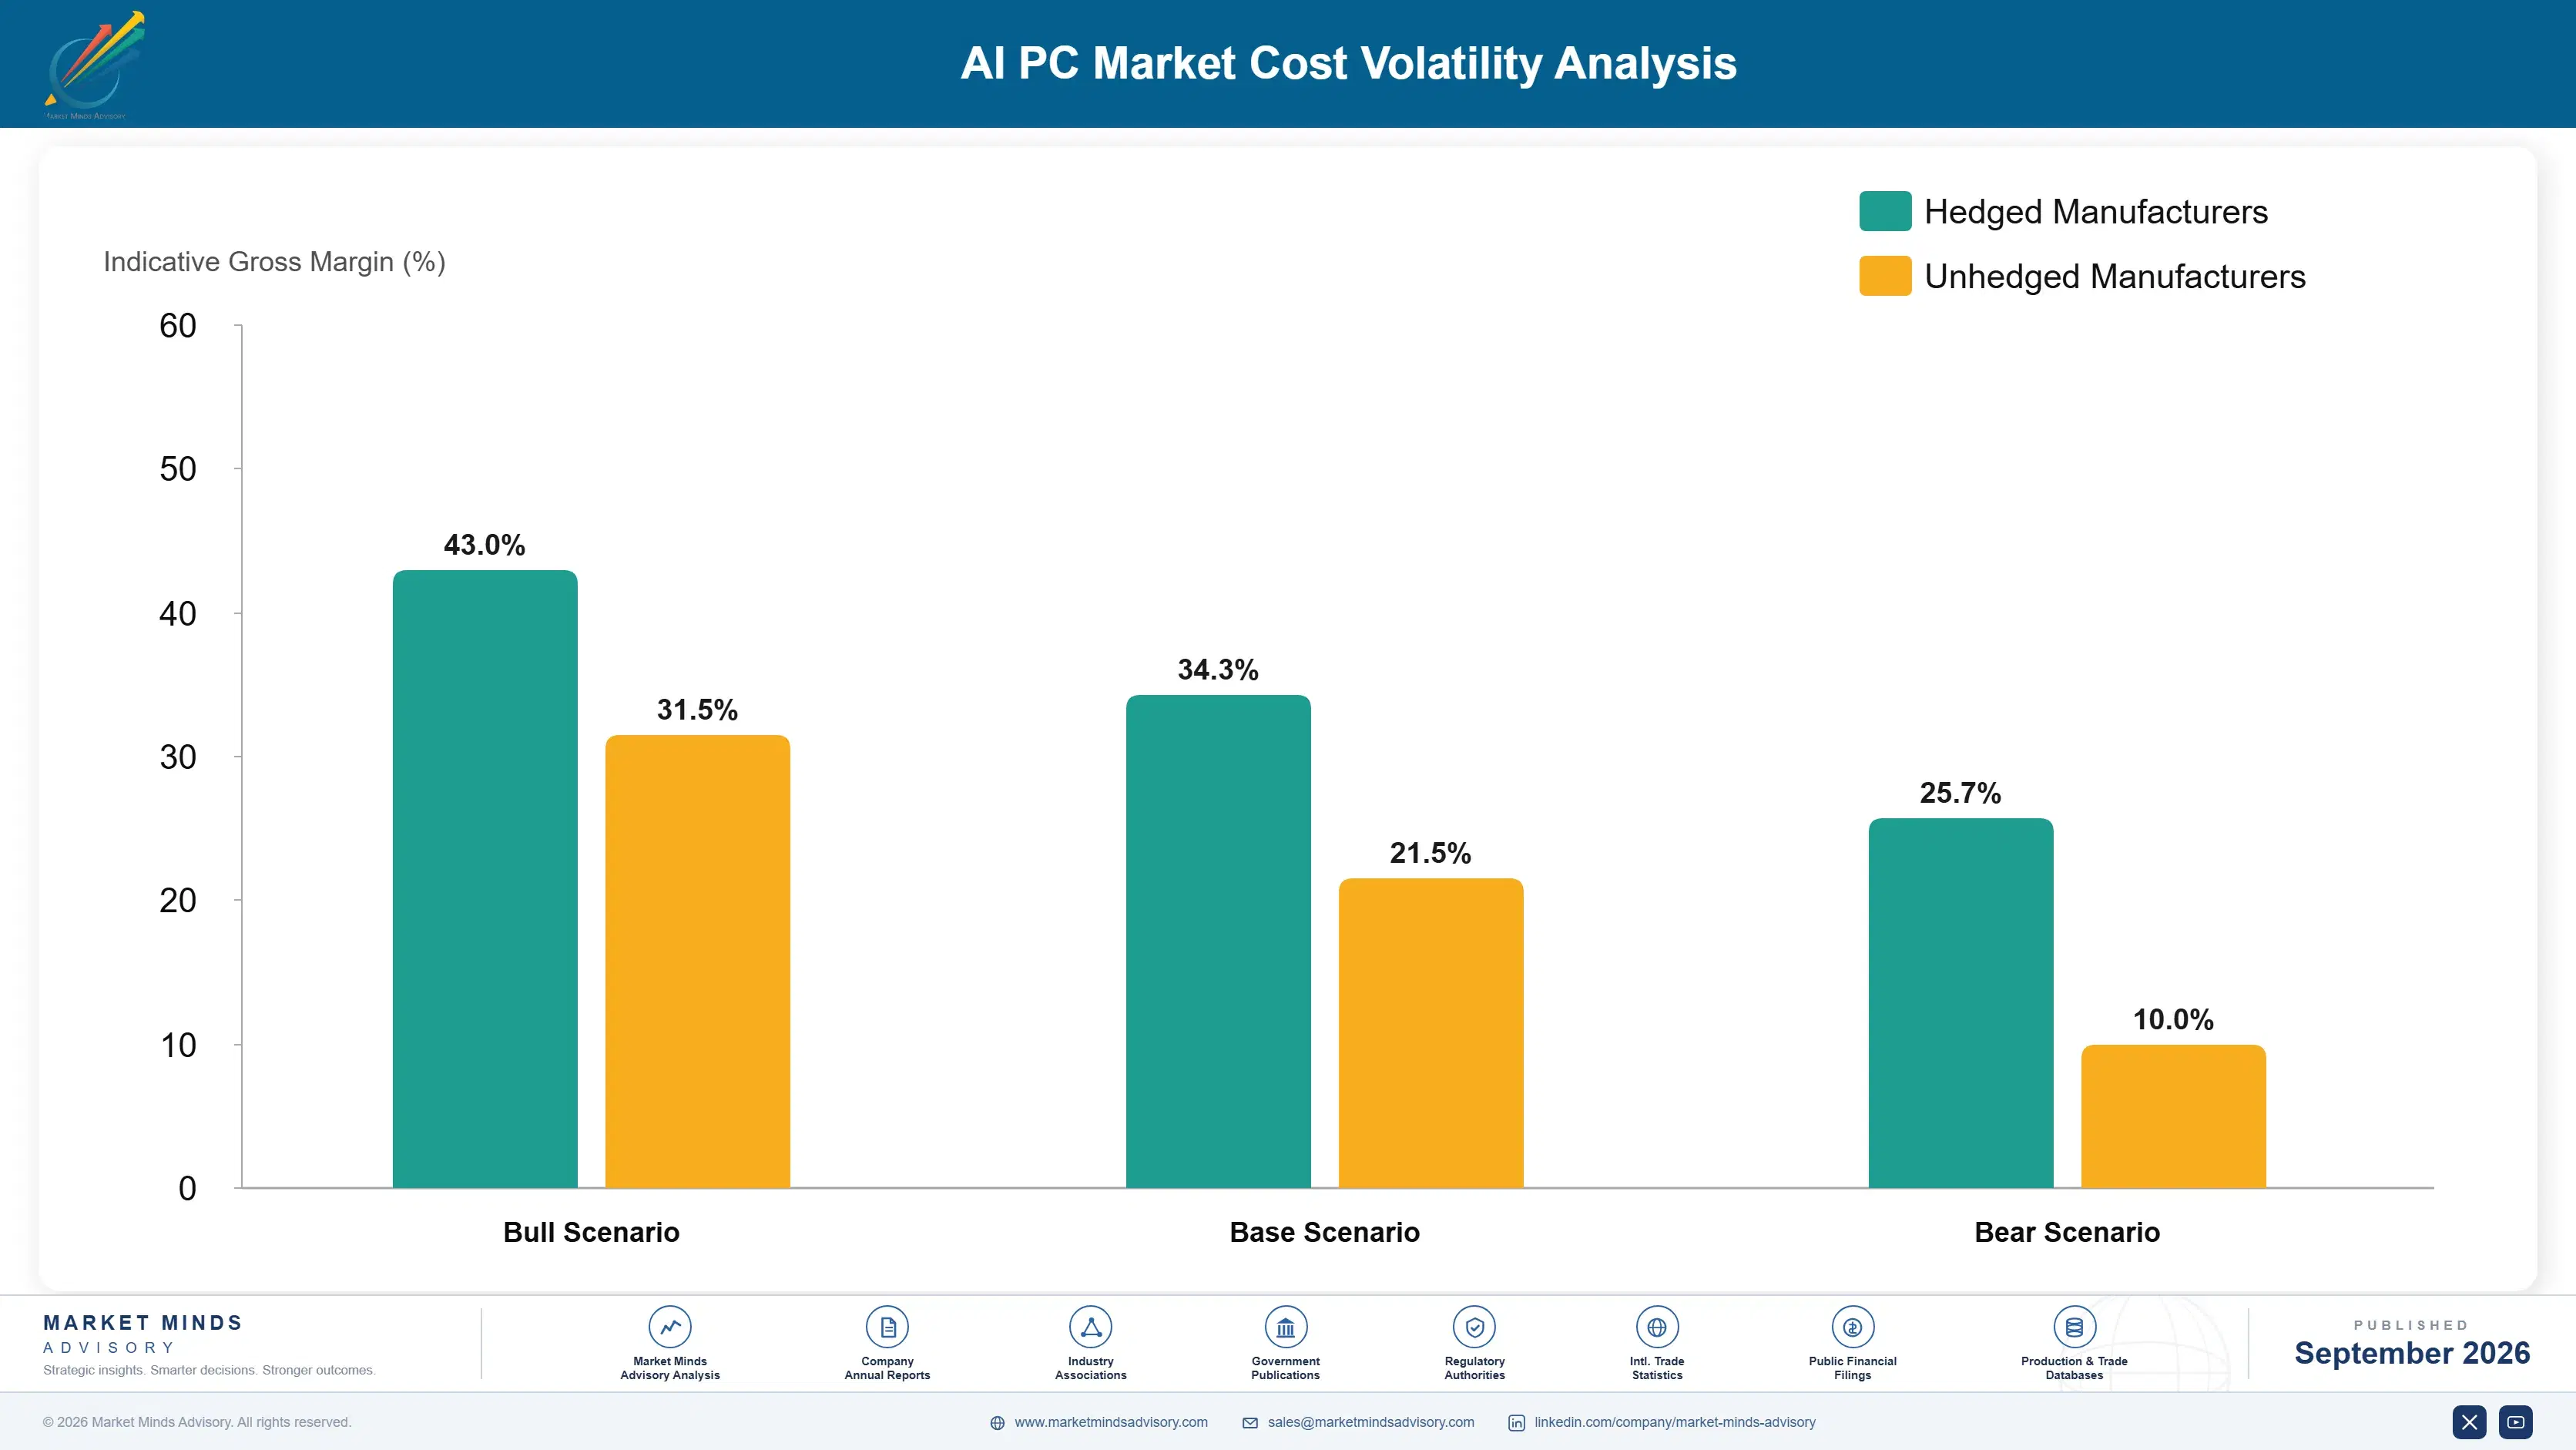
The processor and platform silicon dominate the bill of materials at between 26% and 38% of cost, a range varying with whether neural capability is integrated and which architecture is specified. Memory and storage add roughly 19%, display around 15%, chassis and thermal 9%, battery 6%, and assembly and logistics the balance. Almost all of it originates in East Asia, with assembly concentrated in few contract manufacturers.
Memory pricing has been the sharpest recent pressure by a considerable distance. Contract prices for dynamic memory rose steeply through 2024 and 2025 as suppliers reallocated wafer capacity toward high bandwidth memory, leaving conventional supply tight exactly as neural platforms specified higher minimum configurations. Lenovo and HP both referenced component cost pressure in recent annual reporting, and several brands quietly reduced base configurations instead of raising prices.

Exposure varies sharply by brand type. Volume leaders with owned manufacturing and long-term supply agreements absorb shocks that mid-tier brands pass to price, losing competitiveness. Brands with strong services attach recover margin outside the hardware transaction, which is why one cost shock produces very different results. Specialist ruggedised and workstation brands are least exposed, since pricing supports absorption and customers do not compare consumer specifications.
ai-pc-market-cost-volatility-analysis-1788419576794

Lock memory supply across the specification transition

Neural silicon platforms specify higher minimum memory configurations precisely when data centre demand is absorbing supply, which is the worst possible timing for spot purchasing. Brands securing multi-quarter contracted volume ahead of a platform transition avoid the pricing that catches competitors mid-cycle. The commitment carries inventory risk if the transition slips, and that risk has repeatedly proved smaller.

Qualify two silicon architectures on shared chassis designs

Designing a chassis and thermal system that accepts processors from more than one architecture converts silicon supply into a negotiable position rather than a dependency. Qualification effort roughly doubles at the outset and pays back through purchasing terms within one generation. It also protects delivery when a supplier misses a ramp, which happened in each of the past three transitions.

Reduce base configurations rather than raise shelf prices

Component cost increases that reach the shelf price cost share immediately in a market where specification comparison is the primary purchase mechanism. Adjusting base memory and storage while holding price preserves position and buys time for component pricing to normalise. It carries a reputational cost with reviewers who notice, so it works temporarily rather than as sustained strategy.

Portfolio Architecture for Margin Defence

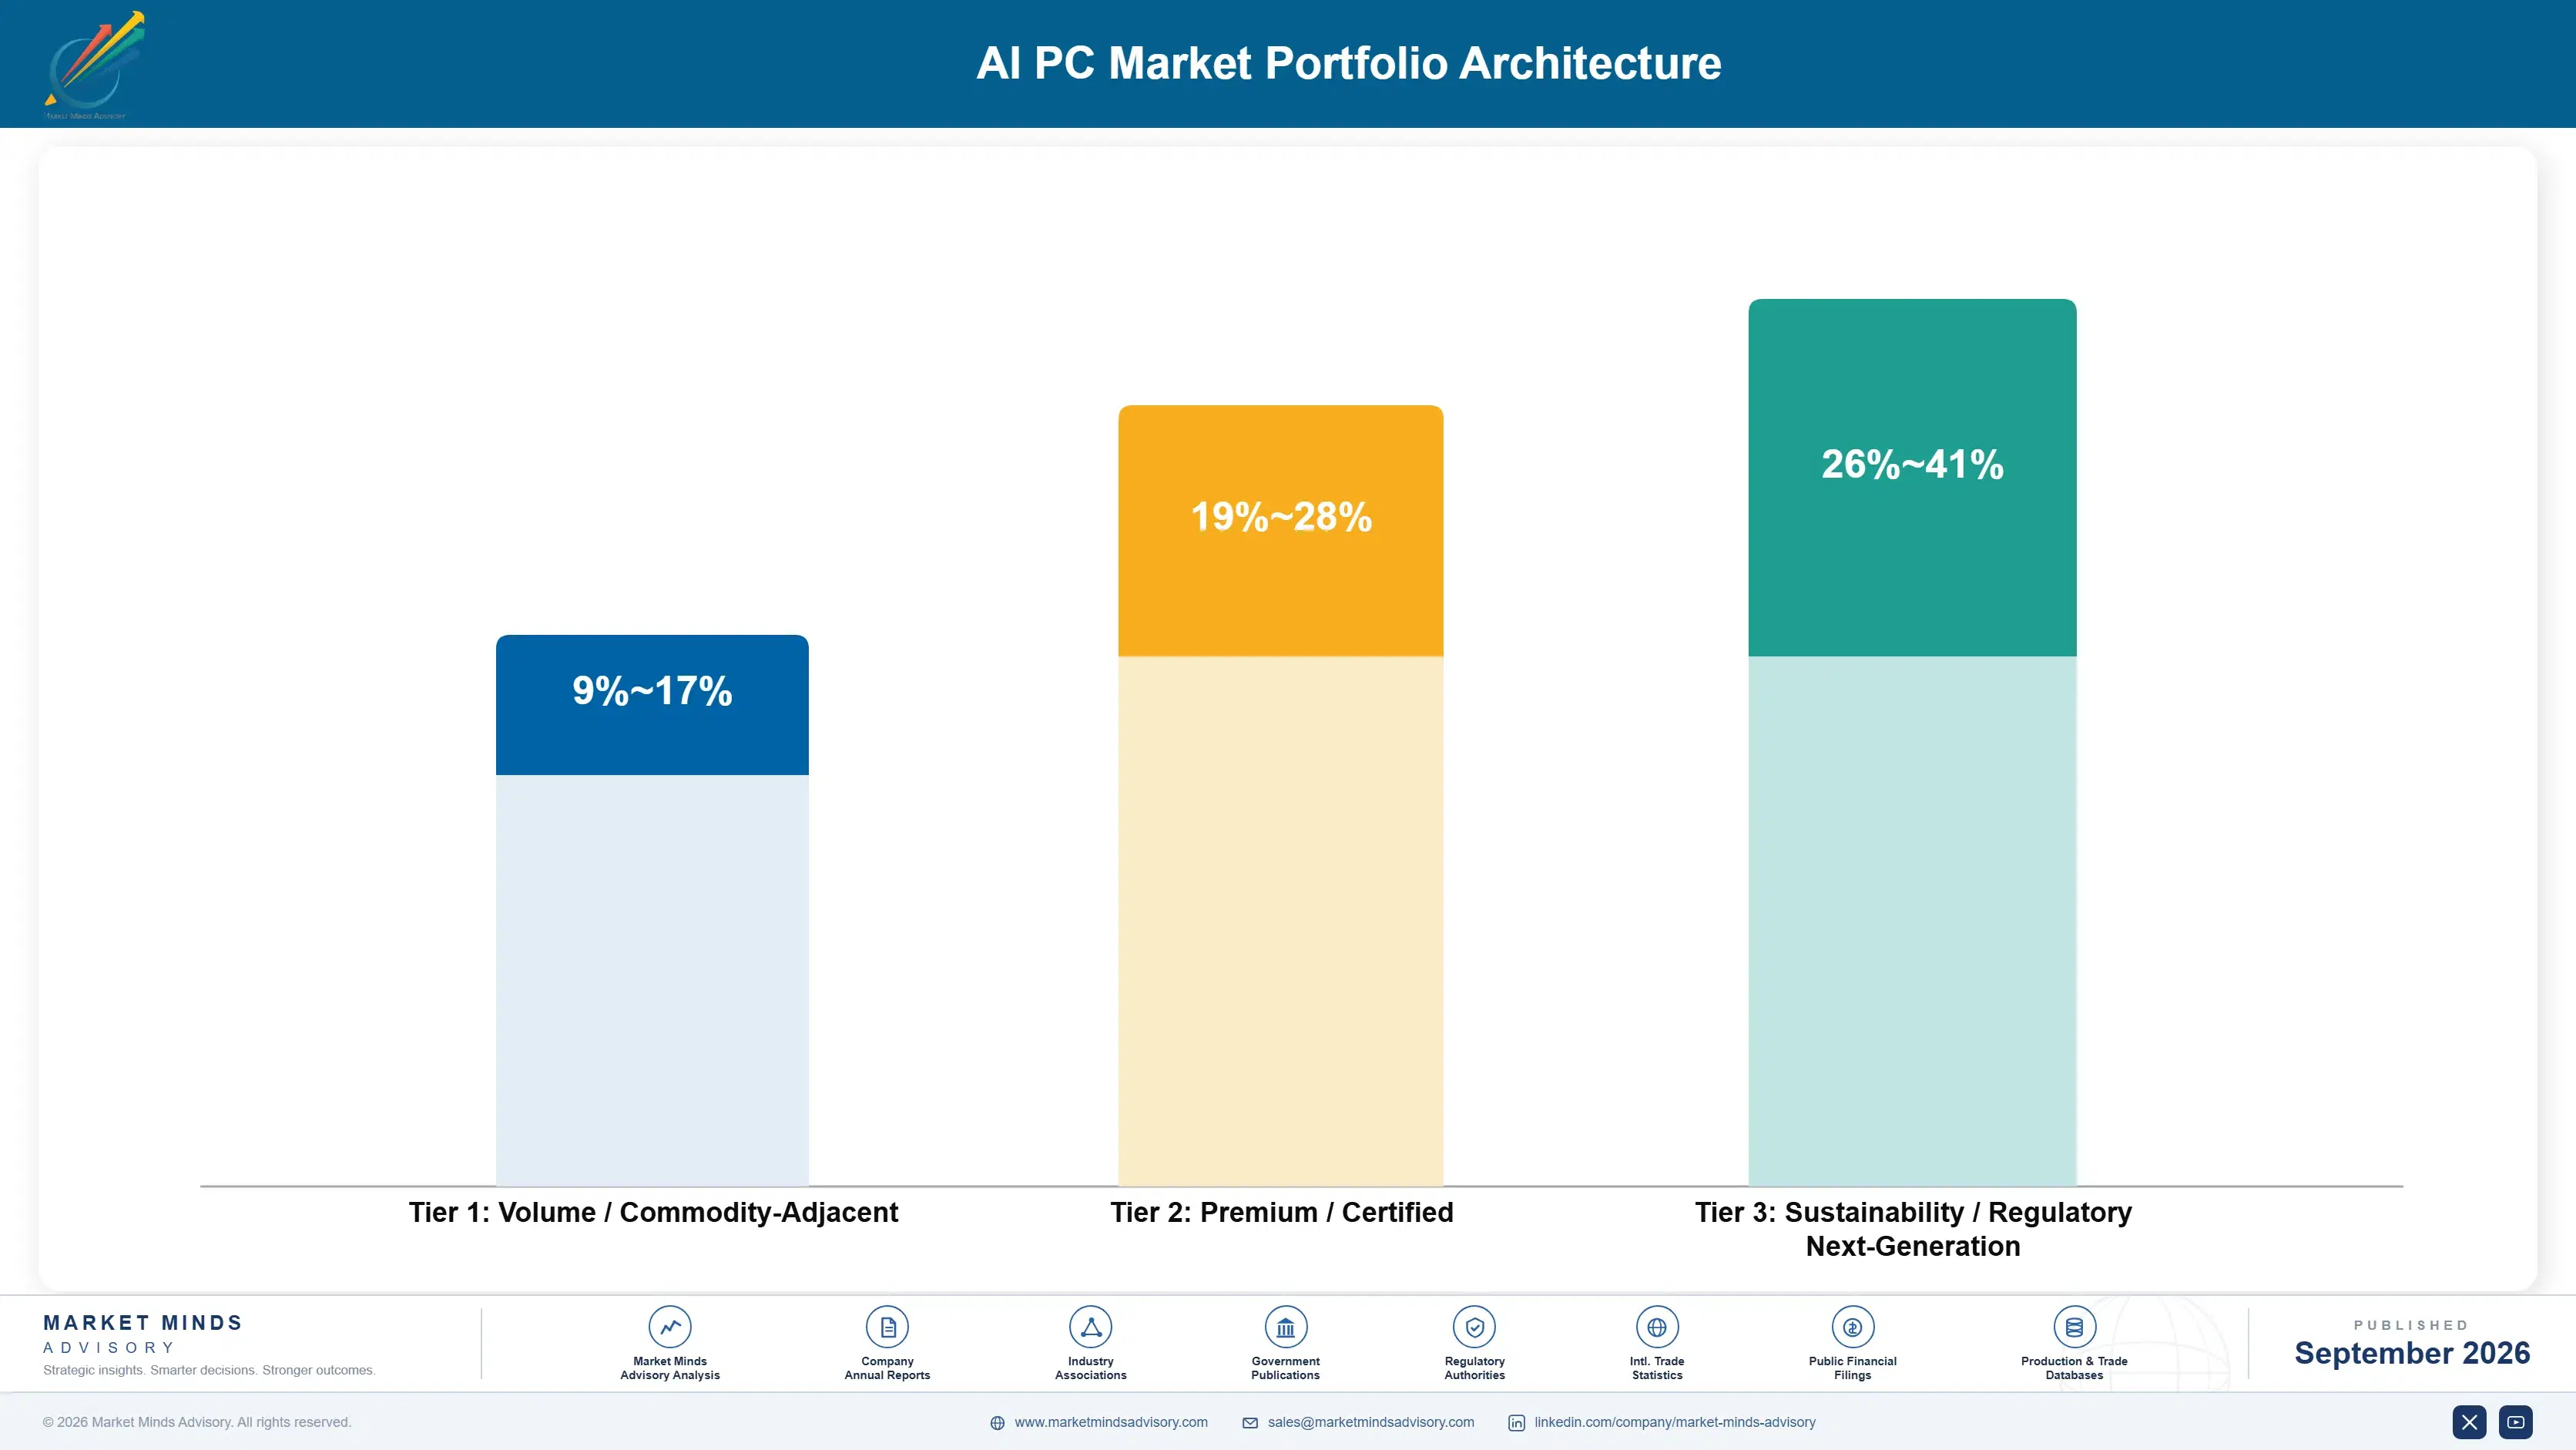
Margin architecture in personal computing has always been thin and this cycle has bent it temporarily rather than changed it. Mainstream commercial and consumer notebooks run gross margins in the low teens once channel costs are properly allocated, lifted a few points at present by the neural specification premium. Workstations, creator systems and ruggedised devices clear far higher because engineering content and certification support pricing mainstream comparison never permits.
The volume tension is between chasing a refresh that will end and building position in categories that replace independently. Deadline-driven fleet demand is large, forecastable and finite; workstation and ruggedised demand is smaller, steadier and better priced. Brands scaling cost structures against the refresh meet a trough with the wrong shape; those funding position in independently refreshing categories keep growing.

High-value revenue concentrates in commercial lifecycle services and in the specialist device categories. Both share a customer buying something other than a specification, whether a managed fleet outcome or a device certified to survive punishing conditions. Mainstream notebooks generate the volume, the channel presence and the component purchasing scale that everything else depends on, and very little of the profit.

Volume / Commodity-Adjacent

Mainstream consumer and commercial notebooks, desktops and all-in-one systems. The range reflects channel structure and whether the neural specification premium is still being captured, which varies by market and will compress. Volume here funds component purchasing scale rather than profit.
Gross Margin: 9-17%

Premium / Certified

Premium commercial notebooks with manageability, security certification and lifecycle service attach, sold to fleet buyers rather than individuals. Margin holds because the purchase includes deployment and management commitments that specification comparison does not capture. Renewal follows fleet cycles reliably.
Gross Margin: 19-28%

Sustainability / Regulatory / Next-Generation

Mobile workstations, creator systems and ruggedised field devices carrying environmental, defence or industry certification. The widest range in the portfolio, since certification depth and volume vary enormously across this group. Highest margin, lowest volume, and refreshing independently of any operating system deadline.
Gross Margin: 26-41%
ai-pc-market-portfolio-architecture-1788419577296

High-value Sub-segments and Strategic Watch-out

Ruggedised Field Device Systems

High value and high growth together, because unreliable connectivity makes local inference a genuine requirement rather than a specification line. The margin range reflects certification depth, which differs sharply between industrial and defence variants. Procurement is contractual and replacement cycles run long, which makes the revenue unusually predictable.
Gross Margin: 32-41%

Commercial Lifecycle Services

High value with moderate growth, attached to hardware during fleet replacement and renewing on its own contractual schedule afterwards. The range reflects how much deployment and asset recovery work is included. This revenue holds margin long after hardware premium erodes, which is why the refresh window matters.
Gross Margin: 28-38%

Mainstream Commercial Notebooks

The volume core of the market, currently flattered by a specification premium that will not survive universal adoption of neural silicon. It carries the channel presence and component scale everything else depends upon. Brands cannot exit it and cannot earn adequately within it, the permanent condition here.
Gross Margin: 11-19%

Silicon Supplier Value Capture

The strategic watch-out, carried at zero because it represents value moving away from brands rather than toward them. Platform specifications defined by silicon suppliers narrow differentiation and dictate configuration minimums. Brands treating this as a component relationship rather than a competitive one misread where margin goes.
Gross Margin: 0-0%

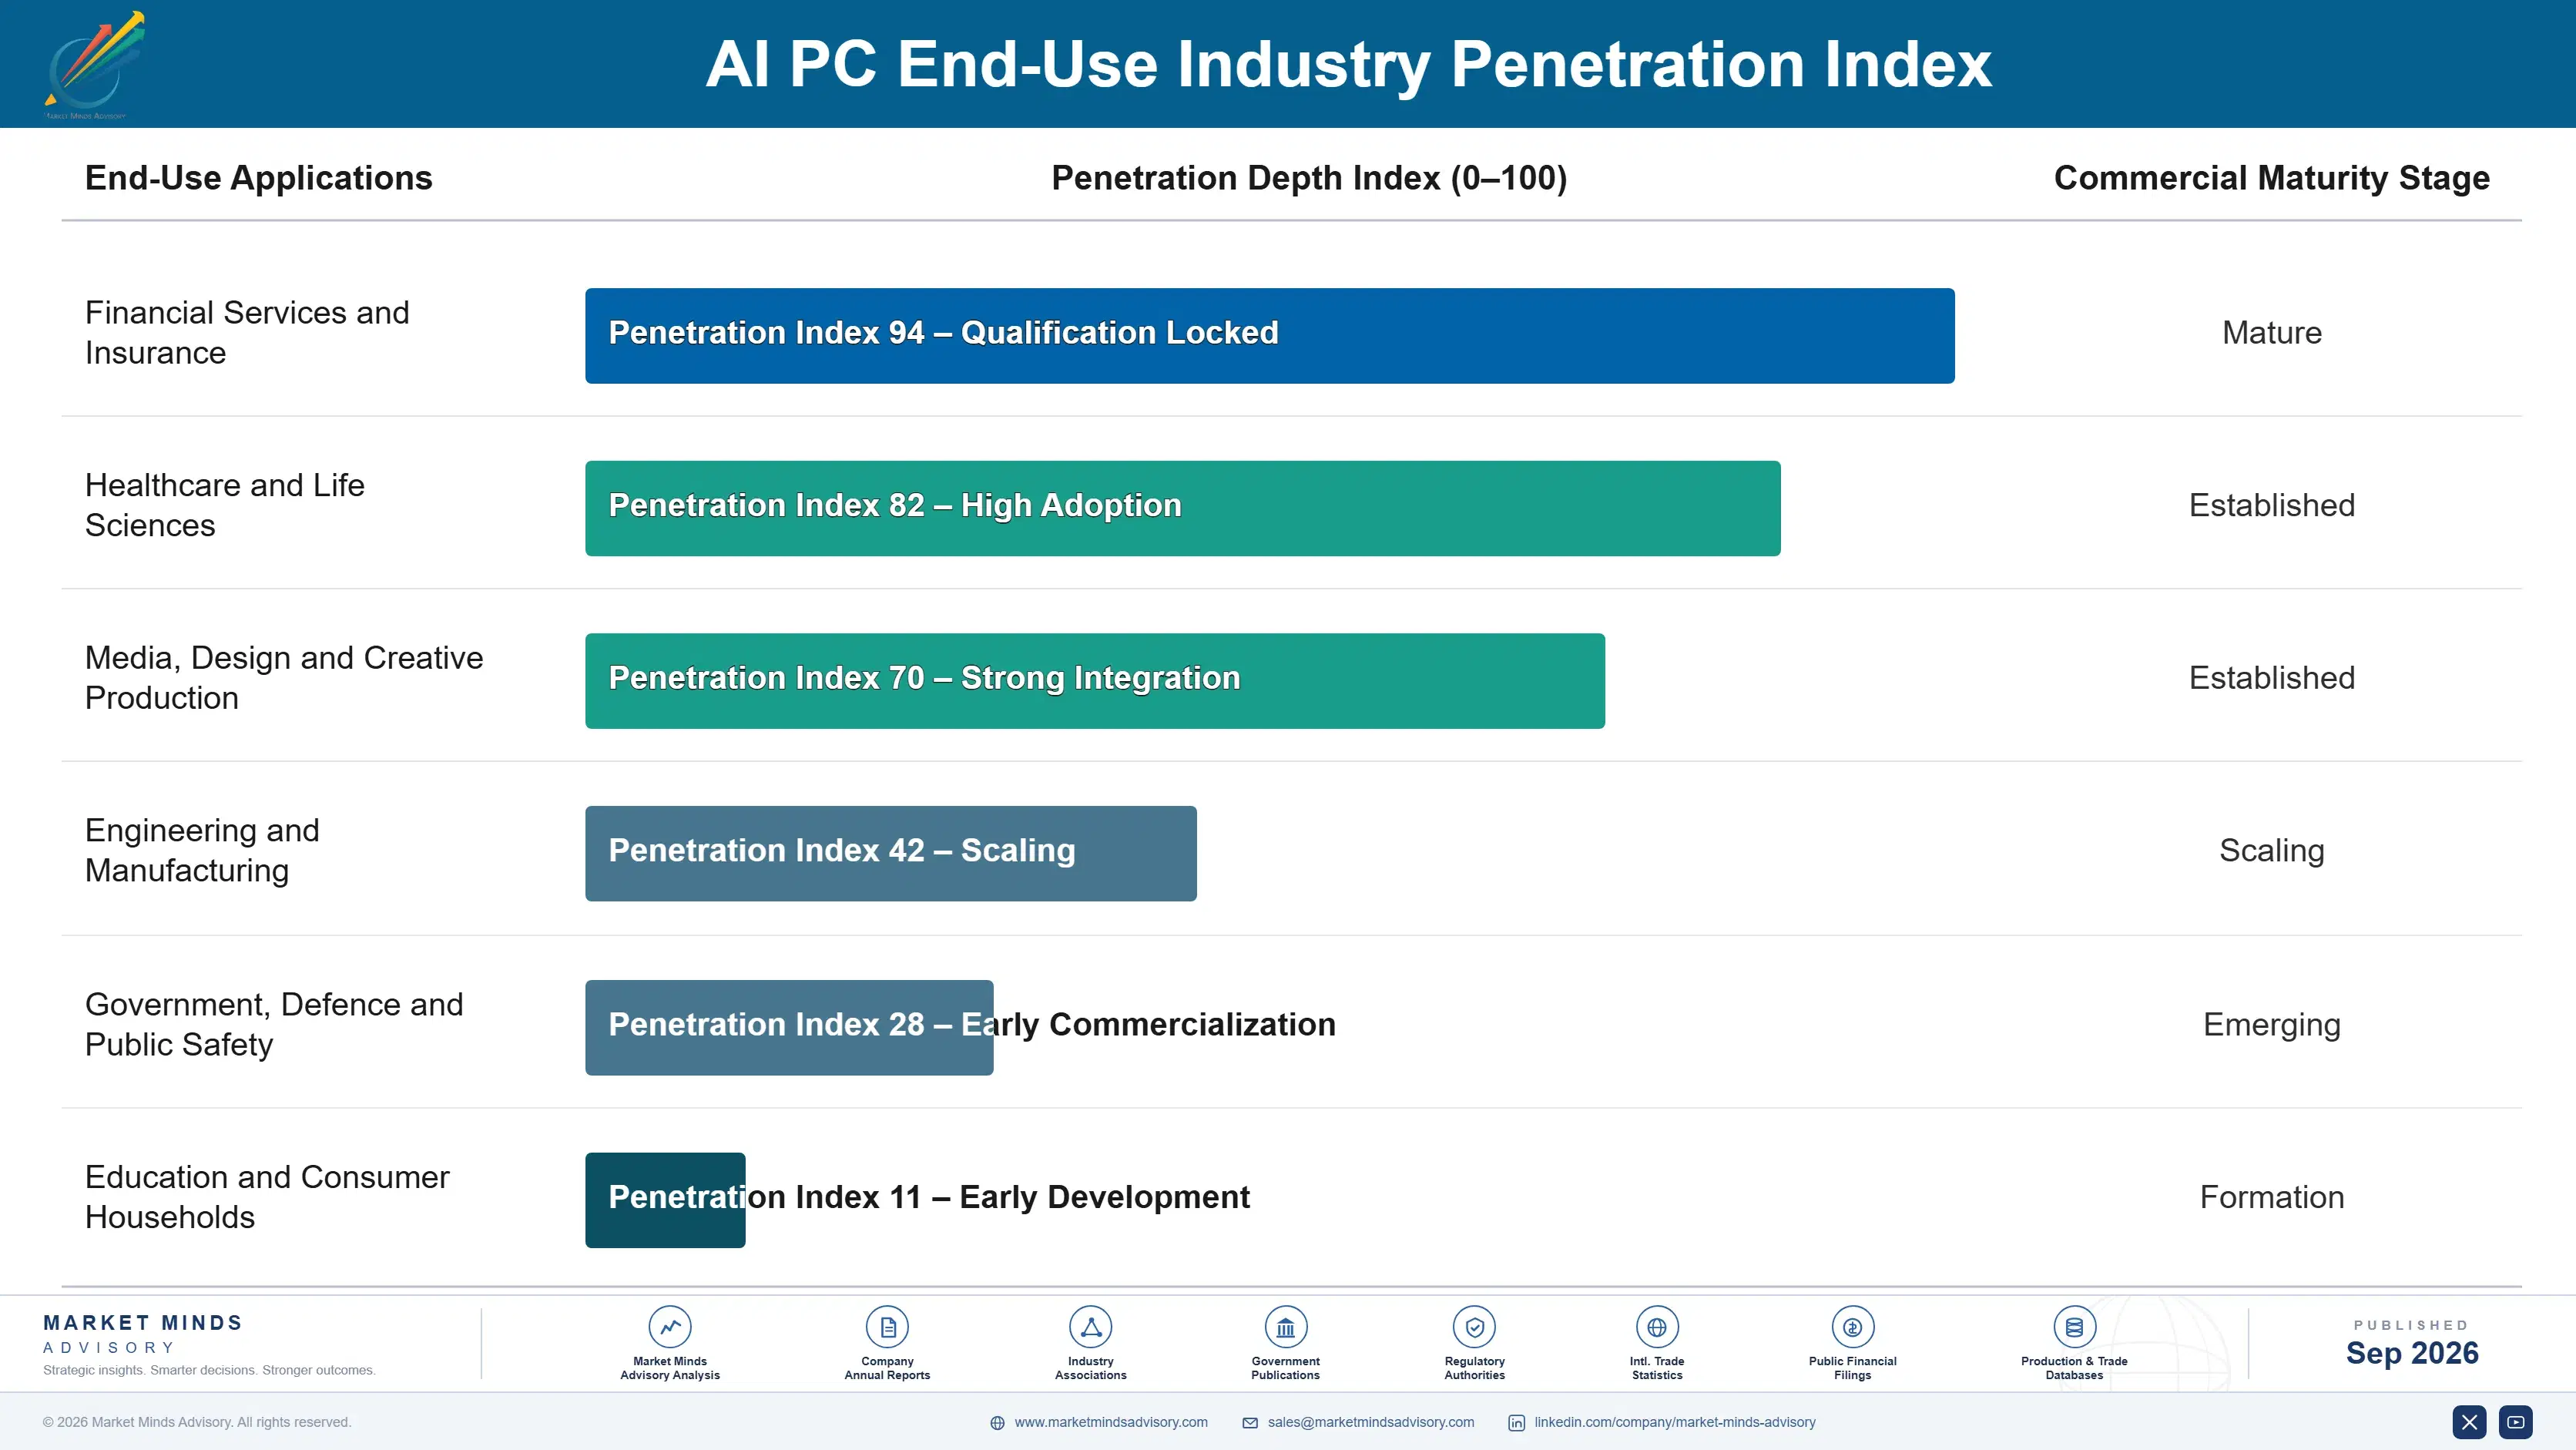
How This Demand Repeats

Personal computing revenue repeats on replacement intervals rather than on subscription, and the interval is set by security support rather than by capability. A fleet replaced against a support deadline creates no further demand for four to five years, making this cycle a pull-forward rather than a run rate. The annuity sits in lifecycle services attached during replacement, which renew contractually and survive the trough that follows.
Adoption depth varies considerably by vertical. Creative, engineering and media organisations exercise the neural silicon genuinely and specify it deliberately. Financial services and healthcare adopt for data residency rather than capability, shallow use with a durable rationale. Field service, utilities and public safety use local inference because connectivity fails, the deepest use of all. General office environments barely touch it, and education buys systems where the capability is absent by design.

The buyer profile has shifted from technology management toward information security. A decade ago fleet specification was set by a technology function balancing capability against budget on a flexible timetable. This cycle the security function set the deadline and removed that flexibility, compressing procurement and changing what wins tenders. Brands still presenting capability roadmaps address a buyer whose decision was made elsewhere.
ai-pc-market-end-use-penetration-index-1788419577781

What This Cycle Rewards

These are among the four positions where our research anticipates prominent divergence between winners and laggards over the coming forecast period. Each is grounded in the demand model, the regulatory perimeter, and the announced capacity pipeline.
01 / SILICON SPREAD CAPTURE

Bank the component advantage before universal adoption erases it

A credible third processor architecture has widened negotiating room on the largest line in the bill of materials at the same moment neural specifications support a price premium near USD 310. That spread is the largest source of incremental margin available in this category and it is temporary, since component competition always reaches the shelf price eventually. Brands converting it into fleet contracts and service attach now will hold advantage once the specification becomes universal and stops earning anything at all.
02 / REFRESH WINDOW CONVERSION

Turn deadline hardware volume into contracted lifecycle services

Around 64% of commercial units are moving against a support deadline, which compresses fleet replacement into a window that closes once the installed base has turned over. Service attach rates during forced replacement run roughly 2 times discretionary cycle levels, and that services revenue renews contractually long after any hardware premium has eroded away. Brands treating this as a volume opportunity rather than a services conversion will meet the coming trough with nothing durable at all to show for the peak.
03 / INDEPENDENT CYCLE POSITIONING

Build where replacement does not follow an operating system deadline

Mobile workstations, creator systems and ruggedised field devices all refresh on professional and contractual schedules and grow at 15.6% and 13.8% respectively while mainstream commercial demand heads steadily toward a trough around 2028. They also carry margins several times those of mainstream notebooks, because certification and thermal engineering create real barriers that volume brands will not fund. The investment required is unglamorous and slow, and it determines which brands are still growing once this particular refresh cycle has finally completed itself.
04 / COMPLIANCE BUYER ACCESS

Position local inference as a control, not a capability

On-device processing capability now appears in roughly 22% of large regulated sector tenders, specified by compliance functions that are unwilling to send client records to any external inference service. That buyer holds a genuinely defensible budget and no interest whatever in feature demonstrations, which makes it comfortably the most durable demand argument this category has yet produced. Reaching that buyer requires the security attestation and documentation work that product marketing organisations are poorly equipped to produce on their own at all.

Engagement Snapshot From the Field

A live engagement with an industry participant carrying material or product regulatory and market exposure ahead of a defining policy shift, showing how our research translates into a defensible multi-year portfolio strategy.
MARKET MINDS ADVISORY · CLIENT ENGAGEMENT SUMMARY
AI PC Producer Strategic Portfolio Review and Transition Roadmap 2026·Investment Scenario on AI PC Exposure Evaluation 2025-26
CLIENT PROFILE
A multinational insurance group operating roughly 68,000 commercial endpoints across 14 countries (client-reported, unverified by MMA), with an installed base averaging 5.1 years and a fleet standard set six years earlier. Underwriting, claims and actuarial functions had quite different device requirements that a single fleet standard had been actively suppressing for the whole of that period.
STRATEGIC CHALLENGE
Security support withdrawal forced replacement of roughly 52,000 devices within eighteen months at an estimated capital cost of USD 74 million (client-reported, unverified by MMA). Procurement wanted the cheapest compliant specification, while the data protection function had begun objecting to claims documentation being processed through external inference services under existing obligations.
MMA APPROACH
MMA separated the refresh into workload cohorts rather than treating the fleet as one population, assessing what each function actually ran and what proportion would benefit from local inference. We interviewed 19 internal stakeholders, four brands and two contract manufacturers. Vendor evaluation was scored on lifecycle service capability and supply commitment across the compressed window rather than on device specification comparison alone.
KEY FINDINGS
  1. Only 11% of the fleet ran workloads that would exercise a neural processor, concentrated in actuarial modelling and claims imaging rather than in the general office population.
  2. Data protection objections applied to roughly 9,000 claims handling seats, where local processing capability was a genuine requirement rather than a preference.
  3. Two of four shortlisted brands could not commit to supply volumes across the compressed window, which procurement scoring had not weighted at all before the assessment.
  4. Battery life improvement was the benefit field claims assessors valued most, and it had appeared nowhere in the original specification the technology function had drafted.
CLIENT PROFILE
A multinational insurance group operating roughly 68,000 commercial endpoints across 14 countries (client-reported, unverified by MMA), with an installed base averaging 5.1 years and a fleet standard set six years earlier. Underwriting, claims and actuarial functions had quite different device requirements that a single fleet standard had been actively suppressing for the whole of that period.
STRATEGIC CHALLENGE
Security support withdrawal forced replacement of roughly 52,000 devices within eighteen months at an estimated capital cost of USD 74 million (client-reported, unverified by MMA). Procurement wanted the cheapest compliant specification, while the data protection function had begun objecting to claims documentation being processed through external inference services under existing obligations.
MMA APPROACH
MMA separated the refresh into workload cohorts rather than treating the fleet as one population, assessing what each function actually ran and what proportion would benefit from local inference. We interviewed 19 internal stakeholders, four brands and two contract manufacturers. Vendor evaluation was scored on lifecycle service capability and supply commitment across the compressed window rather than on device specification comparison alone.
KEY FINDINGS
  1. Only 11% of the fleet ran workloads that would exercise a neural processor, concentrated in actuarial modelling and claims imaging rather than in the general office population.
  2. Data protection objections applied to roughly 9,000 claims handling seats, where local processing capability was a genuine requirement rather than a preference.
  3. Two of four shortlisted brands could not commit to supply volumes across the compressed window, which procurement scoring had not weighted at all before the assessment.
  4. Battery life improvement was the benefit field claims assessors valued most, and it had appeared nowhere in the original specification the technology function had drafted.
RECOMMENDED STRATEGY
Phase 1: Split the fleet standard into three specifications by workload cohort rather than replacing 52,000 devices against a single specification set six years earlier. Phase 2: Weight supply commitment across the eighteen month window heavily in vendor scoring, since delivery failure carries security exposure that price advantage cannot offset. Phase 3: Attach lifecycle and asset recovery services during the replacement window, when the negotiating position is strongest and the whole fleet is moving anyway.
OUTCOME
The group completed replacement within the support window at roughly USD 61 million against the USD 74 million originally budgeted (client-reported, unverified by MMA), with neural silicon specified on 20,000 devices rather than the full fleet. Lifecycle services were contracted for five years alongside the hardware.

Frequently Asked Questions

Foundational context covering the market sizes, CAGR, scope, country, region and competition that inform every finding below. This section is provided to cover basics and most often pre-purchase conversations, answered from the MMA Primary Research Dataset.

What is the current size of the AI PC Market?

The market was worth USD 92.0 billion in 2025 and reaches USD 101.6 billion in 2026. Roughly 64% of commercial units move against an operating system support deadline rather than any capability argument.

How large will the AI PC Market be by 2036?

MMA forecasts USD 273.3 billion by 2036, an expansion of 2.69 times over the forecast period. That represents USD 171.7 billion of incremental annual revenue against 2026.

What is the CAGR for the AI PC Market 2026 to 2036?

The base case is 10.4% compound annual growth, with a bull case at 11.6% and a bear case at 9.2%. Whether a compelling local application emerges separates the three scenarios.

Which segment is growing fastest?

Mobile workstations and creator systems grow at 15.6%, half again the market rate of 10.4%. These are the workloads where on-device inference produces measurable time savings rather than a specification line.

Who are the major companies in the AI PC Market?

Lenovo, HP, Dell Technologies, Apple and ASUS lead on measured shipment revenue at brand level. Together they hold roughly 78%, a concentration that has barely moved in a decade.

Which country is growing fastest?

India grows fastest at 16.8%, driven by enterprise and capability centre expansion adding commercial seats, and by domestic manufacturing incentives that have shortened supply and reduced landed cost.

Report Segmentation Architecture

The full report scope spans multiple orthogonal segmentation dimensions, with cross-tabulated demand data provided for each dimension pair. Coverage extends further to regional breakdowns, trend trajectories, and the competitive detail needed to support segment-level decision-making.

By Primary Market Dimension

  • Premium Consumer Notebooks
  • Commercial and Enterprise Notebooks
  • Mobile Workstations and Creator Systems
  • Desktop and All-in-One Systems
  • Detachable and Convertible Tablets
  • Ruggedised and Industrial Field Systems

By End-Use Industry

  • Financial Services and Insurance
  • Healthcare and Life Sciences
  • Media, Design and Creative Production
  • Engineering and Manufacturing
  • Government, Defence and Public Safety
  • Education and Consumer Households

By Commercial Dimension

  • Direct Enterprise Fleet Contracts
  • Value Added Reseller Channel
  • Retail and Online Consumer Sales
  • Public Sector Framework Agreements
  • Device as a Service Subscriptions
  • Lifecycle and Managed Device Services

By Region

  • East Asia
  • North America
  • Western Europe
  • South Asia and Pacific
  • Latin America
  • Middle East and Africa
  • Eastern Europe

Scope, Methodology, and Coverage

Every figure in this report is reproducible from documented input assumptions. The scope below maps the historical period, the forecast horizon, the segmentation dimensions, and the countries covered, alongside the underlying primary and qualitative methodology.
Historical Period
2020 to 2025
Forecast Period
2026 to 2036
Base Year
2025 (USD billions; MMA Primary Research Dataset, September 2026)
Market Definition
This market covers personal computers shipped with a dedicated neural processing unit capable of on-device machine learning inference, spanning premium consumer notebooks, commercial and enterprise notebooks, mobile workstations and creator systems, desktops and all-in-one systems, detachable and convertible tablets, and ruggedised industrial field devices. Revenue is measured as system shipment value at brand level, including attributable lifecycle services sold with the hardware. Servers, smartphones, tablets without keyboard-first designs, standalone accelerator cards, component-level silicon sales and cloud-delivered artificial intelligence services are excluded.
Quantitative Units
USD billions, system shipment revenue at brand level
Segmentation Dimensions
Device class, end-use industry, commercial channel, region
Regions Covered
East Asia, North America, Western Europe, South Asia and Pacific, Latin America, Middle East and Africa, Eastern Europe
Countries Covered
United States, Canada, Germany, United Kingdom, France, Italy, Spain, Netherlands, Sweden, Poland, Czechia, Romania, China, Japan, South Korea, Taiwan, India, Australia, Vietnam, Thailand, Indonesia, Brazil, Mexico, Argentina, United Arab Emirates, Saudi Arabia, South Africa
Key Companies Profiled
Lenovo, HP, Dell Technologies, Apple, ASUS, Acer, Samsung Electronics, Microsoft, Huawei, Honor, Dynabook, Fujitsu, NEC, LG Electronics, MSI, Framework Computer, Getac, Panasonic, Xiaomi, Razer
Quantitative Methodology
Primary survey, n=3,800 respondents, Q4 2025, six countries; demand-side model with trade association cross-validation
Qualitative Methodology
47 expert interviews, Q4 2025; applied to validate demand model assumptions, identify emerging dynamics, and assess competitive positioning
Report Format
PDF and XLSX data workbook (Word format preview document)
Publisher
Market Minds Advisory
Report Code
MMA-2026-TEC-791
Published
September 2026
Contact
sales@marketmindsadvisory.com | www.marketmindsadvisory.com

Purchase the full AI PC Market Report (2026 to 2036).

The full MMA report examines why neural silicon arrived ahead of the software that would justify it, and what actually moves these units in the absence of a compelling local application. It sizes the market to 2036 across six device classes, seven regions and 27 countries, with segment growth rates and regional demand mechanisms set out in full. Competitive analysis covers 20 brands assessed on measured shipment revenue at brand level, including moat and risk assessment for the two leaders. The report quantifies bill of materials structure, component cost exposure and margin architecture across three portfolio tiers. It closes with four strategic verdicts and an anonymised insurance group fleet engagement.
Six device classes sized to 2036
Seven regions with demand mechanism analysis
Twenty brands on consistent shipment revenue basis
Bill of materials and component cost benchmarks
Margin architecture across three portfolio tiers
Anonymised insurance group fleet refresh engagement

Built For The People Who Decide

From boardroom strategy to bench-side execution, this report is read cover-to-cover by leaders shaping the next decade of their industry, turning demand scenarios, market dynamics and valuation benchmarks into decisions.
CXOs/ Presidents/ VPs/ Managers
M&A and Corporate Development
Strategy Teams and R&D Heads
Procurement and Product Directors
Regulatory and Compliance Leaders
Investor Relations and Equity Analysts