Market Minds Advisory
AI-Based Data Observability Software Market

AI-Based Data Observability Software Market: AI-Based Data Observability Software Market. Autonomous Anomaly Detection Reshapes Data Reliability

Enterprise data teams drowning in pipeline complexity are shifting from manual quality checks toward AI-driven observability platforms that autonomously detect anomalies and trace root causes across sprawling data infrastructure before business impact occurs.

Lead Analyst

Published

September 2026

Make Smarter Decisions with Customized Research Insights

Request a free sample report and evaluate market opportunities, growth trends, and competitive dynamics relevant to your business needs.

2025 MARKET VALUE$1.9BMarket Size 2025
2036 FORECAST VALUE$10.2BBase Case , 2026 to 2036
CAGR 2026 TO 203616.5 %Bull 17.8% / Bear 15.2%
INCREMENTAL OPPORTUNITY$8.0BNet 10- year value creation
EXPANSION MULTIPLE4.61x2036 value over 2026 base
Strategic Levers
M&A Pipeline
Regional Outlook
Country Rankings
Competitive Intelligence
Segmental Deep-dive
Call-Us : 91 93563 13602

Executive Snapshot and Market Trajectory.

Enterprise data teams are abandoning manual quality checks and rule-based monitoring for AI-driven platforms that autonomously detect pipeline anomalies before they cascade into broken dashboards and executive reports across every business function relying on accurate, trustworthy data every single business day of operations.
Autonomous root cause analysis is the fastest-growing capability as machine learning models mature enough to trace failures across complex multi-source data pipelines without requiring engineers to manually investigate every single generated alert individually and repeatedly throughout the day. Financial services and technology sector data teams drive the largest share of current adoption given their sprawling pipeline complexity and genuinely low tolerance for undetected data quality failures reaching production systems and downstream business reports.
Competitive intensity is rising steadily as established data quality vendors race against AI-native observability startups building anomaly detection from the ground up around modern cloud data warehouse architectures serving enterprise clients directly and at meaningful scale across every industry vertical. Vendor consolidation pressure is building as hyperscale cloud providers increasingly bundle basic observability capability into broader data platform offerings, threatening standalone vendor differentiation across every enterprise customer segment served.
Market Definition
This market covers software platforms that autonomously monitor data pipeline health, detect anomalies, and trace root causes across modern data infrastructure using machine learning and AI techniques. It excludes traditional rule-based data quality tools without AI-driven anomaly detection and general-purpose application performance monitoring software.
Base Year Value
$1.9B in 2025 (MMA Primary Research Dataset, September 2026)
Forecast Period
2026 to 2036, eleven discrete annual values
CAGR
16.5% base case. Bull 17.8%. Bear 15.2%.
Fastest Growth Segment
Autonomous Root Cause Analysis Software: 24.0% CAGR
Fastest Growth Country
India: 22.0% CAGR
Fastest Growth Region
South Asia and Pacific: 18.5% CAGR
Largest Region
North America: 32% of 2025 global value
Market Leaders
Monte Carlo, Datadog, Bigeye, Acceldata, Databand (IBM)
Primary Survey
n=3,800 procurement and R&D decision-makers, Q4 2025, six countries
Methodology
Demand-side build-up, cross-validated against public data, 47 expert interviews

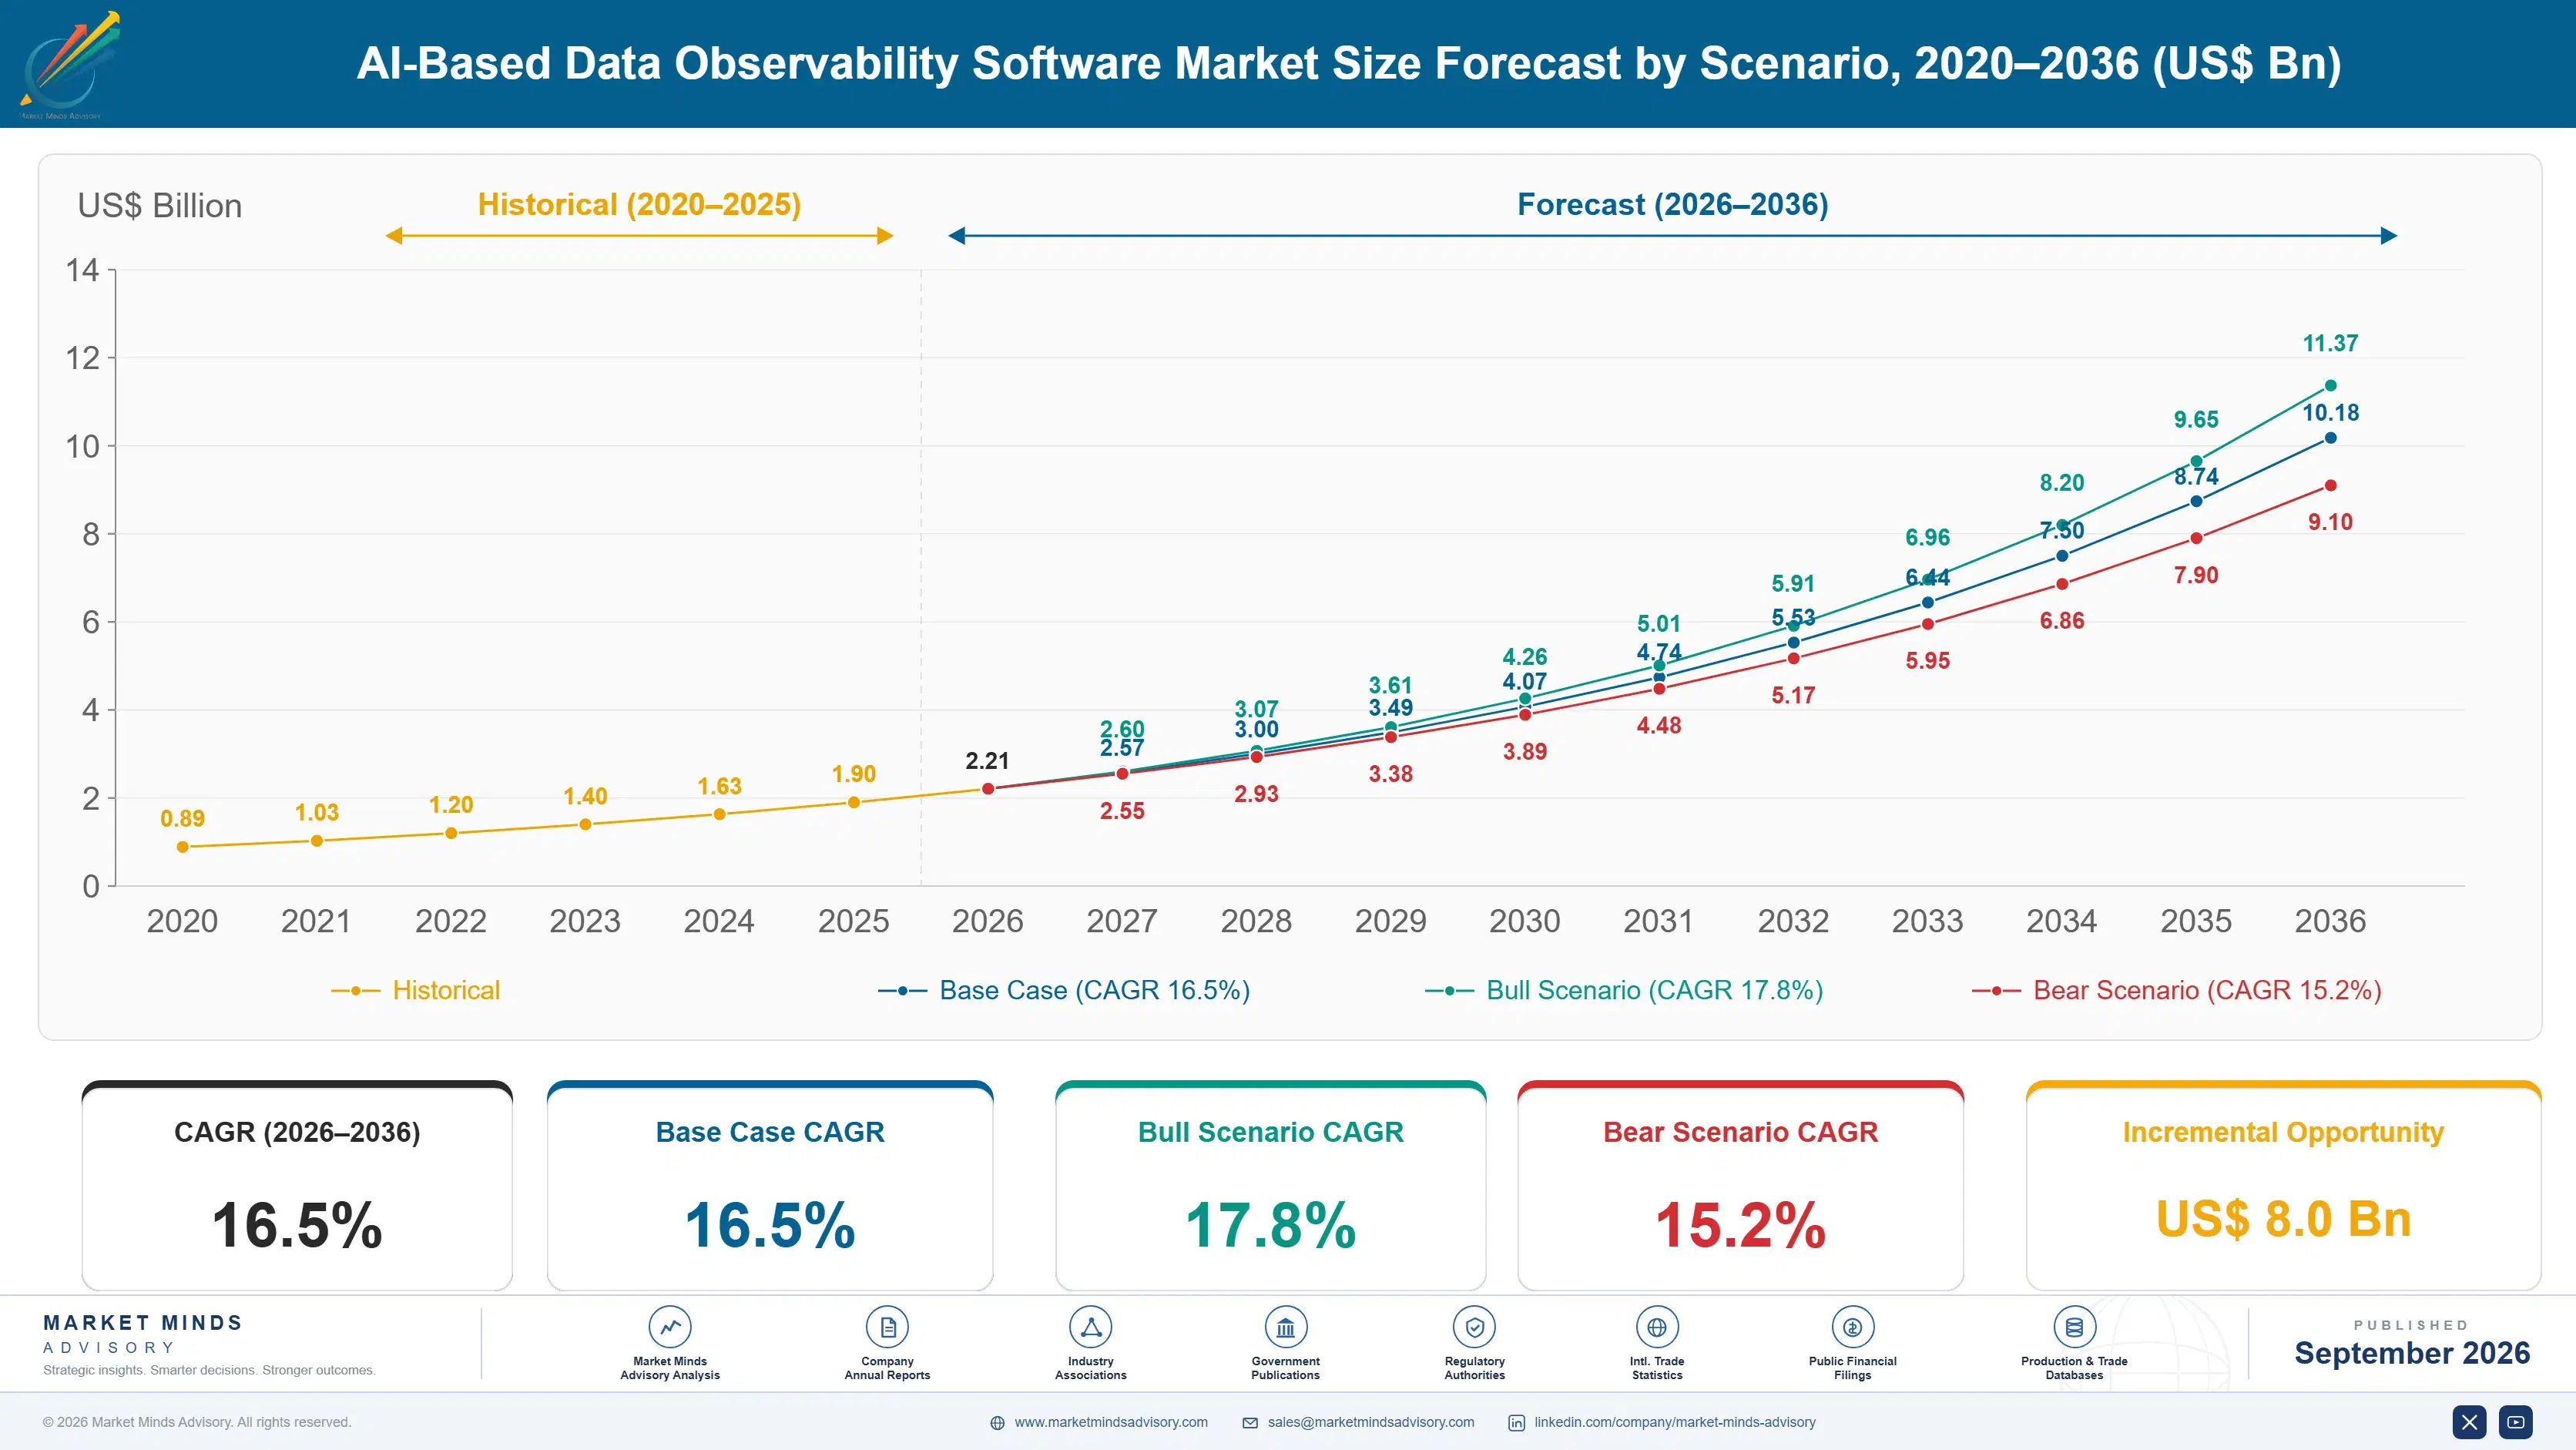
AI-Based Data Observability Software Market Forecast Scenarios

ai-based-data-observability-software-market-size-forecast-scenario-1788451883785
Between 2020 and 2025 data observability software grew from a niche category into mainstream enterprise infrastructure as data pipeline complexity exploded alongside cloud data warehouse adoption across nearly every industry sector, with AI-driven anomaly detection capability accelerating meaningfully after 2023 as large language models matured enough for genuinely useful root cause analysis across production data pipelines nationwide.
The base case assumes continued enterprise data pipeline complexity growth driving sustained observability investment across every industry vertical and company size, sustained vendor investment in autonomous root cause analysis capability reducing manual engineer investigation time considerably, and expanding adoption beyond financial services and technology sectors into broader enterprise verticals nationwide, three commercial mechanisms reinforcing rapid growth across the entire forecast window through 2036 across every major industry category and geography.
The bull case centers on generative AI dramatically accelerating autonomous remediation capability, letting platforms not just detect but automatically fix common pipeline failures considerably faster than currently modeled across most enterprise accounts. The bear risk is hyperscale cloud providers bundling basic observability into core platform offerings, undercutting standalone vendor pricing power and delaying the premium tier revenue growth vendors have already forecasted internally.

Autonomous Detection Displaces Manual Data Checks

Enterprise data teams are replacing manual quality checks and static rule-based monitoring with AI platforms that learn normal pipeline behavior and flag deviations automatically without constant human tuning or manual configuration overhead. This shift reflects growing recognition that manual monitoring cannot scale to match the sheer volume and velocity of modern cloud data pipeline architectures across every enterprise account and data team.
AVERAGE CONTRACT TERM2.5 yearsTypical enterprise subscription commitment length across the industry
AUTONOMOUS DETECTION COVERAGE58%Portion of monitored pipelines covered by AI detection currently
MEAN TIME TO DETECTION12 minutesAverage time between anomaly occurrence and platform alert generation
FALSE POSITIVE RATE8%Typical alert accuracy rate across leading platform vendors currently
CLOUD-NATIVE DEPLOYMENT SHARE74%Portion of deployments running on cloud-native infrastructure today
ANNUAL CONTRACT RENEWAL RATE88%Enterprise client renewal rate averaged across the industry currently
Autonomous root cause analysis is emerging as the category's defining capability, letting platforms trace failures across complex multi-source pipelines without requiring engineers to manually correlate logs and metrics across dozens of interconnected systems and services simultaneously and continuously. This capability reduces mean time to resolution meaningfully compared to manual investigation approaches most engineering teams previously relied upon before adopting these platforms.
Hyperscale cloud providers bundling basic observability capability into broader data platform offerings represent the most consequential competitive threat facing standalone vendors, since bundled offerings undercut standalone pricing even when detection sophistication remains meaningfully lower and less accurate overall and across the board. Vendors are responding by pushing deeper into autonomous remediation capability that bundled offerings cannot easily replicate at any meaningful scale.
"The vendors still selling dashboards full of manual thresholds are competing in a category that no longer exists. Engineers do not want another alert to triage, they want the platform to tell them what actually broke and why."
Head of Data Infrastructure Practice · MMA AI-Driven Data Quality Monitoring and Pipeline Observability Software Practice · September 2026

Market Trends

Autonomous Root Cause Analysis Becomes Table Stakes

Vendors are racing to embed autonomous root cause analysis capability directly into core platforms, since enterprise buyers increasingly refuse to purchase observability tools that only detect anomalies without explaining underlying causes. This capability shift reflects genuine engineering team frustration with alert fatigue from detection-only tools generating notifications without actionable next steps for resolution. Autonomous detection now covers roughly 58 percent of monitored pipelines across leading platform deployments, up considerably from a much smaller share just two years earlier as large language models matured enough to generate genuinely useful causal explanations across complex multi-source pipeline architectures spanning dozens of interconnected systems.
Market Impact: Cuts detection time to 12 min
Hyperscale Bundling Pressures Standalone Vendor Pricing

Cloud hyperscale providers are increasingly bundling basic data observability capability directly into their core data platform and warehouse offerings, creating meaningful pricing pressure on standalone observability vendors competing for the same enterprise budget line. This bundling trend forces standalone vendors to differentiate on detection sophistication and autonomous remediation capability that bundled offerings cannot easily replicate at comparable engineering investment levels. Roughly 74 percent of new observability deployments now run on cloud-native infrastructure, reflecting how thoroughly cloud migration has reshaped the competitive landscape and made bundling a genuine strategic threat that standalone vendors must actively address through continued innovation investment.
Market Impact: Achieves 8% average false positive rate

Market Opportunities and Growth Drivers

Pipeline Complexity Growth Outpaces Manual Monitoring Capacity

Enterprise data pipelines have grown dramatically more complex as organizations adopt dozens of interconnected data sources, transformation tools, and downstream applications, making manual quality monitoring practically impossible at meaningful scale. Data engineering teams simply cannot manually verify every transformation and join across the volume of pipelines modern enterprises now operate daily across every business function. Mean time to detection for anomalies now averages roughly 12 minutes using AI-driven platforms, a dramatic improvement over the hours or days manual monitoring approaches typically required before automation matured enough to handle this scale reliably.
Market Impact: Adds 15% pricing pressure on deals

Alert Fatigue Drives Demand For Accurate Detection

Data engineering teams overwhelmed by false positive alerts from legacy rule-based monitoring tools are demanding platforms with genuinely low false positive rates that do not erode trust in the monitoring system itself over time. This shift toward accuracy-focused evaluation is reshaping vendor competitive positioning, since buyers increasingly test false positive rates during evaluation rather than relying solely on vendor marketing claims. Leading platforms now achieve false positive rates near 8 percent, a benchmark providers increasingly cite directly in enterprise procurement conversations to win contracts against less accurate legacy monitoring competitors.
Market Impact: Extends deployment timelines to 6 months

Market Restraints and Challenges

Hyperscale Bundling Threatens Standalone Vendor Pricing

Cloud hyperscale providers increasingly bundle basic observability capability directly into core data platform offerings, letting enterprise buyers access adequate monitoring without paying for a standalone vendor's more sophisticated detection capability. The root cause traces to hyperscalers viewing observability as a platform retention feature rather than a standalone revenue line, letting them price it far below what dedicated vendors need to sustain engineering investment. Commercial impact shows up as roughly 15 percent pricing pressure on standalone vendor deals competing directly against bundled alternatives. Vendors mitigate this by pushing deeper into autonomous remediation capability that bundled offerings genuinely cannot replicate.
Market Impact: Reaches 58% autonomous detection pipeline coverage

Integration Complexity Slows Enterprise Deployment Timelines

Enterprise data environments span dozens of disparate tools and platforms accumulated over years, making comprehensive observability platform integration a genuinely complex, multi-month undertaking for most large organizations pursuing full deployment. The root cause is fragmented data infrastructure built incrementally without centralized architecture planning, leaving observability vendors to integrate against inconsistent data formats and access patterns across every connected system encountered. Commercial impact extends average enterprise deployment timelines to roughly six months for the most complex environments. Vendors mitigate this by building pre-built connectors for the most common enterprise data platform combinations encountered.
Market Impact: Reaches 74% cloud-native deployment share
3 additional market trends, 4 additional growth drivers, and 3 additional restraints and challenges are covered in the full report. Contact sales@marketmindsadvisory.com to access the complete intelligence.

Segment CAGR and Growth Architecture

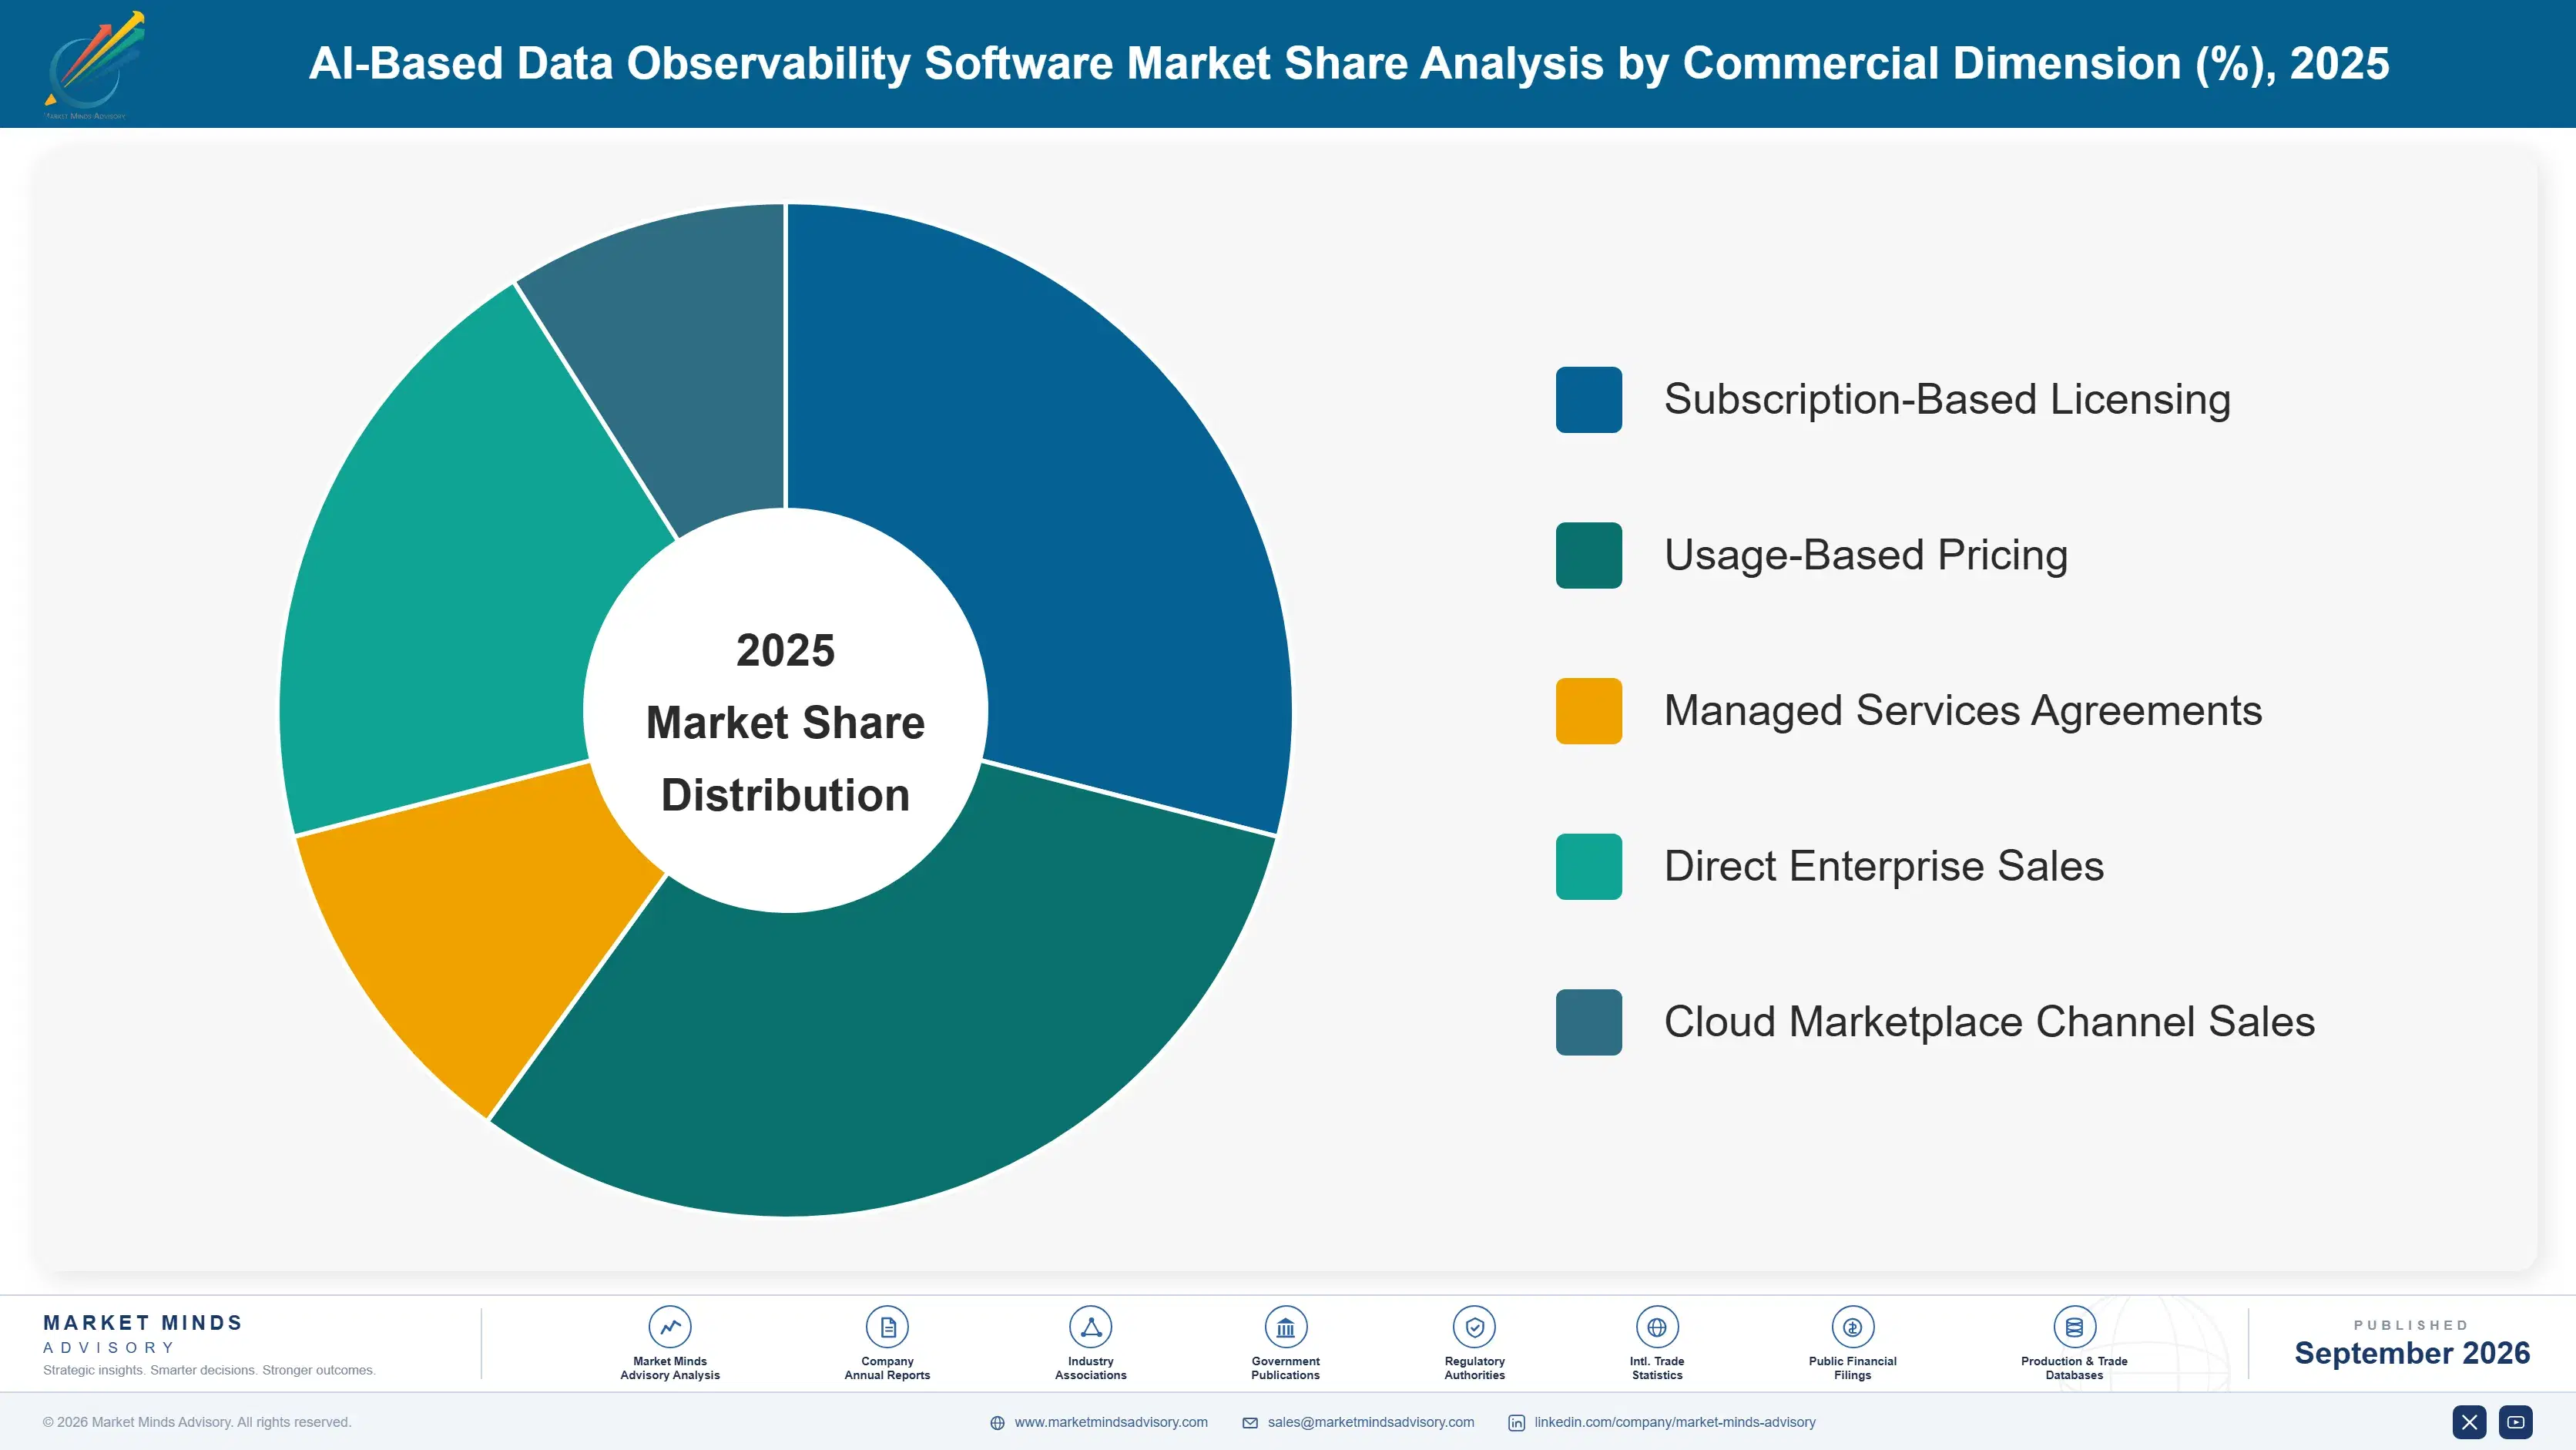
The market breaks into six capability-based categories spanning anomaly detection, autonomous root cause analysis, data lineage tracking, schema change monitoring, freshness and volume monitoring, and automated remediation software across enterprise data platforms. Each category increasingly integrates AI-driven pattern recognition rather than static rule-based thresholds, with adoption depth varying by pipeline complexity and industry vertical served.
ai-based-data-observability-software-market-market-share-analysis-1788451884326

Autonomous Root Cause Analysis Software

This segment covers AI-driven software that automatically traces data pipeline failures back to their originating cause, eliminating the manual log correlation and system investigation work engineers previously performed by hand across dozens of interconnected systems and services every single day. Adoption is accelerating as large language models mature enough to generate genuinely useful causal explanations rather than simply flagging anomalies without context or resolution guidance attached to them. Growth here outpaces every other segment as enterprise buyers increasingly refuse to purchase detection-only tools that generate alert fatigue without actionable next steps, and as vendors race to embed this capability before losing accounts to competitors offering demonstrably faster time to resolution.
CAGR 24.0%

Data Lineage Tracking Software

Data lineage tracking software maps how data flows and transforms across pipelines, letting engineers understand exactly which downstream systems, dashboards, and reports depend on any given upstream data source before making changes to it directly, confidently, and safely every time a modification is needed. This segment benefits from growing regulatory requirements around data provenance and audit trail documentation in regulated industries like financial services and healthcare providers nationwide today. Enterprise buyers increasingly evaluate vendors on lineage granularity and automation depth rather than manual documentation completeness, pushing vendors to invest in automated lineage discovery technology that scales across increasingly complex, sprawling enterprise data architectures spanning dozens of interconnected platforms and systems.
CAGR 19.5%
Full segment breakdown across 6 segments available in the complete report.

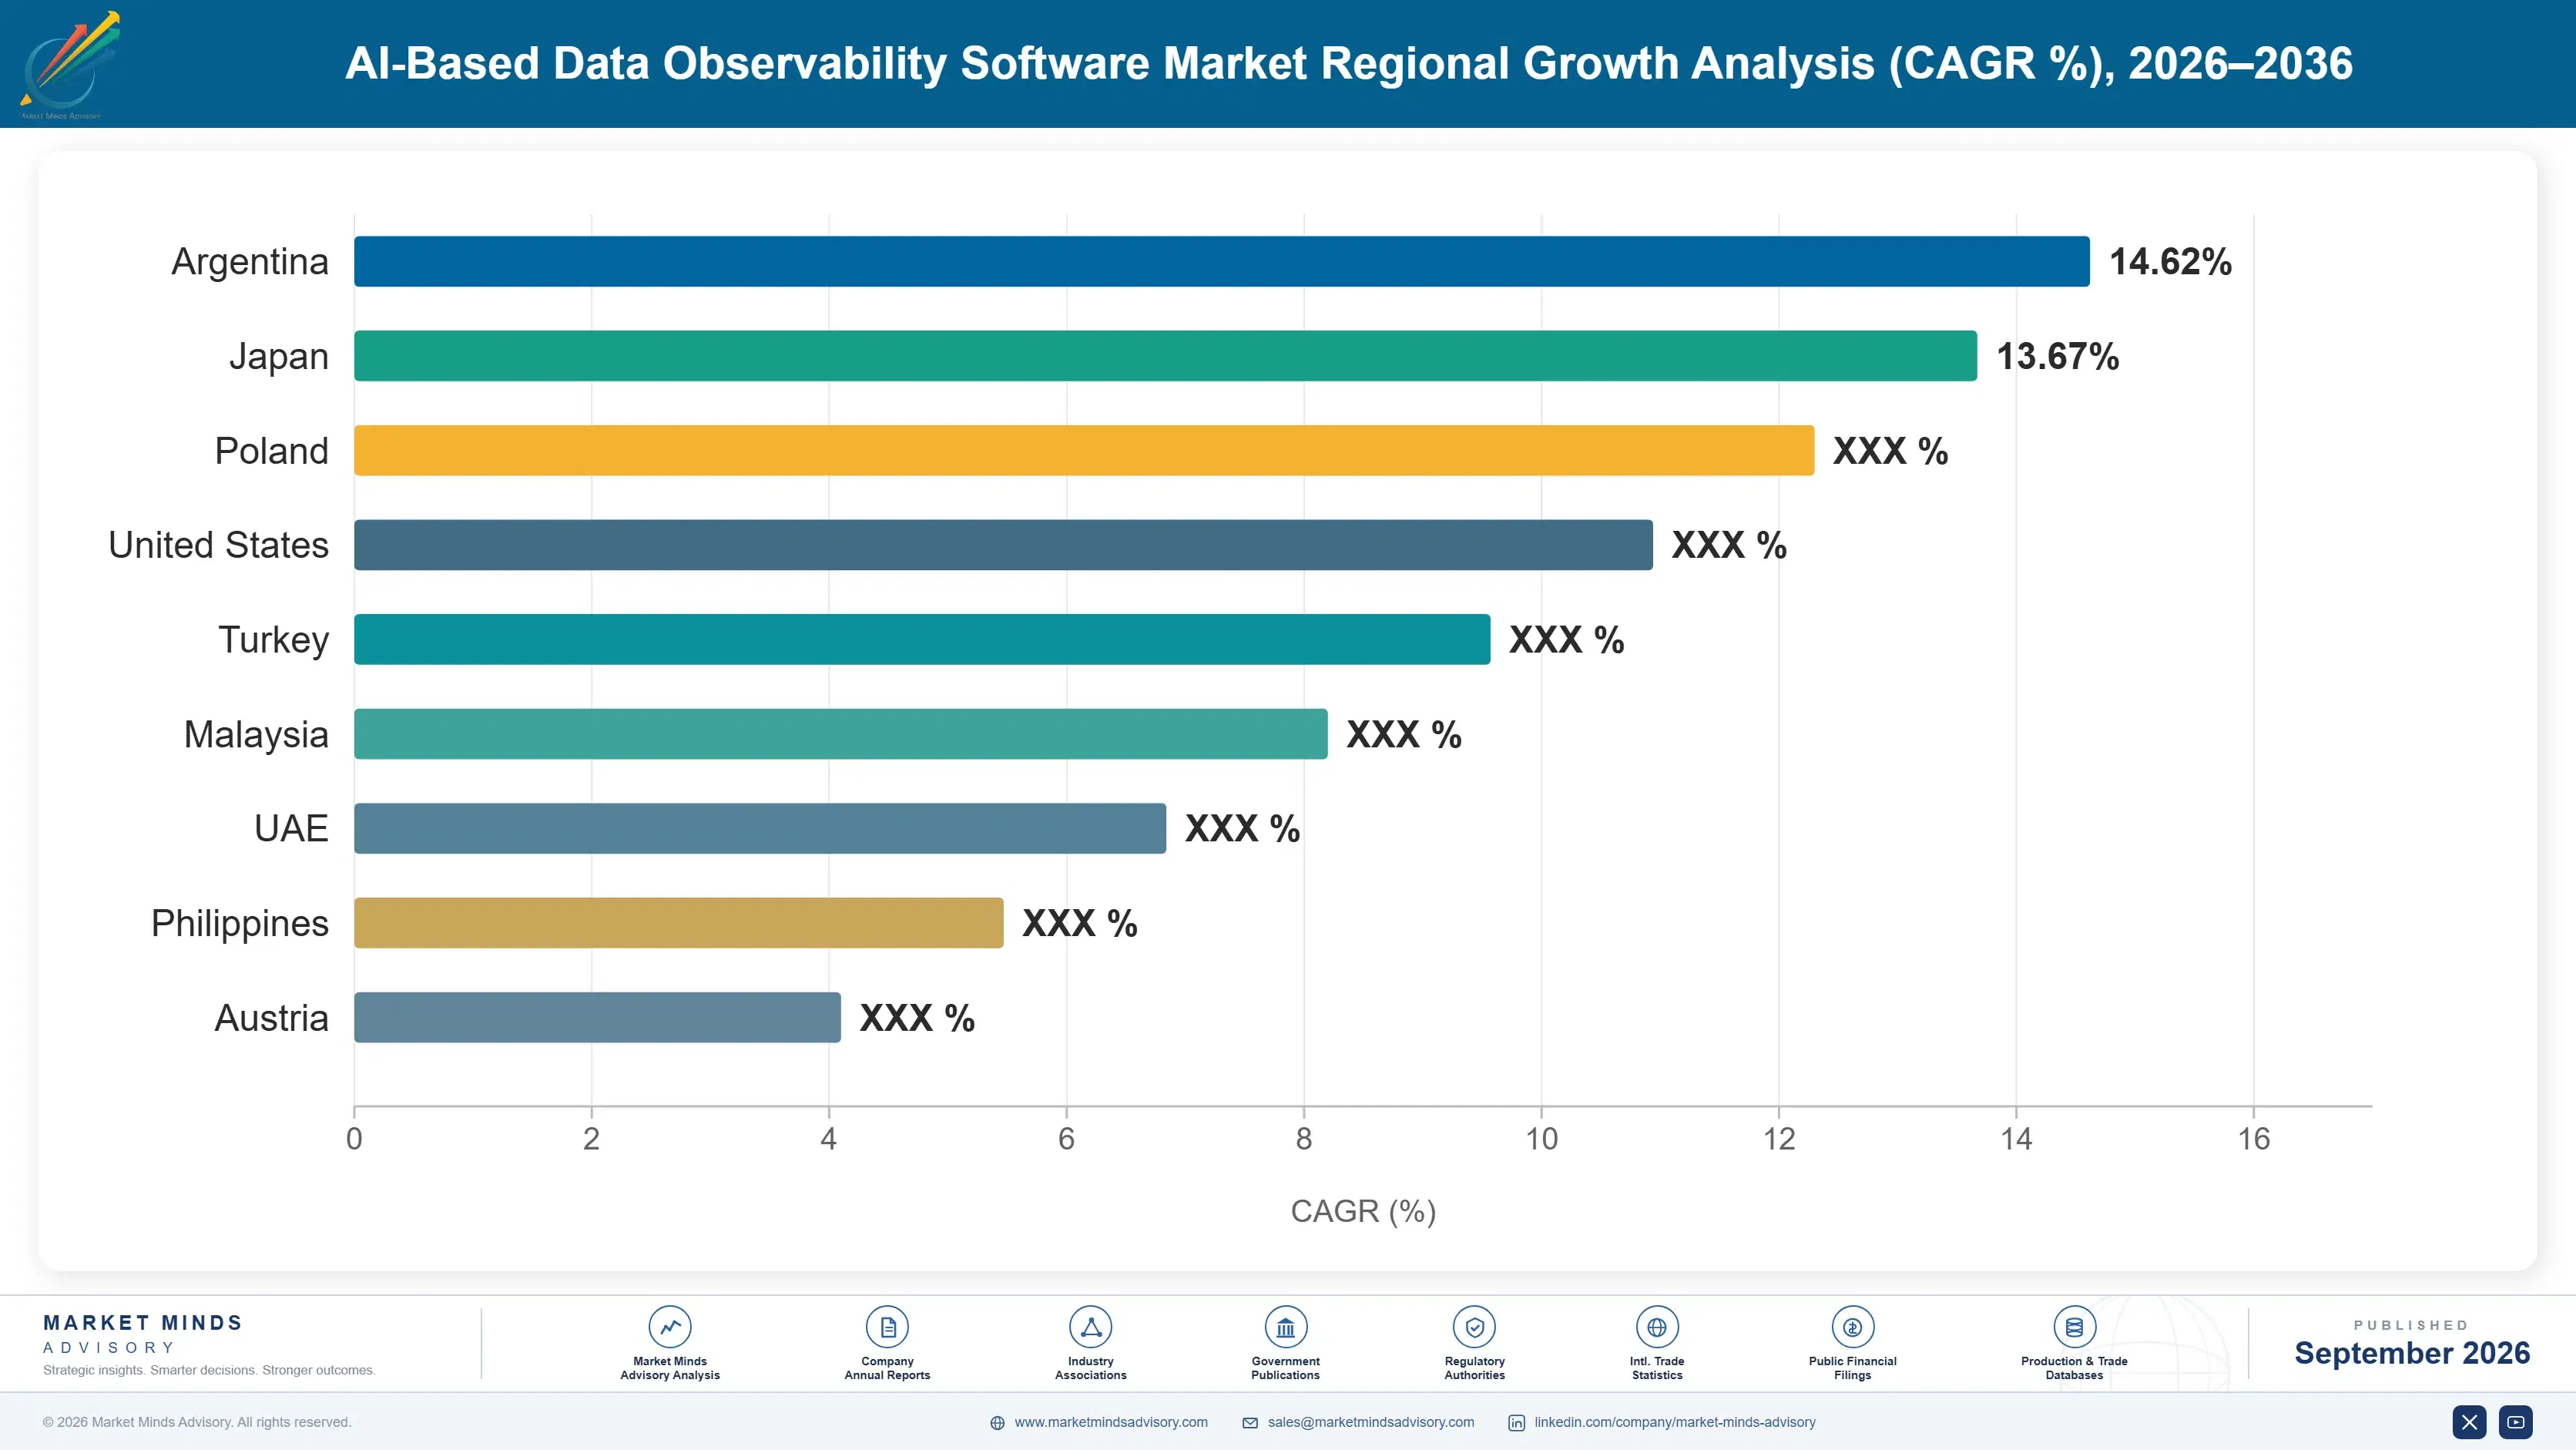
Regional Architecture and Country Demand Map

North America leads given Monte Carlo, Datadog, and Bigeye headquarters concentration and the region's deep enterprise cloud data warehouse adoption driving demand directly, while South Asia and Pacific post the fastest regional growth as offshore engineering hubs and expanding cloud infrastructure investment accelerate data pipeline complexity rapidly.

North America

US enterprises drive the region's dominant share, with Monte Carlo, Datadog, Bigeye, and Databand all headquartered here alongside the deepest concentration of cloud-native data warehouse adoption in the world. Financial services and technology sector data teams concentrated here operate the most complex, sprawling pipeline architectures anywhere, creating genuine demand for autonomous detection capability at scale. This concentration of both vendor headquarters and sophisticated buyer demand makes North America the largest justified share, reflecting real market structure rather than a reflexive default assumption applied without evidence. Venture capital investment concentrated here continues funding new AI-native observability startups at a pace unmatched anywhere else globally, sustaining rapid product innovation. This funding advantage compounds over time, letting US vendors out-innovate global rivals.
Share: 32% | CAGR: 16.5% (2026 to 2036)

Western Europe

European enterprises pursue AI-driven observability adoption steadily, shaped by strict GDPR data governance requirements that create genuine demand for lineage tracking and audit trail capability beyond simple anomaly detection. Acceldata maintains meaningful European operations serving regional financial services and technology clients directly. Growth trails North America's pace given somewhat slower cloud migration timelines across member states compared to US enterprise cloud adoption, though enterprise data governance investment continues expanding steadily across every major national market and industry vertical. Regional data protection authorities are increasingly scrutinizing automated data processing decisions, pushing vendors to build explainability features that satisfy regulatory transparency expectations. This regulatory pressure is shaping product roadmaps across every vendor serving the region's largest financial institutions.
Share: 20% | CAGR: 15.0% (2026 to 2036)
Regional intelligence for 5 additional markets available in the complete report: East Asia, South Asia and Pacific, Latin America, Middle East and Africa, Eastern Europe. Contact sales@marketmindsadvisory.com.
ai-based-data-observability-software-market-country-cagr-analysis-1788451884846

Where Observability Vendors Capture Margin

Vendors expand margin by moving well beyond commodity anomaly detection into autonomous remediation services, data lineage compliance packaging, and enterprise-wide platform consolidation, each capturing budget that a narrow detection-only offering otherwise leaves entirely for a competitor to claim across that same enterprise relationship over its full multi-year contract lifecycle and every renewal cycle history.

Bundle Autonomous Remediation Into Core Platform

Vendors embedding autonomous remediation capability directly into core observability platforms, letting the system automatically fix common pipeline failures rather than just detecting and alerting on them, capture roughly 25 percent higher average contract value than vendors selling detection-only capability to comparable enterprise accounts of similar scale and complexity. Enterprise buyers increasingly refuse to pay premium pricing for tools that merely generate alerts without reducing the actual engineering burden of resolution. Building this remediation capability requires sustained machine learning investment that smaller vendors struggle to develop without dedicated research staff and infrastructure.
Market Impact: Adds a 25% average contract value premium overall

Offer Data Lineage Compliance Packaging Services

Vendors offering pre-built data lineage and audit trail packaging tailored to regulatory compliance requirements capture a premium of roughly 20 to 25 percent over generic lineage tracking sold without compliance framing to comparable enterprise accounts across every regulated industry vertical served nationwide. Regulated enterprise clients in financial services and healthcare value this packaging since it effectively outsources a specialized compliance documentation function they would otherwise need to build internally. This lever requires vendors to build genuine regulatory expertise that takes years to develop credibly across every jurisdiction served and maintained.
Market Impact: Commands a 20 to 25% compliance premium overall

Consolidate Multiple Point Tools Into Platform

Vendors that successfully consolidate anomaly detection, lineage tracking, and schema monitoring into a single unified platform capture meaningfully more total account revenue than vendors serving clients through narrow, single-capability point tools negotiated separately across different budget owners, procurement cycles, and internal teams. This consolidation motion works particularly well once a vendor has already demonstrated strong detection accuracy in one capability, since enterprise buyers extend that trust to adjacent capabilities readily. Roughly 33 percent of large enterprise clients now purchase three or more bundled observability capabilities from a single vendor relationship.
Market Impact: Reaches a 33% multi-capability bundling rate right now

Provide Managed Data Reliability Engineering Services

Vendors offering managed data reliability engineering services, where dedicated staff help enterprise clients configure and tune monitoring rules alongside the platform itself, command a service revenue premium of roughly 18 percent on top of standard subscription licensing fees charged to comparable accounts across every industry vertical served. Enterprise clients without dedicated data reliability engineering teams find this service particularly valuable, since it effectively outsources a specialized function they cannot justify hiring for internally at their current scale. This lever requires vendors to build genuine reliability engineering expertise over multiple years.
Market Impact: Commands an 18% managed services fee premium now

Who Controls the Margin Pool

The AI-based data observability software market carries moderate concentration, with a CR5 near 35 percent reflecting a mix of AI-native startups and established data infrastructure vendors. Monte Carlo and Datadog lead through early market entry and broad platform integration reach, while a gap separates them from mid-tier challengers still building comparable autonomous detection depth. Revenue basis: global contracted software subscription revenue, per company disclosures.
Current activity centers on autonomous root cause analysis capability development, since enterprise buyers increasingly evaluate vendors on causal explanation depth rather than detection accuracy alone. Vendors are racing to embed generative AI capability into anomaly investigation while building compliance-ready lineage tracking for regulated industry clients. Partnership activity between observability vendors and cloud data warehouse providers has intensified as vendors seek deeper platform integration than API-level connections alone provide.

Rankings shift meaningfully wherever a vendor proves genuine autonomous remediation reliability on complex, multi-source pipeline failures rather than simple threshold-based alerting alone. AI-native startups without legacy monitoring infrastructure are winning share from established vendors slower to modernize detection architecture around modern machine learning techniques. Expect consolidation pressure to intensify as mid-tier vendors lacking scale struggle to fund AI engineering investment leading players now treat as baseline.
ai-based-data-observability-software-market-company-positioning-matrix-1788451885373

Competitive Moat and Risk Dimensions

MONTE CARLO

Moat: Early Market Category Leadership

Monte Carlo pioneered the data observability category and built the broadest brand recognition among enterprise data engineering teams, giving it default consideration in most vendor evaluation processes. This early-mover advantage translates into deeper integration partnerships with major cloud data warehouse providers most competitors still lack.
MONTE CARLO

Risk: Premium Pricing Limits Reach

Monte Carlo's premium pricing structure puts it out of reach for smaller data teams operating on tighter software budgets than its typical large enterprise client base. This leaves an opening for lower-cost specialized vendors to win accounts among teams that value core detection functionality over the broadest possible feature set.
DATADOG

Moat: Broad Platform Bundling Reach

Datadog bundles data observability capability into its broader application and infrastructure monitoring platform, letting customers add data pipeline monitoring without procuring and integrating a separate standalone vendor tool. This bundled reach makes it a default choice for enterprises already running Datadog's core platform for other monitoring needs.
DATADOG

Risk: Shallower Data-Specific Detection Depth

Datadog's data observability capability remains less specialized than dedicated data-native vendors that built their entire platform architecture specifically around data pipeline monitoring challenges from day one. This leaves an opening for specialized competitors to win the most demanding data engineering accounts requiring the deepest detection sophistication.

Players Tracked

Prominent Players

Monte Carlo
Datadog
Bigeye
Acceldata
Databand (IBM)

Other Key Players

Anomalo
Metaplane
Soda
Great Expectations
Sifflet
Validio
Lightup
Telmai
Unravel Data
Cribl
New Relic
Splunk
Dynatrace
Elastic
Grafana Labs

Recent Developments

MARCH 2026

Monte Carlo Launches Generative AI Root Cause Assistant

Monte Carlo launched a generative AI-powered root cause analysis assistant that automatically generates natural language explanations of pipeline failures, reducing the manual investigation time engineers previously spent correlating logs and metrics across disparate systems. The launch targets enterprise accounts seeking faster resolution without expanding data engineering headcount.
Signal: Signals accelerating vendor investment in generative AI-powered root cause explanation capability across the entire software industry.
NOVEMBER 2025

Datadog Expands Data Lineage Tracking Capability

Datadog announced expanded data lineage tracking capability within its broader observability platform, extending coverage to additional cloud data warehouse and transformation tool integrations requested by enterprise customers directly. The expansion targets data engineering teams seeking consolidated monitoring across application, infrastructure, and data pipeline layers simultaneously.
Signal: Confirms platform consolidation pressure is reshaping standalone vendor competitive positioning across the entire software industry today.
JUNE 2026

Bigeye Partners With Major Cloud Data Warehouse Provider

Bigeye entered a technology partnership with a major cloud data warehouse provider to deliver native integration between its observability platform and the provider's data transformation and orchestration tools. The partnership targets enterprise accounts seeking tighter integration than standalone API connections previously provided across their data infrastructure.
Signal: Reflects growing vendor investment in deeper cloud platform integration partnerships across the entire industry landscape today.

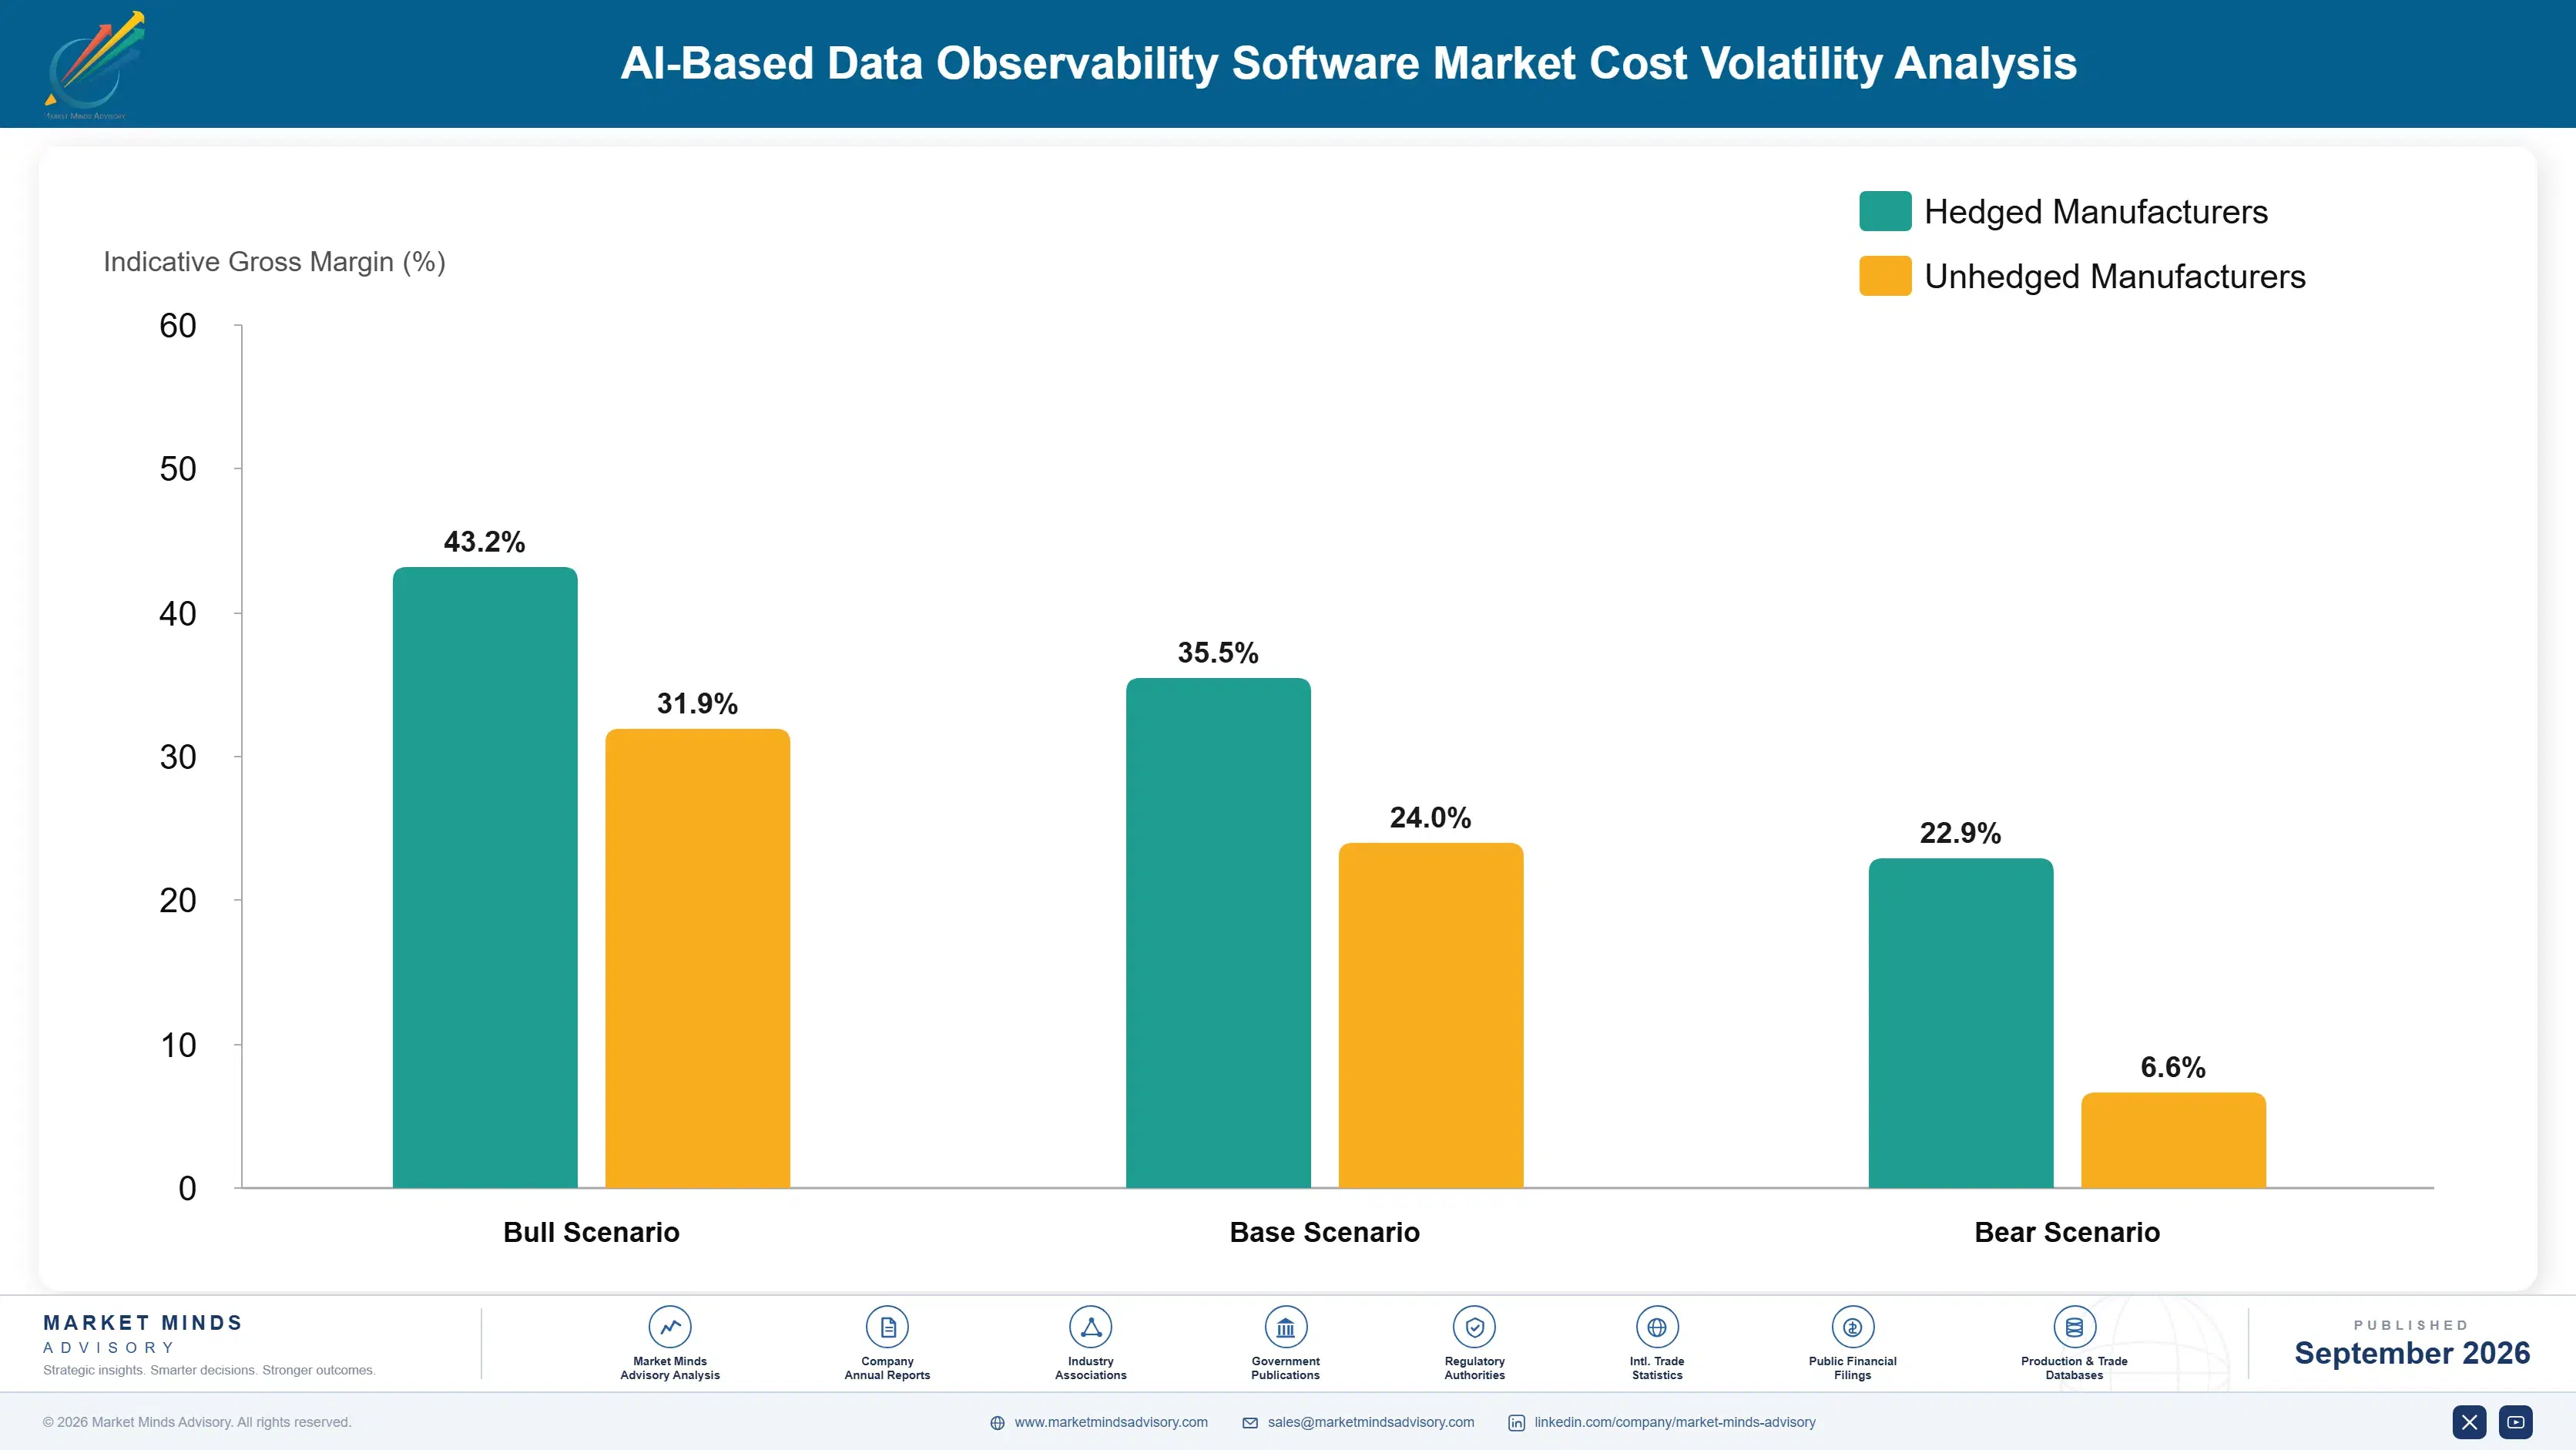
AI Model Training and Compute Cost Exposure

Cloud AI compute for training and running anomaly detection and root cause analysis models represents roughly 22 to 28 percent of vendor cost of goods sold, sourced primarily through hyperscale cloud providers and specialized AI infrastructure vendors. Machine learning engineering talent, needed to build and continuously refine detection models, contributes a further 32 percent, drawn from a competitive global AI research talent pool.
AI compute pricing rose meaningfully in 2025 as demand for large language model inference capacity outpaced available data center capacity, a dynamic documented in IEA's 2025 electricity market reporting on data center power demand growth trends. Vendors absorbing these increases without repricing client subscription contracts saw margin compression across their AI-driven detection service lines, particularly smaller vendors lacking scale to negotiate favorable committed usage discounts with major providers.

Vendors without proprietary AI infrastructure or committed compute discounts face a genuine competitive disadvantage against scale players able to negotiate better inference pricing, since rising input costs erode already thin subscription margins faster for smaller competitors. Exposure varies by business model too, since vendors relying heavily on third-party foundation model APIs face additional per-query cost exposure that vendors running proprietary models avoid.
ai-based-data-observability-software-market-cost-volatility-analysis-1788451885568

Negotiate Committed Cloud Compute Discounts

Vendors are increasingly negotiating multi-year committed compute usage agreements directly with hyperscale cloud providers, locking in discounted inference pricing well below public list rates in exchange for guaranteed minimum consumption commitments spanning several years across their full detection service delivery base. This structure protects gross margin from sudden mid-contract pricing changes imposed by cloud infrastructure vendors.

Develop Smaller Task-Specific Detection Models

Some vendors now develop smaller, task-specific machine learning models trained for narrow anomaly detection categories rather than relying entirely on expensive general-purpose frontier language models for every inference request. This approach reduces per-query inference cost meaningfully while still maintaining acceptable detection accuracy for the routine monitoring tasks that make up the bulk of daily pipeline volume.

Diversify AI Talent Across Multiple Regions

Vendors are spreading machine learning engineering talent deliberately across multiple countries rather than concentrating entirely in the most competitive domestic talent markets, reducing exposure to any single region's wage inflation while still maintaining the research depth needed to improve detection accuracy over time across every supported capability, modality, use case, enterprise deployment, and geography.

Portfolio Architecture for Margin Defence

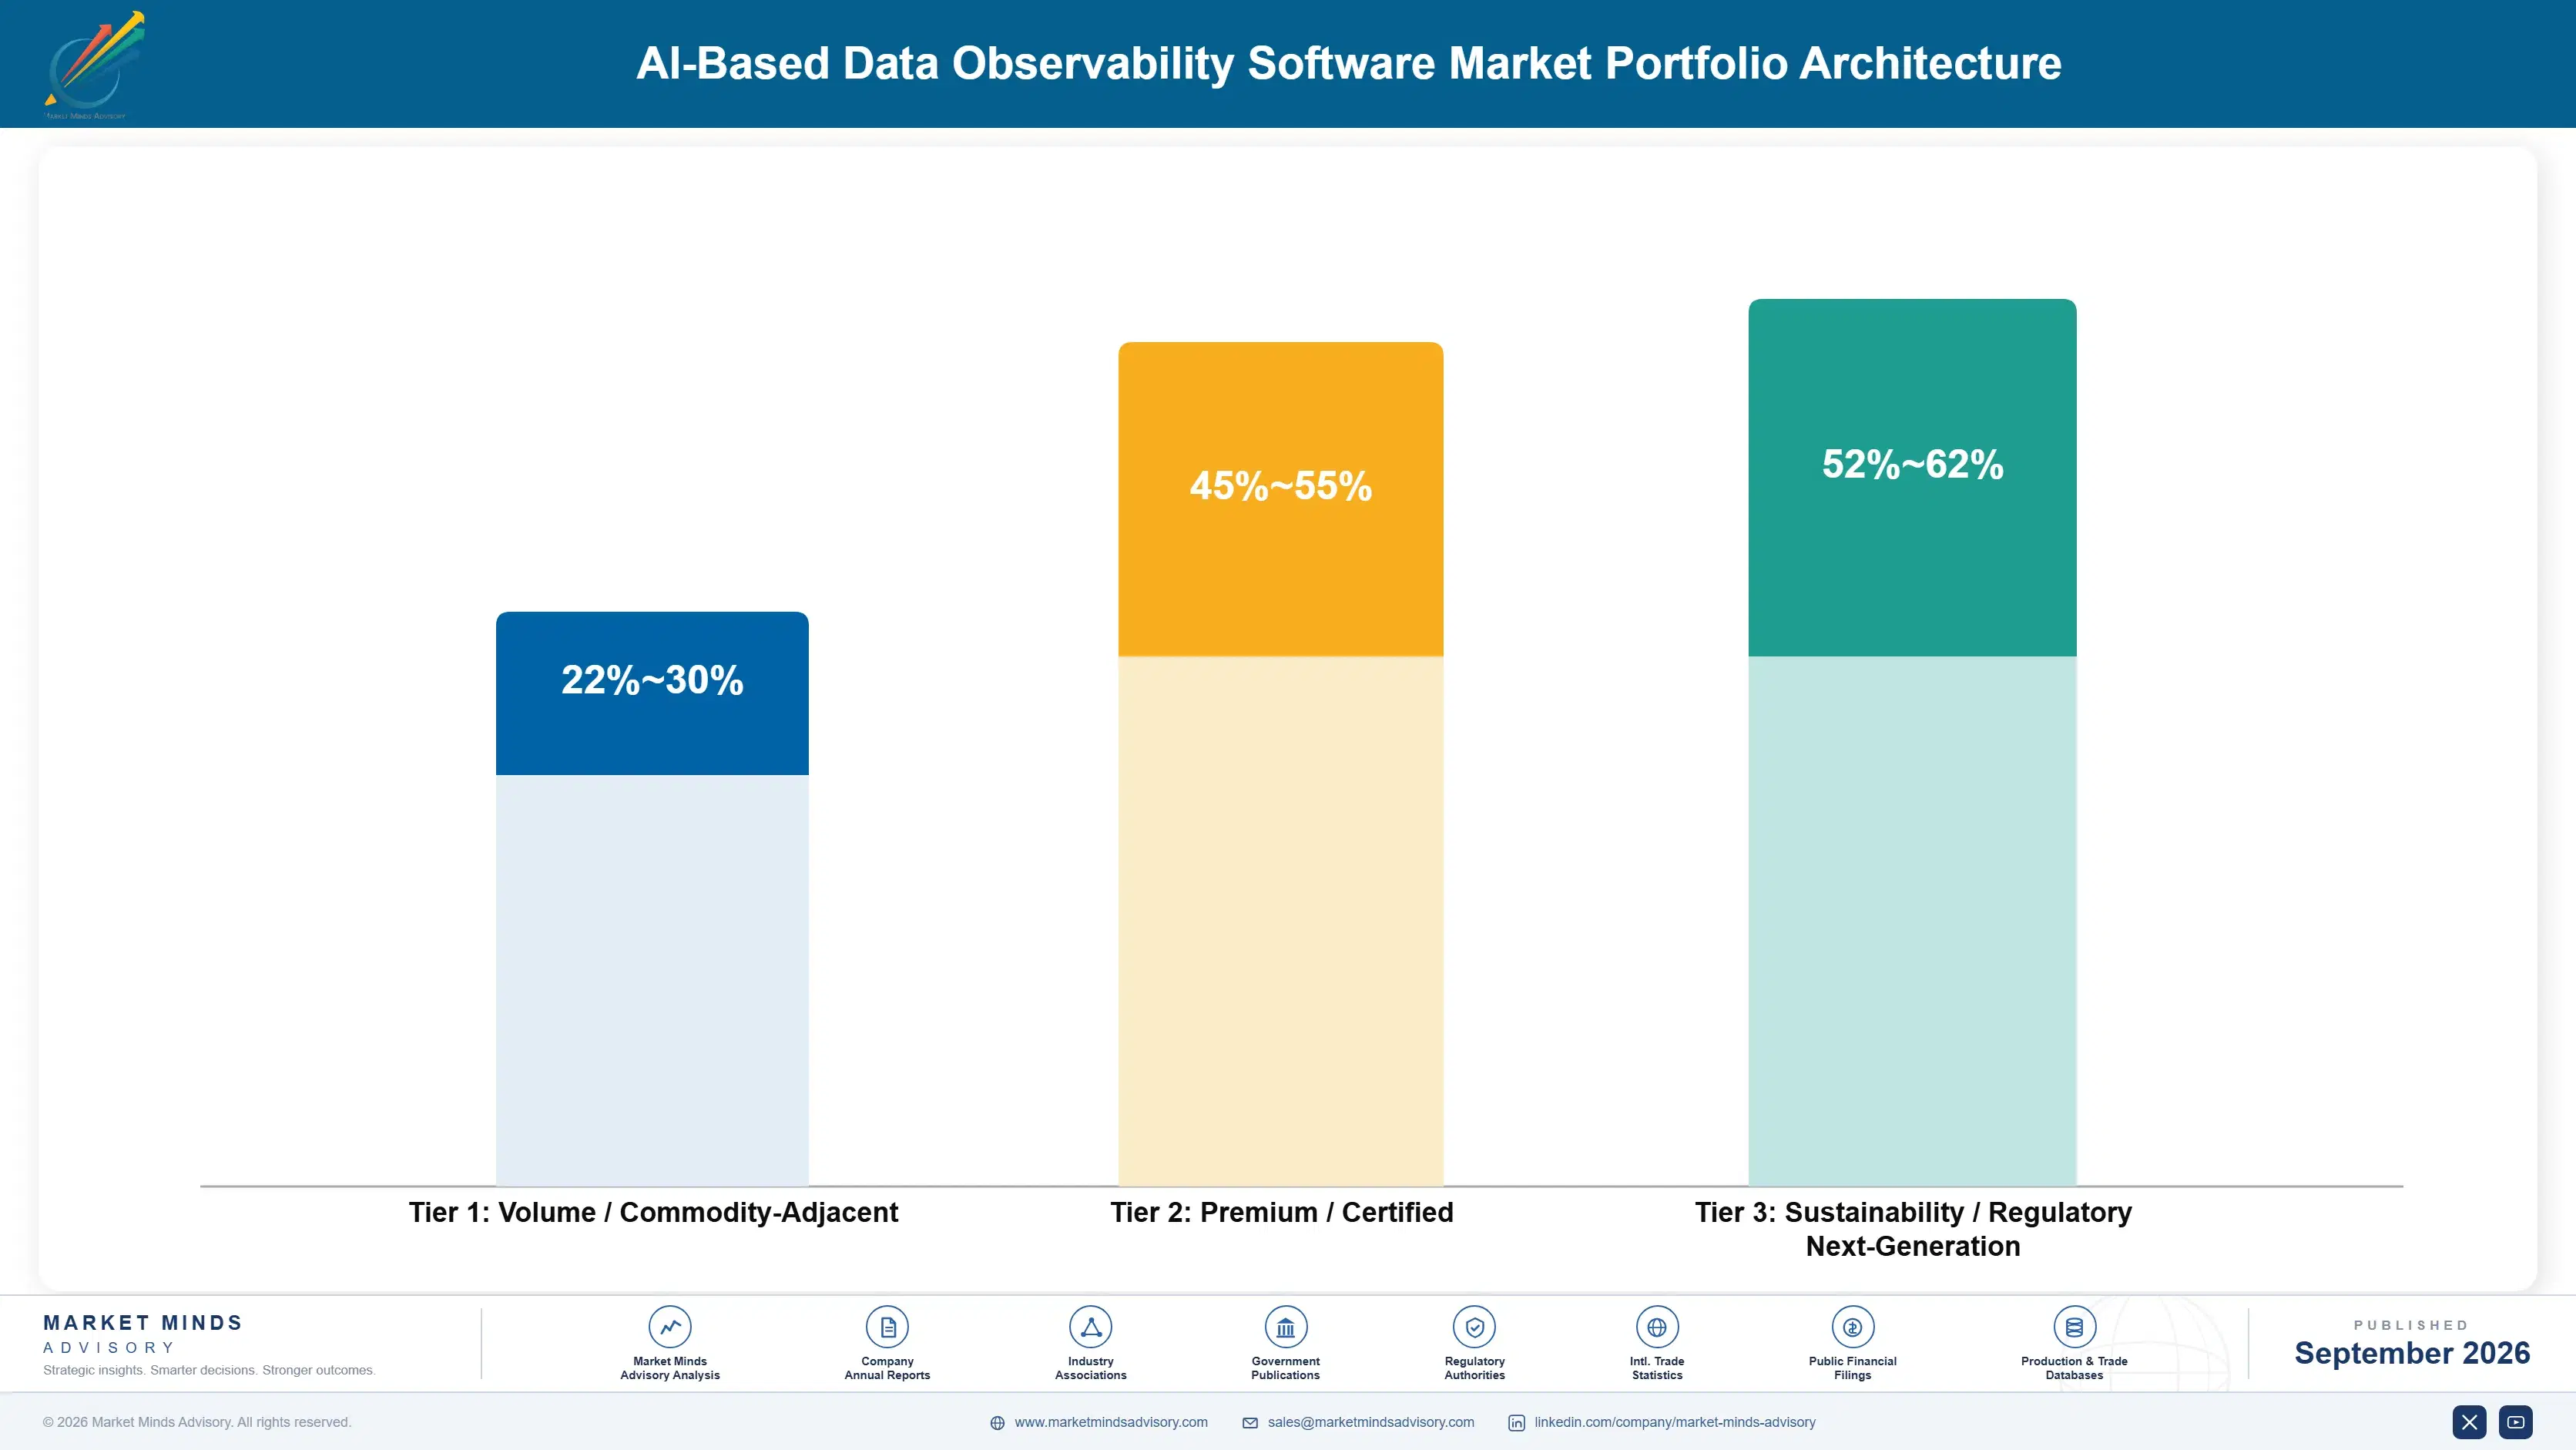
The AI-based data observability market splits into three commercial tiers separated by detection sophistication and remediation depth rather than by monitored data volume alone. Commodity-adjacent detection-only tools compete on price against tightly integrated mid-tier platforms, while regulated enterprise accounts pay a substantial premium for autonomous remediation platforms carrying compliance-ready lineage tracking built directly into the core product architecture from the outset.
Volume tier gross margins run meaningfully below premium tier margins, since commodity detection tools face intense price competition from numerous vendors offering broadly comparable rule-based alerting capability. Vendors chasing volume through aggressive discounting increasingly find that strategy erodes the very margin needed to fund the AI engineering investment that separates premium platforms from basic threshold monitoring in the eyes of large enterprise buyers.

High-value margin pools concentrate overwhelmingly in autonomous remediation and compliance lineage deployments carrying deep multi-source pipeline coverage, where switching costs run high once an enterprise commits its monitoring infrastructure to a given platform. Vendors positioned in this tier capture disproportionate lifetime revenue relative to their customer count, since enterprise accounts rarely churn and consistently expand their monitored pipeline footprint over successive renewal cycles.

Volume / Commodity-Adjacent

Basic rule-based alerting and threshold monitoring for smaller data teams without heavy compliance requirements, competing primarily on price against numerous vendors offering broadly comparable functionality and coverage depth across the industry.
Gross Margin: 22-30%

Premium / Certified

AI-driven anomaly detection and autonomous root cause analysis platforms carrying multi-source pipeline coverage, commanding a durable premium over rule-based tools through demonstrated resolution speed and accuracy improvements sustained over time consistently.
Gross Margin: 45-55%

Sustainability / Regulatory / Next-Generation

Autonomous remediation and compliance-ready lineage tracking commanding the platform's highest margin among forward-looking regulated enterprise customers pursuing genuine competitive differentiation beyond basic detection capability, standard reporting, and static dashboards across every account.
Gross Margin: 52-62%
ai-based-data-observability-software-market-portfolio-architecture-1788451886061

High-value Sub-segments and Strategic Watch-out

Autonomous Root Cause Analysis Software

The fastest-growing, highest-value segment as enterprises demand causal explanations rather than raw alerts, commanding premium pricing while expanding rapidly across every regulated and unregulated industry category nationwide over the coming decade as adoption accelerates further among competing vendors racing hard for market share and enterprise trust.
Gross Margin: 55-65%

Data Lineage Compliance Packaging

A high-value segment growing at a more moderate pace as regulatory scrutiny intensifies across financial services and healthcare industries alike, still commanding strong margin from enterprise clients requiring auditable data provenance infrastructure built directly into their contracted platform delivery terms and every renewal agreement signed.
Gross Margin: 48-56%

Standard Rule-Based Alerting Tools

The volume core of the market, generationally mature and highly price competitive, providing steady recurring revenue without the margin upside that newer AI-driven detection modules increasingly command instead across the industry and every enterprise customer segment served nationwide today and well into the distant future.
Gross Margin: 22-30%

Hyperscale-Bundled Basic Observability Features

A strategic watch-out category as cloud hyperscale providers bundle basic detection capability into core platform offerings, pressuring standalone vendors reliant on commodity monitoring for a meaningful share of total contracted revenue going forward across every enterprise account, geography, industry vertical, company size, and use case.
Gross Margin: 18-25%

Recurring Subscription Revenue and Deep Lock-In

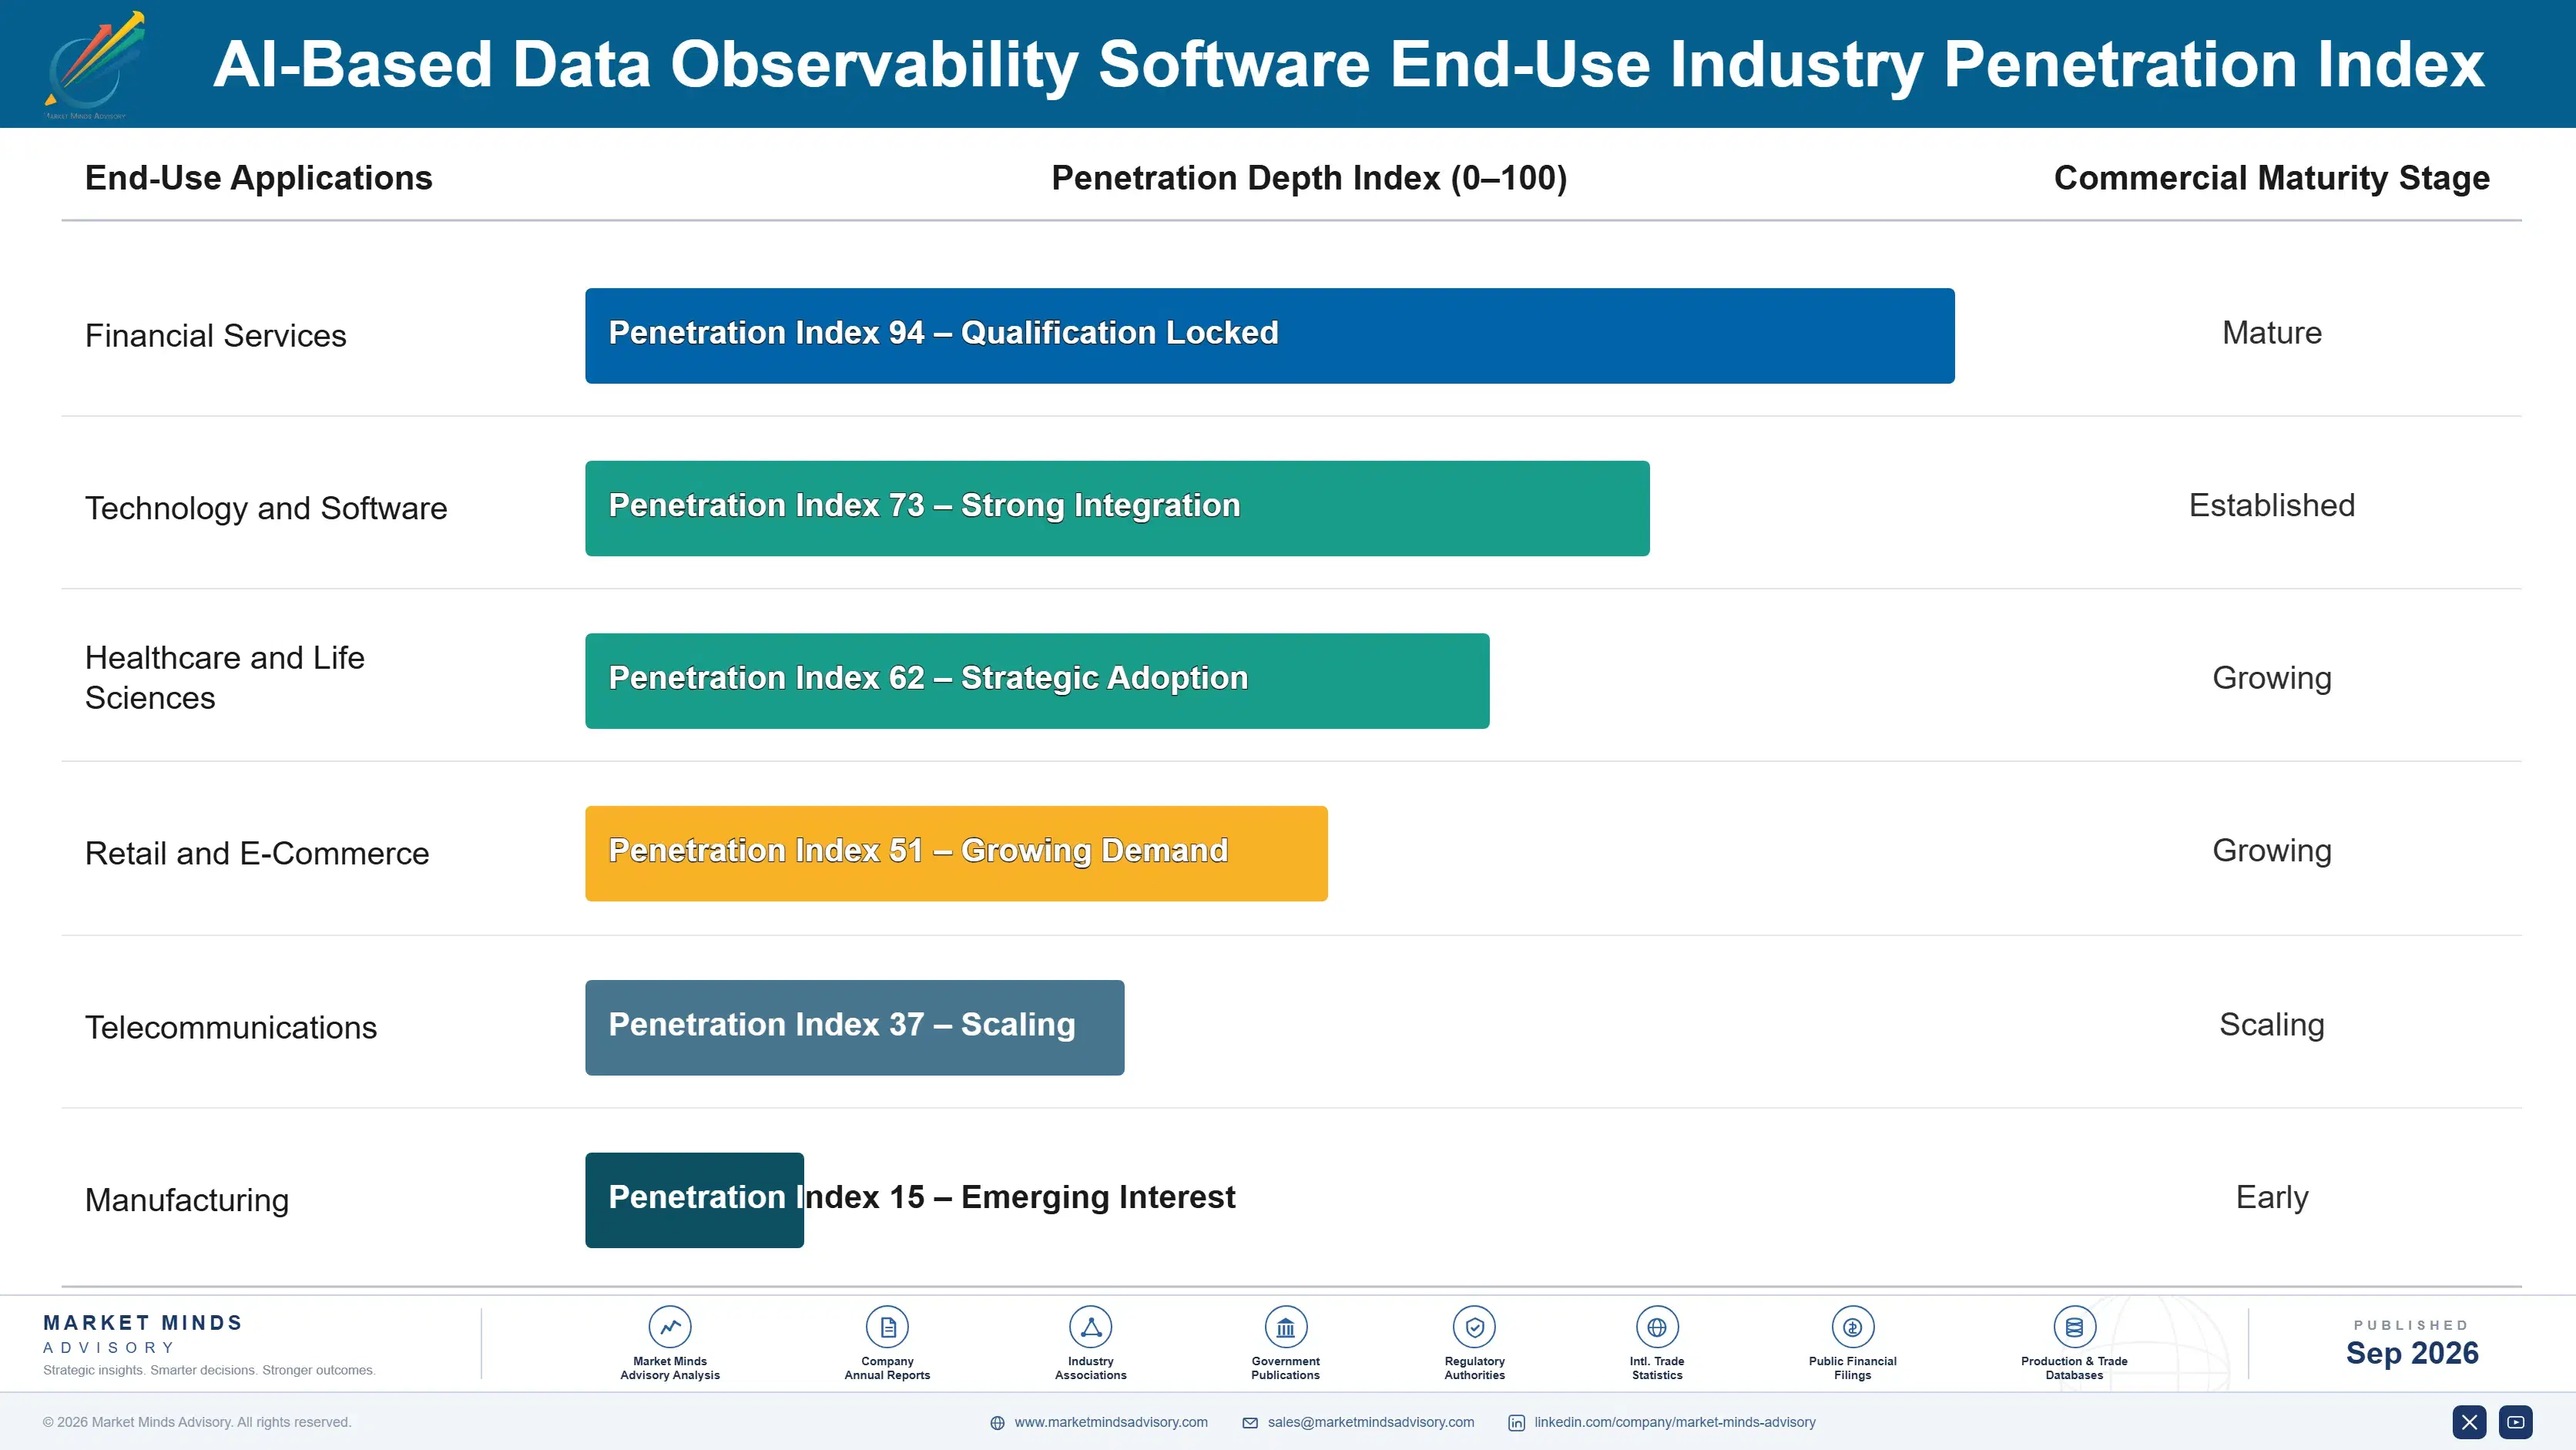
Data observability runs almost entirely on annuity economics, since integrated monitoring infrastructure cannot be swapped out without rebuilding every configured detection rule and alert routing workflow at substantial cost and risk. Subscription revenue dominates vendor income statements, with expanded pipeline coverage inside existing customer accounts contributing more incremental revenue than net-new customer acquisition across most established vendor portfolios operating in this market today.
Adoption stickiness varies meaningfully by end-use vertical. Financial services and healthcare accounts exhibit the deepest lock-in, since compliance certification and integration costs after a platform switch routinely exceed a full year of subscription fees. Technology and retail accounts switch more readily, lacking equivalent compliance burden, which explains why leading vendors increasingly prioritize regulated account depth over volume expansion into less sticky verticals.

Buyer profiles are shifting generationally as data engineering leaders who came up managing manual quality checks and rule-based thresholds give way gradually to a cohort fluent in evaluating AI-driven detection accuracy and autonomous remediation capability rather than familiarity alone. This generational transition is accelerating vendor selection cycles and rewarding platforms built for measurable resolution speed over legacy vendors coasting on longstanding incumbency and brand recognition.
ai-based-data-observability-software-market-end-use-penetration-index-1788451886558

Where Vendors Should Focus Next

These are among the four positions where our research anticipates prominent divergence between winners and laggards over the coming forecast period. Each is grounded in the demand model, the regulatory perimeter, and the announced capacity pipeline.
01 / AUTONOMOUS REMEDIATION INVESTMENT

Build remediation capability before it becomes table stakes

Enterprise buyers increasingly refuse to purchase detection-only tools that generate alerts without reducing actual engineering resolution burden, and vendors lacking autonomous remediation depth will lose renewal bids to competitors offering demonstrably faster fixes across every account. Building genuine remediation capability takes years of sustained machine learning investment, so vendors should commit budget now rather than waiting until the capability becomes an unavoidable procurement requirement across every enterprise segment. Partnering with AI research teams can accelerate this timeline for vendors starting from a smaller existing technology base.
02 / COMPLIANCE LINEAGE PACKAGING

Package lineage tracking for regulated industry buyers now

Regulated enterprise clients in financial services and healthcare increasingly demand data lineage packaging tailored specifically to compliance documentation requirements rather than generic technical lineage tracking alone across every deployment context. Vendors without this specialized packaging risk losing the most lucrative regulated accounts to competitors already meeting these emerging procurement expectations consistently across every relevant jurisdiction and regulated industry vertical. Vendors should invest now in compliance-ready packaging rather than waiting until regulatory scrutiny fully intensifies across every regulated industry vertical served nationwide and abroad.
03 / HYPERSCALE BUNDLING RESPONSE

Differentiate beyond bundled capability before margin erodes

Hyperscale cloud providers bundling basic observability into core platform offerings represent the most consequential competitive threat facing standalone vendors, since bundled pricing power undercuts standalone economics considerably over time across every enterprise account. Vendors must push deeper into autonomous remediation and compliance packaging capability that bundled offerings genuinely cannot replicate at comparable engineering investment levels, speed, or scale. Vendors that fail to differentiate meaningfully risk losing commodity detection revenue entirely to bundled alternatives within the next several years across every segment.
04 / PLATFORM CONSOLIDATION STRATEGY

Bundle detection capabilities into unified platform offerings

Vendors that successfully consolidate anomaly detection, lineage tracking, and schema monitoring under a single unified platform capture meaningfully more account revenue than those serving narrow, single-capability point tools negotiated separately across different budget owners and teams. This consolidation motion works best once a vendor has already demonstrated strong detection accuracy in one capability, since enterprise buyers extend that trust to adjacent capabilities readily and without extensive vetting. Vendors should prioritize this consolidation motion over chasing entirely new client logos wherever existing account trust already exists.

Engagement Snapshot From the Field

A live engagement with an industry participant carrying material or product regulatory and market exposure ahead of a defining policy shift, showing how our research translates into a defensible multi-year portfolio strategy.
MARKET MINDS ADVISORY · CLIENT ENGAGEMENT SUMMARY
AI-Based Data Observability Software Producer Strategic Portfolio Review and Transition Roadmap 2026·Investment Scenario on AI-Based Data Observability Software Exposure Evaluation 2025-26
CLIENT PROFILE
The client is a mid-size fintech company operating a consumer lending platform processing several hundred thousand loan applications monthly across dozens of interconnected data pipelines feeding credit decisioning models. Annual revenue sits in the low hundreds of millions of dollars range (client-reported, unverified by MMA), with data quality incidents previously discovered only after downstream credit decisions had already been affected.
STRATEGIC CHALLENGE
The company faced recurring data pipeline failures that went undetected until customers or regulators flagged incorrect credit decisions, creating both reputational and regulatory compliance risk. Leadership needed an observability solution that could detect anomalies before they reached production decisioning models, while providing audit trail documentation satisfying financial regulatory examination requirements.
MMA APPROACH
MMA conducted a structured assessment of the company's existing pipeline architecture, mapping which data sources fed credit decisioning models and identifying which failure modes carried the highest regulatory and reputational risk. The engagement team then built a phased deployment roadmap prioritizing autonomous detection on the highest-risk pipelines first, paired with a vendor evaluation weighted toward compliance-ready lineage tracking capability.
KEY FINDINGS
  1. The highest-risk credit decisioning pipeline accounted for roughly 55 percent of the company's documented data quality incidents (client-reported, unverified by MMA), confirming the priority deployment sequence.
  2. Manual quality checks previously caught only an estimated 40 percent of actual data anomalies before they reached production systems (client-reported, unverified by MMA), well below acceptable risk tolerance.
  3. Regulatory examiners had specifically requested improved data lineage documentation during the company's most recent compliance examination cycle (client-reported, unverified by MMA), reinforcing urgency for the initiative.
  4. Competing vendor proposals varied by more than 30 percent in projected mean time to detection performance (client-reported, unverified by MMA), underscoring the value of rigorous evaluation testing.
CLIENT PROFILE
The client is a mid-size fintech company operating a consumer lending platform processing several hundred thousand loan applications monthly across dozens of interconnected data pipelines feeding credit decisioning models. Annual revenue sits in the low hundreds of millions of dollars range (client-reported, unverified by MMA), with data quality incidents previously discovered only after downstream credit decisions had already been affected.
STRATEGIC CHALLENGE
The company faced recurring data pipeline failures that went undetected until customers or regulators flagged incorrect credit decisions, creating both reputational and regulatory compliance risk. Leadership needed an observability solution that could detect anomalies before they reached production decisioning models, while providing audit trail documentation satisfying financial regulatory examination requirements.
MMA APPROACH
MMA conducted a structured assessment of the company's existing pipeline architecture, mapping which data sources fed credit decisioning models and identifying which failure modes carried the highest regulatory and reputational risk. The engagement team then built a phased deployment roadmap prioritizing autonomous detection on the highest-risk pipelines first, paired with a vendor evaluation weighted toward compliance-ready lineage tracking capability.
KEY FINDINGS
  1. The highest-risk credit decisioning pipeline accounted for roughly 55 percent of the company's documented data quality incidents (client-reported, unverified by MMA), confirming the priority deployment sequence.
  2. Manual quality checks previously caught only an estimated 40 percent of actual data anomalies before they reached production systems (client-reported, unverified by MMA), well below acceptable risk tolerance.
  3. Regulatory examiners had specifically requested improved data lineage documentation during the company's most recent compliance examination cycle (client-reported, unverified by MMA), reinforcing urgency for the initiative.
  4. Competing vendor proposals varied by more than 30 percent in projected mean time to detection performance (client-reported, unverified by MMA), underscoring the value of rigorous evaluation testing.
RECOMMENDED STRATEGY
Phase 1: Phase one deploys autonomous detection on the highest-risk credit decisioning pipeline first, prioritizing compliance-ready lineage tracking for regulatory documentation purposes. Phase 2: Phase two extends detection coverage to remaining pipelines feeding decisioning models, sequenced carefully by historical incident frequency and regulatory sensitivity level. Phase 3: Phase three layers autonomous remediation capability across all monitored pipelines once baseline detection accuracy is fully validated internally by the team.
OUTCOME
The company completed phase one deployment ahead of its next scheduled regulatory examination, passing the subsequent audit with documented improvement in data lineage transparency (client-reported, unverified by MMA). Leadership subsequently accelerated phases two and three, citing measurable reductions in undetected data quality incidents as the primary justification for the faster rollout timeline.

Frequently Asked Questions

Foundational context covering the market sizes, CAGR, scope, country, region and competition that inform every finding below. This section is provided to cover basics and most often pre-purchase conversations, answered from the MMA Primary Research Dataset.

What is the current size of the AI-Based Data Observability Software Market?

The market is valued at $1.9 billion in 2025, reflecting growing enterprise investment in AI-driven pipeline monitoring. This figure captures autonomous detection and remediation platforms adopted across every major industry vertical.

How large will the AI-Based Data Observability Software Market be by 2036?

The market is projected to reach $10.18 billion by 2036. That represents a 4.61-fold expansion from its 2026 base value over the ten-year forecast window.

What is the CAGR for the AI-Based Data Observability Software Market 2026 to 2036?

The market grows at a compound annual rate of 16.5 percent across the forecast period. Bull and bear scenarios range from 15.2 to 17.8 percent depending on AI adoption pace.

Which segment is growing fastest?

Autonomous Root Cause Analysis Software leads at 24.0 percent CAGR, roughly 1.45 times the overall market rate. Enterprise demand for causal explanations over raw alerts drives this acceleration.

Who are the major companies in the AI-Based Data Observability Software Market?

Monte Carlo, Datadog, Bigeye, Acceldata, and Databand lead the market. Each competes primarily on autonomous detection depth and platform integration reach rather than price alone.

Which country is growing fastest?

India leads at 22.0 percent CAGR, driven by its massive offshore engineering talent base and expanding cloud infrastructure investment. This outpaces the region's own broader growth rate considerably.

Report Segmentation Architecture

The full report scope spans multiple orthogonal segmentation dimensions, with cross-tabulated demand data provided for each dimension pair. Coverage extends further to regional breakdowns, trend trajectories, and the competitive detail needed to support segment-level decision-making.

By Primary Market Dimension

  • Anomaly Detection Software
  • Autonomous Root Cause Analysis Software
  • Data Lineage Tracking Software
  • Schema Change Monitoring Software
  • Freshness and Volume Monitoring Software
  • Automated Remediation Software

By End-Use Industry

  • Financial Services
  • Technology and Software
  • Healthcare and Life Sciences
  • Retail and E-Commerce
  • Telecommunications
  • Manufacturing

By Commercial Dimension

  • Subscription-Based Licensing
  • Usage-Based Pricing
  • Managed Services Agreements
  • Direct Enterprise Sales
  • Cloud Marketplace Channel Sales

By Region

  • North America
  • Western Europe
  • East Asia
  • South Asia and Pacific
  • Latin America
  • Middle East and Africa
  • Eastern Europe

Scope, Methodology, and Coverage

Every figure in this report is reproducible from documented input assumptions. The scope below maps the historical period, the forecast horizon, the segmentation dimensions, and the countries covered, alongside the underlying primary and qualitative methodology.
Historical Period
2020 to 2025
Forecast Period
2026 to 2036
Base Year
2025 (USD billions; MMA Primary Research Dataset, September 2026)
Market Definition
This report defines the AI-based data observability software market as platforms that autonomously monitor data pipeline health, detect anomalies, and trace root causes using machine learning and AI techniques. It excludes traditional rule-based data quality tools without AI-driven detection and general-purpose application performance monitoring software.
Quantitative Units
USD billions, percentage CAGR, percentage market share
Segmentation Dimensions
Capability type, end-use industry, commercial/pricing model
Regions Covered
North America, Western Europe, East Asia, South Asia and Pacific, Latin America, Middle East and Africa, Eastern Europe
Countries Covered
United States, India, Germany, China, United Kingdom, Japan
Key Companies Profiled
Monte Carlo, Datadog, Bigeye, Acceldata, Databand (IBM), and 15 additional participants
Quantitative Methodology
Primary survey, n=3,800 respondents, Q4 2025, six countries; demand-side model with trade association cross-validation
Qualitative Methodology
47 expert interviews, Q4 2025; applied to validate demand model assumptions, identify emerging dynamics, and assess competitive positioning
Report Format
PDF and XLSX data workbook (Word format preview document)
Publisher
Market Minds Advisory
Report Code
MMA-2026-TEC-153
Published
September 2026
Contact
sales@marketmindsadvisory.com | www.marketmindsadvisory.com

Purchase the full AI-Based Data Observability Software Market Report (2026 to 2036).

This report delivers a complete assessment of the AI-based data observability software market, covering sizing, segmentation, competitive dynamics, and cost forces through 2036. It examines how autonomous detection and remediation capability are reshaping enterprise data reliability practices across every major industry vertical worldwide. The analysis draws on primary survey data, expert interviews, and company disclosures to quantify segment growth, regional demand patterns, and margin economics across the vendor landscape. It further evaluates hyperscale bundling pressure, compliance lineage packaging, and input cost exposure shaping vendor strategy going forward.
Full 2026 to 2036 market sizing and forecast
Segment-level growth and gross margin analysis
Regional demand mapping across seven world regions
Competitive landscape and vendor market positioning
AI model training and compute cost exposure
Anonymized client engagement strategy case study

Built For The People Who Decide

From boardroom strategy to bench-side execution, this report is read cover-to-cover by leaders shaping the next decade of their industry, turning demand scenarios, market dynamics and valuation benchmarks into decisions.
CXOs/ Presidents/ VPs/ Managers
M&A and Corporate Development
Strategy Teams and R&D Heads
Procurement and Product Directors
Regulatory and Compliance Leaders
Investor Relations and Equity Analysts