Market Minds Advisory
AI And Machine Learning Operationalization Software Market

AI And Machine Learning Operationalization Software Market: AI And Machine Learning Operationalization Software Market: Inference Economics, Evaluation and Ownership Gaps, 2026 to 2036

Tooling built for enterprises that trained their own models now serves buyers who call somebody else's, which moved all the value from training pipelines to evaluation, guardrails and the inference bill.

Lead Analyst

Published

September 2026

Make Smarter Decisions with Customized Research Insights

Request a free sample report and evaluate market opportunities, growth trends, and competitive dynamics relevant to your business needs.

2025 MARKET VALUE$4.6BMarket Size 2025
2036 FORECAST VALUE$27.9BBase Case , 2026 to 2036
CAGR 2026 TO 203617.8 %Bull 19.2% / Bear 16.4%
INCREMENTAL OPPORTUNITY$22.5BNet 10- year value creation
EXPANSION MULTIPLE5.15x2036 value over 2026 base
Strategic Levers
M&A Pipeline
Regional Outlook
Country Rankings
Competitive Intelligence
Segmental Deep-dive
Call-Us : 91 93563 13602

Executive Snapshot and Market Trajectory.

This category was built on an assumption that stopped being true. Tooling for experiment tracking, feature stores and training pipelines assumes the enterprise trains its own models, and only 21% still do. Everyone else calls an interface to something trained elsewhere. The premise expired and the products did not.
The value moved downstream with the workload. Around 64% of total model spend is now consumed after deployment rather than during training, so the categories that grow are the ones addressing what happens at inference. Evaluation and guardrail tooling grows at 26.7%, half again the market rate of 17.8%, because a model nobody trained still has to be tested against the specific task it is being asked to perform. Nobody predicted this five years ago.
Five platforms hold 38% of measured subscription revenue, and the industry's own embarrassment is that only 32% of models built ever reach production. The obstacle is ownership rather than tooling: organisations staffed a build function and never staffed a run function. Regulatory obligations now cover 43% of deployments, which finally forces someone to own the thing after launch. A compliance obligation fixed a staffing problem no product could.
Market Definition
The AI and machine learning operationalization software market covers tooling that takes models into production and keeps them working, spanning experiment tracking and training pipelines, feature stores and data preparation, model registry and deployment serving, monitoring and drift observability, evaluation and guardrail tooling, and inference cost governance and routing. Sizing is measured at vendor subscription and licence revenue. Foundation model access charges, underlying compute and storage consumption, data platforms sold independently, annotation services and consulting delivery are excluded.
Base Year Value
$4.6B in 2025 (MMA Primary Research Dataset, September 2026)
Forecast Period
2026 to 2036, eleven discrete annual values
CAGR
17.8% base case. Bull 19.2%. Bear 16.4%.
Fastest Growth Segment
Evaluation and Guardrail Tooling: 26.7% CAGR
Fastest Growth Country
India: 24.6% CAGR
Fastest Growth Region
South Asia and Pacific: 20.0% CAGR
Largest Region
North America: 44% of 2025 global value
Market Leaders
Databricks, Amazon Web Services, Microsoft, Google Cloud, Weights and Biases. Source: MMA Analysis based on company disclosures and measured subscription and licence revenue.
Primary Survey
n=3,800 procurement and R&D decision-makers, Q4 2025, six countries
Methodology
Demand-side build-up, cross-validated against public data, 47 expert interviews

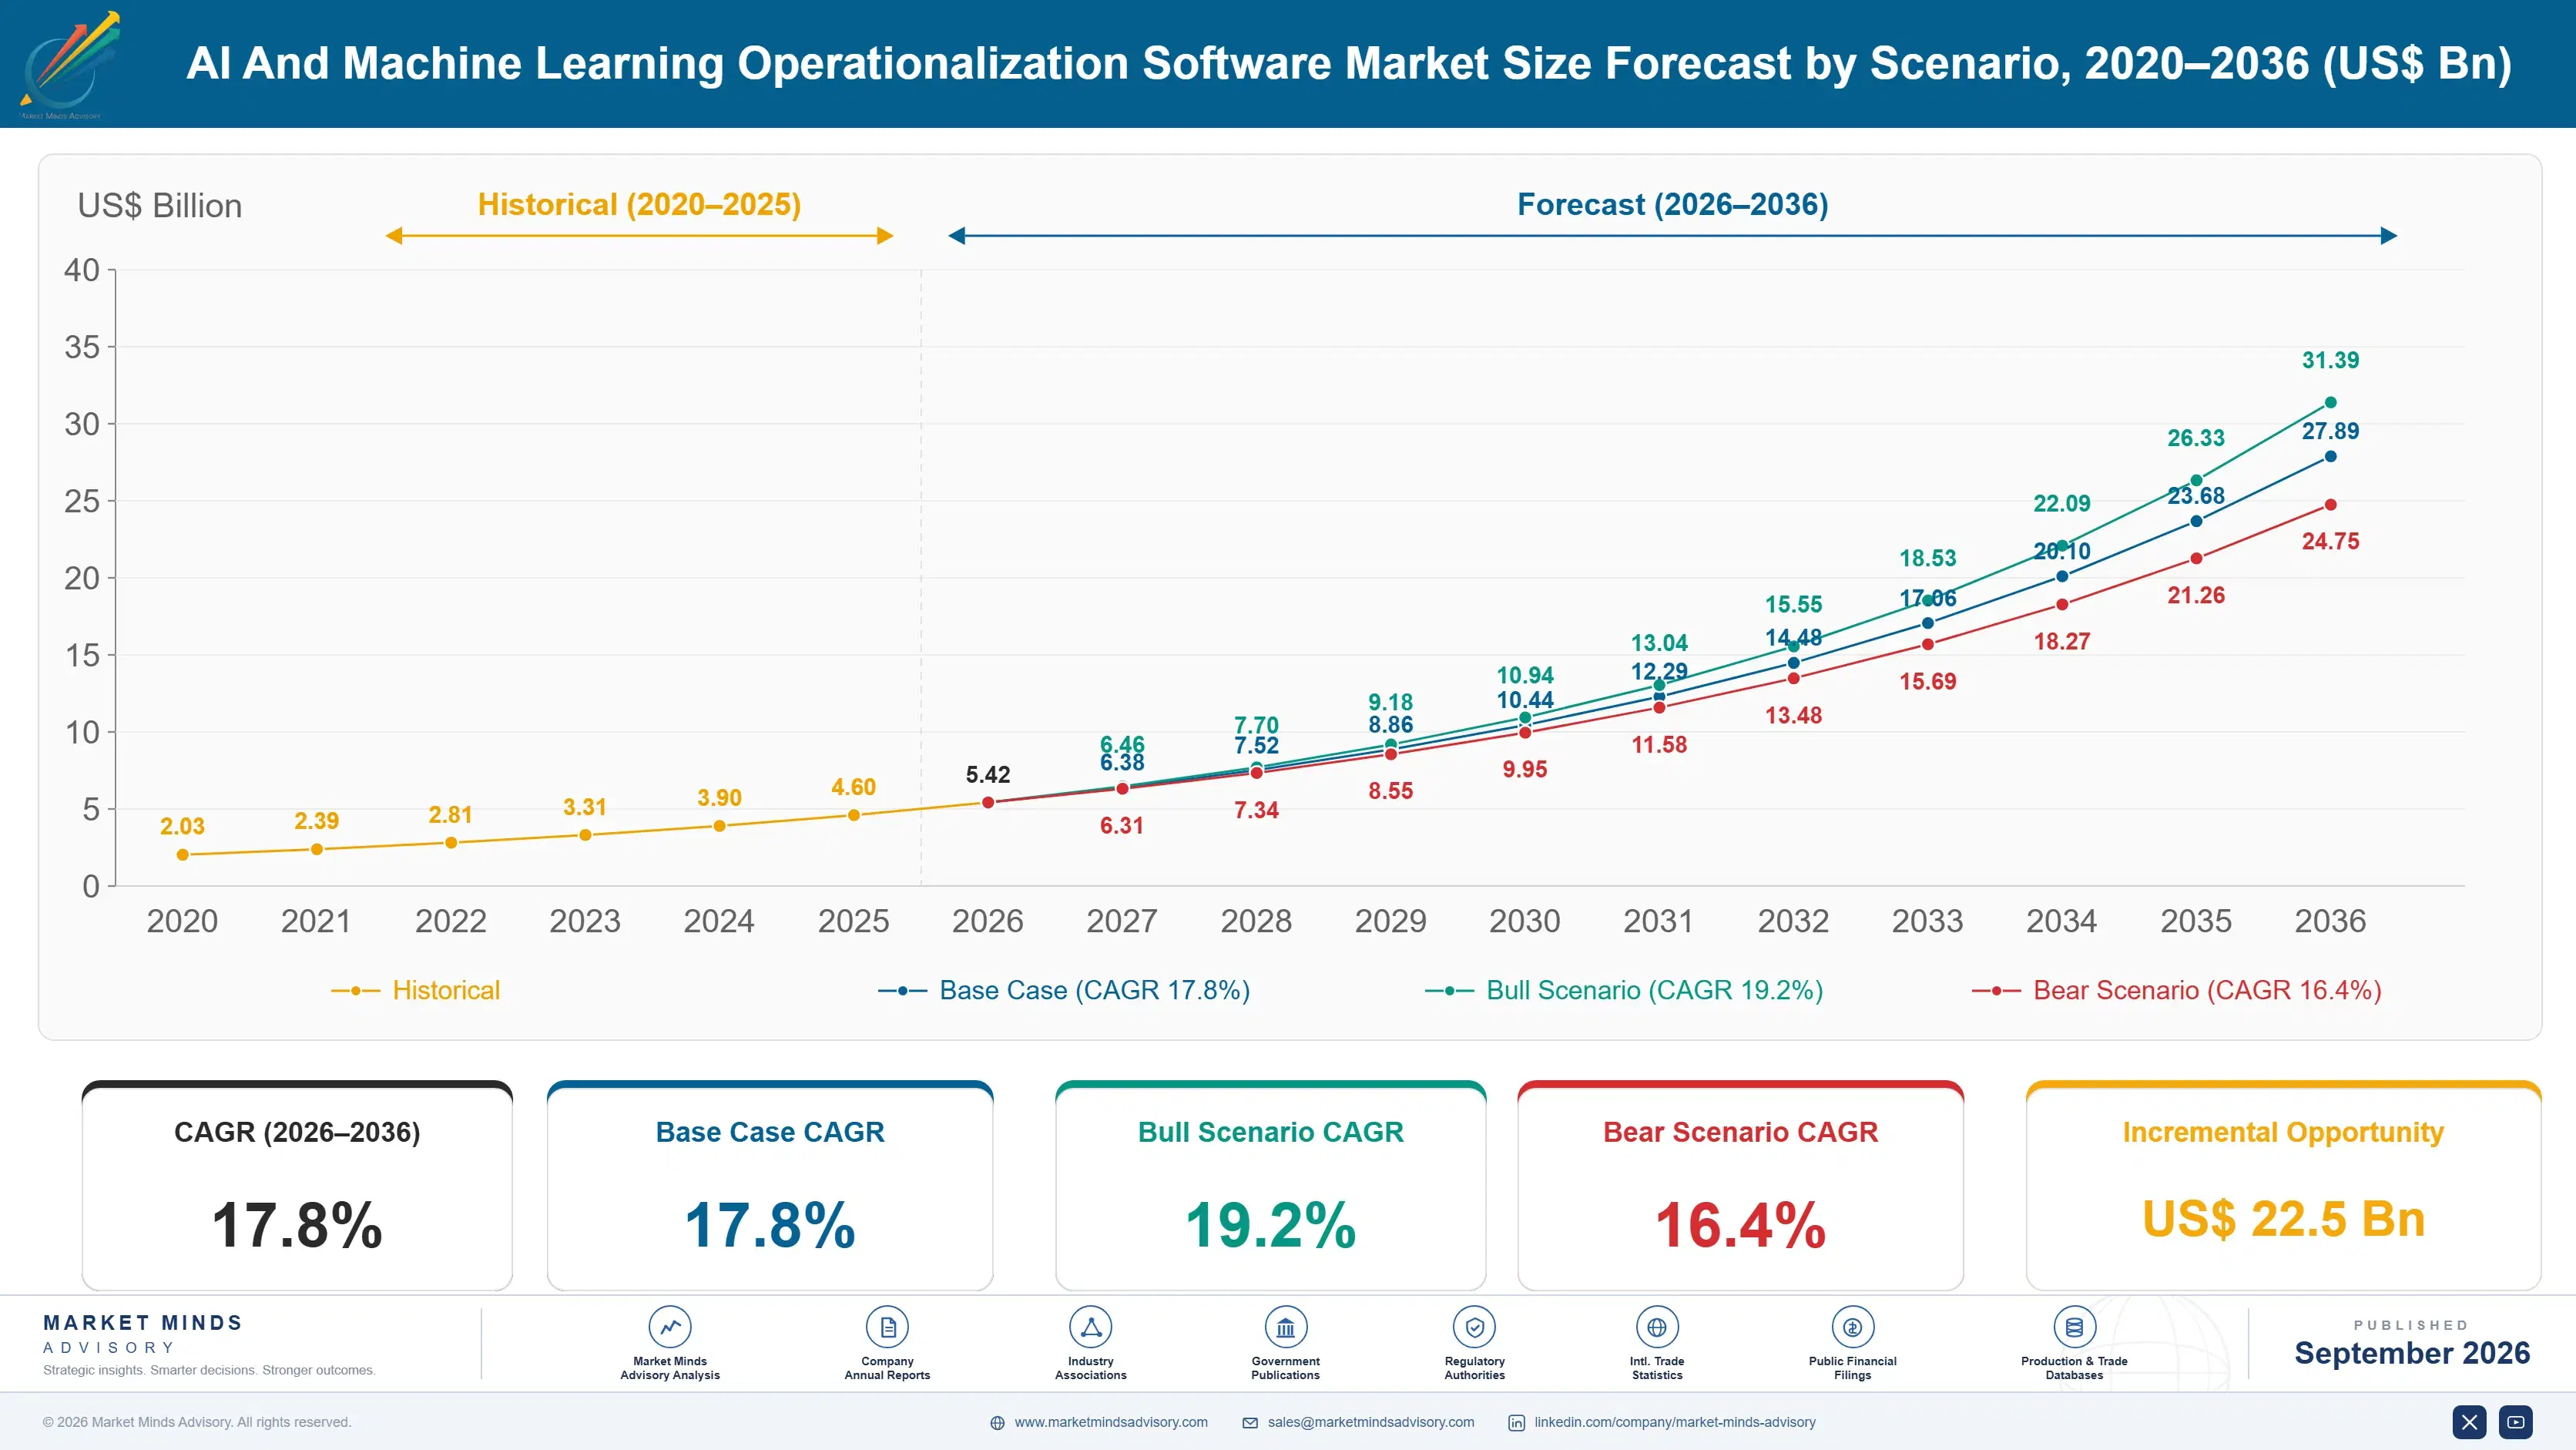
AI And Machine Learning Operationalization Software Market Forecast Scenarios

ai-and-machine-learning-operationalization-softwar-size-forecast-scenario-1788414310434
Between 2020 and 2025 the market compounded at 16.4%, and the composition inverted completely inside that figure. Early growth came from enterprises building their own models and buying tooling for training pipelines, experiment management and feature engineering. From 2023 that demand flattened as generative models made calling somebody else's system the default, and the growth moved to categories that barely existed when the market began.
The 17.8% base case rests on three commercial mechanisms. Inference now consumes around 64% of model spend, which puts a recurring cost in front of a finance function that funds anything reducing it. Regulatory obligations covering roughly 43% of deployments require documented evaluation, monitoring and oversight on a defined timetable. And the shift from training to calling puts far more organisations in scope than were ever going to train anything.
The bull case is regulatory enforcement arriving faster than expected, which would convert governance tooling from a planned purchase into an urgent one across whole industries at once. The bear case is model providers absorbing evaluation, guardrails and cost routing into their own platforms as included features, which would remove the fastest growing categories from independent vendors entirely.

Built For Trainers, Sold To Callers

The tooling most vendors sell was designed for an organisation that trains its own models, and only 21% of enterprises still do. Everyone else calls an interface to a model somebody else trained, so experiment tracking, feature stores and training pipelines answer a question those buyers never ask. Vendors built for the first world compete for a shrinking share of a market that grew past them.
TOP FIVE CONCENTRATION38%Share of measured subscription revenue held by leading platforms
PRODUCTION DEPLOYMENT RATE32%Portion of models built that ever reach production use
INFERENCE SPEND SHARE64%Portion of total model spend consumed after deployment
OWN-MODEL TRAINING SHARE21%Portion of enterprises still training their own foundation models
MODEL REFRESH INTERVAL5 monthsTypical time before a production model is replaced
GOVERNANCE REQUIREMENT COVERAGE43%Portion of deployments falling under formal regulatory obligation
Spend followed the workload downstream. Roughly 64% of what an organisation pays for models is consumed after deployment, at inference, which is a recurring operating cost rather than a project expense and therefore visible to a finance function every month. That makes cost governance and request routing the category with the clearest return in this entire market, which nobody would have predicted when the discipline was named.
The uncomfortable number is that only 32% of models built ever reach production. Vendors and buyers both blame tooling and both are wrong. Organisations staffed a build function and never a run function, so a working model has nobody responsible once the project team disperses. Regulation covering 43% of deployments now forces organisations to name an owner, which helps deployment rates more than any feature.
"The most useful thing that has happened to this market is a regulator requiring somebody's name against a deployed model. Every vendor spent years selling tools for a lifecycle that no organisation had actually staffed, and a compliance obligation fixed the staffing problem that no product ever could."
Director, Enterprise AI Platforms and Governance Practice · MMA Technology and Enterprise Software Practice · September 2026

Market Trends

Evaluation Replaces Training As The Central Workflow

An organisation that trains a model measures it against a validation set and moves on. An organisation calling somebody else's model has no such artefact and must build its own evidence that the system does what the task requires, which means task-specific test sets, human review workflows, regression suites and runtime guardrails. That work did not exist as a tooling category five years ago and is now the fastest growing part of this market at 26.7% against 17.8% overall. Provider models change under customers without warning, which makes continuous evaluation permanent rather than a launch activity.
Market Impact: Replaces models every 5 months
Inference Cost Governance Becomes A Finance Conversation

Around 64% of model spend is consumed at inference, and unlike training it recurs every month and scales with usage rather than with any project decision. Finance functions see it, question it and fund anything that reduces it, which is a far easier sale than productivity tooling has ever been. Routing requests to cheaper models where quality permits, caching repeated queries and compressing prompts all deliver measurable savings against a visible line. The category grows at 24.8% and is unusual in this market for having a buyer who arrives already asking for it rather than needing persuasion.
Market Impact: Causes 5 of 7 failures

Market Opportunities and Growth Drivers

Provider Model Updates Break Applications Without Warning

A model accessed through an interface can change beneath an application when the provider updates it, and behaviour that passed testing last month may fail this month with no code change on the customer side. Typical production models are effectively replaced every 5 months whether the customer chooses it or not. That makes continuous evaluation and regression testing a permanent operational requirement rather than a launch checklist, and it is the single strongest argument any vendor in this market can make to a buyer who has already been surprised once.
Market Impact: Strands 68% of models built

Retrieval Pipelines Become The Real Engineering Problem

Most enterprise applications do not fine-tune anything; they retrieve relevant context and pass it to a general model, which moves the engineering difficulty into chunking, embedding, indexing, ranking and freshness. Those pipelines fail in ways that are hard to detect, because the model produces a fluent answer from poor context rather than an obvious error. Tooling for evaluating and monitoring retrieval quality has become a distinct requirement. This is where most production failures now originate, and where very few organisations have adequate instrumentation. Instrumentation for retrieval quality remains rare in practice.
Market Impact: Threatens 2 fastest segments

Market Restraints and Challenges

Nobody Owns The Model After The Project Ends

Only 32% of models built reach production, and the reason is organisational rather than technical: companies staffed a build function generously and never created a run function, so a working model has no owner once the project team disperses. The root cause is that machine learning arrived through innovation budgets rather than operations budgets. Commercial impact is tooling sold for a lifecycle nobody performs, which shows up as low usage and poor renewals. Mitigation runs through regulatory obligations forcing named accountability, managed service offerings that supply the missing function, and consolidation putting models inside systems operations teams already run.
Market Impact: Grows at 26.7% annually

Model Providers Absorb Categories Into Their Platforms

Evaluation, guardrails, caching and routing are all natural features for a model provider to include, and several have begun doing exactly that at no additional charge. The root cause is that the provider sits closer to the workload than any independent tool and can implement these things more cheaply. Commercial impact falls hardest on single-category vendors in precisely the fastest growing segments. Participants mitigate by supporting multiple providers, which a provider cannot, by building governance evidence that auditors accept independently of the vendor being audited, and by moving into the operational workflow rather than the technical one.
Market Impact: Addresses 64% of model spend
4 additional market trends, 3 additional growth drivers, and 2 additional restraints and challenges are covered in the full report. Contact sales@marketmindsadvisory.com to access the complete intelligence.

Segment CAGR and Growth Architecture

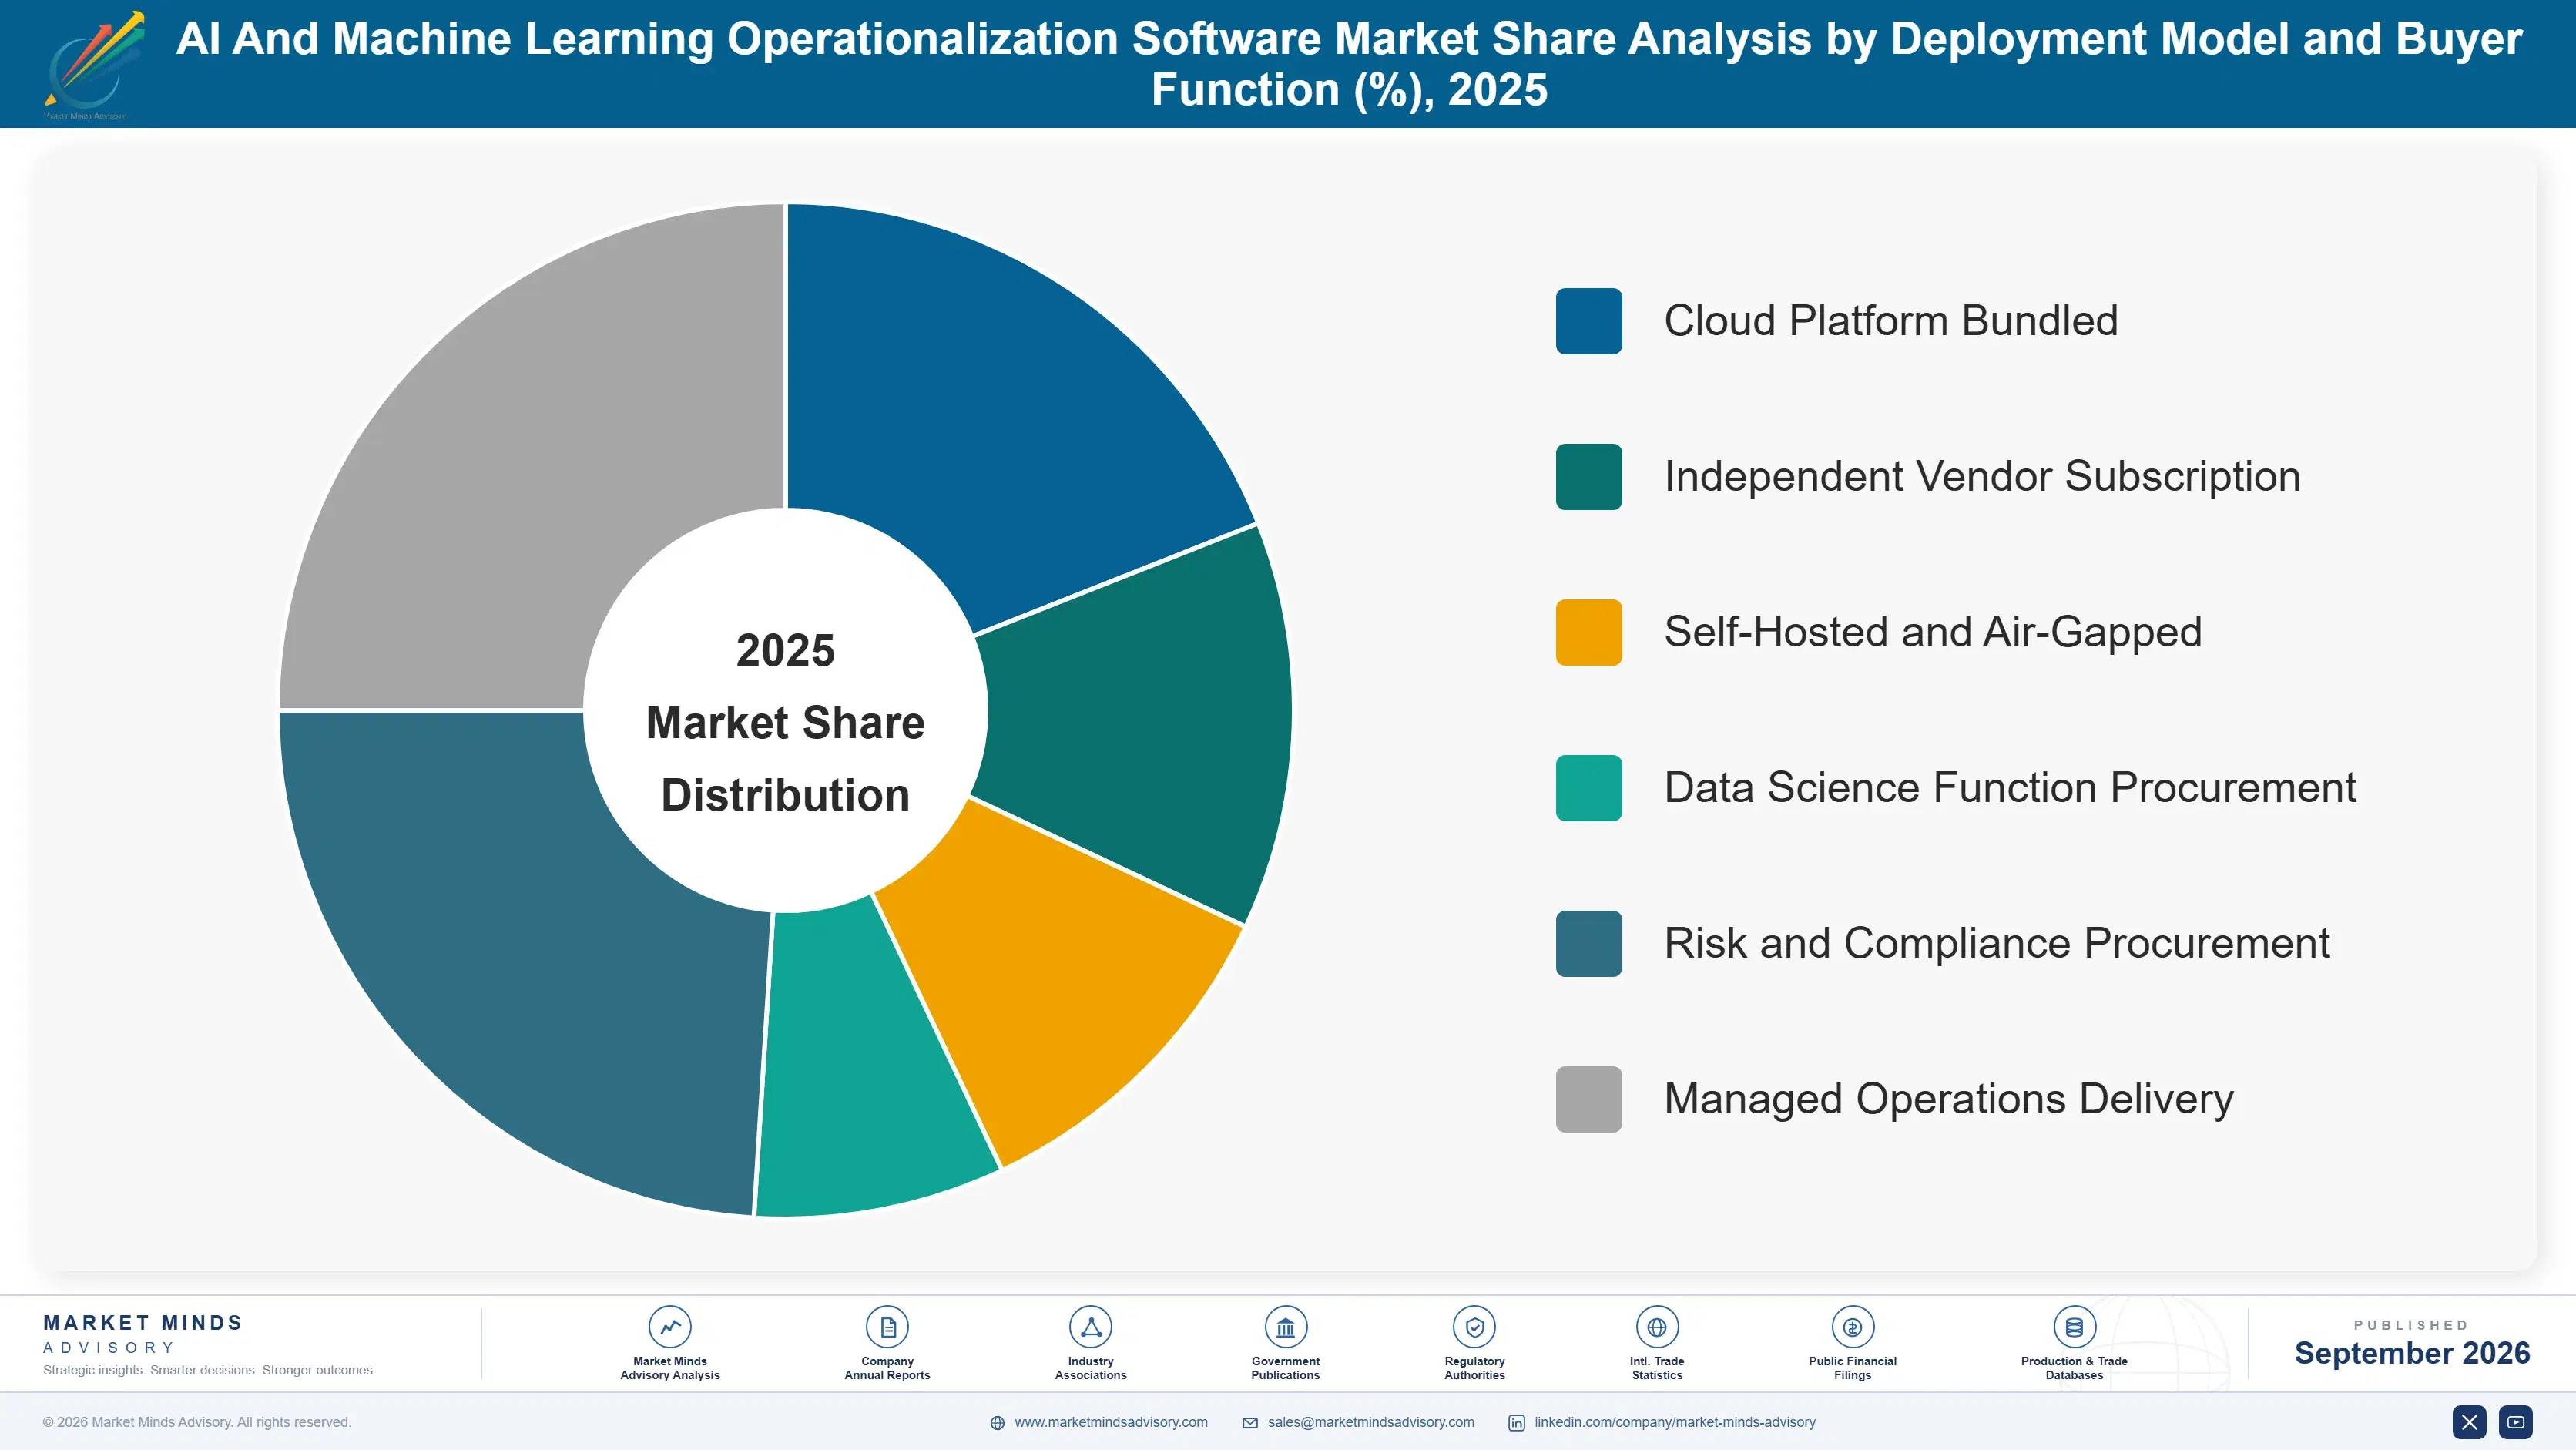
Segmentation follows the tooling function performed, which is how these products are bought and budgeted. Training-era categories such as experiment tracking and feature stores sit alongside deployment-era categories such as evaluation, monitoring and cost governance, and the growth divergence between the two groups is now extreme rather than gradual. Vendors built for one group are now selling to the other.
ai-and-machine-learning-operationalization-softwar-market-share-analysis-1788414310972

Evaluation and Guardrail Tooling

An organisation calling somebody else's model has no validation artefact of its own and must build evidence that the system performs the specific task asked of it, which means task-specific test sets, human review workflows, regression suites and runtime guardrails catching failures before users see them. None of this existed as a purchasable category five years ago. Provider models change beneath applications without warning, roughly every five months, which makes evaluation continuous rather than a launch activity. Growth at 26.7% is half again the market rate of 17.8%. Regulatory obligations requiring documented evaluation are pulling the same category from a second direction entirely. Very little of this tooling existed as a purchasable product.
CAGR 26.7%

Inference Cost Governance and Routing

Roughly 64% of model spend is consumed at inference, recurring monthly and scaling with usage rather than with any project decision, which puts it in front of a finance function that will fund anything reducing it. Routing requests to cheaper models where quality permits, caching repeated queries, compressing prompts and batching non-urgent work all produce savings against a visible line item. Growth at 24.8% reflects a category with a buyer who arrives already asking rather than needing persuasion, which is rare in enterprise software. The risk is that model providers include the same capabilities at no charge and remove the category entirely. Independence from any single provider is the only durable defence.
CAGR 24.8%
Full segment breakdown across 6 segments available in the complete report.

Regional Architecture and Country Demand Map

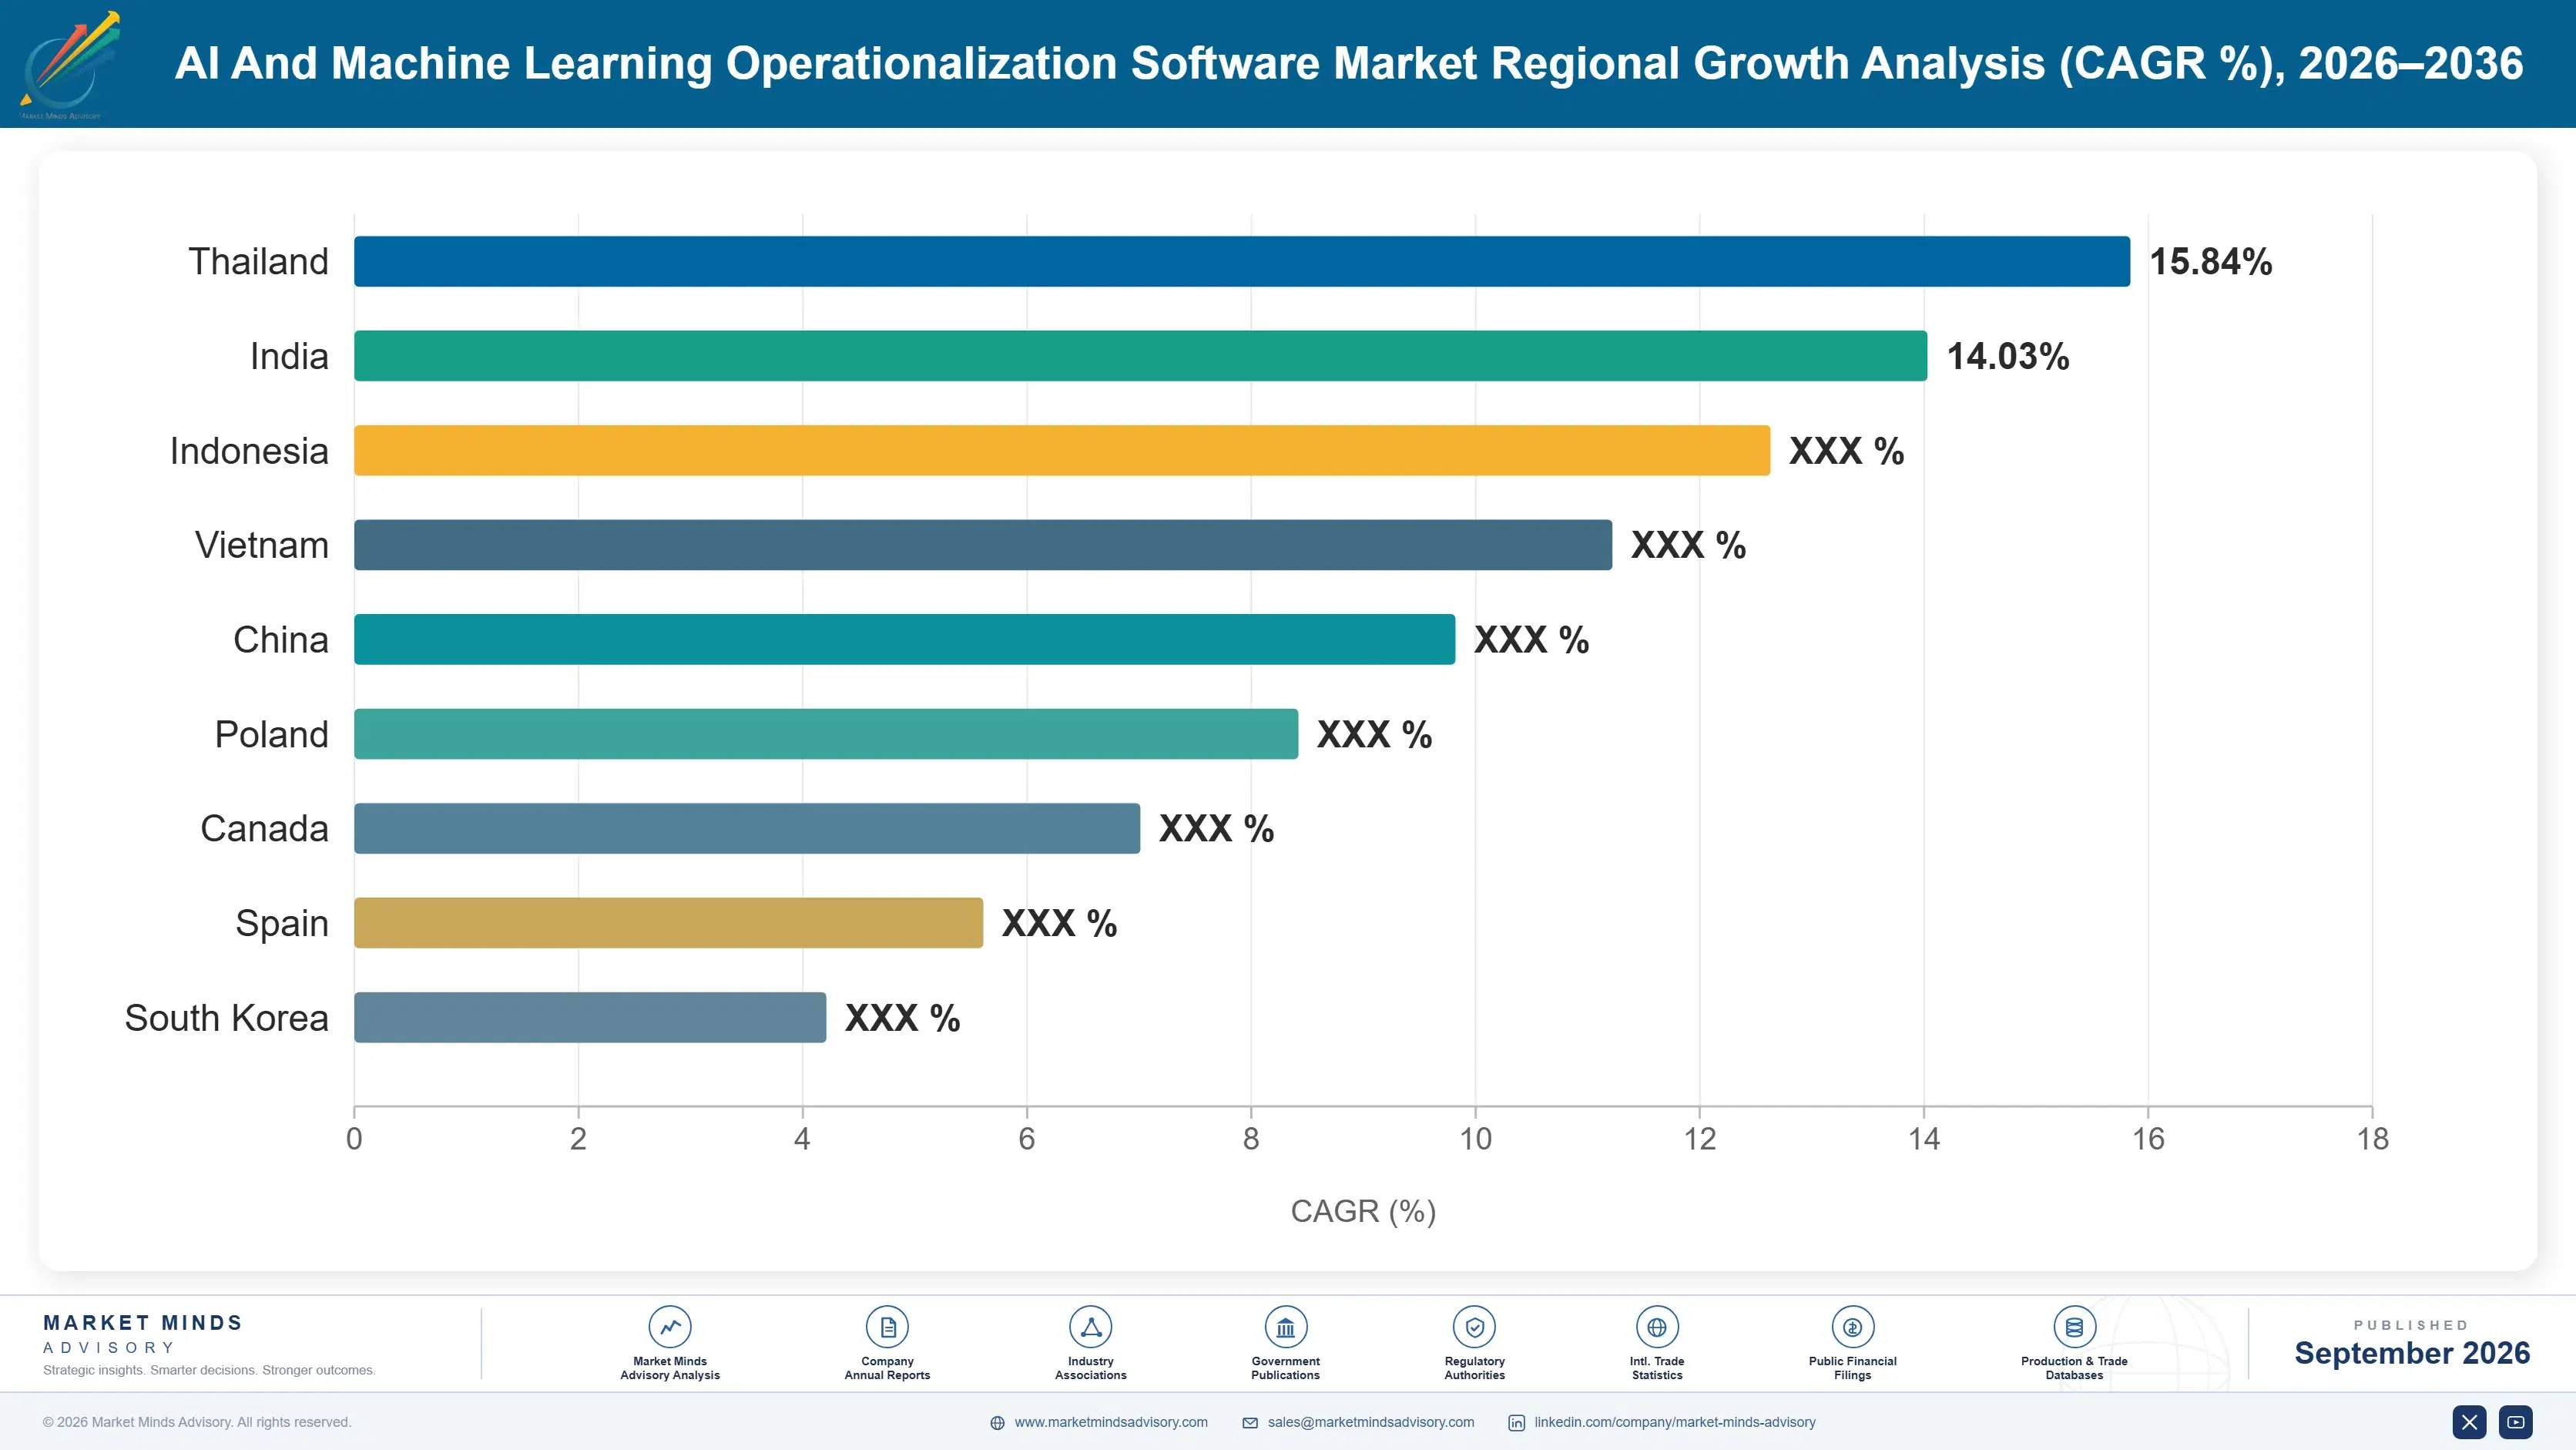
Activity follows where models are built, where they are deployed at scale and where regulatory obligation bites. North America leads on all three simultaneously, holding the model providers, the largest enterprise deployments and most of the vendor base. Deployment volume rather than population decides it.

North America

The model providers, the largest enterprise deployments and most of the vendor base all sit here, which is why North America at 44% stands far above the 32% ceiling of the standard band and why the concentration is genuine rather than a measurement artefact. Financial services and healthcare deployments are the most advanced and the most heavily governed. Inference cost has become a board-level line item at several large technology buyers. Vendor competition is fiercest here, and the platform consolidation that will define this market is happening between companies almost all headquartered within the region. Inference cost has become a board-level line at several large buyers, which is what moved this category out of engineering budgets entirely.
Share: 44% | CAGR: 17.2% (2026 to 2036)

Western Europe

Regulatory obligation is stronger and arrives earlier here than anywhere, which makes governance, documented evaluation and human oversight tooling a compliance purchase rather than a discretionary one. That changes both the buyer and the budget, moving the decision toward risk and legal functions with different approval cycles. Deployment volumes trail North America substantially, partly because enterprises here moved more cautiously into production. Growth of 16.2% is the slowest of any region, reflecting caution rather than any lack of requirement, and vendors selling compliance evidence do considerably better here than those selling engineering productivity. Risk and legal functions rather than engineering teams increasingly hold the budget here, which vendors selling technical capability continue to find uncomfortable.
Share: 20% | CAGR: 16.2% (2026 to 2036)
Regional intelligence for 5 additional markets available in the complete report: East Asia, South Asia and Pacific, Latin America, Middle East and Africa, Eastern Europe. Contact sales@marketmindsadvisory.com.
ai-and-machine-learning-operationalization-softwar-country-cagr-analysis-1788414311505

Where This Software Still Earns

Four positions carry margin in a market whose original premise expired. Each requires abandoning something a vendor built its identity on, which is why the incumbents with the strongest training-era products have adapted slowest and the newest entrants have grown fastest against them. Incumbents have adapted slowest for exactly that reason. Newest entrants grew fastest.

Sell Inference Cost Reduction To Finance

Around 64% of model spend is consumed at inference, recurring monthly and visible to a finance function that will fund anything reducing it without needing to be persuaded of the strategic case. Routing, caching, prompt compression and batching all deliver savings against a line item somebody is already questioning. This is the only category in the market where the buyer arrives asking rather than being convinced, and it is the easiest budget in enterprise software right now. Vendors still leading with engineering productivity are working far harder for smaller deals.
Market Impact: Attacks the 64% of spend consumed at inference

Build Governance Evidence Auditors Actually Accept

Regulatory obligations cover roughly 43% of deployments and require documented evaluation, monitoring, human oversight and named accountability that must satisfy an external reviewer rather than an internal one. Evidence a vendor generates about its own tooling is worth considerably less than evidence structured for an auditor who does not trust either party. Vendors treating this as a reporting feature rather than an evidentiary one lose to those who understood the difference. Compliance budgets are also larger and considerably more durable than innovation budgets. Compliance budgets are larger and considerably more durable than innovation budgets ever were.
Market Impact: Serves the 43% of deployments under formal obligation

Support Every Provider Because Providers Cannot

Model providers are absorbing evaluation, guardrails and routing into their own platforms at no charge, which is unanswerable on price and entirely answerable on scope. A provider will never help a customer route work to a competitor, compare quality across providers or produce independent evidence about its own model. Independence is therefore the only defensible position in the 2 fastest growing segments in this market. Vendors building deeply against a single provider are constructing something that provider will eventually supply free. Scope rather than price is the only available answer here.
Market Impact: Defends the 2 fastest growing segments in this market

Supply The Run Function Nobody Staffed

Only 32% of models reach production because organisations built a build function and never created a run function, so tooling sold into that gap goes unused and renews badly. Managed operations offerings that supply the missing people alongside the software convert a shelf-ware risk into a durable relationship. Margin is lower than pure licensing and retention is far higher, which suits a market where usage rather than purchase is the actual problem. Delivery organisations running operations for many customers are the obvious channel. Usage rather than purchase is the actual problem to solve.
Market Impact: Addresses the 68% of models never deployed at all

Who Controls the Margin Pool

Measured on subscription and licence revenue, the basis used throughout this section, the top five hold 38%. That is fragmented for enterprise software and reflects a market assembled from categories that arrived separately rather than from a single product idea. The gap between leaders and the rest is proximity to where the data and the workload already sit rather than any difference in tooling quality.
Competition runs on breadth of provider support, governance evidence and inference economics rather than on training workflow features that a shrinking share of buyers uses. Cloud and data platform vendors bundle capability into relationships they already hold. Specialist vendors compete on depth and on independence from any single model provider. Delivery organisations in India increasingly influence tooling selection across many end customers at once.

Pressure builds from two directions. Model providers are absorbing evaluation, guardrails and routing into their platforms at no charge, which threatens exactly the fastest growing categories. And platform consolidation continues, with data platforms acquiring the operational tooling their customers were buying separately. Rankings shift where vendors abandoned training-era products early and built independence and governance evidence instead of deeper engineering features.
ai-and-machine-learning-operationalization-softwar-company-positioning-matrix-1788414312032

Competitive Moat and Risk Dimensions

DATABRICKS

Moat: Proximity to enterprise data

Operational tooling sits alongside the data platform enterprises already run, which removes the integration work that independent products require and makes the purchase an extension of an existing relationship rather than a new one. Governance and lineage capability built for data extends naturally to models. Displacing this means displacing the data platform, which enterprises very rarely attempt mid-cycle.
DATABRICKS

Risk: Training-era product weighting

A meaningful share of the portfolio addresses training workflows that only 21% of enterprises still perform, and that demand is flattening rather than growing. The fastest categories are contested by specialists closer to the inference workload. Breadth also creates a slower response to categories that appear and mature within eighteen months, which several have now done in this market.
AMAZON WEB SERVICES

Moat: Infrastructure and model adjacency

Owning both the compute the models run on and a model access layer gives visibility into inference economics that independent tooling can only infer, and operational capability can be bundled into consumption agreements enterprises have already signed. Scale allows features to be included free that specialists must charge for. Procurement relationships are already in place across almost every large buyer.
AMAZON WEB SERVICES

Risk: Independence buyers increasingly want

A vendor selling both models and the tooling that evaluates them cannot credibly produce independent evidence about model quality, and regulated buyers and their auditors increasingly notice that. Multi-provider support is commercially awkward when one provider is the vendor itself. Buyers pursuing cost routing across competing providers will not use tooling supplied by one of them.

Players Tracked

Prominent Players

Databricks
Amazon Web Services
Microsoft
Google Cloud
Weights and Biases

Other Key Players

DataRobot
Dataiku
H2O.ai
Domino Data Lab
Snowflake
IBM
Arize AI
Fiddler AI
WhyLabs
Comet ML
Seldon
BentoML
Tecton
LangChain
Anyscale

Recent Developments

AUGUST 2025

European obligations for high-risk systems enter application phase

Obligations covering high-risk artificial intelligence systems moved into application, requiring documented evaluation, ongoing monitoring, human oversight and named accountability for deployed models. Organisations were required to identify a responsible person for each system rather than leaving ownership with a dispersed project team. Timetables were fixed rather than advisory.
Signal: A regulator did what no product ever managed, which was forcing somebody to own a model after launch.
FEBRUARY 2025

Platform vendor acquires model evaluation tooling company

A data platform vendor acquired an evaluation and observability specialist, an acquisition rather than any joint venture or partnership. The stated reasoning was customer demand for evaluation capability alongside existing data and deployment tooling rather than purchased separately from a third party. Customer demand was cited explicitly.
Signal: Platform consolidation is absorbing the categories that grew fastest, exactly as it did in data tooling before.
MAY 2025

Model provider publishes cached and batch inference pricing tiers

A leading model provider introduced differentiated pricing for cached context and batched non-urgent requests, a pricing decision rather than any corporate transaction. The tiers made cost optimisation an explicit engineering choice rather than a matter of reducing usage, which changed how buyers approached inference spend.
Signal: Once providers price optimisation explicitly, cost governance stops being clever and becomes entirely ordinary engineering practice.

Engineering Labour And Inference Compute

Research and engineering labour accounts for roughly 52% of vendor cost, inference and evaluation compute around 21%, cloud hosting and infrastructure near 13%, and sales, compliance and overhead the balance. The compute component is unusual for enterprise software, because evaluation and guardrail products consume accelerator time on behalf of customers rather than merely orchestrating work somebody else pays for.
Machine learning engineering compensation rose steeply as model providers and large technology companies competed for the same people, with United States Bureau of Labor Statistics occupational data showing sustained wage growth across relevant categories. Accelerator availability tightened simultaneously, and SEMI industry reporting documented capacity constraints through the period. Vendors offering evaluation as a service absorbed both pressures directly into cost of delivery. Both arrived at once and neither has eased.

The disadvantage mechanism is product architecture rather than scale. A vendor whose product runs evaluation on its own infrastructure carries compute cost that scales with customer usage; one that orchestrates evaluation inside the customer's own environment does not. That difference decides gross margin more than any pricing decision. Vendors owning infrastructure include these features at no charge, which independent vendors cannot match and should not attempt to.
ai-and-machine-learning-operationalization-softwar-cost-volatility-analysis-1788414312227

Run evaluation inside customer infrastructure

Orchestrating evaluation within the customer's own environment rather than on vendor infrastructure moves compute cost to the party already paying for accelerators and removes the margin exposure entirely. It complicates the product and the support burden considerably, and it is what separates vendors with durable gross margin from those whose costs scale with customer success.

Tiered pricing linked to evaluation volume

Pricing that scales with evaluation runs rather than seats aligns revenue with the compute a customer actually consumes, which protects margin as usage grows. Buyers dislike consumption pricing on principle and accept it once they understand what drives the cost, so the explanation matters more than the pricing structure itself does. Explanation matters most here.

Model distillation for routine evaluation work

A great deal of evaluation is repetitive classification that a small specialised model performs adequately at a fraction of the cost of calling a large general one. Distilling those judgements into smaller models cuts delivery cost substantially, and it requires machine learning capability that pure tooling vendors have often chosen not to build. Few tooling vendors build it.

Portfolio Architecture for Margin Defence

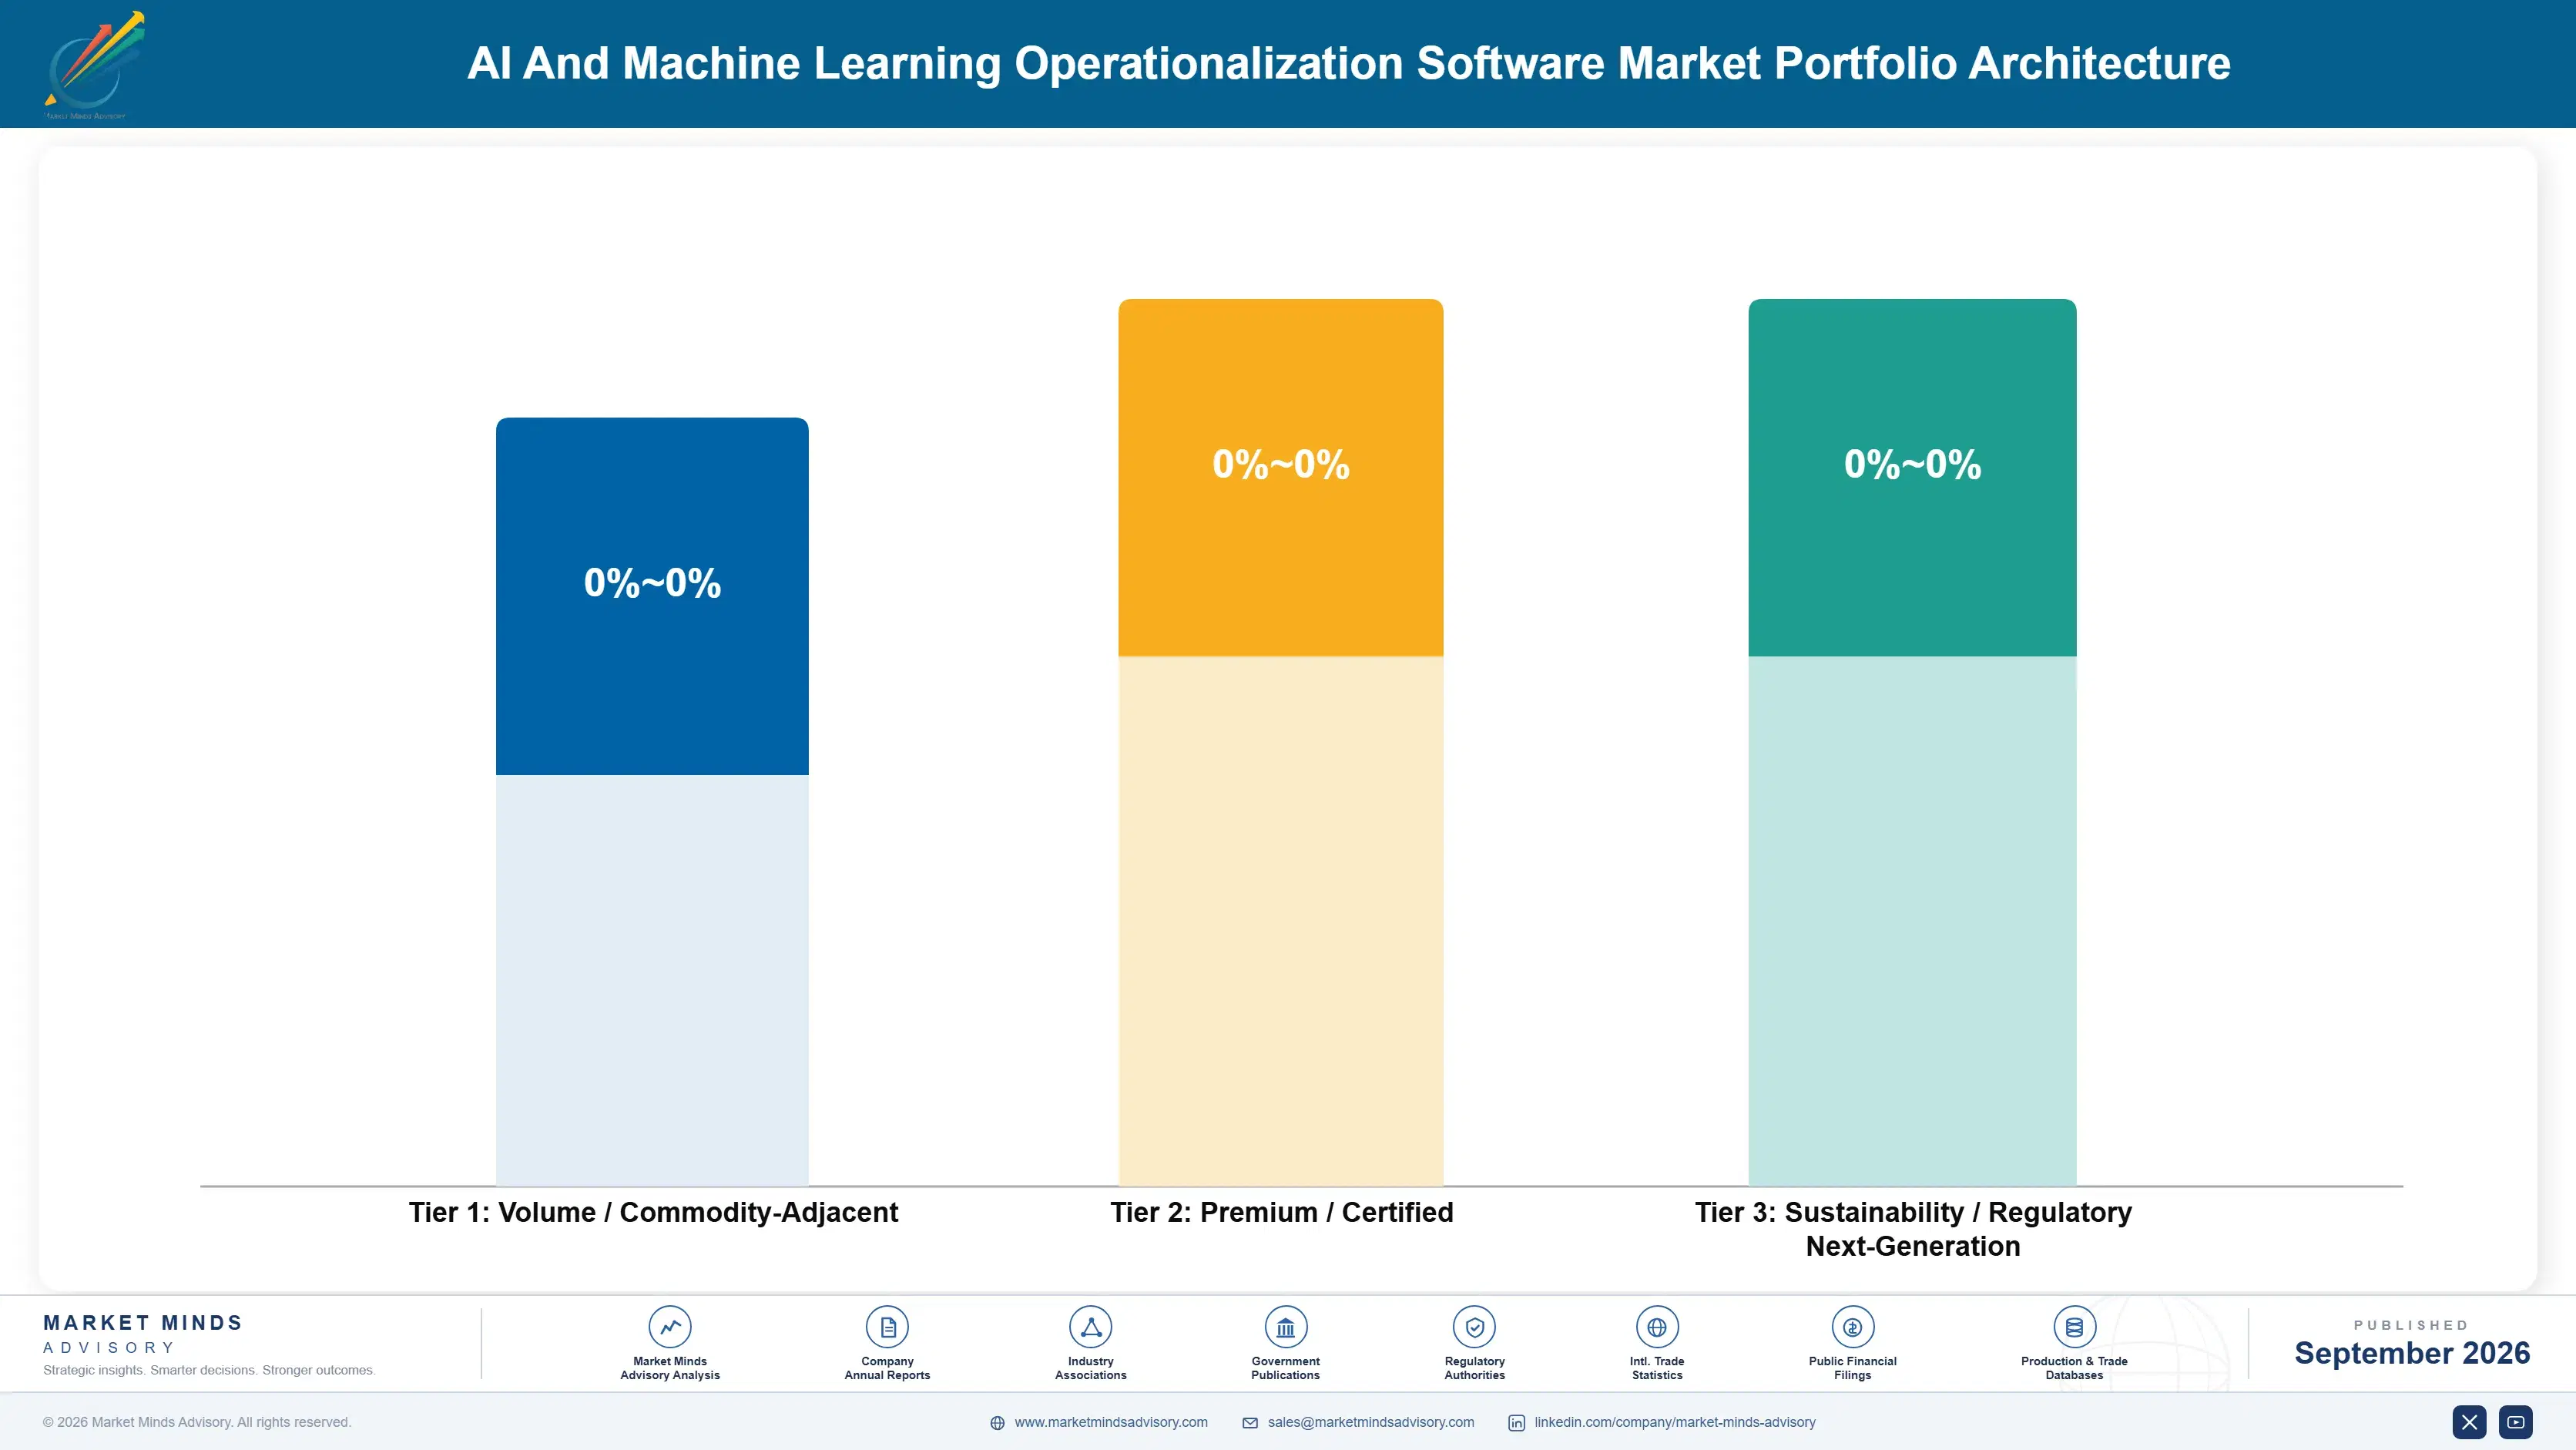
Margin separates by whether the vendor carries compute on the customer's behalf. Products that orchestrate work inside the customer environment scale like software and hold high gross margin. Products that run evaluation, guardrail checks or routing on vendor infrastructure carry a cost that grows with customer success, which inverts the usual software relationship and surprises vendors who priced on seats rather than on consumption.
The volume against premium tension runs between training-era and deployment-era portfolios. Training tooling still generates renewals from the 21% of enterprises that build their own models, and those customers are sophisticated and profitable, so abandoning them is expensive. But that base is flat while deployment categories grow above 24%, and engineering attention spent maintaining the old portfolio is attention not spent contesting the new one. Most incumbents are managing this badly.

High-value pools sit where independence or obligation creates the barrier: multi-provider evaluation, governance evidence structured for external auditors, and cost routing across competing providers. A model provider cannot credibly occupy any one of the three, which is what makes them defensible against the competitor with unlimited resources. The pools are narrow and carry most of the market's defensible margin.

Volume / Commodity-Adjacent

Experiment tracking, feature stores and training pipeline tooling sold to the shrinking population that trains its own models. Renewals continue from a sophisticated base, but growth has flattened and platform vendors bundle comparable capability freely.
Gross Margin: 48 to 60%

Premium / Certified

Deployment serving, monitoring and drift observability sold to organisations running models in production. The 12 point range reflects whether evaluation compute runs on vendor infrastructure or inside the customer environment.
Gross Margin: 62 to 74%

Sustainability / Regulatory / Next-Generation

Governance evidence for regulated deployments, multi-provider evaluation and inference cost routing. The 14 point range reflects how completely a regulatory obligation or an independence requirement changes pricing power against a discretionary purchase.
Gross Margin: 70 to 84%
ai-and-machine-learning-operationalization-softwar-portfolio-architecture-1788414312736

High-value Sub-segments and Strategic Watch-out

Multi-Provider Evaluation Tooling

Highest value position and the one a model provider simply cannot occupy, since no provider will produce independent evidence comparing its own model unfavourably with a competitor's. Independence rather than technology is the entire product here. Regulated buyers and their auditors have begun noticing exactly that.
Gross Margin: 72 to 84%

Regulated Governance Evidence

Bought by risk and compliance functions holding larger and more durable budgets than innovation teams, and required rather than chosen across 43% of deployments. Evidence here must satisfy an external auditor rather than any internal reviewer. That distinction decides which vendors survive an audit conversation.
Gross Margin: 70 to 82%

Inference Cost Routing

The only category where the buyer arrives already asking, since 64% of model spend recurs monthly in front of a finance function. The risk is that providers include equivalent capability at no charge and close the category entirely. Buyers here arrive already asking rather than needing persuasion.
Gross Margin: 64 to 76%

Training Workflow Tooling

Serves the 21% of enterprises still training their own models, a base that is sophisticated, profitable and no longer growing. Renewals continue, but engineering investment here is attention diverted from categories growing three times faster. Engineering attention spent here is attention not spent contesting the new categories.
Gross Margin: 48 to 60%

Who Owns The Model In Production

Annuity economics here are unusually fragile for enterprise software, because renewal depends on usage, and usage depends on a function most organisations never staffed. Where a run function does exist, renewal is close to automatic and expansion follows deployment count. Where it does not, the tooling sits unused and the renewal conversation goes badly, which is why net retention here varies far more widely than in comparable categories.
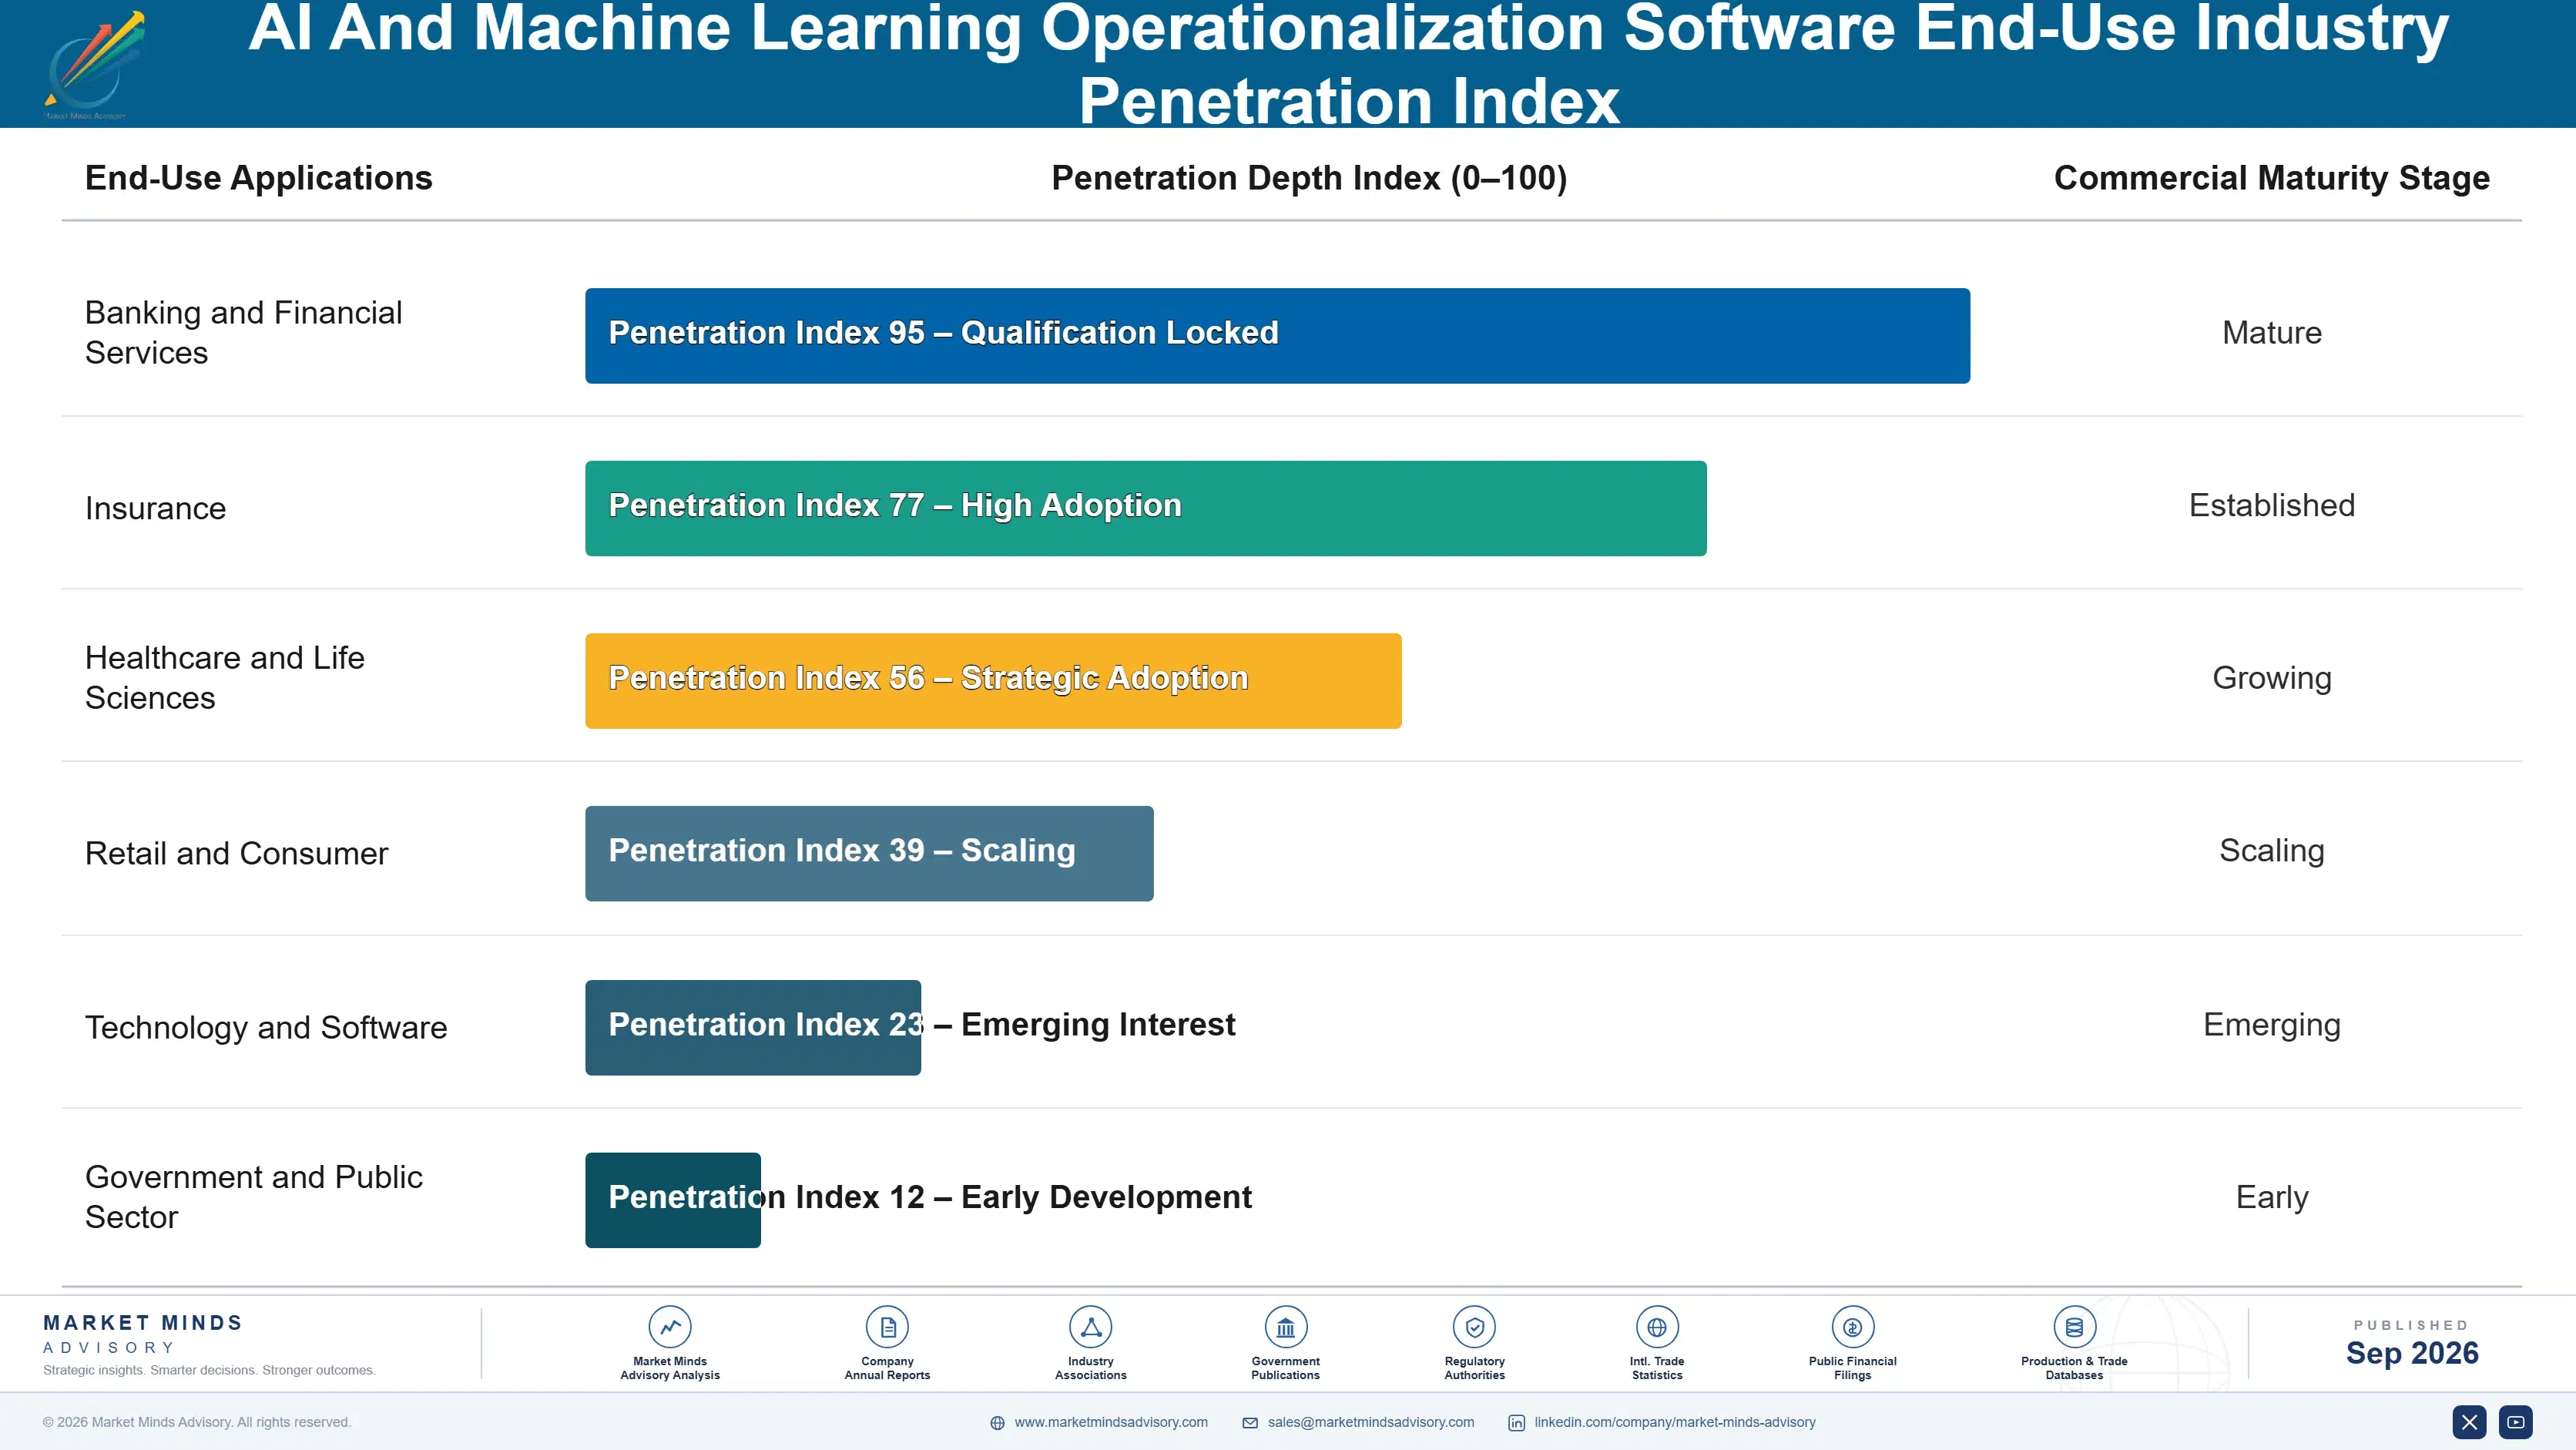
Adoption depth varies sharply by buyer maturity. Organisations with a genuine operations function specify deeply, integrate tooling into incident processes and expand steadily. Regulated buyers adopt governance capability thoroughly because an auditor will examine it. Organisations still running models out of innovation teams buy tooling that gets used during the project and abandoned afterwards, and they represent a considerable share of every vendor's disappointing renewals.

The buyer profile has moved twice in five years. It began with data science leaders buying experiment tooling, moved to platform engineering buying deployment infrastructure, and now sits with risk, compliance and finance buying governance evidence and cost control. Each shift changed the language, the approval cycle and the budget size, and vendors that missed the second shift are not positioned for the third.
ai-and-machine-learning-operationalization-softwar-end-use-penetration-index-1788414313231

Where Vendors Should Compete

These are among the four positions where our research anticipates prominent divergence between winners and laggards over the coming forecast period. Each is grounded in the demand model, the regulatory perimeter, and the announced capacity pipeline.
01 / INFERENCE ECONOMICS FOCUS

Sell the monthly bill, not the engineering workflow

Roughly 64% of model spend is consumed at inference, recurring every month and sitting visibly in front of a finance function that will fund anything credibly reducing it at all. Routing, caching, prompt compression and batching all produce savings against a line item somebody is already questioning without any prompting. This is the only category in the market where the buyer arrives asking rather than needing persuasion, and vendors still leading with engineering productivity work considerably harder for smaller deals.
02 / INDEPENDENCE AS POSITION

Compete on what providers genuinely cannot offer

Model providers are absorbing evaluation, guardrails and routing into their own platforms at no charge, which cannot be answered on price at all and can be answered completely on scope. No provider will help a customer route work to a competitor, compare quality across providers or produce independent evidence about its own model. Independence is therefore the only defensible position in the two fastest growing segments, and vendors building deeply against one provider are constructing something that provider will eventually supply free.
03 / AUDIT EVIDENCE DESIGN

Build proof for external reviewers, not internal dashboards

Regulatory obligations now cover roughly 43% of deployments and demand documented evaluation, monitoring, human oversight and named accountability that must satisfy somebody entirely outside the organisation itself. Evidence a vendor generates about the adequacy of its own tooling is worth considerably less than evidence structured for a reviewer who trusts neither of the parties involved here. Vendors treating this as a reporting feature rather than an evidentiary one lose consistently to those who understood that distinction early enough to build for it.
04 / RUN FUNCTION SUPPLY

Sell the people alongside the tools that need them

Only around 32% of models built ever reach production, and the obstacle is that organisations staffed a build function generously while never creating any run function at all. Tooling sold into that particular gap goes unused and renews badly, which explains the net retention variance visible across this market far better than any product difference does. Managed operations offerings that supply the missing people convert a shelf-ware risk into a durable relationship at lower margin and at considerably higher retention.

Engagement Snapshot From the Field

A live engagement with an industry participant carrying material or product regulatory and market exposure ahead of a defining policy shift, showing how our research translates into a defensible multi-year portfolio strategy.
MARKET MINDS ADVISORY · CLIENT ENGAGEMENT SUMMARY
AI And Machine Learning Operationalization Software Producer Strategic Portfolio Review and Transition Roadmap 2026·Investment Scenario on AI And Machine Learning Operationalization Software Exposure Evaluation 2025-26
CLIENT PROFILE
A global insurance group operating across eleven markets with annual revenue reported at approximately USD 14 billion (client-reported, unverified by MMA). The group had built more than sixty machine learning models across underwriting, claims and pricing functions over four years, and had purchased operational tooling from three separate vendors on overlapping and largely unreviewed subscriptions.
STRATEGIC CHALLENGE
Fewer than a third of the models built had reached production, and none of the three tooling investments had improved that. Incoming regulatory obligations would require documented evaluation and named accountability for the models that did run. Management could not tell whether the problem was the tooling, the models themselves or something else entirely.
MMA APPROACH
MMA traced every model built over the four year period from inception to its current state, established who was accountable for each production model, benchmarked the group's tooling spend and usage against comparable insurers, and assessed which incoming regulatory obligations would apply to which deployments and when. Vendor usage data was examined directly.
KEY FINDINGS
  1. Only 32% of models built had reached production, and in every stalled case the project team had dispersed before anyone was named as owner of the resulting system.
  2. Two of the three tooling subscriptions were substantially unused, purchased by innovation teams that no longer existed and renewed automatically without any review.
  3. Inference spend across production models had grown to consume roughly 64% of total model cost and had never been reported to the finance function in any form.
  4. Incoming regulatory obligations would cover 43% of production deployments and required evidence the group could not currently produce for any of them.
CLIENT PROFILE
A global insurance group operating across eleven markets with annual revenue reported at approximately USD 14 billion (client-reported, unverified by MMA). The group had built more than sixty machine learning models across underwriting, claims and pricing functions over four years, and had purchased operational tooling from three separate vendors on overlapping and largely unreviewed subscriptions.
STRATEGIC CHALLENGE
Fewer than a third of the models built had reached production, and none of the three tooling investments had improved that. Incoming regulatory obligations would require documented evaluation and named accountability for the models that did run. Management could not tell whether the problem was the tooling, the models themselves or something else entirely.
MMA APPROACH
MMA traced every model built over the four year period from inception to its current state, established who was accountable for each production model, benchmarked the group's tooling spend and usage against comparable insurers, and assessed which incoming regulatory obligations would apply to which deployments and when. Vendor usage data was examined directly.
KEY FINDINGS
  1. Only 32% of models built had reached production, and in every stalled case the project team had dispersed before anyone was named as owner of the resulting system.
  2. Two of the three tooling subscriptions were substantially unused, purchased by innovation teams that no longer existed and renewed automatically without any review.
  3. Inference spend across production models had grown to consume roughly 64% of total model cost and had never been reported to the finance function in any form.
  4. Incoming regulatory obligations would cover 43% of production deployments and required evidence the group could not currently produce for any of them.
RECOMMENDED STRATEGY
Phase 1: Phase one: create a permanent model operations function with named accountability for every production model before purchasing any further tooling at all. Phase 2: Phase two: consolidate to a single evaluation and governance platform structured to produce evidence an external auditor will accept without argument. Phase 3: Phase three: report inference spend to the finance function monthly and implement routing and caching against the highest volume workloads.
OUTCOME
Within twelve months the group had named owners for every production model, raised the deployment rate from 32% to 51%, and cut inference spend by 27% through routing and caching (client-reported, unverified by MMA). Regulatory evidence production is now automated and the two unused subscriptions were terminated.

Frequently Asked Questions

Foundational context covering the market sizes, CAGR, scope, country, region and competition that inform every finding below. This section is provided to cover basics and most often pre-purchase conversations, answered from the MMA Primary Research Dataset.

What is the current size of the AI And Machine Learning Operationalization Software Market?

The market was valued at USD 4.6 billion in 2025 and reaches USD 5.42 billion in 2026. Growth has moved decisively from training tooling to deployment and governance categories.

How large will the AI And Machine Learning Operationalization Software Market be by 2036?

MMA forecasts USD 27.89 billion by 2036, an increase of USD 22.47 billion over the 2026 base. That represents an expansion multiple of 5.15 times.

What is the CAGR for the AI And Machine Learning Operationalization Software Market 2026 to 2036?

The base case CAGR is 17.8%, with a bull case of 19.2% and a bear case of 16.4%. The historical rate between 2020 and 2025 was 16.4%.

Which segment is growing fastest?

Evaluation and guardrail tooling grows at 26.7%, half again the market rate of 17.8%. A model somebody else trained still has to be tested against the specific task.

Who are the major companies in the AI And Machine Learning Operationalization Software Market?

Databricks, Amazon Web Services, Microsoft, Google Cloud and Weights and Biases lead on measured subscription revenue. Together they account for roughly 38% of the market.

Which country is growing fastest?

India grows fastest at 24.6%, through technology services firms and captive centres that run a very large share of all enterprise model operations work worldwide.

Report Segmentation Architecture

The full report scope spans multiple orthogonal segmentation dimensions, with cross-tabulated demand data provided for each dimension pair. Coverage extends further to regional breakdowns, trend trajectories, and the competitive detail needed to support segment-level decision-making.

By Tooling Function

  • Experiment Tracking and Training Pipelines
  • Feature Stores and Data Preparation
  • Model Registry and Deployment Serving
  • Monitoring and Drift Observability
  • Evaluation and Guardrail Tooling
  • Inference Cost Governance and Routing

By End-Use Industry

  • Banking and Financial Services
  • Insurance
  • Healthcare and Life Sciences
  • Retail and Consumer
  • Technology and Software
  • Government and Public Sector

By Deployment Model and Buyer Function

  • Cloud Platform Bundled
  • Independent Vendor Subscription
  • Self-Hosted and Air-Gapped
  • Data Science Function Procurement
  • Risk and Compliance Procurement
  • Managed Operations Delivery

By Region

  • North America
  • Western Europe
  • East Asia
  • South Asia and Pacific
  • Latin America
  • Middle East and Africa
  • Eastern Europe

Scope, Methodology, and Coverage

Every figure in this report is reproducible from documented input assumptions. The scope below maps the historical period, the forecast horizon, the segmentation dimensions, and the countries covered, alongside the underlying primary and qualitative methodology.
Historical Period
2020 to 2025
Forecast Period
2026 to 2036
Base Year
2025 (USD billions; MMA Primary Research Dataset, September 2026)
Market Definition
The AI and machine learning operationalization software market covers tooling that takes models into production and keeps them working, spanning experiment tracking and training pipelines, feature stores and data preparation, model registry and deployment serving, monitoring and drift observability, evaluation and guardrail tooling, and inference cost governance and routing. Sizing is measured at vendor subscription and licence revenue. Foundation model access charges, underlying compute and storage consumption, data platforms sold independently, annotation services and consulting delivery are excluded.
Quantitative Units
USD billions at vendor subscription and licence revenue, with supporting production deployment counts and inference spend by region
Segmentation Dimensions
Tooling function, end-use industry, deployment model and buyer function, region
Regions Covered
North America, Western Europe, East Asia, South Asia and Pacific, Latin America, Middle East and Africa, Eastern Europe
Countries Covered
United States, Canada, United Kingdom, Germany, France, Netherlands, Ireland, Poland, China, Japan, South Korea, India, Singapore, Australia, Brazil, Mexico, Israel, United Arab Emirates
Key Companies Profiled
Databricks, Amazon Web Services, Microsoft, Google Cloud, Weights and Biases, DataRobot, Dataiku, H2O.ai, Domino Data Lab, Snowflake, IBM, Arize AI, Fiddler AI, WhyLabs, Comet ML, Seldon, BentoML, Tecton, LangChain, Anyscale
Quantitative Methodology
Primary survey, n=3,800 respondents, Q4 2025, six countries; demand-side model with trade association cross-validation
Qualitative Methodology
47 expert interviews, Q4 2025; applied to validate demand model assumptions, identify emerging dynamics, and assess competitive positioning
Report Format
PDF and XLSX data workbook (Word format preview document)
Publisher
Market Minds Advisory
Report Code
MMA-2026-TEC-631
Published
September 2026
Contact
sales@marketmindsadvisory.com | www.marketmindsadvisory.com

Purchase the full AI And Machine Learning Operationalization Software Market Report (2026 to 2036).

The full report separates training-era tooling from deployment-era tooling throughout, which is the distinction that explains why a fast-growing market contains large categories going nowhere. It sizes six tooling functions with individual growth rates, seven regions built from deployment volume and regulatory obligation, and the ownership gap that keeps most models from ever reaching production. Competitive analysis covers twenty vendors on a consistent subscription revenue basis, with provider independence and governance evidence treated as the decisive variables. Input cost modelling breaks out engineering labour and inference compute exposure by product architecture.
Six tooling functions with individual growth rates
Training-era and deployment-era demand sized separately
Production deployment rates mapped by industry
Regulatory obligation coverage across deployment types
Twenty vendors on consistent subscription revenue basis
Engineering labour and inference compute cost exposure

Built For The People Who Decide

From boardroom strategy to bench-side execution, this report is read cover-to-cover by leaders shaping the next decade of their industry, turning demand scenarios, market dynamics and valuation benchmarks into decisions.
CXOs/ Presidents/ VPs/ Managers
M&A and Corporate Development
Strategy Teams and R&D Heads
Procurement and Product Directors
Regulatory and Compliance Leaders
Investor Relations and Equity Analysts