Market Minds Advisory
Agrochemical Additives Market

Agrochemical Additives Market: Precision Application and the Adjuvant Efficacy Premium

Row-crop growers are paying up for drift-control adjuvants that let precision sprayers hit efficacy targets at lower active-ingredient rates, as Chinese surfactant pricing compresses margins across the commodity end of the stack.

Lead Analyst

Bilal Shaikh

Published

September 2026

Make Smarter Decisions with Customized Research Insights

Request a free sample report and evaluate market opportunities, growth trends, and competitive dynamics relevant to your business needs.

2025 MARKET VALUE$5.2BMarket Size 2025
2036 FORECAST VALUE$10.7BBase Case , 2026 to 2036
CAGR 2026 TO 20366.8 %Bull 7.9% / Bear 5.6%
INCREMENTAL OPPORTUNITY$5.2BNet 10- year value creation
EXPANSION MULTIPLE1.93x2036 value over 2026 base
Strategic Levers
M&A Pipeline
Regional Outlook
Country Rankings
Competitive Intelligence
Segmental Deep-dive
Call-Us : 91 93563 13602

Executive Snapshot and Market Trajectory

Growers and applicators are treating adjuvant selection as a precision-agriculture decision rather than an afterthought bolted onto the herbicide tank mix. That shift, driven by tighter label restrictions on drift and volatilization, is what is pulling additive spending ahead of broader crop protection growth this season across most growing regions.
Adjuvants engineered for drift and deposition control are capturing the fastest growth as dicamba and other volatile-herbicide label amendments force applicators to document approved additive use at time of application. North America holds the deepest single demand pool given its row-crop application intensity, while Brazil's soy and corn expansion drives the fastest-growing single country market as new acreage keeps climbing season after season across the frontier region.
Competitive intensity sits below what the addressable spend would suggest, since formulation expertise and regulatory registration create real barriers that generic surfactant producers cannot easily cross regardless of scale. Croda and Solvay's formulation depth and agronomic testing relationships set the pace that challengers chase, while Chinese surfactant capacity keeps expanding into commodity categories each year, pressuring the industry's lowest-differentiation products hardest of all, especially smaller regional formulators without dedicated registration budgets to defend share.
Market Definition
The agrochemical additives market covers functional ingredients blended into or applied alongside pesticides, herbicides, fungicides, and fertilizers to improve efficacy, handling, or application performance, including surfactants, adjuvants, emulsifiers, dispersants, stabilizers, and chelating agents. It excludes the active pesticide and fertilizer ingredients themselves, seed treatment coatings sold as a separate product category, and biostimulant products marketed as standalone crop inputs rather than formulation additives.
Base Year Value
$5.2B in 2025 (MMA Primary Research Dataset, August 2026)
Forecast Period
2026 to 2036, eleven discrete annual values
CAGR
6.8% base case. Bull 7.9%. Bear 5.6%.
Fastest Growth Segment
Adjuvants (Drift and Deposition Control): 9.2% CAGR
Fastest Growth Country
Brazil: 8.9% CAGR
Fastest Growth Region
South Asia and Pacific: 8.8% CAGR
Largest Region
North America: 30% of 2025 global value
Market Leaders
Croda International, Solvay SA, Clariant AG, Evonik Industries, Huntsman Corporation. Source: MMA Analysis based on company annual reports and investor filings.
Primary Survey
n=3,800 procurement and R&D decision-makers, Q4 2025, six countries
Methodology
Demand-side build-up, cross-validated against public data, 47 expert interviews

Agrochemical Additives Market Forecast Scenarios

agrochemical-additives-market-size-forecast-scenario-1787300496401
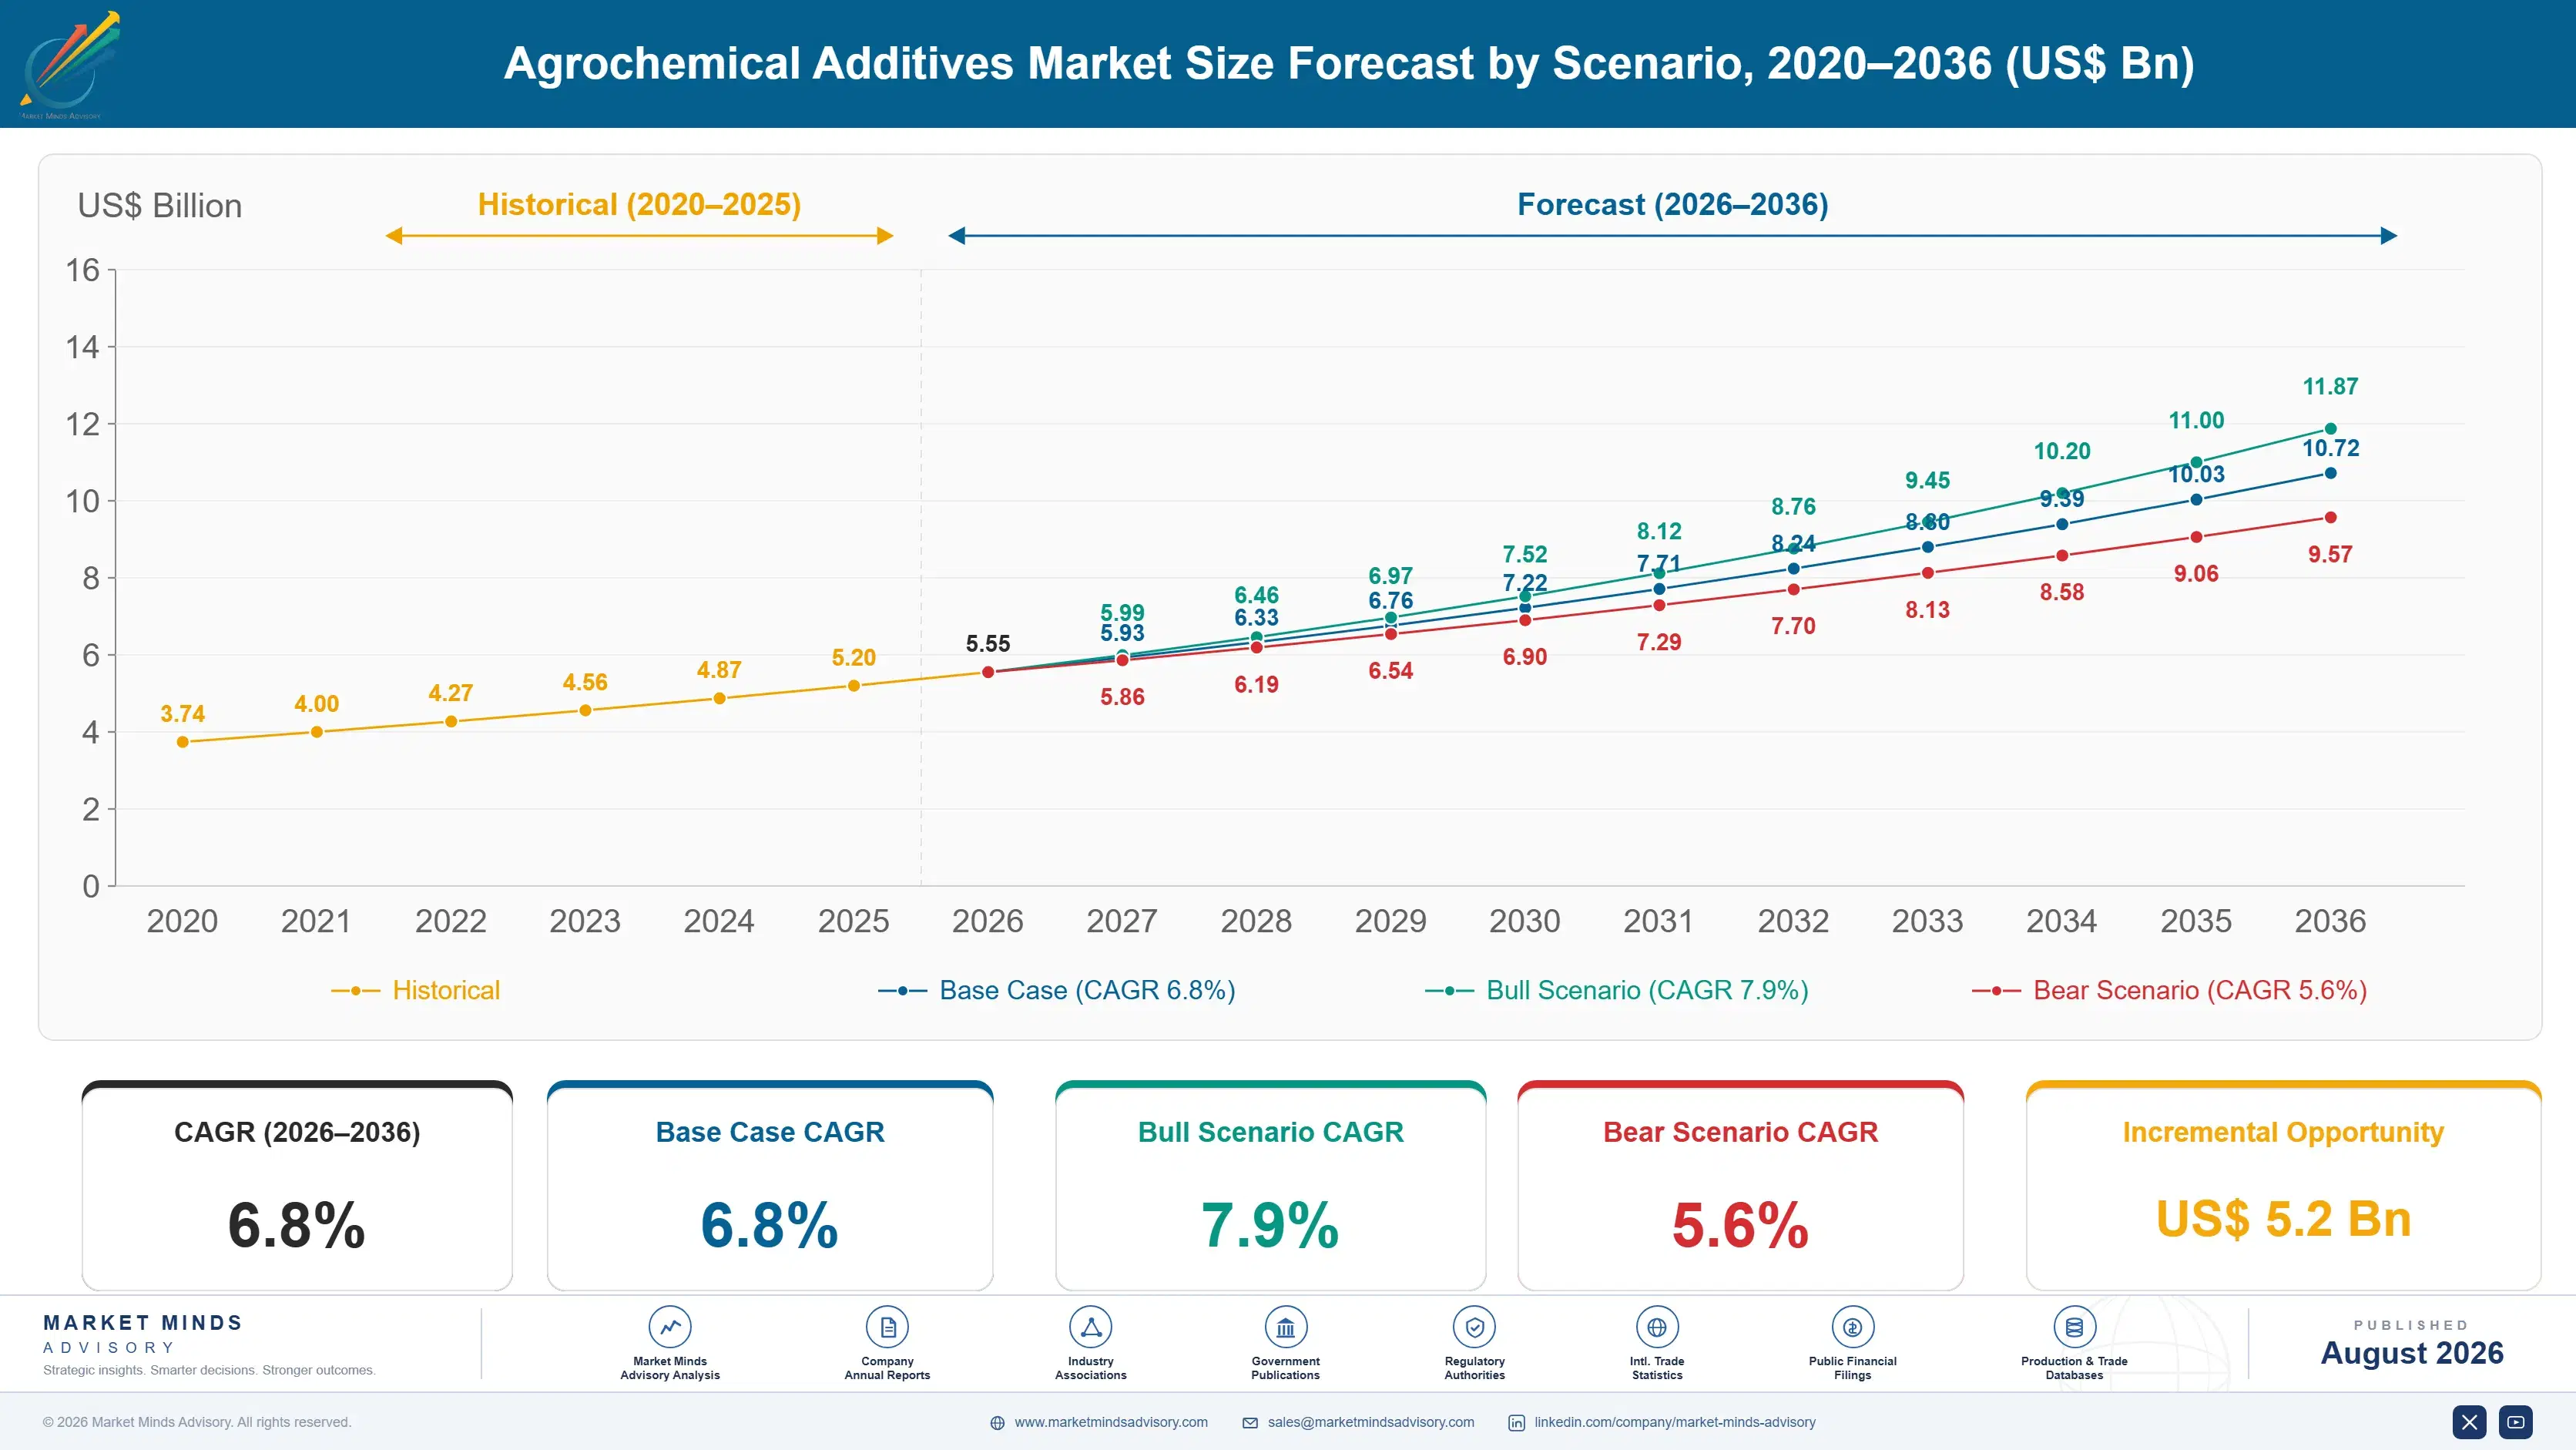
Agrochemical additive demand grew steadily between 2020 and 2025, with a brief slowdown in 2023 as high interest rates cooled farm equipment and input spending broadly, before commodity crop prices and expanding South American acreage lifted volumes again. The category closed 2025 at an estimated 6.3% historical CAGR, modestly ahead of the broader crop protection formulation market.
The base case rests on three reinforcing mechanisms. First, tightening drift and volatilization labeling for dicamba, 2,4-D, and related herbicides keeps mandating approved adjuvant use across an expanding acreage base. Second, precision spray technology adoption is raising the performance bar additives must meet, pulling demand toward higher-value formulated products rather than commodity surfactants. Third, Brazilian and Argentine acreage expansion keeps adding incremental application volume that additive suppliers capture regardless of which crop protection brand growers ultimately choose.
The bull case turns on the EPA finalizing expanded dicamba label restrictions that mandate specific approved adjuvant classes nationwide, pulling volumes forward faster than the base forecast assumes. The bear risk is continued generic surfactant price erosion from Chinese capacity additions compressing the commodity tier faster than premium adjuvant growth can offset, slowing blended category revenue growth even as application volume keeps climbing.

Formulation Chemistry and the Precision Spray Efficacy Curve

Agrochemical additives sit at the intersection of two converging pressures: regulatory label restrictions that increasingly mandate specific adjuvant classes for volatile or drift-prone actives, and grower economics that reward every input dollar spent improving active-ingredient efficacy at a time when commodity crop margins remain thin. Both forces favor formulated additives with documented performance data over generic surfactants sold on price alone, a durable shift rather than a cyclical on
MARKET CONCENTRATION41% CR5Formulation expertise limits share captured by generic entrants
AVERAGE SELLING PRICE$2.80-14.50 per kgPrice varies steeply by function and regulatory registration status
TOP PRODUCING COUNTRYChina, 31% shareChinese producers supply the largest single national output share
CAPACITY UTILISATION77%Utilisation tracks planting-season demand cycles across major regions
TRADE INTENSITY48% cross-borderNearly half of volume crosses a border before field application
FEEDSTOCK COST SHARE44% of COGSPetrochemical surfactant feedstocks dominate most input spending lines
Commercially, the market increasingly splits between registered, label-specified adjuvants that carry genuine regulatory moats, and commodity surfactants and emulsifiers that compete almost entirely on delivered cost. Large formulators increasingly bundle additive recommendations directly into crop protection product labels, converting what was once an independent purchasing decision into a specified, brand-linked one tied to a single dominant supplier.
Over the next decade, precision application technology will matter more than raw chemical volume. Spray drones, variable-rate sprayers, and real-time drift modeling are raising the performance bar additives must clear, and the suppliers that can demonstrate measurable deposition and efficacy gains under real field conditions stand to capture the largest share of the formulation budget as growers scrutinize every input line.
"Adjuvant selection used to be the last five minutes of a tank-mix conversation. Now it's showing up as a line item on the label itself, and that regulatory anchor is worth more to formulators than any efficacy claim they could make on their own."
Director, Crop Protection Formulation Practice · MMA Agriculture Practice

Market Trends

Drift-Control Adjuvants Become Label-Mandated Purchases Nationwide

Regulatory amendments to dicamba and other volatile-herbicide labels increasingly specify approved drift-reduction adjuvant classes as a condition of legal use, converting adjuvant selection from a grower preference into a compliance requirement documented at time of application. Formulators including Croda and Solvay have expanded dedicated drift-control product lines since 2023 to meet the viscosity and volatility-reduction thresholds regulators now require. Applicators report label-mandated adjuvant categories now covering more than 45% of dicamba-treated acreage in the United States, up sharply from under 20% before the most recent label amendments, a shift that locks in recurring demand regardless of near-term price cycles.
Market Impact: Covers 80%+ of dicamba applications

Micronutrient Chelation Demand Rises With Biostimulant Adoption

Chelating agents that improve micronutrient uptake and stability in tank-mix combinations are seeing rising demand as growers pair fertilizer and biostimulant applications more frequently to address soil health and yield-gap concerns. EDTA and amino-acid-based chelate formulations have both gained share as growers seek compatibility across increasingly complex tank mixes that combine fertilizer, biostimulant, and crop protection products in a single pass. Suppliers report chelating agent volume tied to biostimulant-compatible formulations growing meaningfully faster than the broader chelate category, reflecting the multi-product tank mix trend reshaping application practices across major row-crop regions.
Market Impact: Brazilian soybean acreage up roughly 12%

Market Opportunities and Growth Drivers

EPA Dicamba Label Restrictions Mandate Approved Adjuvant Classes

The US EPA's amended dicamba registration, reissued following a 2024 court vacatur and subsequent re-registration, requires applicators to use only specific EPA-approved volatility-reduction adjuvants alongside dicamba products, converting adjuvant purchasing into a legal compliance requirement rather than a discretionary input choice. MMA's primary survey found more than 80% of dicamba-applying growers now specifying an approved adjuvant by name rather than a generic category, a documentation shift that favors formulators with registered, tested products over unbranded alternatives. The restriction directly covers tens of millions of treated acres across the US Midwest and South.
Market Impact: Compresses commodity-tier margins 8-12 points

South American Acreage Expansion Adds Incremental Volume

Brazil and Argentina have continued expanding soybean and corn planted acreage through 2025, adding application volume that additive suppliers capture proportionally regardless of which crop protection brand growers ultimately select for a given field. Brazilian soybean acreage alone has grown by an estimated 12% since 2022 according to national agricultural statistics agencies, and each incremental hectare requires proportional adjuvant and surfactant volume for standard tank-mix application. Suppliers with established Brazilian distribution, including Croda and regional formulators, are best positioned to capture this acreage-driven volume growth ahead of new entrants still building local registration and distribution networks.
Market Impact: Registration can cost $1M or more

Market Restraints and Challenges

Generic Surfactant Price Erosion Compresses Commodity Tier

Chinese surfactant producers have expanded commodity capacity faster than global demand growth, pushing prices for unregistered, generic surfactants down even as differentiated adjuvant categories hold pricing. That erosion, rooted in overcapacity rather than any single trade policy shift, compresses margins hardest for mid-tier formulators without genuine regulatory or performance differentiation to defend pricing. Suppliers are responding by shifting product mix toward registered, label-specified adjuvant categories where Chinese generic competition cannot easily follow, though this repositioning takes years of registration and field-testing investment to complete across major crop protection product lines.
Market Impact: Covers 45%+ of dicamba-treated US acreage

Regulatory Registration Costs Slow New Formulation Entry

Bringing a new adjuvant formulation to market for use with regulated actives like dicamba requires field efficacy data and regulatory registration that can take eighteen to thirty months and cost well into seven figures per formulation, a barrier that keeps smaller formulators from competing in the highest-value label-mandated categories. That cost structure, a direct consequence of the data regulators now require following past drift-related crop damage incidents, favors incumbents with existing registration portfolios and testing infrastructure over new entrants. Smaller suppliers are responding by licensing registered formulations from larger players rather than pursuing independent registration.
Market Impact: Outpaces broader chelate category by 2x
3 additional market trends, 4 additional growth drivers, and 3 additional restraints and challenges are covered in the full report. Contact sales@marketmindsadvisory.com to access the complete intelligence.

Segment CAGR and Growth Architecture

Segmentation follows additive function rather than crop or active-ingredient pairing, since the formulation role a product plays, whether drift control, emulsification, or micronutrient delivery, determines regulatory pathway and performance requirements more than which crop it ultimately treats. Surfactants remain the volume base, but adjuvants and chelating agents now address performance requirements surfactants alone cannot satisfy.
agrochemical-additives-market-market-share-analysis-1787300496932

Adjuvants (Drift and Deposition Control)

Drift and deposition control adjuvants are the fastest-growing functional segment, expanding at an estimated 9.2% CAGR against a market average of 6.8%, roughly 1.35 times the overall pace. Growth tracks directly with tightening dicamba and volatile-herbicide labeling that increasingly mandates specific approved adjuvant classes as a condition of legal application, converting what was once a discretionary purchase into a compliance requirement documented at the point of use. Croda and Solvay currently lead on registered, label-approved adjuvant volume, though smaller specialty formulators are gaining ground in regional markets with distinct labeling requirements. Continued adoption depends on regulatory label amendments continuing to expand adjuvant mandates across additional active ingredients and geographies over the forecast period.
CAGR 9.2%

Chelating Agents

Chelating agents rank second-fastest, growing at an estimated 8.4% CAGR as micronutrient delivery and biostimulant-compatible tank mixes gain adoption across row-crop and specialty agriculture. The segment benefits from growers increasingly combining fertilizer, biostimulant, and crop protection applications into fewer field passes, requiring chelate formulations compatible across a wider chemical range than single-purpose products need to achieve reliably under field conditions. Adoption still trails core surfactants by a wide margin given the segment's smaller absolute base and more specialized end-use focus concentrated in micronutrient-deficient soil regions worldwide. Growth is concentrated among suppliers including Huntsman and Evonik that have expanded amino-acid-based chelate formulations to meet compatibility requirements newer combination products demand from distributors.
CAGR 8.4%
Full segment breakdown across 5 segments available in the complete report.

Regional Architecture and Country Demand Map

Agrochemical additive demand concentrates where row-crop application intensity and regulatory complexity overlap. North America leads on both application volume and label-driven adjuvant mandates, East Asia follows on manufacturing scale, and South Asia and Pacific grows fastest as mechanized precision application expands across major growing regions.

North America

Dicamba and volatile-herbicide label restrictions anchor North America's leading share of global agrochemical additive demand, as row-crop growers across the Corn Belt and Mississippi Delta apply label-mandated drift-control adjuvants across tens of millions of treated acres each season. The region's high adoption of precision spray technology, including variable-rate sprayers and drift modeling, raises the performance bar for additives beyond what less mechanized markets require. US EPA registration requirements create a genuine regulatory moat favoring established formulators including Croda and Huntsman over smaller competitors lacking infrastructure. Canada contributes a smaller, steadier share tied to its canola and wheat base, while Mexico's contribution grows fastest of the three as grain farming modernizes.
Share: 30% | CAGR: 7.8% (2026 to 2036)

Western Europe

Regulatory stringency, not application volume alone, defines Western Europe's agrochemical additive market. The European Union's pesticide approval framework under Regulation 1107/2009 applies rigorous registration requirements to adjuvant formulations that keep the region's additive market smaller relative to its farmland base than North America's, since several active ingredient and adjuvant combinations common elsewhere remain restricted or banned outright. France and Germany lead on installed application volume, reflecting their large-scale grain and oilseed farming base and well-established distributor networks. The Netherlands contributes a smaller but disproportionately high-value share tied to intensive horticultural production. Growth here trails the global average, reflecting both a mature, already-optimized application base and continued regulatory tightening that constrains new product introduction relative to less restrictive markets elsewhere.
Share: 20% | CAGR: 5.5% (2026 to 2036)
Regional intelligence for 5 additional markets available in the complete report: East Asia, South Asia and Pacific, Latin America, Middle East and Africa, Eastern Europe. Contact sales@marketmindsadvisory.com.
agrochemical-additives-market-country-cagr-analysis-1787300497447

Where Agrochemical Additive Margin Concentrates Next

Four commercial moves separate formulators capturing outsized margin from those competing purely on delivered surfactant price. Each depends on shifting revenue toward regulatory registration, formulation service, application data, or distribution depth that current shipment volume does not yet fully reflect, particularly as commodity surfactant pricing compresses hard under sustained Chinese capacity pressure across the industry.

Label-Specified Adjuvant Registration Portfolio Investment Strategy

Formulators that build and maintain broad regulatory registration portfolios across major volatile-herbicide labels are capturing the growing share of demand that regulation, not just efficacy, now specifies by name. A single new adjuvant registration can carry field-testing and regulatory costs of $1 million to $3 million, but each approved formulation then commands demand that generic surfactant competitors are legally barred from serving in that category. Formulators without registered products increasingly lose the highest-value label-mandated categories entirely, regardless of underlying chemical performance, making registration portfolio depth a durable advantage rather than a one-time cost.
Market Impact: Registration can cost $1 million to $3 million

Custom Tank-Mix Compatibility Testing Service Program

Suppliers offering custom tank-mix compatibility testing, confirming that a specific adjuvant performs correctly alongside a grower's full combination of herbicide, fungicide, and fertilizer products, are capturing service revenue that generic surfactant sellers cannot offer. A dedicated compatibility testing program typically carries service fees of $8,000 to $35,000 per major formulation partnership annually, reflecting the laboratory and field-trial investment required to validate combinations reliably across multiple growing seasons and geographies. This service model matters most for large distributors and cooperatives managing complex multi-product tank mixes across thousands of member-grower acres each season.
Market Impact: Testing service fees run $8,000 to $35,000 yearly

Precision Application Data and Efficacy Documentation

Formulators that pair additive sales with field-level efficacy and deposition data, collected through partnerships with precision sprayer and drone application providers, are building a documentation advantage that helps growers satisfy label compliance requirements while justifying premium pricing. This data service typically adds 6 to 11% to base product revenue through bundled subscription or per-acre documentation fees, a margin layer that generic competitors without application-data partnerships cannot replicate. The approach works best in regions with strict label documentation requirements, where growers need defensible compliance records more than a marginal price advantage.
Market Impact: Adds 6 to 11% to base product revenue

Regional Distributor and Cooperative Exclusivity Agreements

Suppliers securing exclusive or preferred-supplier agreements with large agricultural distributors and grower cooperatives are locking in multi-year volume commitments that protect against price-only competition from generic entrants entirely. These exclusivity arrangements typically carry a price premium of 5 to 10% over open-market purchasing, reflecting the value distributors place on supply continuity and dedicated technical support during planting-season demand spikes each year. Suppliers able to demonstrate reliable delivery through peak application windows increasingly win these agreements over lower-cost rivals with less proven logistics performance and thinner technical support staffing across regions.
Market Impact: Commands 5 to 10% premium over open-market pricing

Who Controls the Margin Pool

The top five formulators hold an estimated 41% of global agrochemical additive shipment volume, a moderate concentration reflecting genuine regulatory and formulation barriers that keep the category more consolidated than generic specialty chemicals. Croda and Solvay lead on registration depth and agronomic testing relationships, while a broad second tier of regional and Chinese producers competes mainly on price in commodity surfactant categories.
Current competitive activity centers on three fronts. Drift-control adjuvant registration expansion is redrawing the label-mandated tier, with Croda, Solvay, and Huntsman all racing to cover additional volatile-herbicide labels. Precision application data partnerships are becoming a genuine differentiator among suppliers targeting large cooperative accounts. And several Chinese producers are pursuing Western regulatory registration to move beyond commodity export pricing into higher-value categories.

Emerging pressure comes from Chinese producers moving up the value chain into registered adjuvant categories once dominated by Western formulators, aided by domestic petrochemical feedstock supply that keeps their input costs consistently lower. If Chinese producers close the registration and field-testing gap further, expect share to shift meaningfully over the next several years, particularly in South Asia and Latin America where price sensitivity runs higher than in regulation-heavy North America.
agrochemical-additives-market-company-positioning-matrix-1787300497970

Competitive Moat and Risk Dimensions

CRODA INTERNATIONAL

Moat: Registration Depth and Agronomic Testing

Croda built a broad portfolio of registered, label-approved adjuvant formulations across major volatile-herbicide labels that smaller formulators cannot replicate quickly, and its extensive agronomic field-testing network gives it credibility with large distributors and cooperatives that generic surfactant sellers cannot match at comparable scale or speed.
CRODA INTERNATIONAL

Risk: Premium Pricing Under Cost Pressure

Croda's premium pricing model depends on customers valuing registration and testing depth enough to pay meaningfully more than commodity alternatives, and that willingness to pay could erode if Chinese producers close the registration gap faster than Croda can defend its formulation lead through continued innovation.
SOLVAY SA

Moat: Broad Specialty Chemical Cross-Sell

Solvay's agrochemical additives sell alongside its much broader specialty chemicals portfolio, letting it bundle formulation expertise and technical support into larger customer relationships that pure-play adjuvant suppliers cannot match, giving it procurement access built across multiple industrial chemistry categories and long-standing distributor relationships spanning decades.
SOLVAY SA

Risk: Modest Portfolio Share

Agrochemical additives represent a small piece of Solvay's much larger specialty chemicals business, so capital allocation and product development attention compete against higher-volume categories, leaving room for additive-focused specialists to out-innovate Solvay on formulation chemistry and registration speed despite its scale advantage and global reach.

Key Players

Croda International
Solvay SA
Clariant AG
Evonik Industries
Huntsman Corporation

Others

BASF SE
Dow Inc.
Nouryon
Stepan Company
Lubrizol Corporation
Innospec Inc.
Wilbur-Ellis Company
Brandt Consolidated
Helena Agri-Enterprises
Kao Corporation
Sinofert Holdings
Zhejiang Wynca Chemical
Aarti Industries
Loveland Products (Nutrien Ag Solutions)
Precision Laboratories

Recent Developments

APRIL 2025

Croda Expands Drift-Control Adjuvant Registration Across Additional Dicamba Labels

Croda International secured regulatory registration for its drift-reduction adjuvant line across three additional US state-specific dicamba labels, expanding the acreage its approved formulations can legally serve nationwide. The registration followed eighteen months of field trial data collection across multiple Midwest growing regions ahead of the 2025 planting season.
Signal: Signals registration breadth becoming a primary competitive battleground among label-mandated adjuvant suppliers nationwide this planting cycle.
NOVEMBER 2024

Solvay Forms Distribution Partnership With Major US Grain Cooperative

Solvay SA formed a preferred-supplier distribution partnership with a major US grain cooperative network, securing multi-year volume commitments across the cooperative's member-grower base in exchange for dedicated technical support and planting-season delivery priority nationwide. The partnership covers several major row-crop growing states across the Midwest region.
Signal: Signals distribution exclusivity becoming a key lever for locking in volume against generic competition industry-wide this cycle.
FEBRUARY 2025

Huntsman Acquires Regional Chelating Agent Formulator

Huntsman Corporation acquired a regional chelating agent formulator to strengthen its micronutrient delivery product line, targeting growers combining fertilizer and biostimulant applications into fewer field passes each growing season nationwide. The acquired formulator continues operating under its existing brand within Huntsman's broader agricultural chemicals structure.
Signal: Signals large diversified chemical suppliers entering micronutrient delivery through acquisition rather than organic internal development efforts.

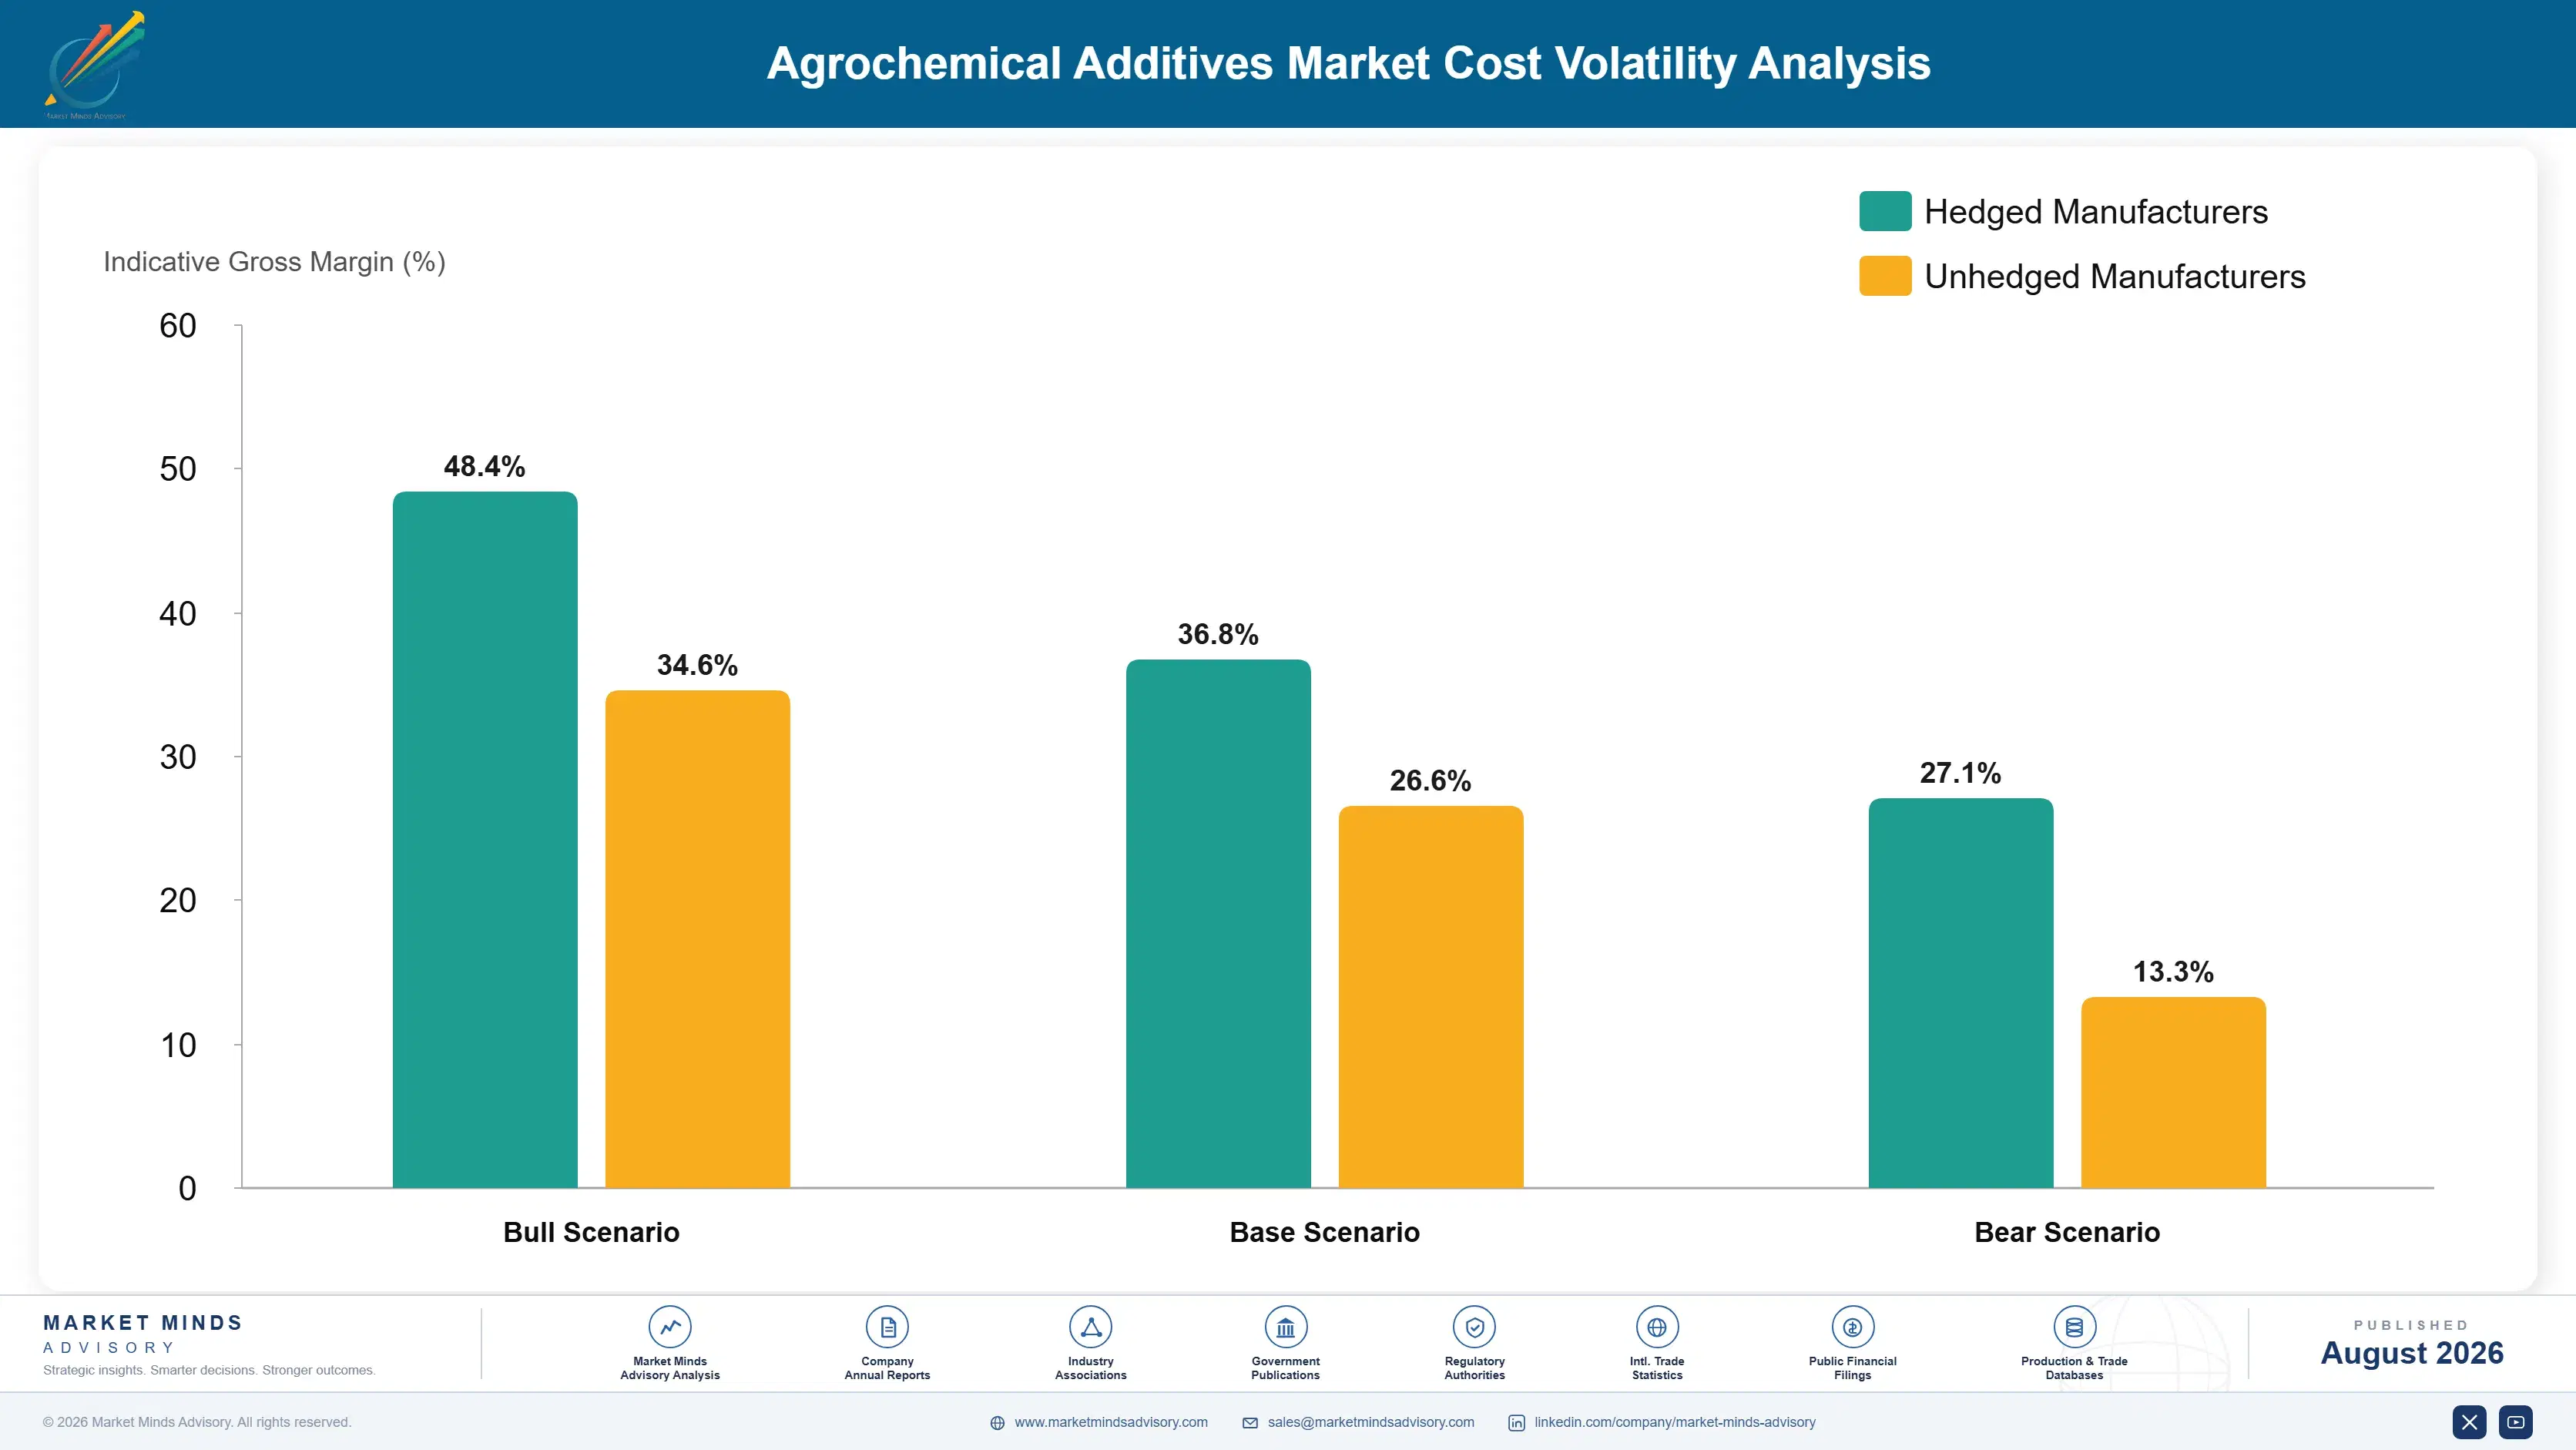
Petrochemical Surfactant Feedstock Exposure

Petrochemical surfactant feedstocks, including ethylene oxide derivatives and fatty alcohols, account for roughly 44% of cost of goods sold in agrochemical additive manufacturing, with feedstock supply concentrated among major petrochemical producers in North America, the Middle East, and China. Specialty chelating compounds and packaging add a further meaningful share, sourced predominantly from specialty chemical distributors regardless of final formulator location.
Ethylene oxide and fatty alcohol prices spiked sharply during 2022 as global petrochemical feedstock markets tightened following supply disruptions, with several formulators reporting input cost increases exceeding 20% in their 2022 annual reports just as post-pandemic application volume was recovering. The USDA's periodic agricultural input cost review has flagged surfactant feedstock pricing as sensitive to both crude oil price cycles and competing demand from detergent and personal care manufacturing outside agriculture entirely.

Smaller regional formulators without long-term feedstock supply contracts absorbed the 2022 price spike hardest, losing contract bids to larger suppliers including Croda and Solvay that had negotiated priority pricing with major petrochemical producers. Formulators with backward integration into feedstock production weathered input volatility somewhat better than those dependent on the open feedstock market, a durable cost advantage that persists as feedstock demand keeps climbing across multiple end-use industries.
agrochemical-additives-market-cost-volatility-analysis-1787300498164

Multi-Year Feedstock Supply Agreements

Larger formulators are locking multi-year ethylene oxide and fatty alcohol supply agreements directly with petrochemical producers, trading some pricing flexibility for guaranteed volume and price stability that protects margin during future feedstock market volatility, an increasingly standard practice among the top five suppliers following the 2022 spike. Smaller formulators increasingly pool orders through distributors to gain similar terms.

Backward Integration Into Surfactant Feedstock Production

Several larger suppliers are investing directly in surfactant feedstock production capacity rather than purchasing entirely on the open market, reducing exposure to petrochemical price swings and improving supply reliability, though this requires meaningfully higher fixed capital investment than pure formulation operations can absorb without external financing support spread across multiple years and production sites.

Bio-Based Feedstock Substitution Research

Suppliers are researching bio-based surfactant feedstocks, including plant-derived fatty alcohols, as partial substitutes to reduce dependence on petrochemical feedstock price cycles, though bio-based alternatives currently carry a cost premium that limits substitution to premium product categories, at least until production scale improves cost parity meaningfully across the broader supplier base and distribution network over time.

Portfolio Architecture for Margin Defence

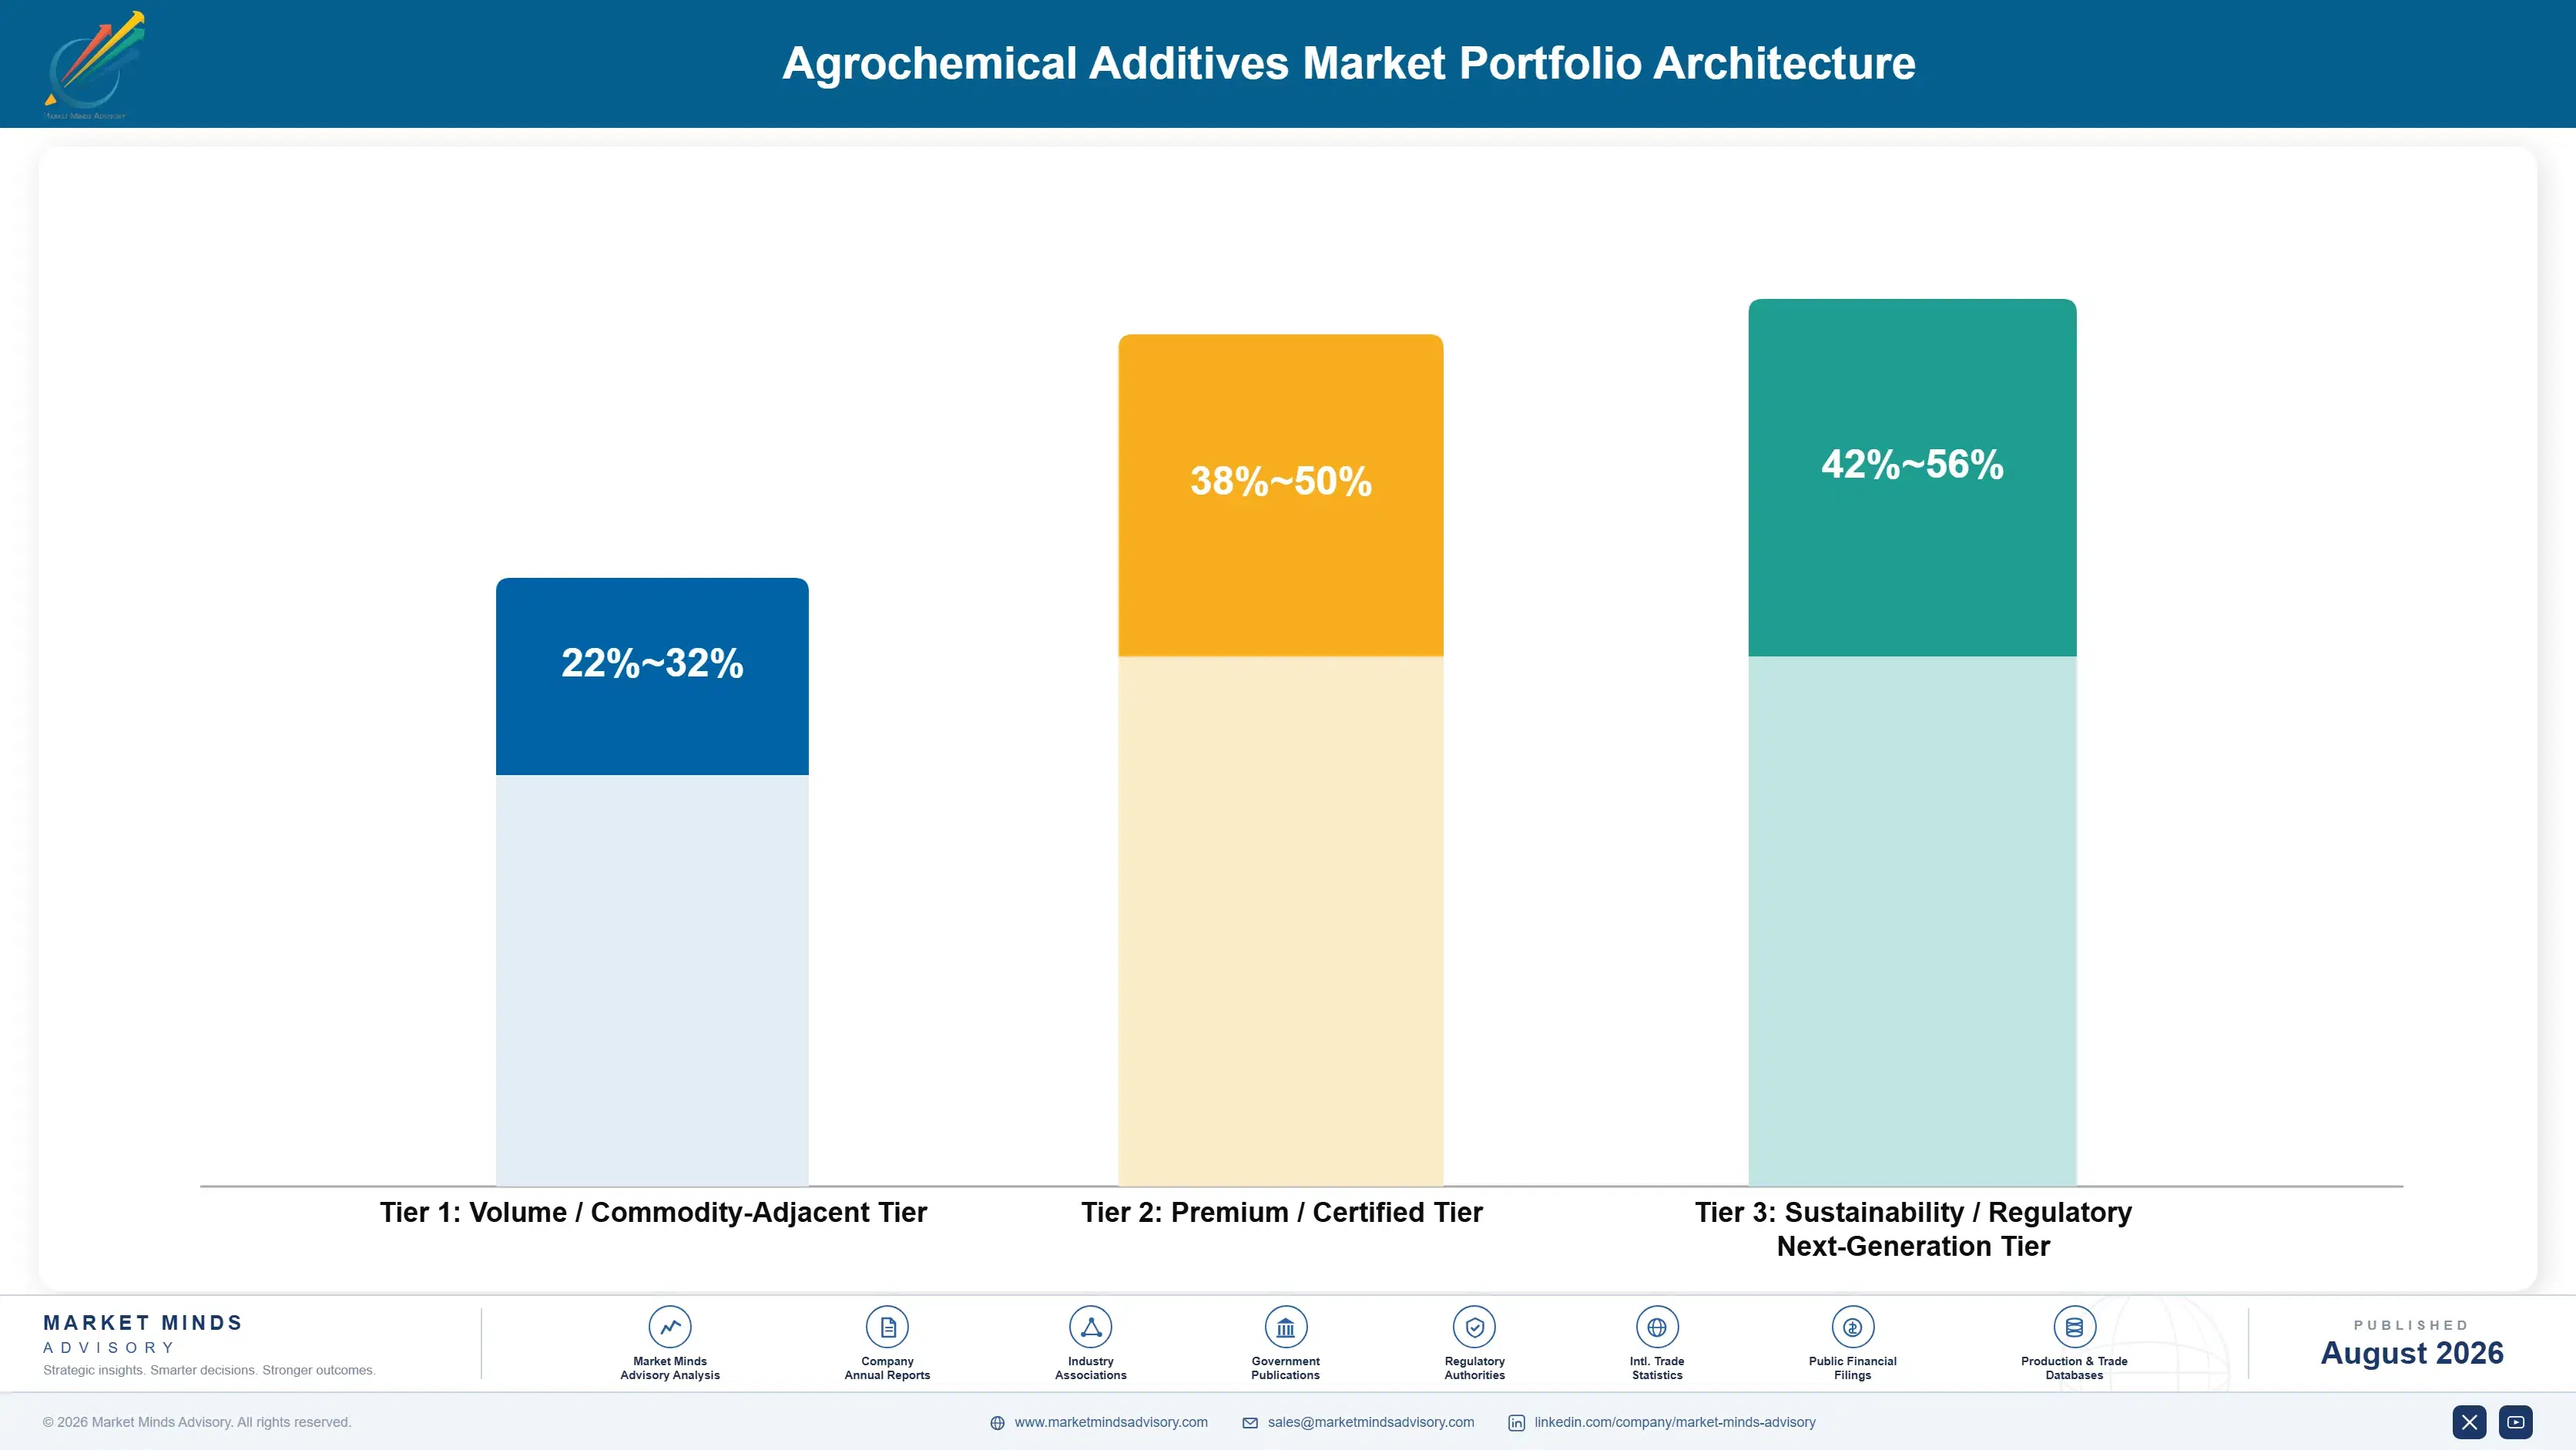
Agrochemical additive portfolios split across three tiers with meaningfully different margin economics. The volume tier, standard commodity surfactants and emulsifiers sold largely on price, competes hardest against Chinese capacity and delivers gross margins in the 22 to 32% range. Premium registered adjuvants bundling regulatory approval and field efficacy documentation command materially higher margins, reflecting registration cost and formulation investment layered on top of base chemistry.
The tension between volume and premium tiers shapes capacity allocation decisions across the industry. Volume surfactant capacity is easiest to scale and fastest to fund, but Chinese price competition keeps margin pressure constant in that tier. Premium registered adjuvant capacity requires deeper regulatory investment and slower field-testing cycles, but rewards patient capital with margins that hold up even as volume-tier pricing keeps eroding.

High-value margin pools concentrate in label-mandated adjuvants, specialty chelating agents, and the data and testing service layer that increasingly separates established formulators from commodity surfactant sellers. These pools remain a modest share of total shipment volume today, but they are growing faster than the base surfactant category and are where most supplier research and development spending is now directed.

Volume / Commodity-Adjacent Tier

Standard commodity surfactants and emulsifiers sold primarily on delivered price, facing the heaviest direct competition from Chinese capacity. These units carry the thinnest margins in the portfolio and depend on manufacturing scale rather than regulatory differentiation.
Gross Margin: 22-32%

Premium / Certified Tier

Registered, label-approved adjuvants bundling regulatory documentation, field efficacy data, and technical support that distributors and cooperatives pay a premium to access. This tier generates steady repeat business, since registered accounts rarely switch without cause.
Gross Margin: 38-50%

Sustainability / Regulatory / Next-Generation Tier

Bio-based surfactants and next-generation chelating formulations tied to expanding biostimulant compatibility requirements and tightening drift-control regulation. This tier draws the heaviest research spending, since formulation and registration both require sustained investment to defend.
Gross Margin: 42-56%
agrochemical-additives-market-portfolio-architecture-1787300498664

High-value Sub-segments and Strategic Watch-out

Adjuvants (Drift and Deposition Control)

The fastest-growing, highest-margin pool in the market, driven by expanding label mandates that reward suppliers with registered formulations and field-testing infrastructure already proven across major growing regions. Suppliers without registration risk losing the fastest-growing accounts to specialists that moved earlier in the regulatory approval cycle.
Gross Margin: 42-54%

Specialty Chelating Agents

A smaller but rapidly scaling high-value pool as biostimulant-compatible tank mixes expand, gated by formulation compatibility testing with fertilizer and crop protection product combinations. Suppliers that secure early compatibility validation tend to hold that relationship for years, since switching suppliers mid-season is costly and genuinely risky.
Gross Margin: 40-52%

Standard Commodity Surfactants

The volume core of the market, serving cost-sensitive formulation accounts where Chinese price competition keeps margins under the most sustained pressure of any product tier. This segment still generates the largest absolute shipment volume, and defending share funds the research spending premium tiers require to grow.
Gross Margin: 22-30%

Unregistered Generic Chinese Surfactants

A strategic watch-out segment where rapidly expanding low-cost, unregistered capacity could pull commodity-tier pricing down faster than registration and formulation expertise can defend established margins. Suppliers without a genuine regulatory advantage against these imports should expect continued price erosion across the entire commodity tier over time.
Gross Margin: 14-24%

The Registration Portfolio as the Moat

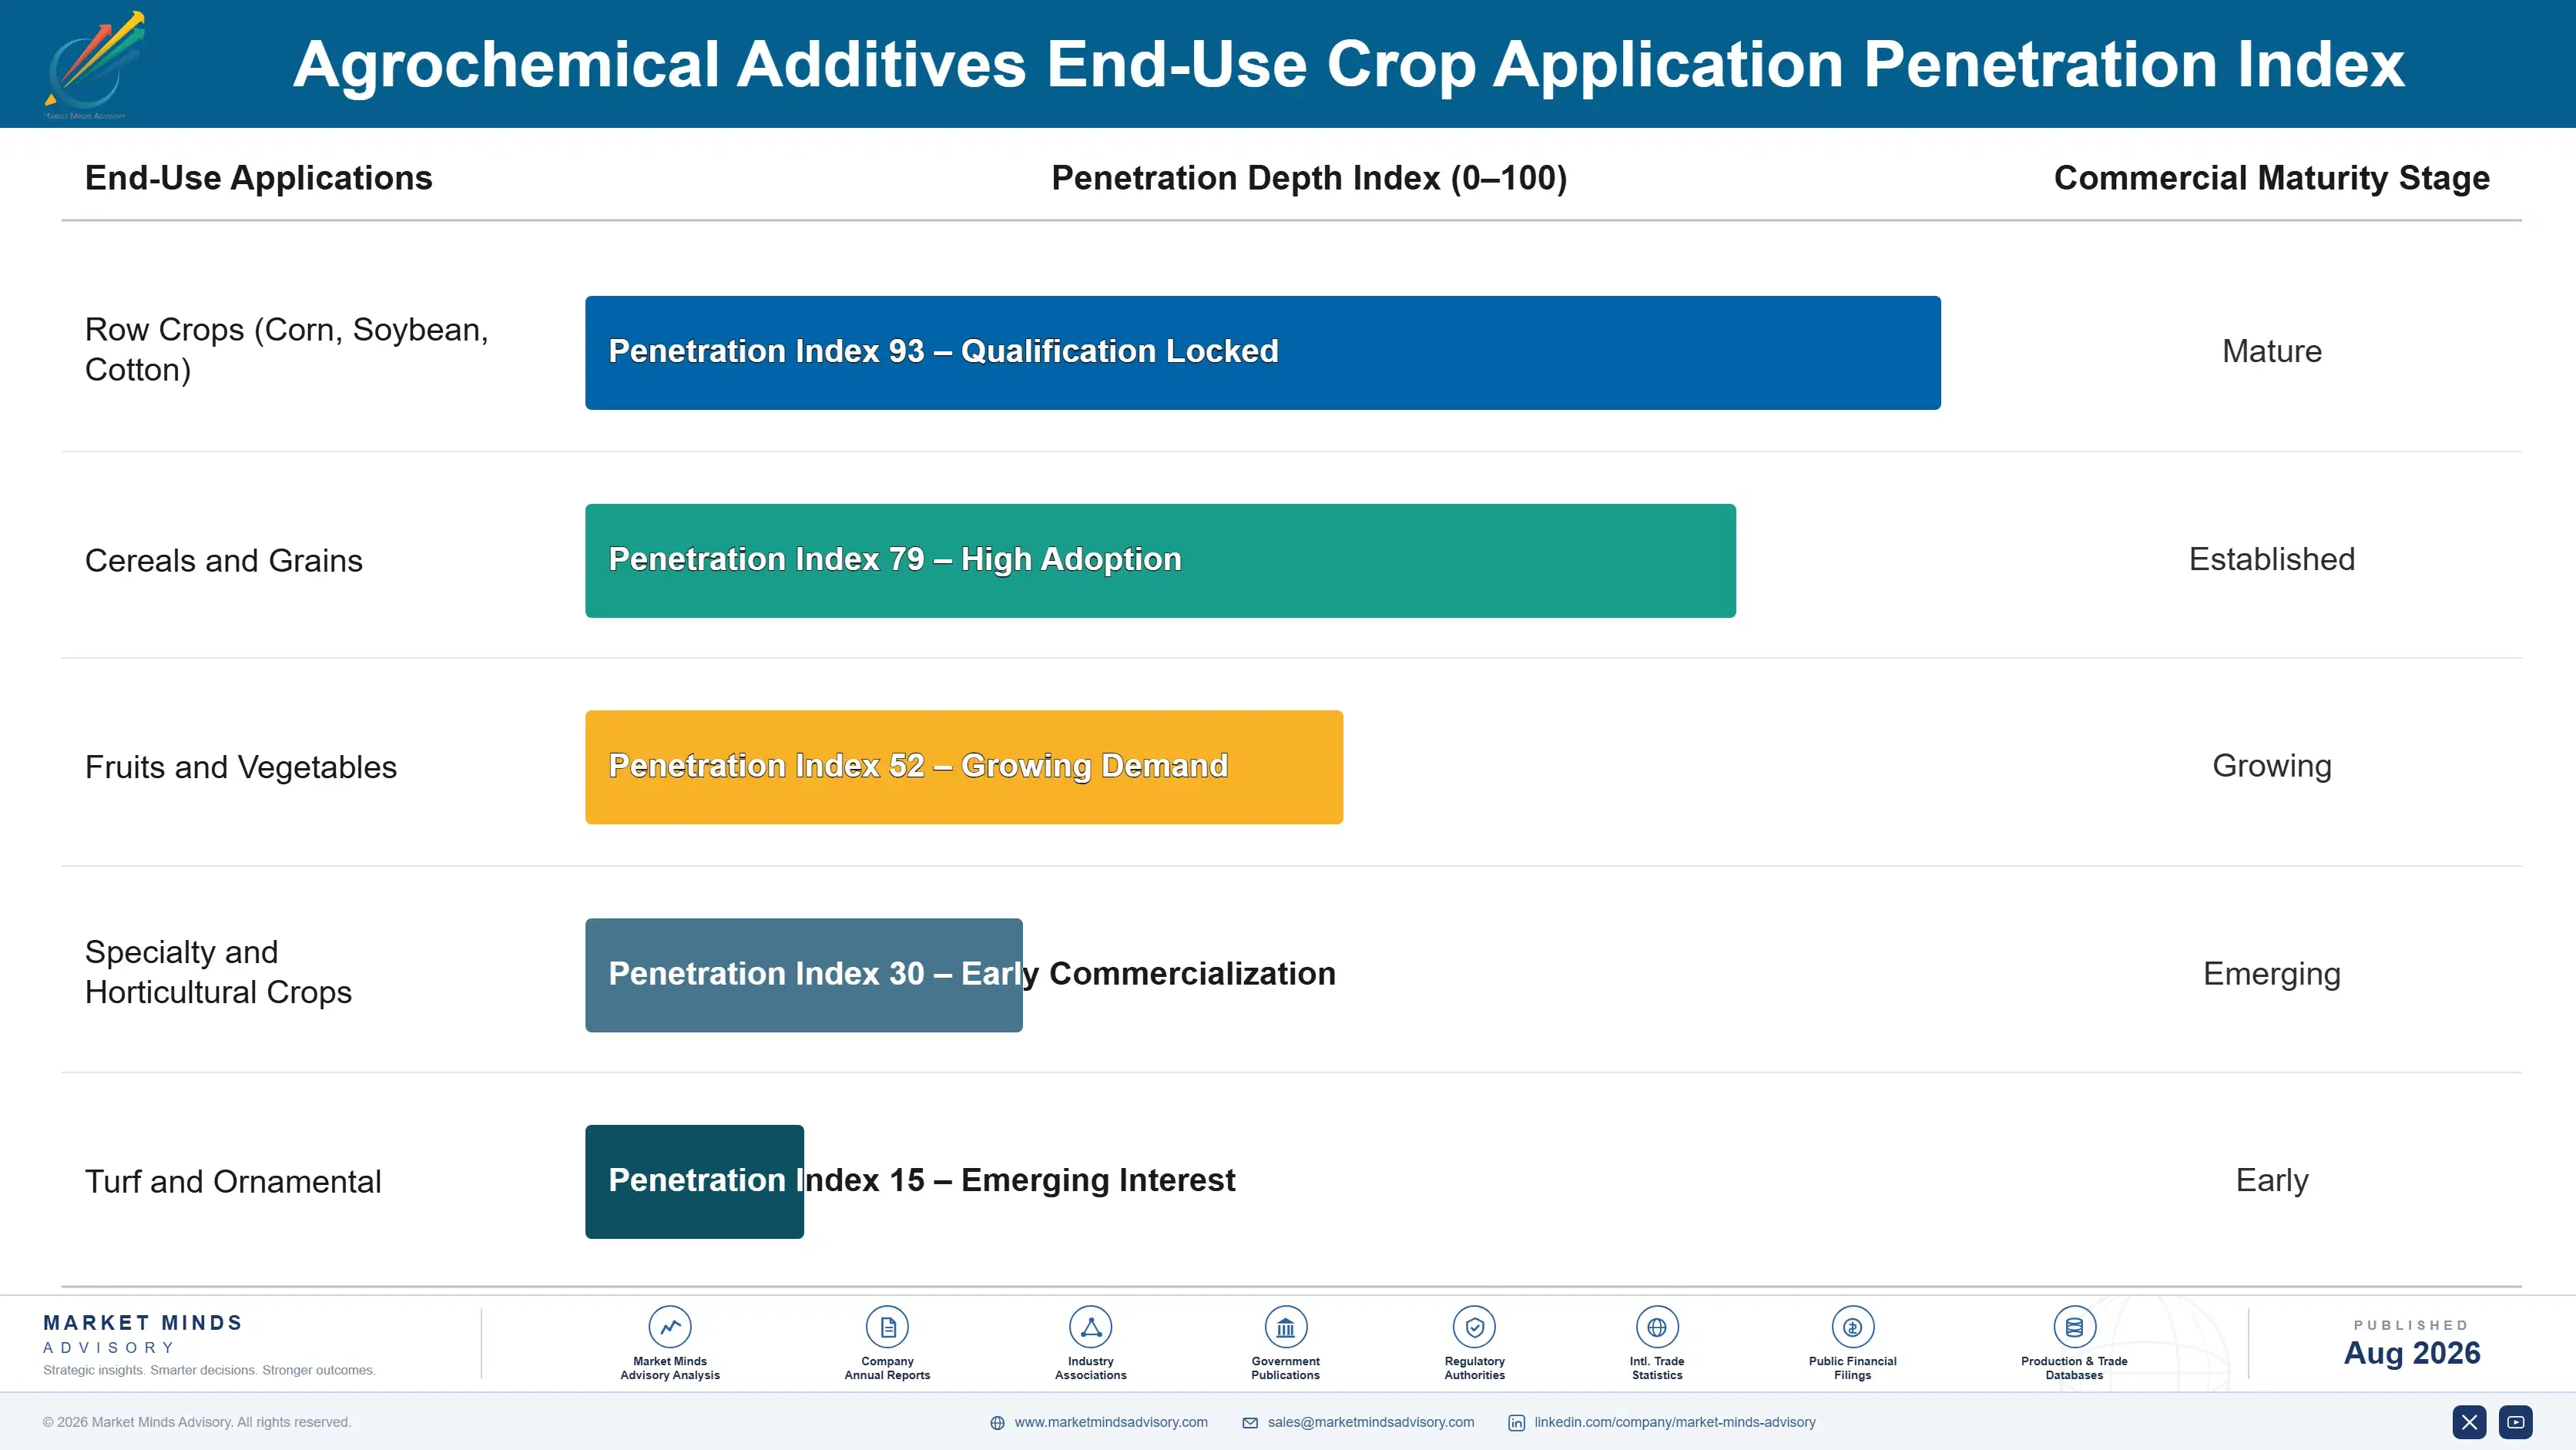
Agrochemical additive economics increasingly resemble a regulated-registration business rather than a simple chemical sale. Label renewal, field-testing partnerships, and technical support relationships generate recurring engagement with distributors and cooperatives that persists well beyond the initial supply agreement, and suppliers that own that regulatory relationship can forecast renewal demand with more confidence than pure commodity competitors ever can manage reliably.
Adoption depth varies by end-use channel. Large distributors and grower cooperatives, once qualified on a supplier's registered formulations and technical support, rarely switch given the cost and compliance risk of requalifying an entire member-grower application program mid-season across many farms. Smaller independent retailers show shallower stickiness so far, since they often buy through wholesale channels rather than direct supplier relationships and switch more readily on price alone.

A generational shift in buyer profiles is underway as agronomists and precision application specialists, rather than pure purchasing managers, increasingly co-sign additive sourcing decisions given regulatory compliance exposure. These buyers weight registration credibility and field-testing documentation alongside unit cost, a shift that favors suppliers with proven compliance records over those competing purely on price across every major growing region worldwide.
agrochemical-additives-market-end-use-penetration-index-1787300499150

Where MMA Sees the Opportunity

These are among the four positions where our research anticipates prominent divergence between winners and laggards over the coming forecast period. Each is grounded in the demand model, the regulatory perimeter, and the announced capacity pipeline.
01 / REGISTERED ADJUVANT INVESTMENT

Prioritize label-mandated registration over commodity capacity growth

Drift and deposition control adjuvants are growing roughly 1.35 times faster than the overall market, driven by expanding volatile-herbicide labeling that increasingly mandates approved formulations by name rather than category. Suppliers still weighted toward commodity surfactant capacity risk ceding the fastest-growing, highest-margin accounts to specialists that built registered adjuvant portfolios earlier in the regulatory cycle. Capital directed toward registration and field-testing now should pay back faster than incremental surfactant expansion into an increasingly crowded, price-competitive commodity tier offering little room for margin growth.
02 / REGULATORY MOAT BUILD-OUT

Treat registration portfolio depth as a core competitive investment

Suppliers that still compete purely on delivered price without registered formulations are leaving significant value on the table that registration, field-testing data, and technical support are already capturing for established brands. These registered relationships carry materially higher switching costs than the underlying commodity sale, locking distributors into renewal patterns that price-only competitors struggle to break easily or quickly. Building this capability now, before Chinese entrants close the registration gap further, is worth more than matching a rival's price cut for cut.
03 / FEEDSTOCK COST HEDGING

Lock multi-year petrochemical feedstock agreements ahead of the next cycle

Petrochemical feedstock costs already run close to 44% of cost of goods sold, and the 2022 spike showed producer allocation constraints can push formulator costs up more than 20% within a single year. Suppliers without multi-year supply agreements risk losing contract bids to better-hedged rivals during the next volatile cycle, damaging distributor relationships built over years in a single sharp price spike. Locking supply now, even at a premium to spot pricing, protects margin stability and the credibility needed to win long-duration cooperative contracts.
04 / REGIONAL CAPACITY POSITIONING

Weigh Chinese cost scale against Western registration trust carefully

East Asia now holds a large and growing manufacturing base for agrochemical additive production, making cost leadership there increasingly difficult for Western formulators to contest directly on commodity surfactant price. Western suppliers still hold a genuine advantage in regulatory registration depth, field-testing infrastructure, and distributor trust that Chinese entrants have not yet fully closed. The sounder strategy is not chasing Chinese manufacturing cost scale directly, but doubling down on the registration and testing capability Chinese competitors still cannot replicate at comparable trust levels.

Engagement Snapshot From the Field

A live engagement with an industry participant carrying material or product regulatory and market exposure ahead of a defining policy shift, showing how our research translates into a defensible multi-year portfolio strategy.
MARKET MINDS ADVISORY · CLIENT ENGAGEMENT SUMMARY
Agrochemical Additives Producer Strategic Portfolio Review and Transition Roadmap 2026·Investment Scenario on Agrochemical Additives Exposure Evaluation 2025-26
CLIENT PROFILE
The client is a regional grain cooperative serving roughly 2,400 member-growers across a four-state Midwest footprint, managing dicamba and glyphosate application programs across more than 3 million acres of member cropland annually. The cooperative had historically let individual members source adjuvants independently and needed an assessment of whether a centralized, cooperative-negotiated adjuvant program would improve compliance and pricing (client-reported, unverified by MMA).
STRATEGIC CHALLENGE
The cooperative needed to decide whether centralizing adjuvant purchasing and specifying approved formulations cooperative-wide would meaningfully improve label compliance documentation and reduce per-acre input cost, against the risk of reduced member flexibility and potential resistance from growers accustomed to independent purchasing decisions built over many growing seasons of established local supplier relationships.
MMA APPROACH
MMA conducted a vendor-neutral assessment of centralized versus decentralized adjuvant purchasing models, benchmarking compliance documentation quality, volume-discount pricing potential, and member satisfaction risk against the cooperative's own historical application and purchasing data across three prior growing seasons, supplemented by structured interviews with regional agronomists and cooperative leadership across the four-state footprint.
KEY FINDINGS
  1. Compliance documentation gaps were meaningfully more common under the decentralized model, with roughly one in six sampled applications missing complete approved-adjuvant records required under current dicamba label requirements.
  2. Centralized purchasing at cooperative scale would improve volume-discount pricing by an estimated 9 to 14% compared to individual member purchasing at smaller volumes through disparate local retailers.
  3. Member survey results showed most growers supportive of centralization provided at least two approved adjuvant options remained available per major herbicide program, preserving some choice within a compliant framework.
  4. Field trial data comparing the cooperative's preferred adjuvant candidates showed no meaningful efficacy difference among the top three registered options, simplifying the vendor selection decision considerably for cooperative leadership.
CLIENT PROFILE
The client is a regional grain cooperative serving roughly 2,400 member-growers across a four-state Midwest footprint, managing dicamba and glyphosate application programs across more than 3 million acres of member cropland annually. The cooperative had historically let individual members source adjuvants independently and needed an assessment of whether a centralized, cooperative-negotiated adjuvant program would improve compliance and pricing (client-reported, unverified by MMA).
STRATEGIC CHALLENGE
The cooperative needed to decide whether centralizing adjuvant purchasing and specifying approved formulations cooperative-wide would meaningfully improve label compliance documentation and reduce per-acre input cost, against the risk of reduced member flexibility and potential resistance from growers accustomed to independent purchasing decisions built over many growing seasons of established local supplier relationships.
MMA APPROACH
MMA conducted a vendor-neutral assessment of centralized versus decentralized adjuvant purchasing models, benchmarking compliance documentation quality, volume-discount pricing potential, and member satisfaction risk against the cooperative's own historical application and purchasing data across three prior growing seasons, supplemented by structured interviews with regional agronomists and cooperative leadership across the four-state footprint.
KEY FINDINGS
  1. Compliance documentation gaps were meaningfully more common under the decentralized model, with roughly one in six sampled applications missing complete approved-adjuvant records required under current dicamba label requirements.
  2. Centralized purchasing at cooperative scale would improve volume-discount pricing by an estimated 9 to 14% compared to individual member purchasing at smaller volumes through disparate local retailers.
  3. Member survey results showed most growers supportive of centralization provided at least two approved adjuvant options remained available per major herbicide program, preserving some choice within a compliant framework.
  4. Field trial data comparing the cooperative's preferred adjuvant candidates showed no meaningful efficacy difference among the top three registered options, simplifying the vendor selection decision considerably for cooperative leadership.
RECOMMENDED STRATEGY
Phase 1: Phase 1 (Months 1 to 3): Negotiate cooperative-wide pricing agreements directly with the two preferred registered adjuvant suppliers identified during the assessment. Phase 2: Phase 2 (Months 4 to 8): Roll out centralized purchasing with compliance documentation training for all member-grower applicators across the footprint. Phase 3: Phase 3 (Months 9 to 14): Evaluate compliance and pricing outcomes after one full growing season and adjust supplier mix.
OUTCOME
The cooperative implemented centralized purchasing with two preferred suppliers ahead of the 2026 planting season, preserving member choice within a compliant framework. Early data through the first half of 2026 showed compliance documentation improving substantially, though full-season pricing benefit will not be confirmed until harvest data is complete (client-reported, unverified by MMA).

Frequently Asked Questions

Foundational context covering the market sizes, CAGR, scope, country, region and competition that inform every finding below. This section is provided to cover basics and most often pre-purchase conversations, answered from the MMA Primary Research Dataset.

What is the current size of the Agrochemical Additives Market?

The global agrochemical additives market reached an estimated $5.2 billion in 2025. Growth concentrates in registered adjuvant categories where regulatory labeling increasingly mandates specific approved formulations by name.

How large will the Agrochemical Additives Market be by 2036?

MMA forecasts the market reaching approximately $10.72 billion by 2036, nearly double its 2026 value. Drift and deposition control adjuvants are expected to drive the largest share of that incremental growth.

What is the CAGR for the Agrochemical Additives Market 2026 to 2036?

The base case CAGR is 6.8% across the forecast period, with a bull case near 7.9% and a bear case near 5.6% depending on regulatory labeling expansion and Chinese surfactant capacity trends.

Which segment is growing fastest?

Drift and deposition control adjuvants are the fastest-growing segment, expanding at roughly 9.2% CAGR, about 1.35 times the overall market pace, driven by expanding volatile-herbicide label mandates.

Who are the major companies in the Agrochemical Additives Market?

Leading formulators include Croda International, Solvay, Clariant, Evonik, and Huntsman. The top five hold an estimated 41% of global shipment volume in a moderately consolidated market.

Which country is growing fastest?

China leads growth in absolute manufacturing volume, but Brazil is expanding fastest in percentage terms, driven by continued soybean and corn acreage expansion adding proportional application volume.

Report Segmentation Architecture

The full report scope spans multiple orthogonal segmentation dimensions, with cross-tabulated demand data provided for each dimension pair. Coverage extends further to regional breakdowns, trend trajectories, and the competitive detail needed to support segment-level decision-making.

By Additive Function Type

  • Surfactants and Wetting Agents
  • Adjuvants (Drift and Deposition Control)
  • Emulsifiers and Dispersants
  • Stabilizers and Preservatives
  • Chelating Agents

By End-Use Crop Application

  • Row Crops (Corn, Soybean, Cotton)
  • Cereals and Grains
  • Fruits and Vegetables
  • Specialty and Horticultural Crops
  • Turf and Ornamental

By Commercial Dimension

  • Original Formulation Sales
  • Registration and Compliance Documentation Services
  • Custom Tank-Mix Compatibility Testing
  • Distributor and Cooperative Channel Sales

By Region

  • North America
  • Western Europe
  • East Asia
  • South Asia and Pacific
  • Latin America
  • Middle East and Africa
  • Eastern Europe

Scope, Methodology, and Coverage

Every figure in this report is reproducible from documented input assumptions. The scope below maps the historical period, the forecast horizon, the segmentation dimensions, and the countries covered, alongside the underlying primary and qualitative methodology.
Historical Period
2020 to 2025
Forecast Period
2026 to 2036
Base Year
2025 (USD billions; MMA Primary Research Dataset, August 2026)
Market Definition
The agrochemical additives market covers functional ingredients blended into or applied alongside pesticides, herbicides, fungicides, and fertilizers to improve efficacy, handling, or application performance, including surfactants, adjuvants, emulsifiers, dispersants, stabilizers, and chelating agents. It excludes the active pesticide and fertilizer ingredients themselves, seed treatment coatings sold as a separate product category, and biostimulant products marketed as standalone crop inputs rather than formulation additives.
Quantitative Units
USD billions (current prices); shipment volume in thousands of metric tons where disclosed
Segmentation Dimensions
By Additive Function Type; By End-Use Crop Application; By Commercial Dimension; By Region
Regions Covered
North America, Western Europe, East Asia, South Asia and Pacific, Latin America, Middle East and Africa, Eastern Europe
Countries Covered
USA, China, Germany, France, UK, Japan, South Korea, India, Australia, Canada, Brazil, Mexico, Indonesia, Vietnam, Thailand, Malaysia, UAE, Saudi Arabia, South Africa, Nigeria, Turkey, Poland, Netherlands, Italy, Spain, Sweden, Switzerland, Argentina, Colombia, Singapore, and additional markets relevant to this sector
Key Companies Profiled
Croda International, Solvay SA, Clariant AG, Evonik Industries, Huntsman Corporation, BASF SE, Dow Inc., Nouryon, Stepan Company, Lubrizol Corporation, Innospec Inc., Wilbur-Ellis Company, Brandt Consolidated, Helena Agri-Enterprises, Kao Corporation, Sinofert Holdings, Zhejiang Wynca Chemical, Aarti Industries, Loveland Products (Nutrien Ag Solutions), Precision Laboratories
Quantitative Methodology
Primary survey, n=3,800 respondents, Q4 2025, six countries; demand-side model with trade association cross-validation
Qualitative Methodology
47 expert interviews, Q4 2025; applied to validate demand model assumptions, identify emerging dynamics, and assess competitive positioning
Report Format
PDF and XLSX data workbook (Word format preview document)
Publisher
Market Minds Advisory
Report Code
MMA-2026-AGR-133
Published
August 2026
Contact
sales@marketmindsadvisory.com | www.marketmindsadvisory.com

Purchase the full Agrochemical Additives Market Report (2026 to 2036).

The full Agrochemical Additives Market report delivers a comprehensive assessment of formulation technology, competitive positioning, and regional demand through 2036. It includes detailed segmentation by additive function, end-use crop application, and commercial dimension, alongside profiles of all twenty companies covered in this summary. The report quantifies regional market size and growth across all seven world regions, with country-level detail for the thirty-plus markets MMA tracks. Buyers receive access to MMA's underlying primary survey dataset and expert interview transcripts, enabling further custom analysis. A dedicated chapter benchmarks petrochemical feedstock cost exposure and mitigation strategies across supplier types.
Function-level segmentation across five additive technology categories
Profiles of twenty leading agrochemical additive suppliers worldwide
Regional sizing and forecasts across all seven world regions
Petrochemical feedstock cost exposure and mitigation strategy chapter
Primary survey dataset access covering 3,800 respondent interviews
Competitive development tracking with dated corporate event log

Built For The People Who Decide

From boardroom strategy to bench-side execution, this report is read cover-to-cover by leaders shaping the next decade of their industry, turning demand scenarios, market dynamics and valuation benchmarks into decisions.
CXOs/ Presidents/ VPs/ Managers
M&A and Corporate Development
Strategy Teams and R&D Heads
Procurement and Product Directors
Regulatory and Compliance Leaders
Investor Relations and Equity Analysts