Market Minds Advisory
Agriculture IoT Market

Agriculture IoT Market: Agriculture IoT Market. Precision Sensing Replaces Guesswork on the Farm

Farm equipment makers are racing to sell connected sensing subscriptions rather than one-time hardware, turning fields into recurring-revenue data platforms that traditional agricultural distributors were never built to support at this pace.

Lead Analyst

Published

September 2026

Make Smarter Decisions with Customized Research Insights

Request a free sample report and evaluate market opportunities, growth trends, and competitive dynamics relevant to your business needs.

2025 MARKET VALUE$28.4BMarket Size 2025
2036 FORECAST VALUE$111.1BBase Case , 2026 to 2036
CAGR 2026 TO 203613.2 %Bull 14.5% / Bear 11.9%
INCREMENTAL OPPORTUNITY$78.9BNet 10- year value creation
EXPANSION MULTIPLE3.46x2036 value over 2026 base
Strategic Levers
M&A Pipeline
Regional Outlook
Country Rankings
Competitive Intelligence
Segmental Deep-dive
Call-Us : 91 93563 13602

Executive Snapshot and Market Trajectory.

Soil and crop sensing hardware has become affordable enough for mid-size farms to adopt, shifting precision agriculture from a large-operation luxury into a mainstream input decision across most commercial growing regions worldwide this planting season and every season that follows it.
Connectivity gaps in rural areas remain the biggest deployment constraint, pushing vendors toward low-power wide-area networks and satellite backhaul rather than cellular infrastructure alone. Adoption is concentrated fastest among large commercial operations across North America and China, where government subsidy programs and equipment financing make sensor and platform costs easier to absorb. Livestock monitoring is emerging as a distinct, fast-growing adjacent category drawing new dedicated vendor investment from established equipment makers and specialized startups alike.
Equipment manufacturers are converging with dedicated agri-tech software vendors as both chase the same recurring subscription revenue from data platforms layered atop connected hardware sold into the same commercial accounts. Regulatory pressure around water usage and fertilizer runoff is accelerating adoption of monitoring tools that document compliance automatically, particularly across regulated growing regions in Western Europe and parts of East Asia facing tighter enforcement timelines and stricter penalty structures this cycle.
Market Definition
This report defines the Agriculture IoT Market as connected sensing hardware, wireless connectivity infrastructure, and software platforms used to monitor soil, crop, and livestock conditions on commercial farms, including soil sensors, drone-based imaging, and farm management software. It excludes autonomous farm equipment, agricultural drones sold as standalone hardware without connected sensing capability, and general farm accounting software.
Base Year Value
$28.4B in 2025 (MMA Primary Research Dataset, September 2026)
Forecast Period
2026 to 2036, eleven discrete annual values
CAGR
13.2% base case. Bull 14.5%. Bear 11.9%.
Fastest Growth Segment
Soil and Crop Sensing Platforms: 19.4% CAGR
Fastest Growth Country
China: 15.8% CAGR
Fastest Growth Region
South Asia and Pacific: 15.2% CAGR
Largest Region
East Asia: 27% of 2025 global value
Market Leaders
John Deere, Trimble, CNH Industrial, Climate LLC, and AGCO lead the competitive field. Source: MMA Primary Research Dataset, July 2026.
Primary Survey
n=3,800 procurement and R&D decision-makers, Q4 2025, six countries
Methodology
Demand-side build-up, cross-validated against public data, 47 expert interviews

Agriculture IoT Market Forecast Scenarios

agriculture-iot-market-size-forecast-scenario-1789998876227
Between 2020 and 2025, agriculture IoT adoption grew steadily at a 12.1% historical CAGR as large commercial farms proved out early sensor deployments and equipment financing programs made connected hardware more accessible. Growth was concentrated among row-crop operations in North America and China, while smallholder adoption across most other regions remained minimal throughout the period.
The base case assumes continued strong growth through 2036 as three mechanisms compound: sensor and connectivity hardware costs keep declining, government subsidy programs keep expanding farmer access to precision agriculture tools, and data platform vendors keep proving measurable yield and input-cost improvements that justify subscription renewal each season. Equipment manufacturer consolidation around integrated hardware-software bundles further supports sustained enterprise adoption across most major growing regions worldwide through the end of the decade.
The bull case centers on accelerated government subsidy expansion across major agricultural economies globally, which could push growth toward 14.5%. The bear case assumes commodity price weakness compresses farmer capital spending on new technology, pulling growth toward 11.9% as operations delay sensor and platform upgrades in favor of essential seed and fertilizer input purchases instead of new technology upgrades.

From Pilot Programs to Standard Farm Equipment

Agriculture IoT has moved from isolated pilot programs run by large commercial operations into a standard equipment category that mid-size farms now budget for annually alongside seed and fertilizer purchases each planting cycle, a shift that accelerated meaningfully over the past several years as hardware prices fell sharply across nearly every product category.
MARKET CONCENTRATIONCR5: 39%Top five vendors hold under two-fifths of global share
AVERAGE SENSOR COST$340 per unitTypical cost per soil or crop sensor node deployed
CONNECTIVITY PENETRATION46% via LPWANShare of deployments using low-power wide-area connectivity networks
SUBSCRIPTION RENEWAL84% annual renewalShare of farm customers renewing data platform subscriptions yearly
DEPLOYMENT CYCLE2 to 4 monthsTypical time from order through full field sensor deployment
YIELD IMPROVEMENT8 to 12% reportedAverage yield gain farms report after adopting sensing platforms
Equipment manufacturers are bundling sensing hardware directly into new machinery sales, using data platform subscriptions to generate recurring revenue long after the initial equipment purchase closes. Rural connectivity gaps remain the primary deployment obstacle, pushing vendors toward satellite and low-power wide-area network solutions rather than relying on cellular coverage that many farming regions still lack entirely, particularly across remote growing areas lacking existing telecom infrastructure investment.
Pricing is shifting from hardware-only sales toward bundled hardware-plus-subscription models that lower upfront cost but extend vendor revenue capture across multiple growing seasons rather than a single transaction. Livestock monitoring is emerging as a distinct high-growth category as ranchers adopt wearable sensors for herd health tracking, creating a new competitive front separate from crop-focused sensing platforms and their established vendor relationships built around crop equipment sales.
"Farmers do not buy sensors because they like data. They buy them because the data pays for itself within a season or two. Vendors that cannot prove that math quickly are losing the sale regardless of feature depth."
Senior Analyst, Agriculture Technology Practice · MMA Agriculture Practice · September 2026

Market Trends

Equipment Makers Bundle Sensing Into Machinery Sales

Major farm equipment manufacturers are increasingly embedding soil and crop sensors directly into new tractors, planters, and harvesters at the factory rather than selling connectivity as an aftermarket add-on. This bundling strategy locks farmers into manufacturer-specific data platforms from the point of equipment purchase, creating a recurring subscription revenue stream that extends well beyond the initial hardware transaction. Independent sensor vendors face mounting pressure to differentiate through open-platform compatibility as equipment makers push proprietary, closed platforms harder across their newest product lines, particularly among the largest full-line manufacturers competing directly for the same commercial farm accounts.
Market Impact: Subsidies cover up to 50%

Livestock Wearables Emerge as Distinct Growth Category

Wearable sensors tracking cattle health, movement, and reproductive cycles are emerging as a fast-growing category separate from crop-focused soil and canopy sensing, drawing dedicated vendor investment and venture funding. Large ranching operations report meaningful reductions in veterinary intervention costs and earlier disease detection through continuous monitoring rather than periodic manual inspection. This category is attracting specialized entrants who lack crop-sensing product lines entirely, competing purely on livestock health analytics accuracy, sensor durability, and multi-day battery life in harsh outdoor field conditions across varied climates and terrain types encountered across grazing operations.
Market Impact: Input usage cut 15 to 25%

Market Opportunities and Growth Drivers

Government Subsidy Programs Lower Farmer Adoption Barriers

National agriculture ministries across major producing economies have introduced subsidy programs covering 30 to 50% of precision sensing equipment cost, directly targeting the capital expenditure barrier that historically kept mid-size farms from adopting connected sensing hardware. China's rural digitalization initiative and comparable programs across the European Union are funding farmer training alongside hardware subsidies, addressing the adoption gap created by limited technical familiarity among older farm operators. Equipment vendors report subsidy-eligible regions consistently outpacing unsubsidized markets on adoption rate by a wide and growing margin each successive growing season across most regions.
Market Impact: 30% of farmland lacks reliable connectivity

Input Cost Pressure Rewards Precision Application

Rising fertilizer and water costs are pushing farmers toward precision application technology that can reduce input usage by 15 to 25% without sacrificing yield, creating a direct return-on-investment case that accelerates purchasing decisions independent of subsidy availability. Farms operating on thin margins increasingly treat sensing platforms as a cost-control tool rather than a yield-optimization luxury, reframing the purchase decision entirely. Vendors are responding by marketing input-cost savings ahead of yield improvement in sales materials targeting cost-conscious commercial operations facing sustained margin compression across most growing regions and commodity price cycles.
Market Impact: Interoperability adds 20% software cost

Market Restraints and Challenges

Rural Connectivity Gaps Limit Sensor Deployment Reach

Roughly 30% of commercial farmland across major agricultural economies lacks reliable cellular or broadband connectivity sufficient to support real-time sensor data transmission, forcing vendors to rely on costlier satellite backhaul or delayed batch uploads. The root cause is limited telecom infrastructure investment in low-population-density rural areas where return on network buildout does not justify carrier expenditure. The commercial impact is slower adoption in exactly the large, remote operations that would benefit most. Vendors are mitigating the gap through low-power wide-area network technology and edge-computing sensors that store data locally between uploads.
Market Impact: Bundled deployments up 34% yearly

Fragmented Data Standards Complicate Platform Interoperability

Farmers running equipment from multiple manufacturers face significant difficulty consolidating sensor data into a single unified view, since most vendors use proprietary data formats rather than shared industry standards. The root cause is a competitive incentive for equipment makers to keep customers locked inside proprietary platforms rather than supporting open data portability. The commercial impact includes duplicated software costs and incomplete farm-level analytics. Industry consortiums are developing shared data exchange standards, though adoption among the largest manufacturers remains inconsistent and slow across the largest, most established equipment manufacturers globally that dominate most regional equipment markets.
Market Impact: Livestock wearables grow 21% annually
3 additional market trends, 4 additional growth drivers, and 3 additional restraints and challenges are covered in the full report. Contact sales@marketmindsadvisory.com to access the complete intelligence.

Segment CAGR and Growth Architecture

The market splits across six categories spanning sensing hardware, connectivity infrastructure, and software platforms used to monitor field and livestock conditions. Soil and crop sensing platforms and livestock monitoring wearables are growing fastest as equipment financing and government subsidy programs lower adoption barriers for mid-size commercial farms across most major producing regions covered across this analysis.
Section default visual

Soil and Crop Sensing Platforms

Soil and crop sensing platforms combine moisture, nutrient, and temperature sensors with cloud-based analytics that translate raw readings into actionable irrigation and fertilization recommendations for farm operators. Growth is concentrated among row-crop operations across North America and China, where government subsidy programs and equipment financing make sensor networks financially accessible to mid-size farms rather than only the largest commercial operations. Vendors compete primarily on sensor accuracy, battery life under field conditions, and the quality of agronomic recommendations generated from accumulated field data across multiple growing seasons, a track record newer entrants have not yet accumulated across a broad enough set of soil types, crop varieties, and regional climate conditions to date.
CAGR 19.4%

Livestock Monitoring Wearables

Livestock monitoring wearables track cattle location, movement patterns, and vital signs to enable earlier disease detection and more efficient herd management across large ranching operations. Adoption is accelerating fastest among cattle and dairy operations facing rising veterinary costs and labor shortages that make continuous automated monitoring more economical than manual herd inspection. Vendors differentiate on sensor durability in harsh outdoor conditions, battery life between charges, and integration depth with existing herd management software platforms that ranchers already rely on daily to run large-scale grazing and feedlot operations spanning thousands of head of cattle across multiple pasture locations simultaneously, often spread across noncontiguous ranch properties under shared corporate ownership and management groups.
CAGR 16.7%
Full segment breakdown across 7 segments available in the complete report.

Regional Architecture and Country Demand Map

Regional adoption tracks government subsidy programs and farm size distribution closely across the seven markets covered in this report. East Asia and North America lead on absolute spend, while South Asia and Pacific posts the fastest growth as smallholder modernization programs continue expanding access steadily.

East Asia

China's rural digitalization initiative is funding sensor and connectivity subsidies across millions of small and mid-size farms, driving the region's position as the largest agriculture IoT market globally by absolute spend. Japan's aging farmer population is accelerating adoption of automated monitoring tools that reduce the physical labor required for daily field inspection. South Korea's government is funding smart farm pilot clusters designed to demonstrate measurable yield improvements to skeptical smallholder operators. Local sensor manufacturers are gaining share against international vendors by pricing aggressively for the region's large volume of smaller farm operations that global vendors often find too costly to serve profitably given thin margins on individual sensor units sold at high volume and low unit price.
Share: 27% | CAGR: 14.3% (2026 to 2036)

North America

Large-scale row-crop operations across the United States and Canada have driven the deepest existing sensor deployment base globally, supported by equipment financing programs that spread hardware cost across multiple growing seasons. Precision agriculture has become a standard input decision rather than an experimental technology for commercial-scale corn and soybean operations across the Midwest. Water scarcity concerns across the western United States are pushing irrigation-focused sensing adoption higher than in wetter growing regions. Equipment manufacturers headquartered in the region continue to set the pace for product innovation across the broader global market through continued investment in next-generation sensing capability and integrated data analytics tools built for large-scale commercial operations spanning row-crop, specialty, and livestock segments alike.
Share: 25% | CAGR: 14.5% (2026 to 2036)
Regional intelligence for 5 additional markets available in the complete report: Western Europe, South Asia and Pacific, Latin America, Middle East and Africa, Eastern Europe. Contact sales@marketmindsadvisory.com.
agriculture-iot-market-market-share-analysis-1789998876766

Turning Farm Sensors Into Recurring Revenue

Vendors are expanding revenue beyond one-time hardware sales through data platform subscriptions, agronomic advisory services, and equipment financing arrangements offered directly to commercial farm customers. These layered revenue streams generate materially higher lifetime value per farm account than standalone sensor sales while deepening customer retention across multiple growing seasons rather than a single upfront transaction.

Expand Subscription-Based Agronomic Advisory Service Tiers

Vendors bundling agronomic advisory recommendations alongside raw sensor data capture materially higher recurring revenue than hardware-only sales, since advisory subscriptions typically add 25 to 35% on top of base platform pricing. Farmers increasingly value actionable recommendations over raw data they lack the expertise to interpret themselves, making advisory services the fastest-growing revenue category for established sensor vendors. Companies that built agronomic expertise in-house are now winning renewal decisions against competitors offering data alone without interpretation, an advantage that compounds with every additional field season of accumulated proprietary crop and soil data.
Market Impact: Advisory services add 25 to 35% recurring revenue

Offer Equipment Financing to Lower Entry Barriers

Vendor-provided financing programs spreading sensor and platform costs across multiple growing seasons increase deal conversion among mid-size farms that previously found upfront hardware costs prohibitive. Financing programs typically increase closed deal volume by 20 to 30% among farms below a certain revenue threshold, expanding the addressable market meaningfully. Vendors with in-house financing capability are outcompeting smaller rivals who must rely on third-party lenders and slower approval processes that discourage price-sensitive, cash-constrained mid-size farm buyers from completing a purchase decision in a single budget cycle without spreading cost across future harvest revenue.
Market Impact: Financing programs lift closed deal volume 20 to 30%

Monetize Aggregated Anonymized Yield Benchmark Data

Vendors are packaging anonymized, aggregated yield and input-usage data across their customer base into benchmark reports sold to agricultural input suppliers and commodity traders, generating high-margin revenue independent of individual farm subscriptions, at premium pricing roughly 12 to 18% above base platform fees. This revenue stream requires no additional hardware deployment and scales directly with existing sensor network size, making it highly attractive to vendors with the largest installed customer bases already collecting comparable field data across thousands of individual farm accounts spanning multiple crop types, growing regions, and soil classification categories.
Market Impact: Benchmark data licensing adds 12 to 18% margin

Extend Livestock Wearables Into Insurance Partnerships

Vendors are partnering with agricultural insurers to offer premium discounts for ranchers using continuous livestock health monitoring, converting sensor deployment into a co-marketed revenue channel that reduces effective customer acquisition cost by roughly 15%. Insurers benefit from earlier disease detection reducing claim frequency, creating an aligned incentive structure between vendor, rancher, and insurer that few competing hardware categories can replicate as convincingly across the broader agricultural technology landscape currently competing for the same ranching customer base and insurance distribution channels across most major agricultural markets where livestock insurance products are already well established.
Market Impact: Insurance tie-ins cut acquisition cost by roughly 15%

Who Controls the Margin Pool

The market remains fragmented with a CR5 of 39%, reflecting the diversity of hardware, connectivity, and software providers competing across distinct sub-categories. John Deere and Trimble lead through deep integration with existing equipment sales channels, while smaller specialists compete on sensor accuracy and software usability. The gap between the top two vendors and the broader field remains moderate rather than commanding across most sub-categories tracked in this analysis.
Current competitive activity centers on bundling sensing hardware directly into new equipment sales and building proprietary data platforms that lock farmers into manufacturer-specific platforms long after the initial purchase. Several vendors have expanded into livestock monitoring as an adjacent category, while others pursue acquisition of specialized sensor startups to accelerate product development timelines across their existing customer base rather than building comparable capability internally from scratch.

Emerging pressure is coming from telecom operators and cloud providers expanding into agricultural data platforms, threatening to commoditize standalone sensing hardware as a feature within broader connectivity offerings. Rankings could shift meaningfully if a major technology company enters the market directly, pressuring established agricultural equipment vendors to prove differentiated value beyond basic sensor deployment and raw connectivity provisioning alone.
agriculture-iot-market-country-cagr-analysis-1789998877292

Competitive Moat and Risk Dimensions

JOHN DEERE

Moat: Equipment Distribution Network Scale

John Deere's extensive dealer network gives it direct access to farmers at the point of equipment purchase, letting it bundle sensing hardware into machinery sales that competitors without comparable distribution reach cannot easily replicate. This installed dealer relationship advantage extends far beyond the initial equipment transaction itself.
JOHN DEERE

Risk: Proprietary Platform Limits Flexibility

John Deere's proprietary data platform requires farmers to commit to its equipment platform, which can deter operations running mixed-brand machinery fleets from adopting its sensing tools fully. Competitors offering open, brand-agnostic platforms may capture share among farmers unwilling to commit to a single manufacturer's closed platform.
TRIMBLE

Moat: Cross-Brand Platform Compatibility

Trimble's positioning as an equipment-agnostic technology provider lets it serve farmers running mixed-brand machinery fleets, a meaningful advantage over equipment manufacturers selling only proprietary, closed platforms. This cross-brand compatibility broadens its addressable market beyond any single manufacturer's existing customer base considerably beyond what any single equipment brand alone could offer.
TRIMBLE

Risk: Lacks Direct Equipment Sales Channel

Trimble lacks the direct equipment sales channel that manufacturer-owned platforms use to bundle sensing hardware at the point of purchase, requiring more expensive standalone sales and marketing effort to reach farmers who might otherwise adopt a bundled competitor offering by default at a lower effective cost.

Players Tracked

Prominent Players

John Deere
Trimble
CNH Industrial
Climate LLC
AGCO

Other Key Players

Kubota
Raven Industries
Farmers Edge
Taranis
Semios
Arable Labs
CropX
Sencrop
Allflex Livestock Intelligence
Cargill Digital
Corteva Agriscience
Topcon Agriculture
Ceres Imaging
Prospera Technologies
SmartBell

Recent Developments

MARCH 2026

John Deere acquired a specialized soil sensing startup to accelerate development of next-generation nutrient monitoring capability integrated directly into its equipment lineup. The acquisition adds proprietary sensor technology and agronomic modeling expertise that strengthens John Deere's existing data platform offering considerably across its customer base.
Signal: Signals that equipment manufacturers are racing to deepen proprietary sensing technology capability quickly and decisively across product lines.
NOVEMBER 2025

Trimble entered a multi-year supply agreement with a major agricultural cooperative to deploy its sensing platform across member farms as part of a shared infrastructure program. The agreement expands Trimble's addressable reach into smaller farms that could not previously justify individual platform costs on their own.
Signal: Shows cooperative purchasing models emerging as a viable distribution channel reaching smaller, previously underserved farm operations.
JULY 2025

CNH Industrial expanded manufacturing capacity for its connected sensing hardware line following sustained demand growth across row-crop operations in North America and Latin America. The expansion includes new regional distribution centers designed to reduce equipment delivery timelines for commercial farm customers substantially, particularly across mid-size regional dealer networks.
Signal: Reflects sustained enterprise demand growth pulling new manufacturing capacity investment directly into sensing hardware production lines.

Semiconductor and Connectivity Cost Exposure

Semiconductor components for sensors and connectivity modules represent roughly 32% of vendor cost of goods sold, sourced primarily from Asian foundries and specialized IoT chipset manufacturers concentrated in Taiwan and South Korea. Battery and enclosure materials represent a further 18% of hardware cost, sourced globally from a fragmented base of industrial component suppliers spread across multiple manufacturing regions.
A 2025 semiconductor supply disruption tied to a major foundry capacity constraint, reported in company annual filings, raised sensor chipset costs by an estimated 14% for vendors without long-term supply agreements in place. Smaller agriculture IoT vendors lacking direct foundry relationships absorbed the increase directly, delaying some product shipments during the affected quarter according to disclosed vendor commentary covering the affected reporting period across multiple regional manufacturing sites.

Vendors dependent on spot-market chipset purchasing face greater cost exposure than those with long-term supply agreements directly with foundries, since spot-market dependency removes negotiating leverage during periods of constrained capacity. Larger vendors with dedicated procurement teams and committed volume agreements can absorb these cost shifts more easily than smaller competitors buying components through distributors without any similar long-term arrangements in place.
agriculture-iot-market-company-positioning-matrix-1789998877489

Negotiate Long-Term Foundry Supply Agreements Directly

Larger vendors are securing multi-year supply agreements directly with semiconductor foundries rather than purchasing through distributors, locking in pricing and allocation priority during periods of constrained manufacturing capacity. This approach shields margins from spot-market price volatility that smaller competitors remain exposed to fully during comparable periods of industry-wide capacity tightness that smaller rivals cannot navigate as effectively.

Diversify Chipset Sourcing Across Multiple Suppliers

Vendors are qualifying multiple chipset suppliers for the same sensor components, reducing single-source dependency risk and improving negotiating leverage during supply disruptions, though it adds testing and qualification overhead that smaller vendors sometimes struggle to absorb given limited engineering resources available across their smaller engineering teams already stretched thin managing several other competing product development priorities simultaneously.

Redesign Sensors Around More Available Chipsets

Vendors are redesigning sensor circuit boards to use more widely available chipset families rather than specialized components subject to concentrated foundry risk, trading some performance optimization for meaningfully improved supply chain resilience during periods of industry-wide capacity constraint affecting the broader semiconductor industry and its downstream component buyers across every hardware category the vendor currently serves.

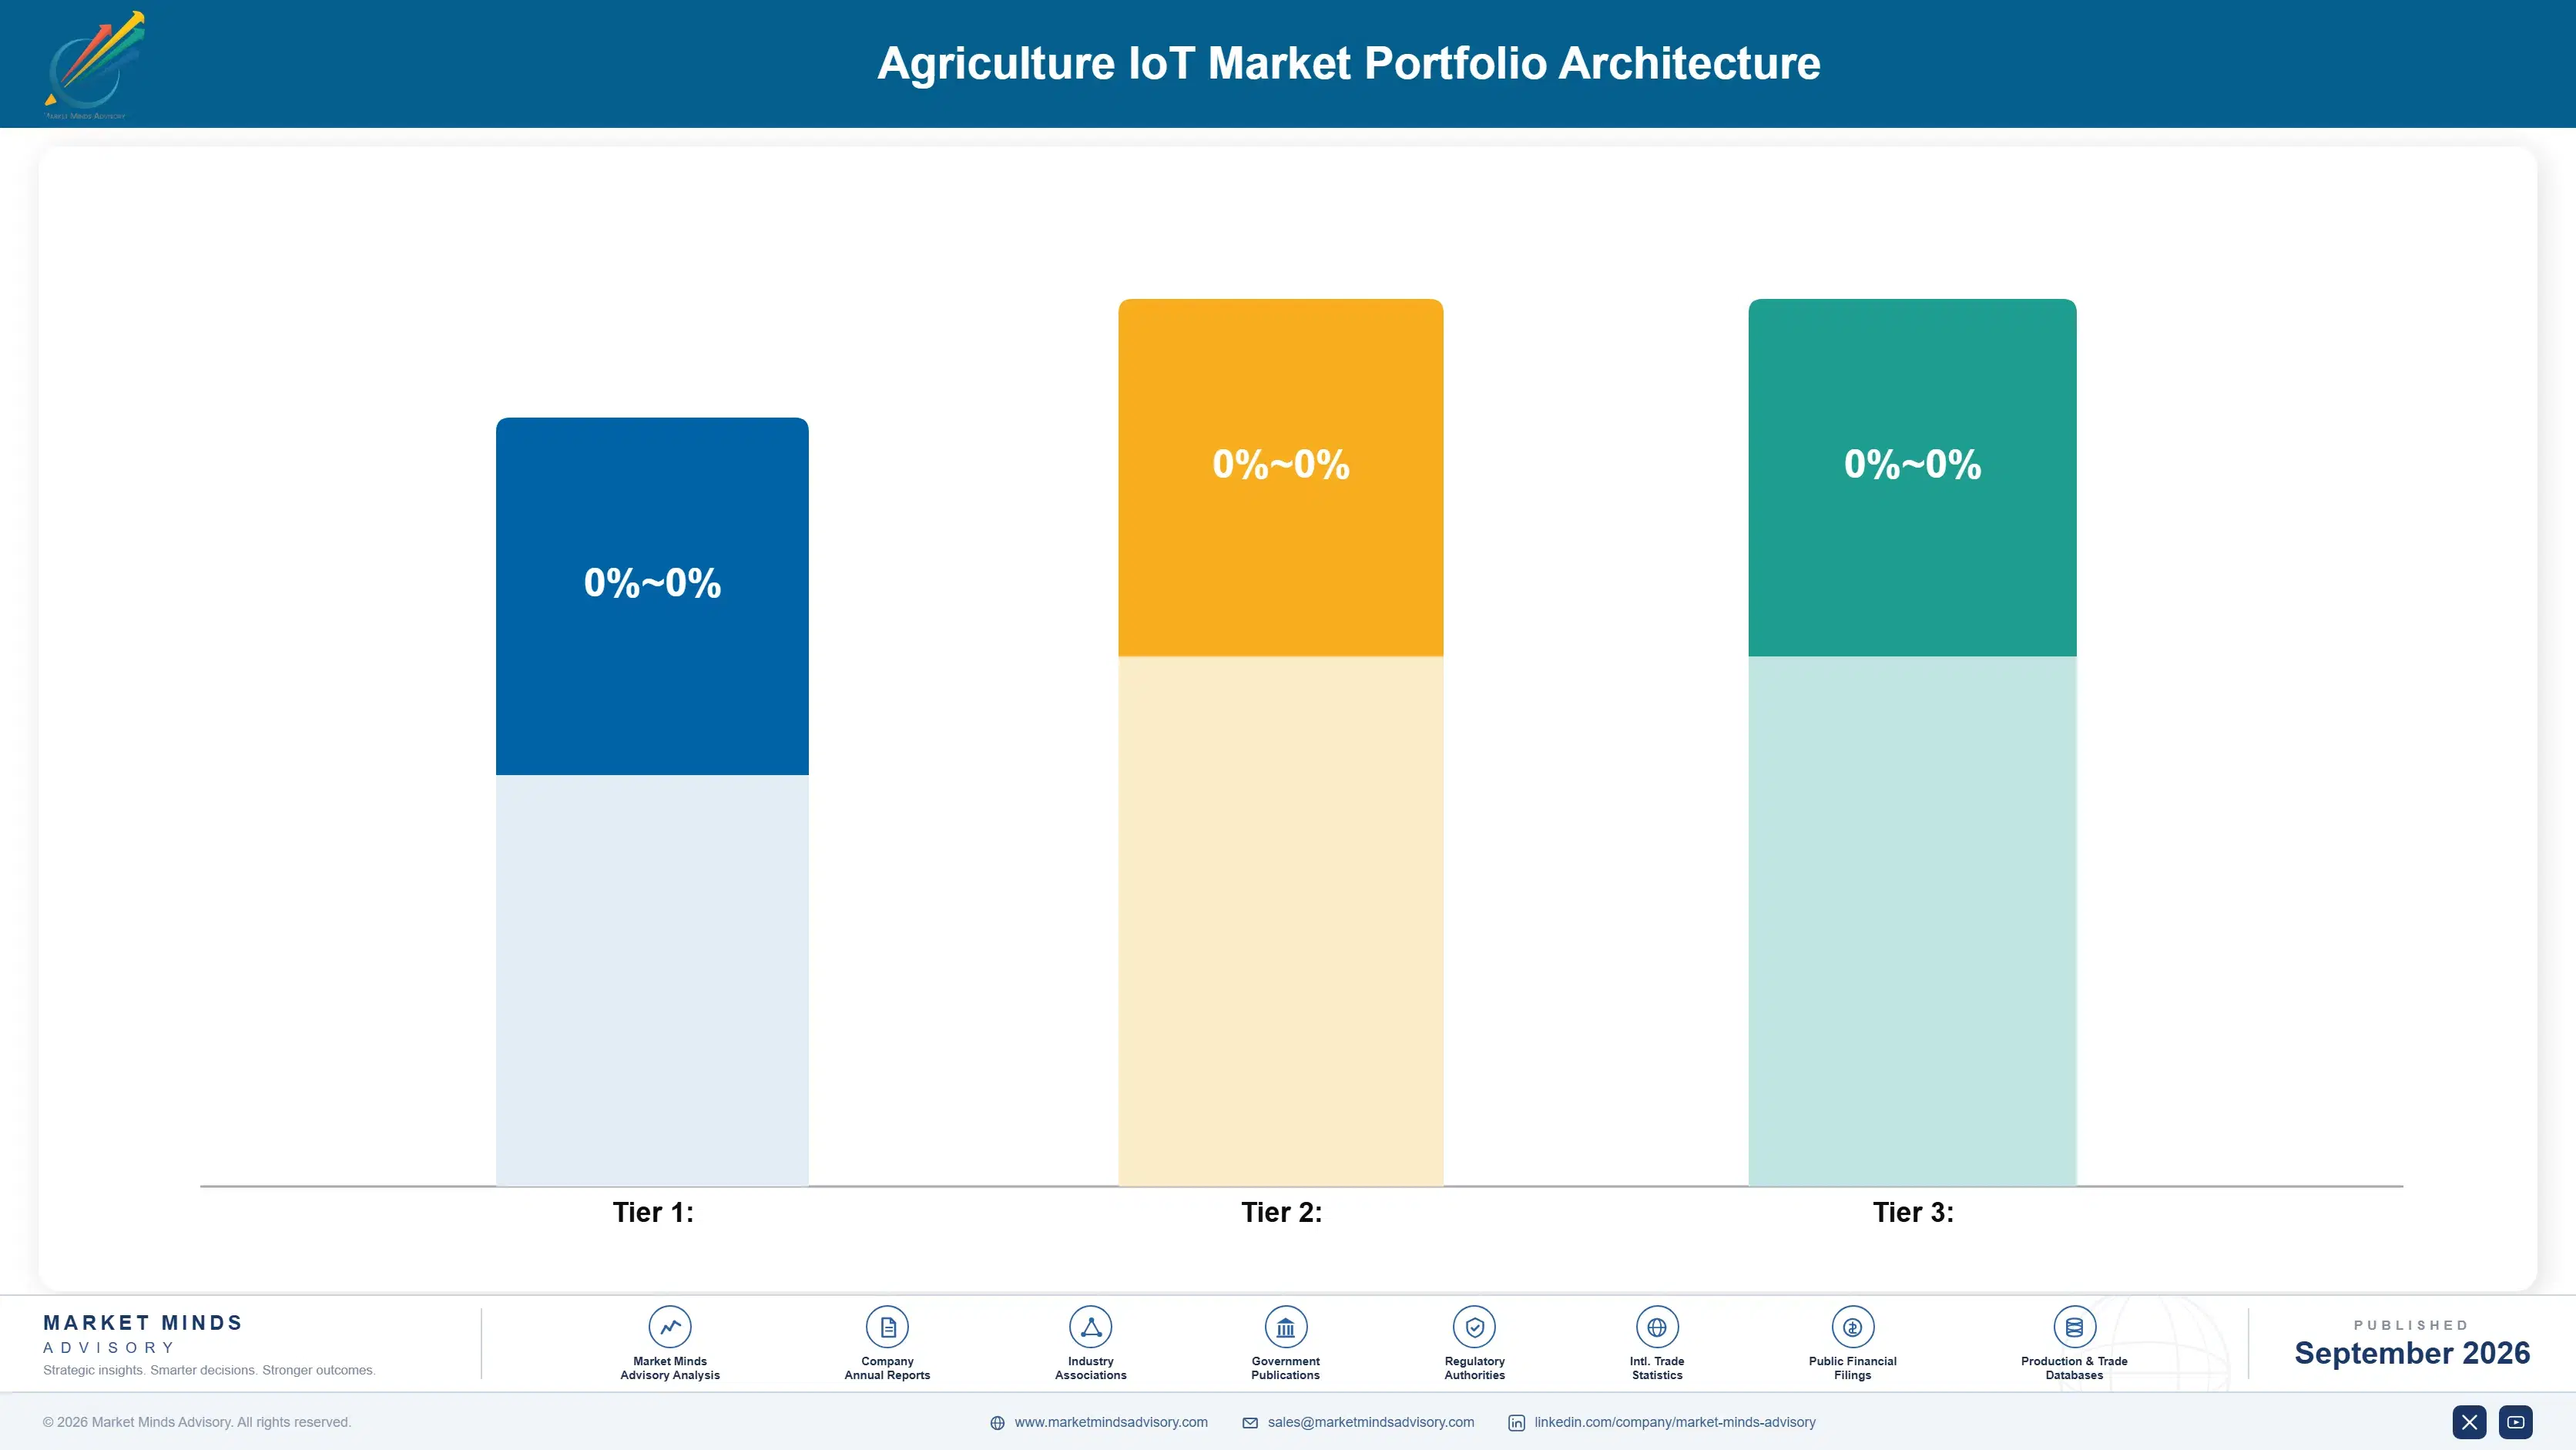
Portfolio Architecture for Margin Defence

Portfolio economics split across three tiers running from basic commodity sensors to premium certified precision agriculture platforms and forward-looking sustainability and regulatory-compliance tools. Gross margins widen considerably moving up the tier structure, reflecting the specialized agronomic modeling and software development effort required to build reliable, differentiated recommendation engines that hold up reliably across diverse growing conditions.
Volume-tier sensors face persistently lower long-term returns as commoditization pressure intensifies from low-cost Asian manufacturers entering the market aggressively on price alone. Premium platforms retain pricing power because customers cannot easily replicate proprietary agronomic models trained on years of accumulated field data across large, diverse farm customer bases spanning multiple crop types and regional growing conditions accumulated over many seasons.

High-value revenue pools concentrate in enterprise accounts requiring certified compliance reporting and advisory services layered atop core sensing hardware, where switching costs run highest and renewal rates stay strongest across the customer base. Vendors positioning purely on hardware price compete for shrinking margin in the volume tier, while those investing in certification and proprietary model development capture disproportionate value as the market matures further over the coming decade of continued adoption.

Basic soil moisture and temperature sensors competing primarily on price against low-cost manufacturers, with gross margins in the 25 to 35% range across most commodity-tier vendors competing primarily on unit price alone.
Gross Margin

Precision sensing platforms with proprietary agronomic modeling and formal accuracy certifications, carrying gross margins between 50 and 60% across the premium vendor segment offering differentiated agronomic recommendations backed by proprietary accumulated field data.
Gross Margin

Platforms built for automated regulatory compliance reporting and carbon or sustainability certification tracking, commanding gross margins above 60% given specialized development investment required to build and continuously maintain these specialized compliance capabilities.
Gross Margin
agriculture-iot-market-cost-volatility-analysis-1789998877994

High-value Sub-segments and Strategic Watch-out

Soil and Crop Sensing Platforms

The highest-value, fastest-growing segment as government subsidy programs and equipment financing expand access for mid-size farms, with margins and growth rates both leading the broader market across nearly every region tracked in this report by a wide margin, a lead vendors expect to persist through the entire forecast decade.

Livestock Monitoring Wearables

A high-value segment growing steadily as ranchers adopt continuous herd health tracking to reduce veterinary costs, drawing dedicated vendor investment separate from established crop-sensing product categories and their existing customer relationships across the industry, particularly among large ranching operations facing acute labor shortages and rising veterinary service costs.

Connectivity Infrastructure and Gateways

The volume core of the market, generating steady revenue from network infrastructure sales even as growth decelerates relative to newer sensing and analytics categories capturing increasing enterprise budget allocation away from basic connectivity provisioning toward higher-margin platform categories entirely as the underlying market continues to mature.

Automated Compliance Reporting Tools

A strategic watch-out segment as regulatory pressure around water usage and fertilizer runoff intensifies across major growing regions, a category still underserved by most mainstream vendors despite growing demand from regulated commercial farm operations everywhere, particularly across the largest regulated export-oriented growing operations facing tightening enforcement deadlines.

Sensing as a Seasonal Annuity

Agriculture IoT platforms generate durable, multi-season revenue because accumulated field data compounds in value over time, making a switch to a competing platform costly in terms of lost agronomic history and recommendation accuracy built up across prior growing seasons of continuous field-level data collection unavailable to any competing platform.
Adoption stickiness varies by end-use vertical: row-crop operations show the deepest platform dependence given the multi-year agronomic modeling built on accumulated soil and yield data, while livestock operations show comparatively higher willingness to switch vendors as newer wearable technology becomes available in the broader market. Specialty crop growers adopt more cautiously but retain platforms longer once deployed, given the complexity of crop-specific calibration required for accurate, crop-specific recommendation accuracy over time.

Buyer profiles are shifting generationally as younger farm operators increasingly favor mobile-first, subscription-based platforms over the equipment-bundled purchasing processes that defined their parents' generation of farm technology adoption decisions. Younger operators entering decision-making roles show stronger preference for cross-brand compatible platforms and consumption-based pricing over the long-term equipment financing arrangements that previously anchored purchasing decisions across most commercial farm operations of the immediately prior farming generation.
Section default visual

Where MMA Sees the Advantage

These are among the four positions where our research anticipates prominent divergence between winners and laggards over the coming forecast period. Each is grounded in the demand model, the regulatory perimeter, and the announced capacity pipeline.
01 / SOIL SENSING PLATFORM INVESTMENT

Prioritize soil and crop sensing over legacy hardware upgrades

Farm equipment vendors and investors should direct new product development budget toward soil and crop sensing platforms rather than incremental legacy hardware upgrades, since this is the fastest-growing segment in the market today. It expands at 19.4% CAGR, roughly 1.47 times the overall market rate, concentrated heavily among row-crop operations in North America and China. Vendors slow to shift investment risk ceding this growth to faster-moving specialized competitors already capturing this growth across every major producing region tracked in this report's full geographic coverage.
02 / AGRONOMIC ADVISORY BUNDLING

Bundle agronomic advisory services to capture higher recurring revenue

Vendors should expand agronomic advisory subscription tiers rather than competing purely on sensor hardware pricing, since advisory services add 25 to 35% incremental recurring revenue while addressing farmers' persistent need for interpretation rather than raw data alone. Companies with in-house agronomic expertise are already winning renewal decisions against hardware-only competitors. Vendors without comparable advisory capability risk losing renewal accounts to better-resourced rivals over time as farmers increasingly demand deeper interpretation rather than raw sensor readings alone, a preference reshaping subscription pricing across the industry.
03 / EAST ASIAN MARKET CONCENTRATION

Concentrate expansion investment across East Asia and China specifically

East Asia holds 27% of global market share and remains the largest single region given China's rural digitalization subsidy programs funding sensor adoption at scale. Vendors should prioritize localized product development and government partnership investment there before other regions. Adoption economics favor vendors able to price aggressively for the region's large volume of smaller farm operations that global competitors often find too costly to serve profitably given thin margins on individual sensor units sold at high volume and low unit price.
04 / CONNECTIVITY INFRASTRUCTURE RISK

Address rural connectivity gaps before scaling deployment further

Roughly 30% of commercial farmland lacks reliable connectivity sufficient for real-time sensor data transmission, threatening to slow adoption in exactly the large, remote operations that stand to benefit most from precision sensing. The root cause is limited telecom infrastructure investment in low-density rural areas. Vendors investing in low-power wide-area network technology and edge computing will outcompete rivals dependent solely on cellular coverage that many rural farming regions still lack entirely, particularly across the most remote growing regions farthest from existing telecom infrastructure.

Engagement Snapshot From the Field

A live engagement with an industry participant carrying material or product regulatory and market exposure ahead of a defining policy shift, showing how our research translates into a defensible multi-year portfolio strategy.
MARKET MINDS ADVISORY · CLIENT ENGAGEMENT SUMMARY
Agriculture IoT Producer Strategic Portfolio Review and Transition Roadmap 2026·Investment Scenario on Agriculture IoT Exposure Evaluation 2025-26
CLIENT PROFILE
The client is a large agricultural cooperative representing over two thousand member farms across a major grain-growing region, operating shared equipment and purchasing programs on behalf of members lacking scale to negotiate directly with technology vendors. Facing member pressure to modernize input management amid rising fertilizer costs, leadership sought an independent assessment of platforms delivering measurable cost savings across a diverse membership.
STRATEGIC CHALLENGE
The cooperative's board lacked a consistent framework for evaluating vendor platforms across member farms with widely varying operation sizes, soil types, and existing equipment brands, since prior technology decisions had been made on an ad hoc basis by individual regional chapters. Competing vendor sales teams were separately courting different chapters, creating fragmented adoption and inconsistent pricing across the cooperative's membership.
MMA APPROACH
MMA built a standardized vendor scoring framework evaluating sensor accuracy, cross-brand equipment compatibility, and total cost of ownership across a representative sample of member farm profiles spanning small, mid-size, and large operations. The engagement combined vendor proof-of-concept testing across member fields, farmer satisfaction interviews, and negotiated group pricing modeling across a five-year adoption horizon.
KEY FINDINGS
  1. Two of five evaluated vendors demonstrated meaningfully broader cross-brand equipment compatibility, a critical requirement given the cooperative's diverse membership equipment fleet spanning multiple manufacturer brands.
  2. Negotiating group pricing across the full cooperative membership rather than individual chapter agreements reduced projected per-farm hardware cost by an estimated 28%.
  3. Member farms adopting recommended sensing platforms during pilot testing reported average fertilizer input reductions of roughly 18% without any measurable yield loss during the trial period.
  4. Smaller member farms showed the strongest return on investment relative to farm size, reversing the cooperative's initial assumption that larger operations would benefit most.
CLIENT PROFILE
The client is a large agricultural cooperative representing over two thousand member farms across a major grain-growing region, operating shared equipment and purchasing programs on behalf of members lacking scale to negotiate directly with technology vendors. Facing member pressure to modernize input management amid rising fertilizer costs, leadership sought an independent assessment of platforms delivering measurable cost savings across a diverse membership.
STRATEGIC CHALLENGE
The cooperative's board lacked a consistent framework for evaluating vendor platforms across member farms with widely varying operation sizes, soil types, and existing equipment brands, since prior technology decisions had been made on an ad hoc basis by individual regional chapters. Competing vendor sales teams were separately courting different chapters, creating fragmented adoption and inconsistent pricing across the cooperative's membership.
MMA APPROACH
MMA built a standardized vendor scoring framework evaluating sensor accuracy, cross-brand equipment compatibility, and total cost of ownership across a representative sample of member farm profiles spanning small, mid-size, and large operations. The engagement combined vendor proof-of-concept testing across member fields, farmer satisfaction interviews, and negotiated group pricing modeling across a five-year adoption horizon.
KEY FINDINGS
  1. Two of five evaluated vendors demonstrated meaningfully broader cross-brand equipment compatibility, a critical requirement given the cooperative's diverse membership equipment fleet spanning multiple manufacturer brands.
  2. Negotiating group pricing across the full cooperative membership rather than individual chapter agreements reduced projected per-farm hardware cost by an estimated 28%.
  3. Member farms adopting recommended sensing platforms during pilot testing reported average fertilizer input reductions of roughly 18% without any measurable yield loss during the trial period.
  4. Smaller member farms showed the strongest return on investment relative to farm size, reversing the cooperative's initial assumption that larger operations would benefit most.
RECOMMENDED STRATEGY
Phase 1: Phase one negotiates a group pricing agreement with the two highest-compatibility vendors, structured to serve the cooperative's full membership base. Phase 2: Phase two sequences chapter-level rollout starting with chapters showing the strongest pilot testing results and member enthusiasm for adoption during the initial pilot testing phase. Phase 3: Phase three establishes a standardized vendor evaluation framework for future cooperative technology purchasing decisions across all member chapters going forward into future budget cycles.
OUTCOME
The cooperative approved a group pricing agreement covering its full membership with a projected first-year technology spend of approximately $34 million (client-reported, unverified by MMA). Member satisfaction surveys credited the standardized framework with resolving prior chapter-level purchasing disputes and accelerating adoption meaningfully faster than the cooperative's original multi-year rollout timeline.

Frequently Asked Questions

Foundational context covering the market sizes, CAGR, scope, country, region and competition that inform every finding below. This section is provided to cover basics and most often pre-purchase conversations, answered from the MMA Primary Research Dataset.

What is the current size of the Agriculture IoT Market?

The global Agriculture IoT market reached $28.4 billion in 2025. Growth is driven primarily by falling sensor costs and expanding government subsidy programs for precision agriculture.

How large will the Agriculture IoT Market be by 2036?

The market is projected to reach $111.08 billion by 2036. This reflects sustained farmer demand for connected sensing across soil, crop, and livestock monitoring categories.

What is the CAGR for the Agriculture IoT Market 2026 to 2036?

The market is forecast to grow at a 13.2% CAGR between 2026 and 2036. This accelerates from the 12.1% historical CAGR recorded over 2020 to 2025.

Which segment is growing fastest?

Soil and Crop Sensing Platforms is the fastest-growing segment, expanding at 19.4% CAGR, roughly 1.47 times the overall market rate. Subsidy programs concentrate demand in this category.

Who are the major companies in the Agriculture IoT Market?

John Deere, Trimble, CNH Industrial, Climate LLC, and AGCO lead the competitive landscape, together holding an estimated 39% combined share. Each competes on hardware bundling and platform reach.

Which country is growing fastest?

China is the fastest-growing country market, expanding at 15.8% CAGR. Rural digitalization subsidy programs are driving accelerated sensor adoption across millions of smallholder farms nationwide.

Report Segmentation Architecture

The full report scope spans multiple orthogonal segmentation dimensions, with cross-tabulated demand data provided for each dimension pair. Coverage extends further to regional breakdowns, trend trajectories, and the competitive detail needed to support segment-level decision-making.

By Product Type (Soil Sensors, Livestock Wearables, Connectivity, Software)

    By End-Use Application (Row-Crop, Specialty Crop, Livestock, Aquaculture)

      By Commercial Dimension (Direct Sale, Subscription, Cooperative Purchasing)

        By Region

        • East Asia
        • North America
        • Western Europe
        • South Asia and Pacific
        • Latin America
        • Middle East and Africa
        • Eastern Europe

        Scope, Methodology, and Coverage

        Every figure in this report is reproducible from documented input assumptions. The scope below maps the historical period, the forecast horizon, the segmentation dimensions, and the countries covered, alongside the underlying primary and qualitative methodology.
        Historical Period
        2020 to 2025
        Forecast Period
        2026 to 2036
        Base Year
        2025 (USD billions; MMA Primary Research Dataset, September 2026)
        Market Definition
        This report defines the Agriculture IoT Market as connected sensing hardware, wireless connectivity infrastructure, and software platforms used to monitor soil, crop, and livestock conditions on commercial farms, including soil sensors, drone-based imaging, and farm management software. It excludes autonomous farm equipment, agricultural drones sold as standalone hardware without connected sensing capability, and general farm accounting software.
        Quantitative Units
        USD billions, market share percentages, CAGR percentages
        Segmentation Dimensions
        Product type, end-use application, commercial dimension, region
        Regions Covered
        East Asia, North America, Western Europe, South Asia and Pacific, Latin America, Middle East and Africa, Eastern Europe
        Countries Covered
        United States, China, Brazil, India, Germany, Australia, Japan, Kenya, and 22 additional markets
        Key Companies Profiled
        John Deere, Trimble, CNH Industrial, Climate LLC, AGCO, and 15 additional participants
        Quantitative Methodology
        Primary survey, n=3,800 respondents, Q4 2025, six countries; demand-side model with trade association cross-validation
        Qualitative Methodology
        47 expert interviews, Q4 2025; applied to validate demand model assumptions, identify emerging dynamics, and assess competitive positioning
        Report Format
        PDF and XLSX data workbook (Word format preview document)
        Publisher
        Market Minds Advisory
        Report Code
        MMA-2026-AGR-207
        Published
        September 2026
        Contact
        sales@marketmindsadvisory.com | www.marketmindsadvisory.com

        Purchase the full Agriculture IoT Market Report (2026 to 2036).

        This report examines the global agriculture IoT market across soil sensing, livestock wearables, and connectivity categories through the year 2036. It quantifies demand shifts driven by falling hardware costs and government subsidy programs across major agricultural economies worldwide. Profiles of five leading vendors sit alongside fifteen additional participants, assessed on a common concentration and capability basis across the competitive landscape. Regional adoption patterns are detailed across all seven geographies in the underlying dataset. Coverage also includes forecast scenarios, cost exposure, and portfolio margin economics across three equipment tiers.
        Ten-year demand forecast by product category
        Vendor cross-brand compatibility and pricing benchmarking
        Regional adoption pattern analysis across seven geographies
        Semiconductor cost exposure and mitigation pathway assessment
        Portfolio margin economics across three product tiers
        Competitive positioning and moat durability assessment

        Built For The People Who Decide

        From boardroom strategy to bench-side execution, this report is read cover-to-cover by leaders shaping the next decade of their industry, turning demand scenarios, market dynamics and valuation benchmarks into decisions.
        CXOs/ Presidents/ VPs/ Managers
        M&A and Corporate Development
        Strategy Teams and R&D Heads
        Procurement and Product Directors
        Regulatory and Compliance Leaders
        Investor Relations and Equity Analysts