Market Minds Advisory
Agent-Oriented Enterprise Architecture Market

Agent-Oriented Enterprise Architecture Market: Agent-Oriented Enterprise Architecture: Machine Identity, Capability Registries and Governing What Was Deployed Before Anyone Was Watching

Enterprises deployed autonomous agents far faster than they could build any control plane, and most of them now cannot enumerate what is actually running or what standing credentials those agents quietly hold.

Lead Analyst

Published

September 2026

Make Smarter Decisions with Customized Research Insights

Request a free sample report and evaluate market opportunities, growth trends, and competitive dynamics relevant to your business needs.

2025 MARKET VALUE$0.7BMarket Size 2025
2036 FORECAST VALUE$4.1BBase Case , 2026 to 2036
CAGR 2026 TO 203617.4 %Bull 18.6% / Bear 16.0%
INCREMENTAL OPPORTUNITY$3.3BNet 10- year value creation
EXPANSION MULTIPLE4.98x2036 value over 2026 base
Strategic Levers
M&A Pipeline
Regional Outlook
Country Rankings
Competitive Intelligence
Segmental Deep-dive
Call-Us : 91 93563 13602

Executive Snapshot and Market Trajectory.

Roughly 58% of agents running in large enterprises appear in no central inventory, and about 71% hold standing credentials rather than short-lived grants. That is the actual problem this market exists to solve, whatever the architecture language around it suggests. Architecture language obscures a fairly blunt operational failure.
Most of what is being sold is not new. Capability modelling, service catalogues and reference architectures have been enterprise architecture practice for twenty years. What is genuinely new is identity and entitlement for actors that are not people, growing at 26.1%, half again the market rate of 17.4%. North America takes 43% of spending because that is where agents were deployed first and fastest.
Concentration is very low at roughly 22% across the top five on measured software and attributable services revenue, and the field is forming from three directions at once. Architecture tool vendors are adding agent objects to existing metamodels, identity vendors are attacking from the control side, and platform vendors are bundling. Around 64% of spend is still services. Software revenue in this category is not yet a settled proposition , and bundling keeps narrowing it.
Market Definition
This market covers software and attributable advisory services that model, register, control and audit autonomous software agents as architectural elements of an enterprise, spanning agent capability metamodels, tool and capability registries, non-human identity and entitlement control, orchestration topology design, evaluation and guardrail frameworks, and agent action observability. Revenue is measured as subscription and directly attributable advisory services. Agent development frameworks, large language model inference, general enterprise architecture tooling without agent constructs, and workload orchestration infrastructure are excluded.
Base Year Value
$0.7B in 2025 (MMA Primary Research Dataset, September 2026)
Forecast Period
2026 to 2036, eleven discrete annual values
CAGR
17.4% base case. Bull 18.6%. Bear 16.0%.
Fastest Growth Segment
Non-Human Identity and Entitlement Control: 26.1% CAGR
Fastest Growth Country
India: 23.2% CAGR
Fastest Growth Region
South Asia and Pacific: 19.8% CAGR
Largest Region
North America: 43% of 2025 global value
Market Leaders
Microsoft, SAP, ServiceNow, CyberArk and Okta lead on measured agent architecture software and attributable services revenue. Source: MMA Primary Research Dataset, July 2026.
Primary Survey
n=3,800 procurement and R&D decision-makers, Q4 2025, six countries
Methodology
Demand-side build-up, cross-validated against public data, 47 expert interviews

Agent-Oriented Enterprise Architecture Market Forecast Scenarios

agent-oriented-enterprise-architecture-market-size-forecast-scenario-1788419552429
The 2020 to 2025 period nominally grew at 16.2%, though the category barely existed for four of those years and the measured base is largely enterprise architecture and identity governance revenue reclassified against agent use cases. What happened is that 2024 and 2025 saw agents deployed across business functions faster than any governance function anticipated, mostly by teams with legitimate authority and no registration obligation.
The base case at 17.4% rests on three mechanisms. Enterprises are discovering agents holding standing production credentials that nobody can enumerate, which turns governance from a policy discussion into incident response. Regulatory frameworks addressing artificial intelligence require documented accountability for automated decisions, which needs an architecture record to point at. Third, agents calling other agents create topology complexity that spreadsheets stop describing within about a year of first deployment. Diagrams stop describing it.
The bull case at 18.6% assumes a publicly visible failure caused by an unmonitored agent action, which would move budget from discretionary to mandatory within a quarter across every regulated sector. The bear case at 16.0% is that platform vendors bundle adequate registry and identity capability into what enterprises already buy, leaving specialists with a narrow advisory business and no software revenue.

Governing Software That Was Never Registered

The honest description is that this market cleans up after an adoption wave nobody controlled. Business teams built agents because the tooling made it easy and the authority already sat with them, and by the time anybody asked for an inventory the median large enterprise ran around 340. About 58% appear nowhere central. Roughly 71% hold standing credentials, which is the part that alarms security functions rather than architects.
TOP FIVE CONCENTRATION22%Highly fragmented field forming across three distinct vendor origins
UNREGISTERED AGENT SHARE58%Deployed agents absent from any central inventory record
AGENTS PER ENTERPRISE340Median count running across a large organisation today
STANDING CREDENTIAL USE71%Agents holding permanent rather than short-lived access grants
PROGRAMME FAILURE RATE37%Initiatives abandoned before delivering any governed production capability
SERVICES SHARE OF SPEND64%Portion paid for advisory rather than for licensed software
Much of the vendor positioning is recycled. Capability modelling, service catalogues, dependency mapping and reference architecture are enterprise architecture practice with decades behind them, and adding an agent object to a metamodel is not a new discipline. What is genuinely new is treating a non-human actor as an identity with entitlements, a lifecycle and an audit trail, since directories and access governance assumed people who join, move and leave.
Commercially the category is still mostly consulting. Around 64% of spend goes to advisory rather than licensed software, which is normal for an immature practice and awkward for vendors valued on subscription. Roughly 37% of programmes are abandoned before delivering governed production capability, usually because the exercise produced a diagram rather than enforcement. Buyers have started asking what actually changes at runtime.
"Every organisation I speak to describes this as an architecture problem and then, two meetings in, describes an agent with a permanent production credential that nobody owns. The architecture diagram is not the deliverable. The revocation is."
Director, Enterprise Architecture and Autonomous Systems Practice · MMA Technology Practice · September 2026

Market Trends

Identity Vendors Redefine the Category From the Control Side

Enterprise architecture vendors approached agents as a modelling problem and identity vendors approached them as an authorisation problem, and the second framing is winning budget. The reason is practical: a model describes what should exist while an entitlement decides what an agent can actually do at three in the morning, and buyers alarmed by 71% standing credential use want the second. Non-human identity and entitlement control grows at 26.1%, faster than anything else here. Architecture tooling vendors are responding by integrating with identity platforms rather than competing against them, which concedes the more valuable position.
Market Impact: Finds 58% of agents unregistered
Registries Become the Contested Control Point

A registry of what tools and capabilities agents may call turns out to be the practical enforcement mechanism, because restricting the tool set constrains behaviour more reliably than instructing a model to behave. That has made capability registries the second fastest segment at 22.4% and the point where several vendor categories now collide: architecture platforms, application gateways, identity providers and the agent frameworks themselves all claim it. Whoever holds the registry holds the enforcement point and the audit record together, which is a considerably stronger position than modelling ever conferred.
Market Impact: Covers 3 major regulatory jurisdictions

Market Opportunities and Growth Drivers

Unenumerated Agents Turn Governance Into Incident Response

Security functions asked for an agent inventory and discovered that roughly 58% of what was running appeared in no central record, built by teams with entirely legitimate authority and no registration obligation. Around 71% held standing credentials rather than short-lived grants, meaning access persisted regardless of whether the agent was still needed or supervised. That converts an architecture initiative into a remediation project with an executive sponsor and an actual deadline. Discovery capability rather than modelling capability is what these buyers are purchasing first, and vendors have adjusted accordingly. Modelling capability comes considerably later.
Market Impact: Abandons 37% of programmes

Regulatory Frameworks Require Documented Automated Accountability

Artificial intelligence regulation across major jurisdictions requires organisations to document which automated systems make or influence consequential decisions, who is accountable and how outcomes are monitored. Producing that documentation requires an architecture record connecting agents to the decisions and data they touch, which most enterprises do not hold. Compliance functions are consequently funding work that technology teams could not previously justify. The obligation applies whether or not an enterprise considers its agents high risk, since establishing that classification itself requires the inventory. Compliance budgets move faster than architecture ones do, and they carry deadlines attached.
Market Impact: Bundling threatens 36% software share

Market Restraints and Challenges

Programmes Produce Diagrams Rather Than Enforcement Points

Roughly 37% of initiatives are abandoned before delivering governed production capability, and the pattern is consistent: the work produced a model, a taxonomy and a set of principles that changed nothing about what an agent could do at runtime. The root cause is that enterprise architecture practice is descriptive by tradition while the problem here is one of control. Commercially this damages references badly across a small market. Vendors are mitigating by leading with discovery and enforcement integration rather than modelling, and by tying commercial milestones to runtime outcomes. Buyers now ask what changes at runtime.
Market Impact: Fastest segment at 26.1% growth

Platform Bundling Threatens the Software Revenue Entirely

The major cloud and application platforms are adding agent registries, identity constructs and action logging to what enterprises already license, on the reasonable view that agents running on their infrastructure should be governed there. The root cause is that none of this capability is technically difficult once the platform holds the runtime. Commercially it caps what a specialist can charge and threatens the software component of a market already 64% services. Specialists are responding by covering multiple platforms, which is the one thing a platform vendor will not do. Coverage breadth is the only durable answer.
Market Impact: Registries grow at 22.4% annually
3 additional market trends, 4 additional growth drivers, and 2 additional restraints and challenges are covered in the full report. Contact sales@marketmindsadvisory.com to access the complete intelligence.

Segment CAGR and Growth Architecture

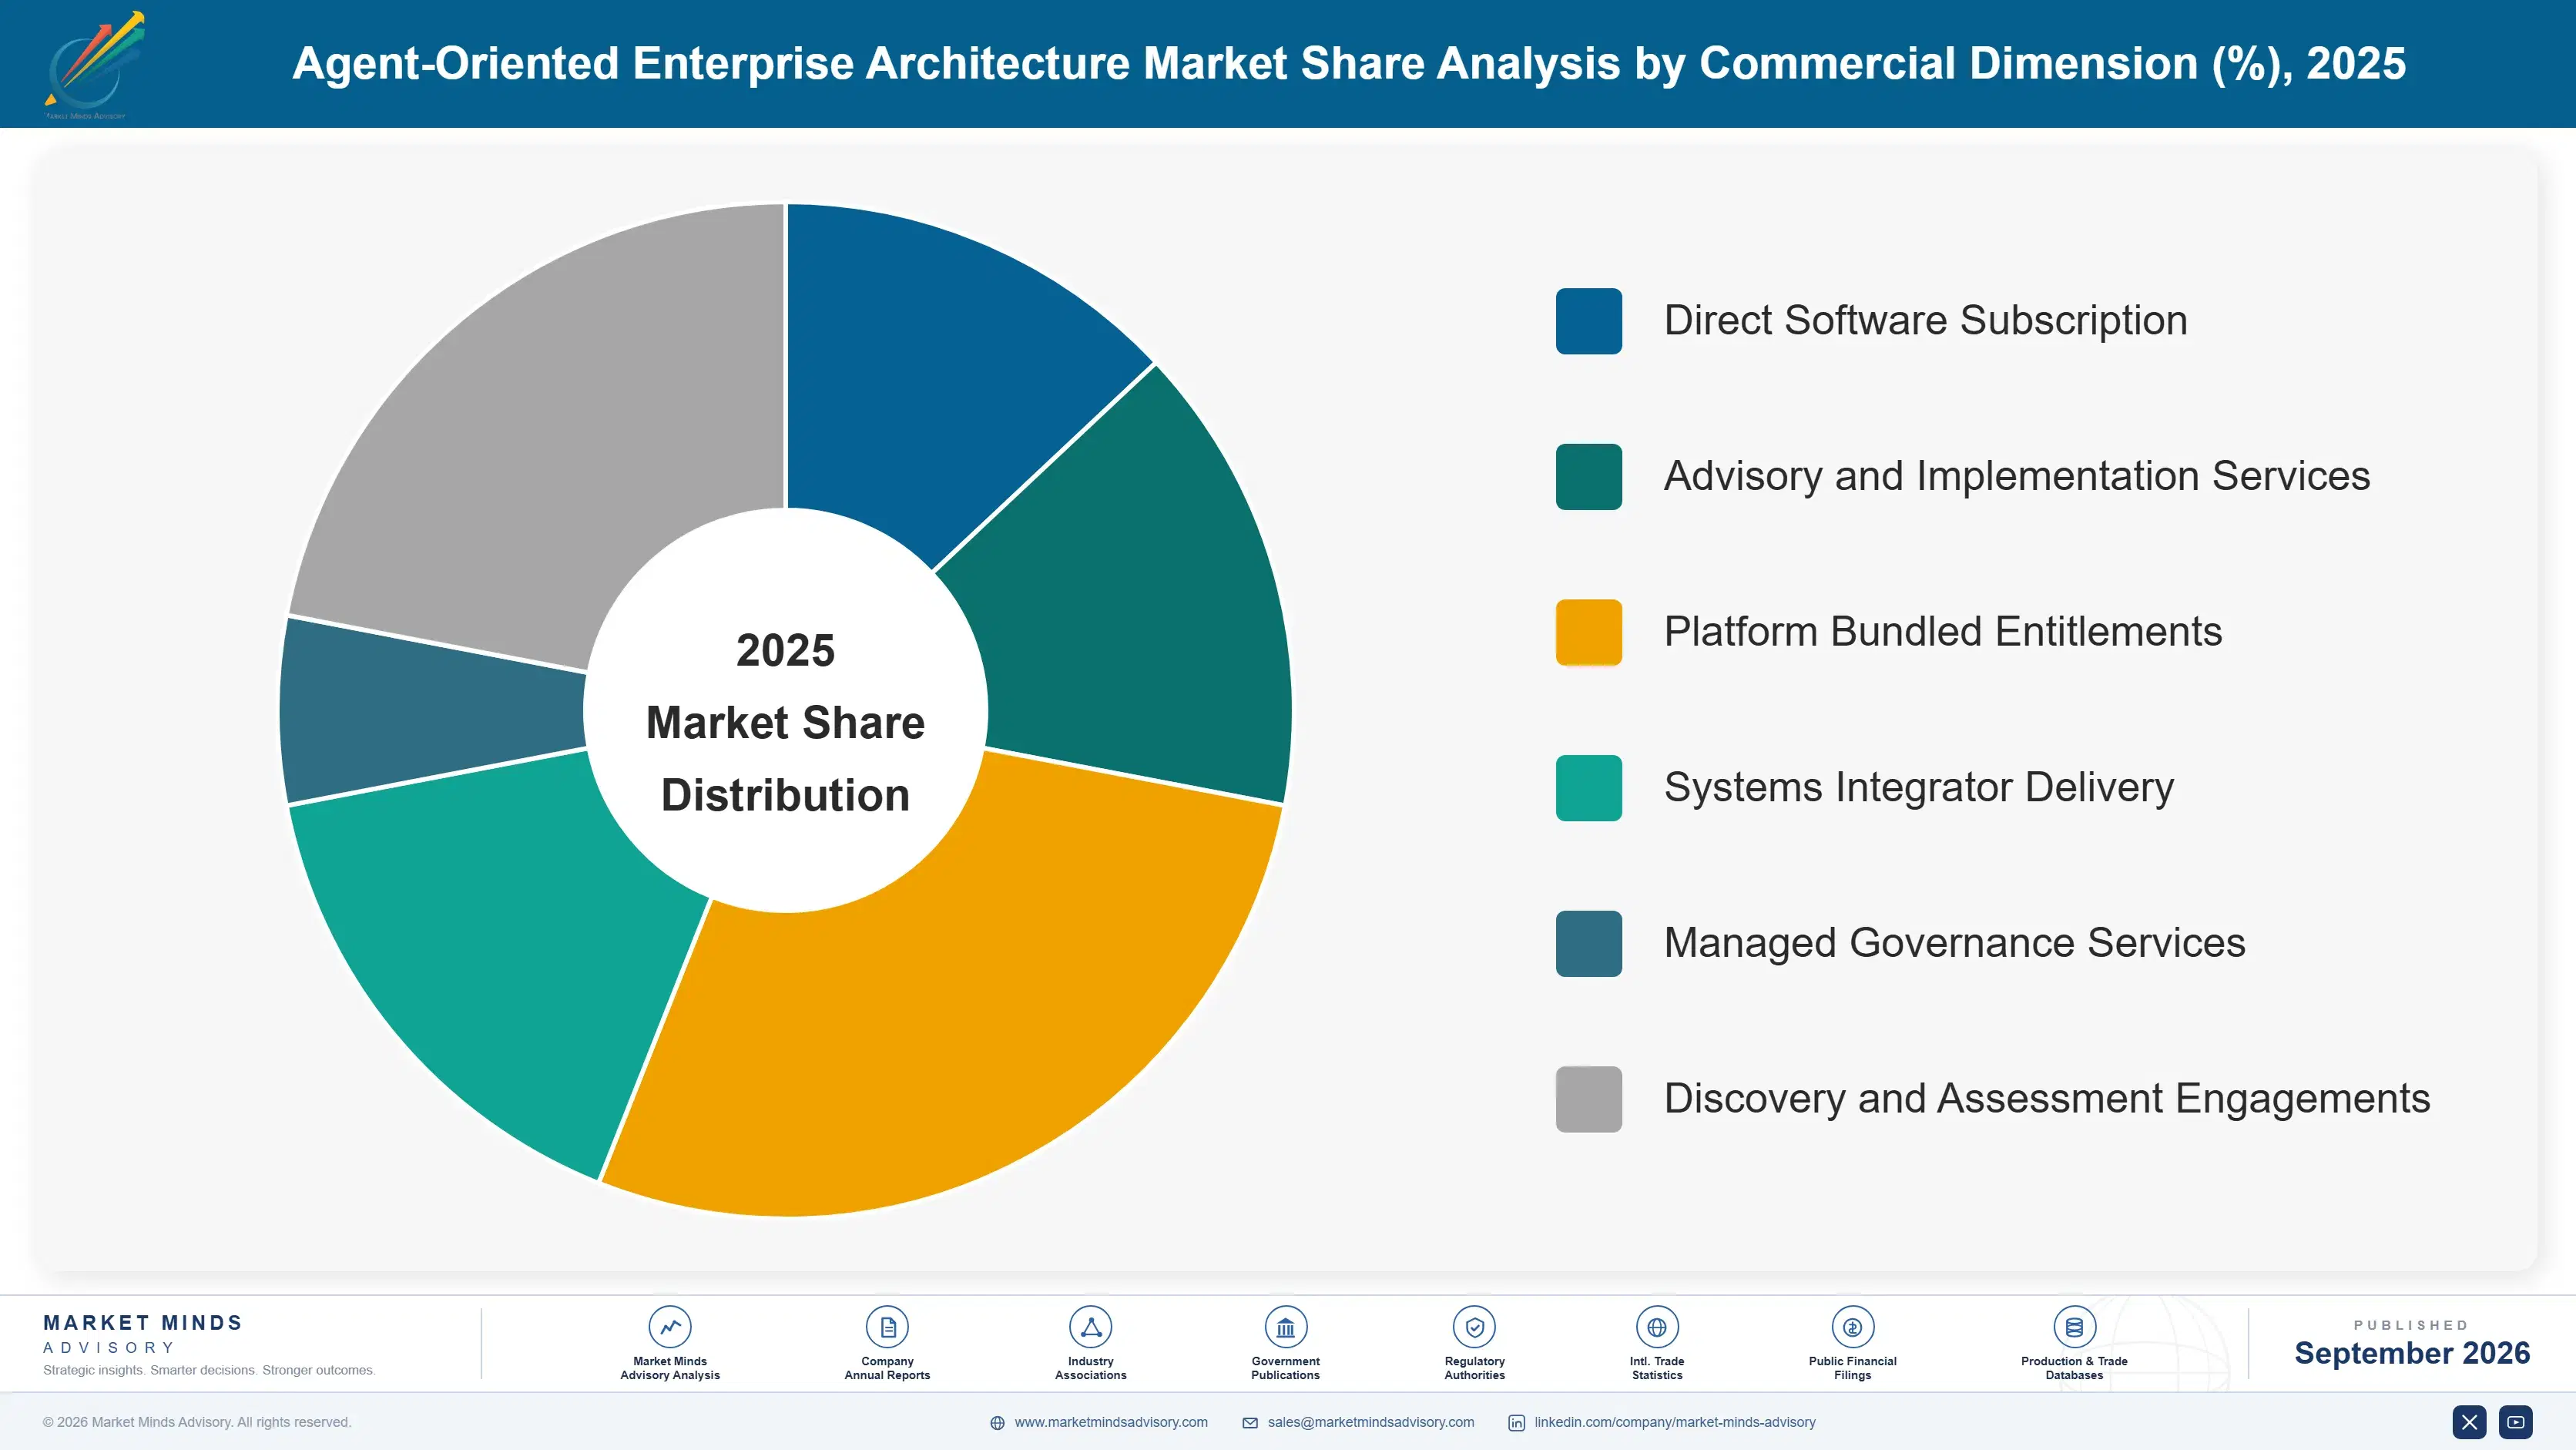
Segmentation follows the capability layer being sold, because each reaches a different budget and carries different exposure to platform bundling. Layers that enforce something at runtime are growing far faster than layers that describe something in a repository, and that division explains nearly all of the variance in this market. Enforcement beats description everywhere here.
agent-oriented-enterprise-architecture-market-market-share-analysis-1788419552958

Non-Human Identity and Entitlement Control

Identity and entitlement control for agents grows fastest at 26.1%, half again the market rate of 17.4%, and it is the layer where budget is least contested. The problem is concrete: directories and access governance were built around people who join, move and leave, while an agent is created in minutes, may act on behalf of several humans and frequently holds a standing credential nobody reviews. Around 71% of deployed agents fall into that category. Buyers are security and identity functions with existing budgets and a clear incident narrative, which makes the sale considerably shorter than an architecture engagement. Short-lived credentials, delegated authority chains and revocation are what they are actually purchasing.
CAGR 26.1%

Tool and Capability Registry Platforms

Capability registries record which tools, interfaces and data an agent is permitted to call, and they have become the practical enforcement mechanism because constraining the available tool set restricts behaviour more reliably than instructing a model. Growth at 22.4% reflects that shift from persuasion to constraint. The segment is unusually contested, since architecture platforms, application gateways, identity providers and agent frameworks all reasonably claim the registry, and no convention has settled. Whoever holds it holds the enforcement point and the audit record simultaneously. Buyers increasingly ask whether a registry is merely descriptive or actually sits in the call path, and the answer changes the price entirely. No convention has settled, which leaves current positions unusually contestable.
CAGR 22.4%
Full segment breakdown across 6 segments available in the complete report.

Regional Architecture and Country Demand Map

Demand follows where agents were actually deployed rather than where governance is most discussed. Regions that adopted early now hold the largest remediation problems, while later adopters are buying control capability alongside deployment rather than afterwards. Adoption sequence explains most of the distribution. Nothing else predicts it well.

North America

North America holds 43%, above the regional band, and the reason is sequence rather than sophistication: agents were deployed here first and in the largest numbers, so the remediation problem is correspondingly larger. Financial services and healthcare organisations are the most active buyers, driven by regulators asking questions about automated decisioning that firms cannot currently answer from any record they hold. Technology companies buy the deepest tooling and often build alongside it. Federal and state agencies have begun specifying agent inventory and accountability requirements in procurement, which is pulling governance capability into public sector programmes ahead of deployment. Regional growth at 16.6% sits near the market rate, since the base is large and remediation drives it.
Share: 43% | CAGR: 16.6% (2026 to 2036)

Western Europe

European demand is shaped by regulation rather than by incident. Artificial intelligence rules requiring documented accountability for consequential automated decisions create an obligation that applies before any failure occurs, which produces steadier and slower purchasing than the remediation pattern seen elsewhere. German and Nordic enterprises buy architecture-led approaches with heavier documentation content. United Kingdom financial services buy identity-led ones, following supervisory attention to operational resilience. Data protection obligations complicate agent access to personal data considerably, and much of the advisory work in the region concerns lawful basis rather than technical control. Regional growth at 15.8% is the slowest of the major markets, reflecting deliberate purchasing against an obligation rather than urgent purchasing after an incident.
Share: 23% | CAGR: 15.8% (2026 to 2036)
Regional intelligence for 5 additional markets available in the complete report: East Asia, South Asia and Pacific, Latin America, Middle East and Africa, Eastern Europe. Contact sales@marketmindsadvisory.com.
agent-oriented-enterprise-architecture-market-country-cagr-analysis-1788419553483

Where This Category Can Charge

A market that is 64% services and facing platform bundling on the software has to earn its position at the enforcement layer rather than the description layer. What holds value is sitting in the call path, holding the identity record for non-human actors, and covering platforms that platform vendors will never cover for each other.

Sit in the Call Path Not the Repository

A registry that describes permitted tools is documentation, and a registry that intercepts the call is a control. Buyers have learned the difference, and vendors whose registry sits in the call path sustain price points roughly 3 times those achievable on descriptive tooling, because the customer is buying enforcement rather than a record. The engineering commitment is real, since being in the path means owning availability and latency for production traffic. That commitment is precisely what makes the position defensible against modelling tools. Modelling tools cannot make that commitment credibly.
Market Impact: Sustains 3 times the descriptive tooling price point

Own the Non-Human Identity Record Outright

Directories were designed for people who join, move and leave, and agents fit none of that lifecycle, which is why roughly 71% end up with standing credentials nobody reviews. Vendors holding the authoritative record of what agents exist, who they act for and what they may do capture the entitlement decision and the audit trail together, and win adjacent modules at around 4 times the rate of vendors entering elsewhere. The buyer is a security function with an existing budget rather than an architecture team seeking one. Approved budget beats a business case every time.
Market Impact: Wins adjacent modules at roughly 4 times rate

Cover Every Platform a Customer Actually Runs

Platform vendors will govern agents running on their own infrastructure and will never govern agents running on a competitor's, which leaves a genuine gap in every enterprise operating more than one platform, and most operate at least 3. Specialists offering consolidated inventory, entitlement and audit across platforms sell something no bundled capability can match. The commercial discipline is refusing to be drawn into feature comparison against a free bundled tool on any single platform, since that comparison is lost before it begins and misses the entire point. Consolidation is the argument that actually holds.
Market Impact: Most enterprises now run at least 3 platforms

Tie Commercial Milestones to Runtime Outcomes

With 37% of programmes abandoned before delivering governed production capability, buyers have become sceptical of engagements that produce models and principles. Vendors tying payment milestones to measurable runtime results, such as credentials revoked or agents brought under registry control, convert evaluations at roughly twice the rate of those selling assessment phases. It requires confidence that the tooling enforces something and willingness to defer revenue. Firms unwilling to do it are asking buyers to fund the exact failure pattern that has already burned them once. Deferred revenue is the cost of credibility here.
Market Impact: Doubles conversion against the current 37% abandonment level

Who Controls the Margin Pool

Concentration is very low at roughly 22% across the top five on measured software and attributable services revenue, which is what an eighteen month old category looks like. Three vendor origins are converging and none holds an obvious advantage. The gap between leaders and challengers is mostly distribution, since platform and identity vendors reach the buyer through existing contracts while architecture specialists must create the conversation.
Competition runs on three dimensions. Runtime enforcement is first and increasingly decisive, because buyers now ask whether a control sits in the call path or merely records intent. Second is coverage breadth across the platforms an enterprise actually runs, the one thing bundled capability cannot offer. Third is discovery, since almost every engagement begins with finding agents nobody registered, and a vendor unable to produce that inventory fails immediately.

Two pressures are shaping the outcome. Platform bundling is absorbing basic registry and identity capability into what enterprises already license, compressing the software layer exactly as it did in cloud cost management. Meanwhile the large advisory firms hold the services majority and are building tooling of their own rather than partnering indefinitely. Rankings will move toward vendors holding the identity record and multi-platform enforcement.
agent-oriented-enterprise-architecture-market-company-positioning-matrix-1788419554006

Competitive Moat and Risk Dimensions

MICROSOFT

Moat: Identity platform and runtime reach

Microsoft holds the enterprise directory that most large organisations already treat as authoritative for identity, and extending it to non-human actors requires no new procurement cycle. Its agent runtime and application platform give it visibility into what agents actually do rather than what they were modelled to do. Existing licensing makes incremental capability a configuration decision for many customers.
MICROSOFT

Risk: Single platform coverage limit

The company governs agents running within its own platform well and has little commercial reason to govern agents running on competing infrastructure, which most large enterprises also operate. That leaves the consolidated cross-platform view to specialists. Enterprises deploying on other clouds or independent frameworks find that gap immediately, and specialists lead with it.
CYBERARK

Moat: Machine identity control depth

CyberArk built its position on privileged and machine identity long before agents existed, which gives it credibility on exactly the problem enterprises are discovering: non-human actors holding unreviewed standing credentials. Its controls sit in the authorisation path rather than in a repository, which is the distinction buyers have learned to test for. Security relationships shorten procurement against architecture-led competitors.
CYBERARK

Risk: Narrow architecture layer presence

The company's strength sits in credential and entitlement control rather than in capability modelling, topology design or the architecture record that regulatory documentation requires. Enterprises increasingly want those layers connected, which favours vendors able to span both. Building architecture capability means competing with established modelling platforms on their ground, and acquiring it would mean integrating a different product tradition entirely.

Players Tracked

Prominent Players

Microsoft
SAP
ServiceNow
CyberArk
Okta

Other Key Players

Ardoq
Bizzdesign
MEGA International
Software AG
Orbus Software
Avolution
Sparx Systems
SailPoint
Ping Identity
IBM
Salesforce
Google
Amazon Web Services
Boomi
Kong

Recent Developments

JULY 2025

Identity platforms extend directory constructs to autonomous agents

Major identity providers released constructs treating agents as first-class identities with delegated authority chains, short-lived credentials and revocation, developed internally rather than acquired. The releases target security functions responding to inventory exercises that found large numbers of unregistered agents holding standing access. Architecture repositories were left out of the picture.
Signal: The identity framing has taken budget from the architecture framing, and it is winning on concreteness rather than sophistication.
MARCH 2025

Enterprise architecture platforms add agent objects to existing metamodels

Established architecture tool vendors extended their metamodels to represent agents, tools and delegated authority alongside applications and capabilities. The extensions were organic product development rather than acquisitions, and they position the architecture repository as the accountability record regulation requires. Integration with identity platforms accompanied several of them.
Signal: Adding an object to a metamodel is straightforward, which is precisely why it will not defend a position for long.
NOVEMBER 2025

Cloud platforms bundle agent registry and action logging into existing subscriptions

Major cloud providers included agent inventory, capability registration and action audit logging within services enterprises already license, positioning governance as a property of the runtime. The capability covers agents on the provider's own infrastructure and does not extend to competing platforms. Pricing was left unchanged for existing subscribers.
Signal: Bundling caps specialist software pricing while leaving multi-platform consolidation as the only genuinely defensible commercial position.

What Delivering This Actually Costs

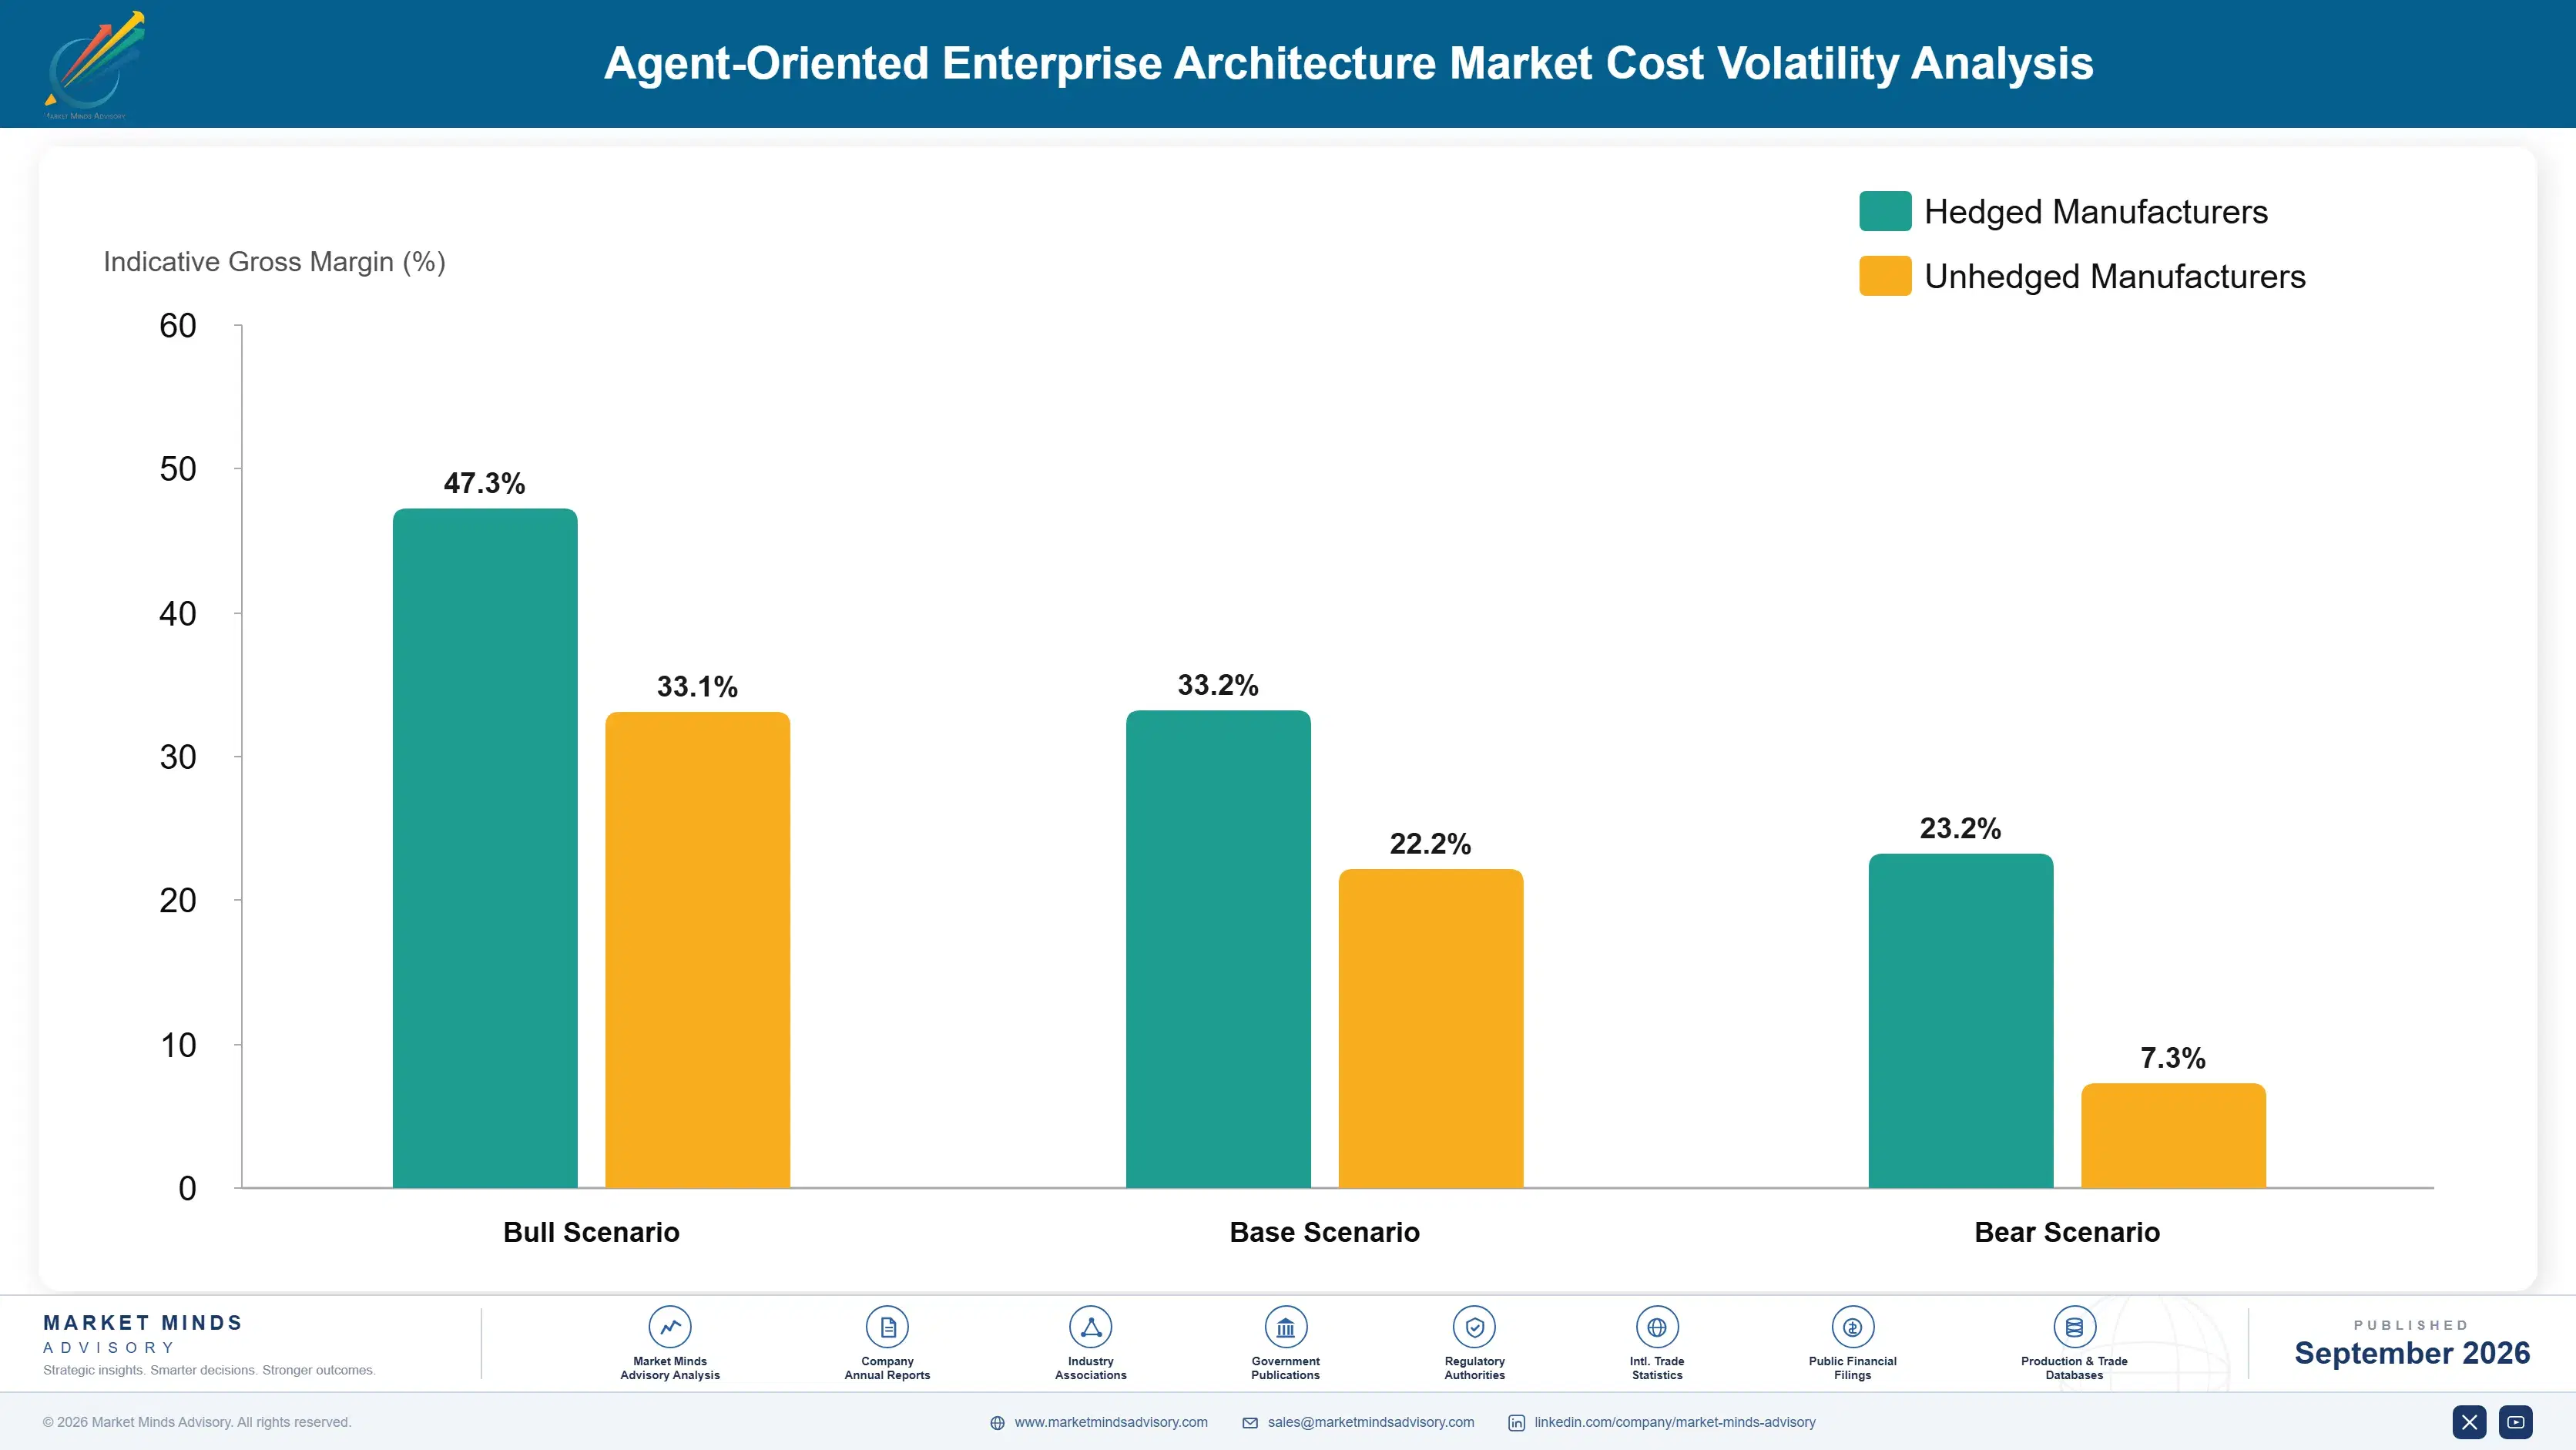
Delivery cost here looks like a consulting business wearing software clothing. Advisory and implementation labour runs between 44% and 58% of cost, the range reflecting how much discovery an estate requires before governance begins. Software engineering takes roughly 21%, inference and compute for discovery and classification around 9%, and security assurance and certification the balance. Very little of this scales the way subscription software should.
Labour cost has been the sharpest pressure. Demand for engineers who understand both identity architecture and agent runtimes outstripped supply through 2024 and 2025, and compensation for that combination rose well ahead of general technology rates. Accenture reported elevated investment in advanced technology capability across its 2025 annual reporting, and specialist vendors competing for the same people paid premiums they could not always recover in fixed-price engagements.

Exposure varies by commercial model rather than by scale. Vendors selling fixed-price governance programmes carry labour cost risk directly and have been squeezed hardest. Those selling software with partner-delivered implementation avoid it but capture less of the engagement. Advisory firms pass labour cost through on time and materials and are largely insulated. Small specialists compete for the same scarce engineers without any bench to absorb a scope overrun.
agent-oriented-enterprise-architecture-market-cost-volatility-analysis-1788419554200

Automate discovery before selling implementation

Finding unregistered agents consumes the largest share of early labour and is repetitive across customers. Vendors that productised discovery cut that labour by roughly 55% and reached a credible first result faster. It also converts an expensive services activity into a software capability that can be priced and renewed, which matters in a market already too heavily weighted to advisory.

Deliver implementation through partners rather than internally

Building a delivery organisation to compete with advisory firms for scarce engineers is slow and puts a software vendor into different economics. Partner-led implementation removes the labour exposure and extends reach considerably faster. The trade-off is less control over deployment quality, which matters when 37% of programmes fail and every failure damages references across a small market.

Price fixed only where scope is genuinely knowable

Fixed-price programmes on estates nobody has inventoried transfer unquantifiable scope risk to the vendor, which has cost several specialists money on reference accounts. Pricing discovery separately and fixing only the subsequent implementation aligns risk with knowledge. Buyers accept the structure once the discovery result shows them how little they knew about their own estate.

Portfolio Architecture for Margin Defence

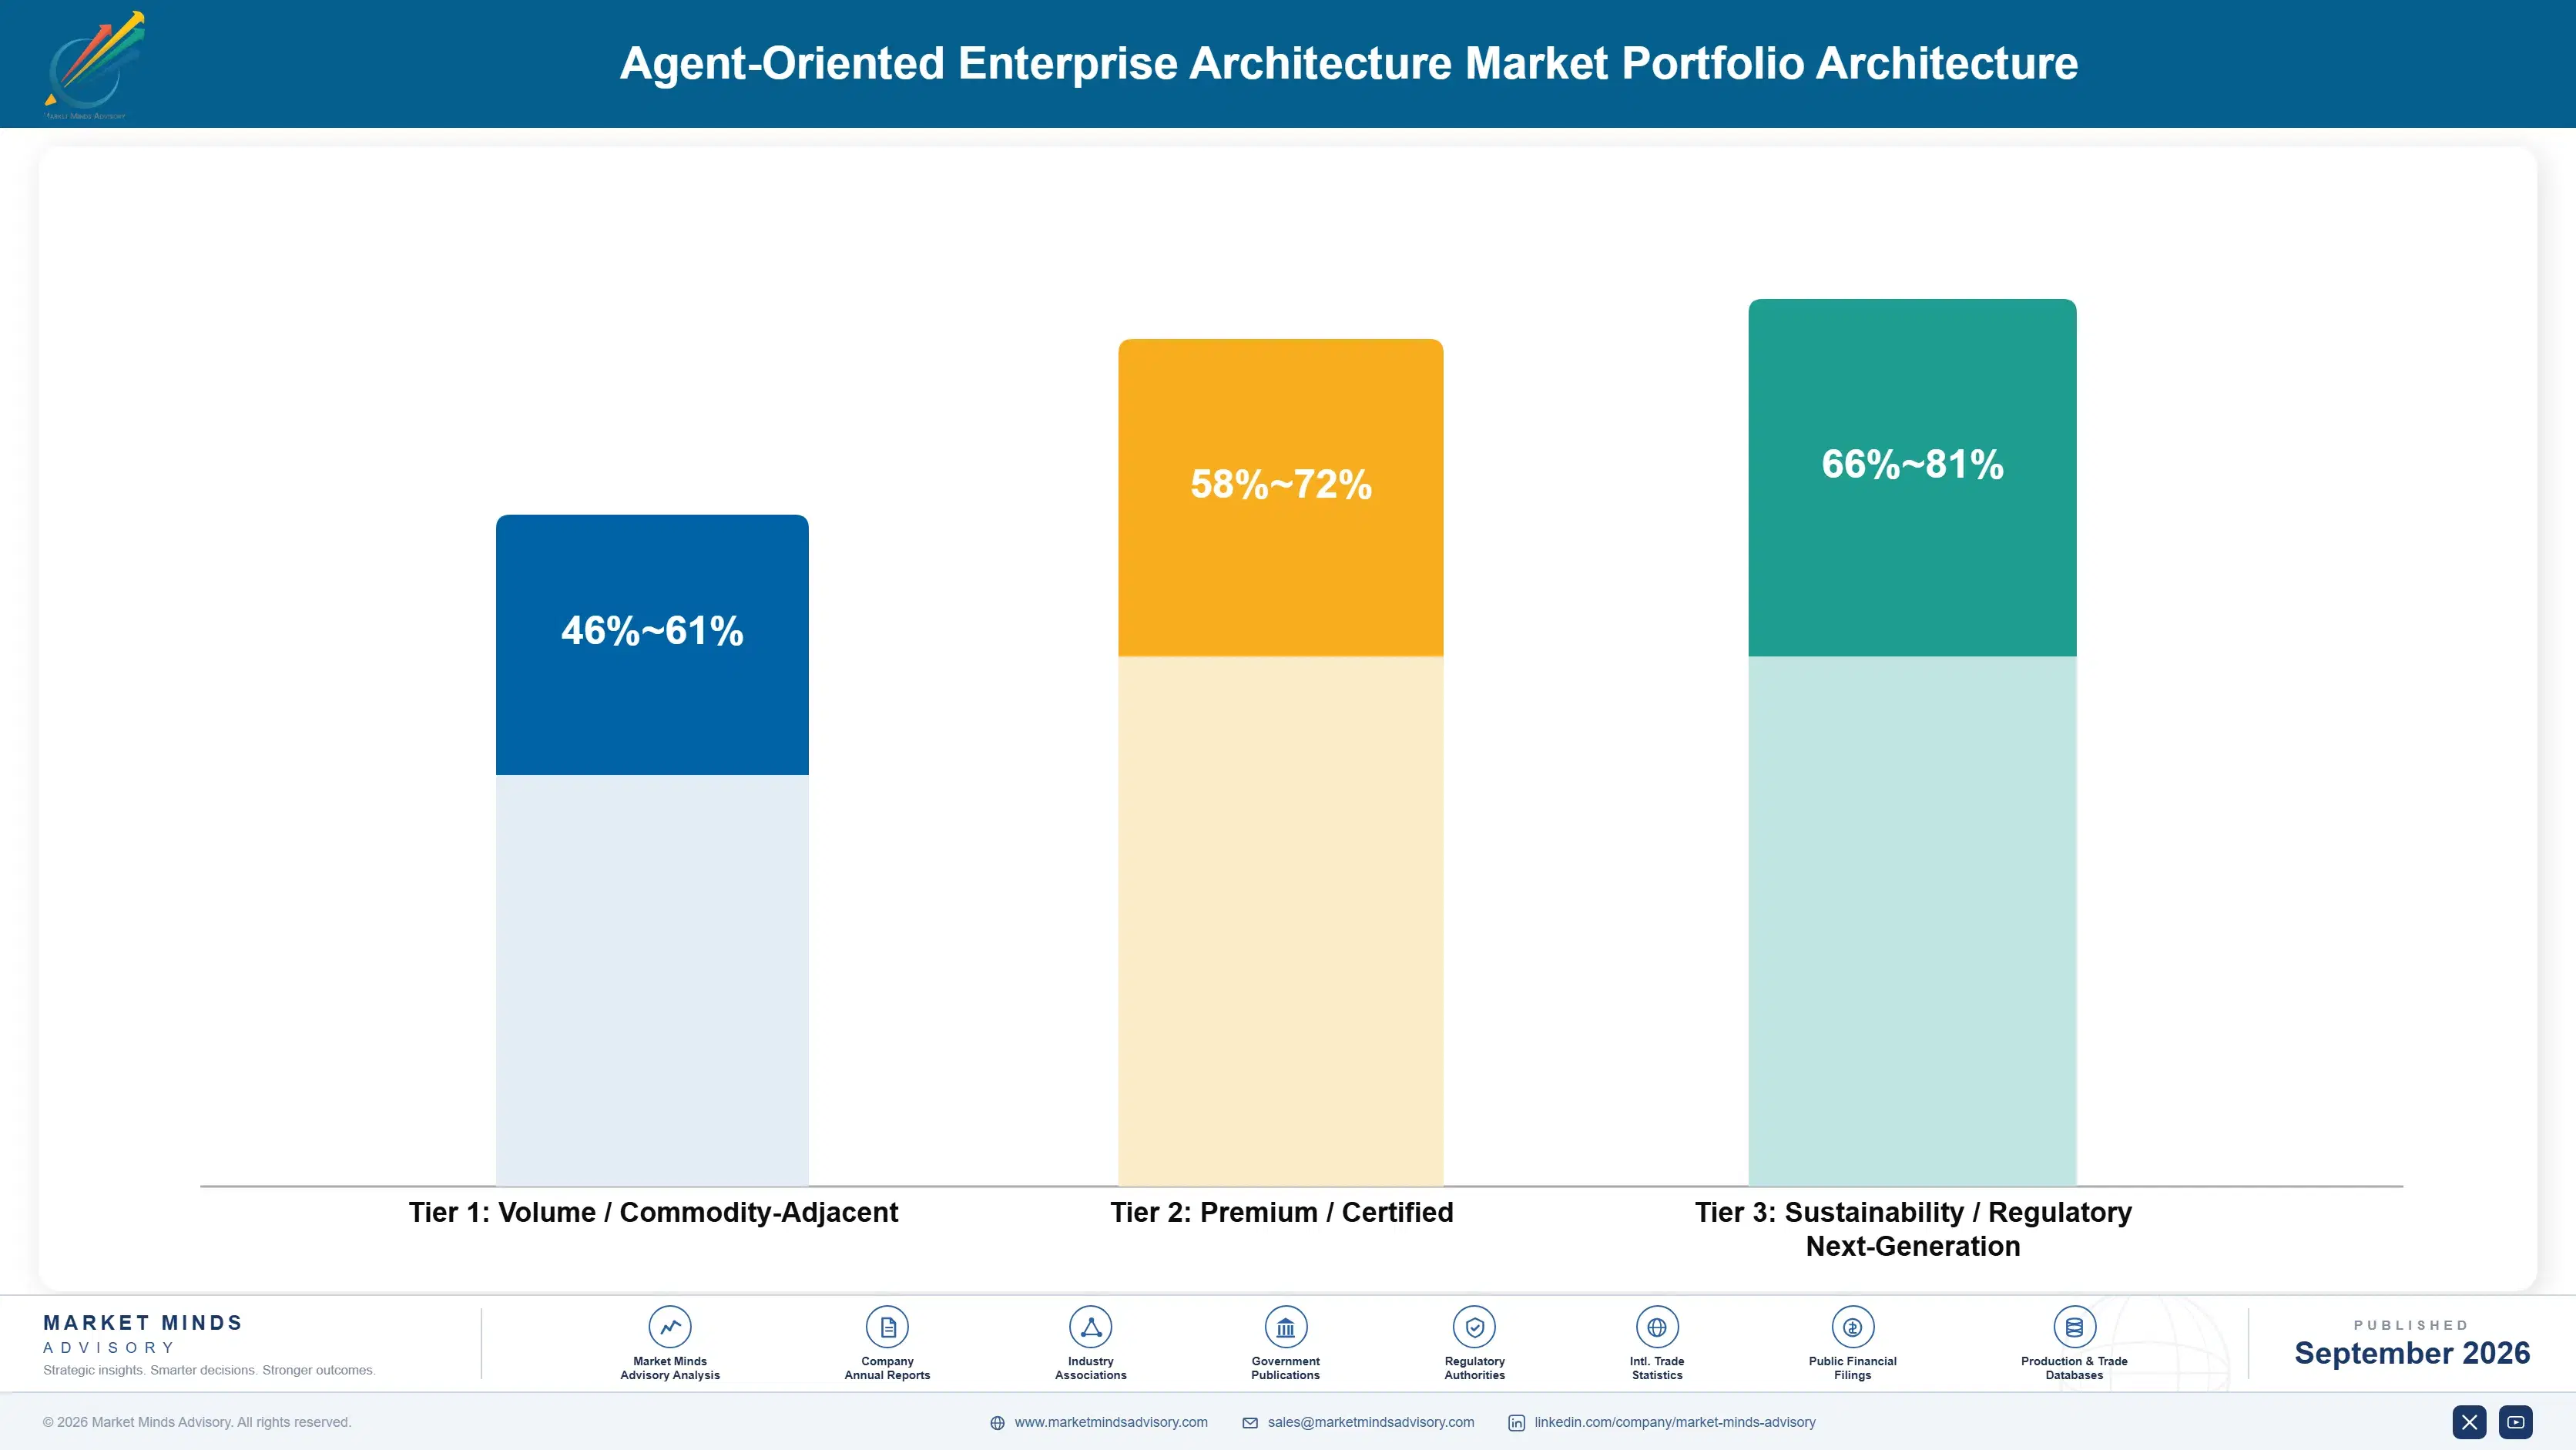
Margin architecture separates on whether revenue is enforcement or explanation. Advisory work earns consulting margins and consumes scarce labour, which caps how fast a vendor can grow it regardless of demand. Software that sits in the runtime call path earns considerably more and scales, but requires the vendor to own availability for production traffic. Descriptive tooling sits between the two, earning software margins on capability platform vendors give away.
The volume tension is between the services that customers want now and the software that vendors need to sell. Discovery and remediation engagements are what buyers are ready to fund, and they build the relationship and the estate knowledge. Subscription control tooling is what supports a valuation, and it follows only once enforcement is actually running. Vendors taking services revenue without converting it are running consulting businesses with software valuations.

High-value revenue concentrates in non-human identity control and in multi-platform consolidated inventory. Both share the property that the alternative is either a platform-limited free tool or nothing at all, which removes conventional price comparison. Descriptive architecture tooling occupies the volume position among architecture buyers and faces the fastest commoditisation, since adding an agent object to a metamodel is straightforward product work.

Volume / Commodity-Adjacent

Descriptive architecture tooling, agent metamodels and capability catalogues sold to architecture functions. The wide range separates vendors with existing repository installed bases from new entrants. Platform bundling of basic registry capability sets a ceiling here that is unlikely to lift again.
Gross Margin: 46-61%

Premium / Certified

Multi-platform inventory, topology mapping and action observability sold to enterprises operating several agent runtimes. Margin holds because no platform vendor has commercial reason to cover a competitor's infrastructure. Coverage breadth rather than depth is what buyers evaluate here.
Gross Margin: 58-72%

Sustainability / Regulatory / Next-Generation

Non-human identity control, runtime entitlement enforcement and regulatory accountability records. The widest range in the portfolio, reflecting how much sits in the call path against how much is documentation. Highest margin and the least contested by bundled alternatives at present.
Gross Margin: 66-81%
agent-oriented-enterprise-architecture-market-portfolio-architecture-1788419554700

High-value Sub-segments and Strategic Watch-out

Non-Human Identity Control

High value and high growth together, sold to security functions with existing budgets and a concrete incident narrative behind the request. The margin range reflects how much enforcement sits in the authorisation path. Standing credential exposure across seven in ten agents gives an argument no other layer matches.
Gross Margin: 70-81%

Multi-Platform Consolidated Inventory

High value with strong growth, because platform vendors govern their own infrastructure and will not govern a competitor's. The range reflects coverage breadth across runtimes and frameworks. It is the one position bundled capability cannot reach, which makes it the most defensible software revenue available here.
Gross Margin: 60-72%

Architecture Advisory Engagements

The volume core of current spending at roughly 64% of the market, constrained by scarce engineers who understand both identity and agent runtimes. It builds relationships and estate knowledge that software revenue depends on. Vendors cannot avoid it and cannot scale it, which is the central tension in the category.
Gross Margin: 31-44%

Platform Bundled Governance

The strategic watch-out, carried at zero because it displaces specialist revenue rather than generating any. Cloud and application platforms are absorbing registry, identity and logging into existing subscriptions. Specialists assuming bundling will stop at basic inventory are repeating an assumption that cloud cost management vendors already tested and lost.
Gross Margin: 0-0%

How This Spending Recurs

Recurrence depends entirely on whether the vendor ends up in the runtime. Software enforcing entitlements or intercepting tool calls renews automatically, since removing it removes a control the security function already reported as implemented. Software that holds a model of the estate renews only while somebody maintains the model, and maintenance attention fades once the initial remediation is finished. That distinction explains most of the churn variance so far.
Adoption depth varies sharply by function and sector. Security organisations adopt deeply and quickly, since the problem maps onto controls they already operate. Financial services use the accountability record continuously because supervisors ask for it. Healthcare adopts for data access control specifically. Manufacturing and retail deploy widely and govern shallowly, treating inventory as sufficient. Technology companies build their own and buy only the identity layer.

The buyer moved from architecture to security within about a year. Early engagements were commissioned by architecture functions framing this as a modelling extension, and produced the diagrams behind much of the 37% abandonment rate. Current purchases are made by security and risk leadership responding to an inventory result. Vendors pitching metamodel extensions address a function that has lost this budget.
agent-oriented-enterprise-architecture-market-end-use-penetration-index-1788419555188

Where This Market Rewards Focus

These are among the four positions where our research anticipates prominent divergence between winners and laggards over the coming forecast period. Each is grounded in the demand model, the regulatory perimeter, and the announced capacity pipeline.
01 / RUNTIME ENFORCEMENT POSITION

Sit in the call path or accept documentation pricing

Buyers have learned to ask whether a control intercepts an agent action or merely records that it was permitted, and the answer to that separates two entirely different kinds of business. Vendors whose registry or entitlement check sits in the call path sustain price points roughly 3 times those achievable on descriptive tooling. The commitment is genuine engineering, since being in the path means owning availability and latency for production traffic, and that burden is exactly what makes the resulting position defensible.
02 / MACHINE IDENTITY OWNERSHIP

Hold the authoritative record for non-human actors

Directories were built for people who join, move and leave, which is why roughly 71% of deployed agents hold standing credentials that nobody reviews or revokes. Vendors owning the authoritative record of what agents exist, who they act for and what they may do win adjacent modules at around 4 times the rate of those entering from any other layer. The buyer is a security function with a budget already approved rather than an architecture team still trying to justify one.
03 / CROSS-PLATFORM COVERAGE POSITION

Sell the view no platform vendor will ever offer

Cloud and application platforms will govern agents on their own infrastructure and have no commercial reason to govern agents on a competitor's, while most large enterprises run at least 3 platforms simultaneously. Consolidated inventory, entitlement and audit across all of them is the one position that bundled capability simply cannot reach at all. The discipline required is refusing feature comparison against a free bundled tool on any single platform, since that particular argument is comprehensively lost before it even starts.
04 / OUTCOME LINKED COMMERCIALS

Price against revocations delivered, not assessments completed

With roughly 37% of these programmes abandoned before anything at all reaches production, buyers have become properly sceptical of any engagement that delivers models, taxonomies and a set of principles. Tying payment milestones to measurable runtime results, such as credentials actually revoked or agents brought under registry control, converts evaluations at roughly twice the rate of assessment-led selling does. Refusing to structure deals that way asks the customer to fund precisely the failure pattern that has already cost them money once before.

Engagement Snapshot From the Field

A live engagement with an industry participant carrying material or product regulatory and market exposure ahead of a defining policy shift, showing how our research translates into a defensible multi-year portfolio strategy.
MARKET MINDS ADVISORY · CLIENT ENGAGEMENT SUMMARY
Agent-Oriented Enterprise Architecture Producer Strategic Portfolio Review and Transition Roadmap 2026·Investment Scenario on Agent-Oriented Enterprise Architecture Exposure Evaluation 2025-26
CLIENT PROFILE
A global insurance group with operations in 22 countries and roughly 41,000 employees (client-reported, unverified by MMA), which had encouraged business-led adoption of agent tooling across underwriting, claims and customer operations for eighteen months. Central technology had approved the platforms but held no register of what had been built on them or which systems those agents were reaching.
STRATEGIC CHALLENGE
An internal audit finding required the group to produce an inventory of automated decisioning within ninety days (client-reported, unverified by MMA). Nobody could estimate how many agents existed, business units resisted anything that looked like a moratorium on tooling they now depended on, and the enterprise architecture function proposed a modelling exercise that would have taken longer than the deadline allowed.
MMA APPROACH
MMA scoped discovery before governance, treating the inventory as an engineering problem rather than an architecture one. We instrumented platform audit logs and identity systems across four runtimes to enumerate what was actually executing, then interviewed 18 business owners about what those agents were meant to do. Vendor evaluation weighted discovery capability and enforcement integration far ahead of metamodel richness or reporting presentation.
KEY FINDINGS
  1. Discovery found 610 agents against a business estimate of roughly 150, with the difference concentrated in claims operations where tooling had spread informally between teams.
  2. Around 74% held standing credentials, and 31 agents retained production database access that had been granted for prototypes abandoned several months earlier and never reviewed.
  3. Only 44 agents touched decisions the audit finding actually concerned, meaning the compliance obligation was far narrower than the governance proposal assumed.
  4. No candidate architecture platform could enumerate agents without manual registration, which would have reproduced exactly the registration gap that created the problem originally.
CLIENT PROFILE
A global insurance group with operations in 22 countries and roughly 41,000 employees (client-reported, unverified by MMA), which had encouraged business-led adoption of agent tooling across underwriting, claims and customer operations for eighteen months. Central technology had approved the platforms but held no register of what had been built on them or which systems those agents were reaching.
STRATEGIC CHALLENGE
An internal audit finding required the group to produce an inventory of automated decisioning within ninety days (client-reported, unverified by MMA). Nobody could estimate how many agents existed, business units resisted anything that looked like a moratorium on tooling they now depended on, and the enterprise architecture function proposed a modelling exercise that would have taken longer than the deadline allowed.
MMA APPROACH
MMA scoped discovery before governance, treating the inventory as an engineering problem rather than an architecture one. We instrumented platform audit logs and identity systems across four runtimes to enumerate what was actually executing, then interviewed 18 business owners about what those agents were meant to do. Vendor evaluation weighted discovery capability and enforcement integration far ahead of metamodel richness or reporting presentation.
KEY FINDINGS
  1. Discovery found 610 agents against a business estimate of roughly 150, with the difference concentrated in claims operations where tooling had spread informally between teams.
  2. Around 74% held standing credentials, and 31 agents retained production database access that had been granted for prototypes abandoned several months earlier and never reviewed.
  3. Only 44 agents touched decisions the audit finding actually concerned, meaning the compliance obligation was far narrower than the governance proposal assumed.
  4. No candidate architecture platform could enumerate agents without manual registration, which would have reproduced exactly the registration gap that created the problem originally.
RECOMMENDED STRATEGY
Phase 1: Deliver the inventory through automated discovery against platform logs and identity systems, meeting the audit deadline without any business unit registration exercise. Phase 2: Apply entitlement control and short-lived credentials to the 44 decision-relevant agents first, rather than attempting uniform governance across the whole estate. Phase 3: Defer architecture modelling until enforcement is running, and then scope it only to the agents that regulatory accountability documentation genuinely requires.
OUTCOME
The group met the ninety day audit deadline and revoked 187 unnecessary credentials within the first month. Programme cost reached roughly USD 2.2 million against an initial architecture-led proposal near USD 6 million (client-reported, unverified by MMA). Discovery now runs continuously rather than as a one-time exercise.

Frequently Asked Questions

Foundational context covering the market sizes, CAGR, scope, country, region and competition that inform every finding below. This section is provided to cover basics and most often pre-purchase conversations, answered from the MMA Primary Research Dataset.

What is the current size of the Agent-Oriented Enterprise Architecture Market?

The market was worth USD 0.7 billion in 2025 and reaches USD 0.82 billion in 2026. Roughly 64% of that spending is advisory services rather than licensed software.

How large will the Agent-Oriented Enterprise Architecture Market be by 2036?

MMA forecasts USD 4.08 billion by 2036, an expansion of 4.98 times over the forecast period. That represents USD 3.26 billion of incremental annual revenue against 2026.

What is the CAGR for the Agent-Oriented Enterprise Architecture Market 2026 to 2036?

The base case is 17.4% compound annual growth, with a bull case at 18.6% and a bear case at 16.0%. How far platform vendors bundle governance capability separates the scenarios.

Which segment is growing fastest?

Non-human identity and entitlement control grows at 26.1%, half again the market rate of 17.4%. Roughly 71% of deployed agents hold standing credentials that nobody reviews or revokes.

Who are the major companies in the Agent-Oriented Enterprise Architecture Market?

Microsoft, SAP, ServiceNow, CyberArk and Okta lead on measured software and attributable services revenue. Together they hold roughly 22%, which reflects how recently this category formed.

Which country is growing fastest?

India grows fastest at 23.2%, because capability centres there operate agent estates on behalf of Western enterprises while the governance obligation sits with the parent organisation.

Report Segmentation Architecture

The full report scope spans multiple orthogonal segmentation dimensions, with cross-tabulated demand data provided for each dimension pair. Coverage extends further to regional breakdowns, trend trajectories, and the competitive detail needed to support segment-level decision-making.

By Primary Market Dimension

  • Agent Capability and Metamodel Tooling
  • Tool and Capability Registry Platforms
  • Non-Human Identity and Entitlement Control
  • Orchestration Topology Design and Simulation
  • Evaluation, Guardrail and Assurance Frameworks
  • Agent Observability and Action Auditing

By End-Use Industry

  • Banking and Capital Markets
  • Insurance and Wealth Management
  • Healthcare and Life Sciences
  • Retail and Consumer Goods
  • Manufacturing and Industrial
  • Government and Public Sector

By Commercial Dimension

  • Direct Software Subscription
  • Advisory and Implementation Services
  • Platform Bundled Entitlements
  • Systems Integrator Delivery
  • Managed Governance Services
  • Discovery and Assessment Engagements

By Region

  • North America
  • Western Europe
  • East Asia
  • South Asia and Pacific
  • Latin America
  • Middle East and Africa
  • Eastern Europe

Scope, Methodology, and Coverage

Every figure in this report is reproducible from documented input assumptions. The scope below maps the historical period, the forecast horizon, the segmentation dimensions, and the countries covered, alongside the underlying primary and qualitative methodology.
Historical Period
2020 to 2025
Forecast Period
2026 to 2036
Base Year
2025 (USD billions; MMA Primary Research Dataset, September 2026)
Market Definition
This market covers software and directly attributable advisory services that model, register, control and audit autonomous software agents as architectural elements of an enterprise, spanning agent capability metamodels, tool and capability registry platforms, non-human identity and entitlement control, orchestration topology design and simulation, evaluation and guardrail frameworks, and agent observability and action auditing. Revenue is measured as subscription, licence and attributable advisory and implementation services at vendor level. Agent development frameworks, large language model inference and hosting, general enterprise architecture tooling without agent constructs, robotic process automation, and workload orchestration infrastructure are excluded.
Quantitative Units
USD billions, software subscription and attributable services revenue
Segmentation Dimensions
Capability layer, end-use industry, commercial model, region
Regions Covered
North America, Western Europe, East Asia, South Asia and Pacific, Latin America, Middle East and Africa, Eastern Europe
Countries Covered
United States, Canada, United Kingdom, Germany, France, Netherlands, Switzerland, Sweden, Spain, Italy, Poland, Czechia, Japan, South Korea, China, Taiwan, Hong Kong, Singapore, India, Australia, Brazil, Mexico, Chile, United Arab Emirates, Saudi Arabia, South Africa
Key Companies Profiled
Microsoft, SAP, ServiceNow, CyberArk, Okta, Ardoq, Bizzdesign, MEGA International, Software AG, Orbus Software, Avolution, Sparx Systems, SailPoint, Ping Identity, IBM, Salesforce, Google, Amazon Web Services, Boomi, Kong
Quantitative Methodology
Primary survey, n=3,800 respondents, Q4 2025, six countries; demand-side model with trade association cross-validation
Qualitative Methodology
47 expert interviews, Q4 2025; applied to validate demand model assumptions, identify emerging dynamics, and assess competitive positioning
Report Format
PDF and XLSX data workbook (Word format preview document)
Publisher
Market Minds Advisory
Report Code
MMA-2026-TEC-811
Published
September 2026
Contact
sales@marketmindsadvisory.com | www.marketmindsadvisory.com

Purchase the full Agent-Oriented Enterprise Architecture Market Report (2026 to 2036).

The full MMA report examines why enterprises are buying agent governance as remediation rather than as architecture, and what that means for how the category will consolidate. It sizes the market to 2036 across six capability layers, seven regions and 26 countries, with segment growth rates and regional demand mechanisms set out in full. Competitive analysis covers 20 participants assessed on measured software and attributable services revenue, including moat and risk assessment for the two leaders. The report quantifies delivery cost structure, discovery economics and margin architecture across three portfolio tiers. It closes with four strategic verdicts and an anonymised insurance group discovery engagement.
Six capability layers sized to 2036
Seven regions with demand mechanism analysis
Twenty vendors on consistent revenue basis
Discovery and delivery cost structure benchmarks
Margin architecture across three portfolio tiers
Anonymised insurance agent discovery client engagement

Built For The People Who Decide

From boardroom strategy to bench-side execution, this report is read cover-to-cover by leaders shaping the next decade of their industry, turning demand scenarios, market dynamics and valuation benchmarks into decisions.
CXOs/ Presidents/ VPs/ Managers
M&A and Corporate Development
Strategy Teams and R&D Heads
Procurement and Product Directors
Regulatory and Compliance Leaders
Investor Relations and Equity Analysts