Market Minds Advisory
Africa LED & OLED Displays and Lighting Products Market

Africa LED & OLED Displays and Lighting Products Market: Africa LED & OLED Displays and Lighting Products Market. Off-Grid Solar Lighting Reshapes Electrification

Expanding off-grid solar-lighting adoption and rising pay-as-you-go financing sophistication are pushing lighting manufacturers to defend distribution economics against tightening import-tariff pressure and mounting rural-electrification demand across the continent today. This trend continues expanding steadily.

Lead Analyst

Published

September 2026

Make Smarter Decisions with Customized Research Insights

Request a free sample report and evaluate market opportunities, growth trends, and competitive dynamics relevant to your business needs.

2025 MARKET VALUE$2.1BMarket Size 2025
2036 FORECAST VALUE$7.0BBase Case , 2026 to 2036
CAGR 2026 TO 203611.6 %Bull 12.8% / Bear 10.4%
INCREMENTAL OPPORTUNITY$4.7BNet 10- year value creation
EXPANSION MULTIPLE3.00x2036 value over 2026 base
Strategic Levers
M&A Pipeline
Regional Outlook
Country Rankings
Competitive Intelligence
Segmental Deep-dive
Call-Us : 91 93563 13602

Executive Snapshot and Market Trajectory.

Expanding off-grid solar-lighting adoption is forcing lighting manufacturers to defend distribution-network economics through validated pay-as-you-go financing reliability. Rural-electrification agencies now weigh unit-durability performance heavily during every major procurement-renewal decision running today, and durability track record increasingly decides which manufacturers retain long-term distributor contracts across mature installed bases.
Solar-powered and off-grid LED lighting systems are pulling category growth fastest as households replace kerosene lamps with pay-as-you-go alternatives, closely followed by smart and connected LED lighting systems on rising urban-infrastructure demand across commercial and municipal programs across the continent, a pattern likely to persist through the decade ahead. Sub-Saharan markets lead on the scale of unmet rural-electrification demand, while Kenya expands fastest as dense mobile-money-enabled distribution networks accelerate adoption sharply.
Competitive intensity remains fragmented among a mix of global lighting manufacturers and dedicated off-grid solar specialists that control distribution-network and financing-platform capability together, leaving smaller regional assemblers to compete mainly on price and niche last-mile reach across fragmented rural accounts. Rising import-tariff and currency-volatility costs are squeezing distributor margins, while agencies force manufacturers to defend contracts through validated, auditable durability testing across every major renewal cycle overall.
Market Definition
This report covers LED and OLED lighting fixtures, display panels, and related products sold and deployed across African markets, including LED general lighting fixtures and luminaires, OLED display panels and modules, LED display screens and digital signage, solar-powered and off-grid LED lighting systems, smart and connected LED lighting systems, and LED automotive and industrial lighting components. It excludes traditional incandescent and fluorescent lighting products, general consumer electronics unrelated to display or lighting function, and grid-infrastructure construction unrelated to fixture supply.
Base Year Value
$2.1B in 2025 (MMA Primary Research Dataset, September 2026)
Forecast Period
2026 to 2036, eleven discrete annual values
CAGR
11.6% base case. Bull 12.8%. Bear 10.4%.
Fastest Growth Segment
Solar-Powered and Off-Grid LED Lighting Systems: 17.6% CAGR
Fastest Growth Country
Kenya: 16.8% CAGR
Fastest Growth Region
South Asia and Pacific: 13.6% CAGR
Largest Region
Middle East and Africa: 68% of 2025 global value
Market Leaders
Signify N.V., OSRAM GmbH, Samsung Electronics Co., Ltd., d.light Design Inc., Greenlight Planet Inc. Source: MMA Analysis based on company annual reports.
Primary Survey
n=3,800 procurement and R&D decision-makers, Q4 2025, six countries
Methodology
Demand-side build-up, cross-validated against public data, 47 expert interviews

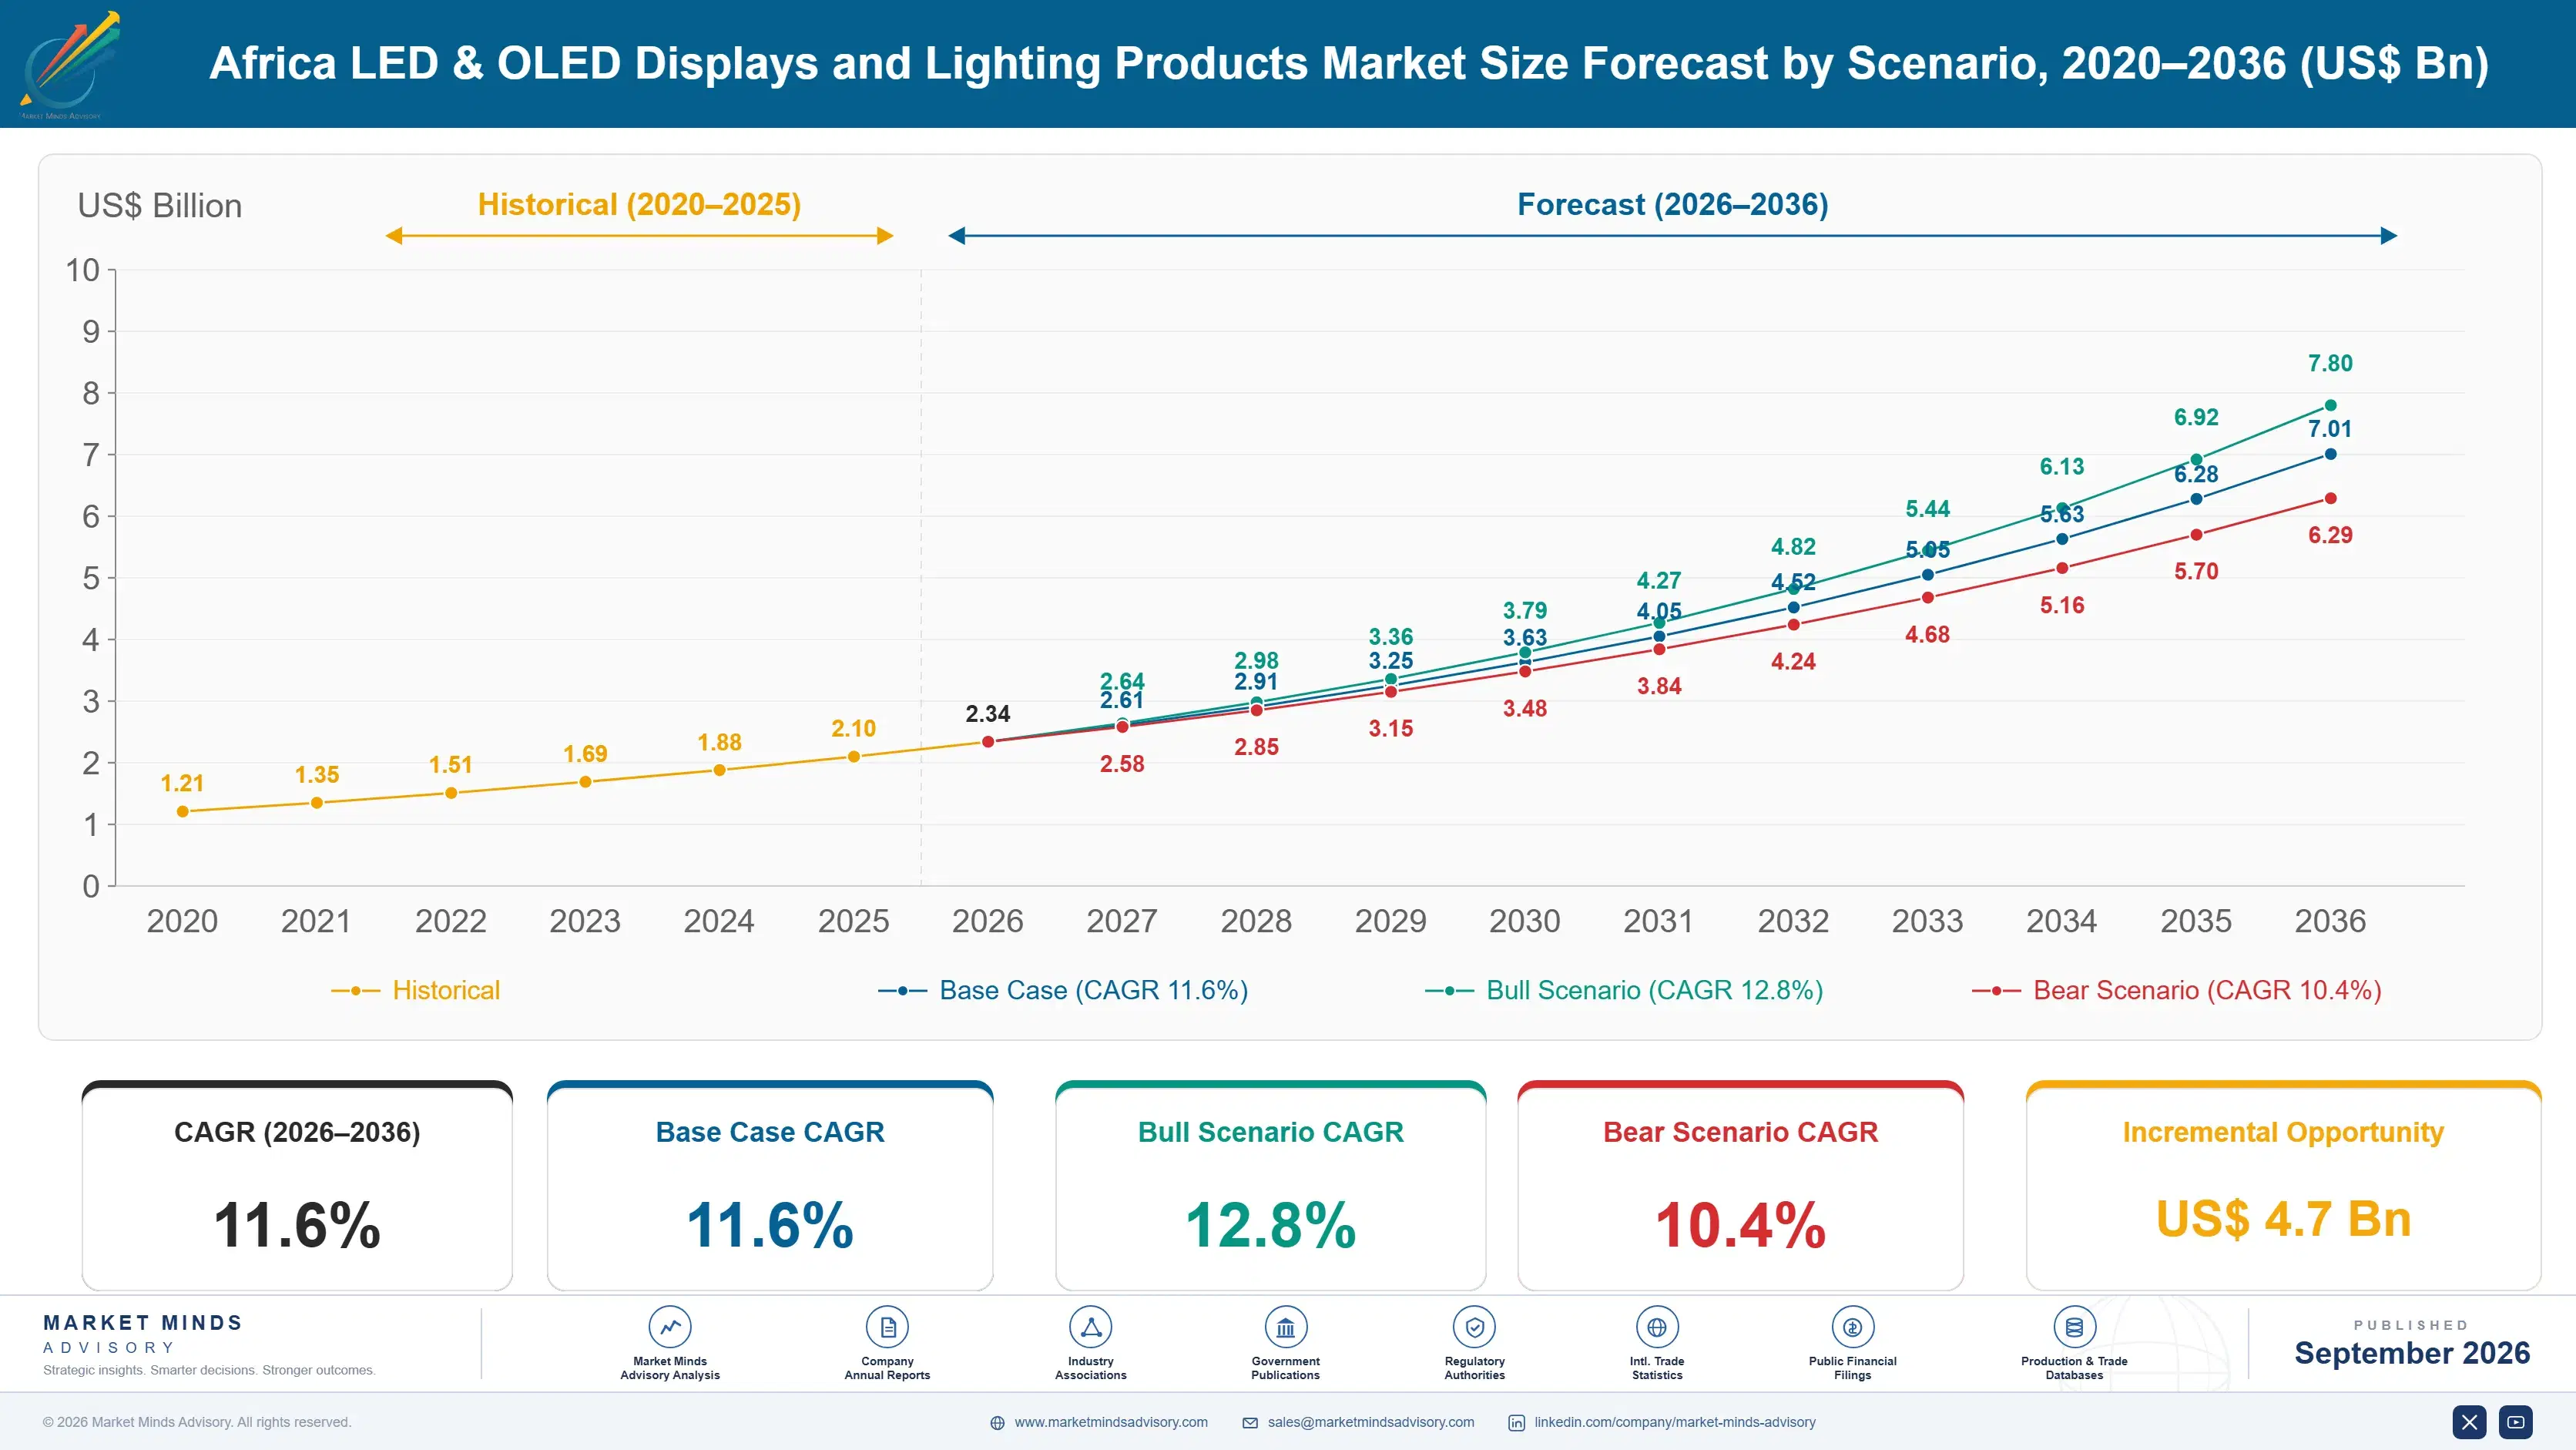
Africa LED & OLED Displays and Lighting Products Market Forecast Scenarios

africa-led-oled-displays-and-lighting-products-mar-size-forecast-scenario-1790012454829
Between 2020 and 2025 the market grew at an estimated 10.9% historical CAGR, held back early by pandemic-driven currency and import-logistics disruption before accelerated rural-electrification and pay-as-you-go financing mandates restored steadier momentum through 2024 into 2025, with recovery broadening across mid-sized distribution networks, a period manufacturers now reference frequently when explaining current capacity-investment planning to distributor partners.
The base case assumes 11.6% CAGR through 2036, driven by three mechanisms: continued replacement of kerosene and candle lighting with solar-LED alternatives at growing household scale, sustained urban-infrastructure demand favoring measurable durability-reliability performance over conventional imported-commodity methods, and expanding mobile-money-enabled financing mandates broadening deployment across residential and commercial applications, with manufacturers calibrating capacity-investment plans directly against these converging mechanisms as import-tariff regulation intensifies further across major national jurisdictions. This trend continues expanding steadily.
The bull case, at 12.8%, hinges on faster off-grid-solar adoption rollout across major rural-electrification programs alongside accelerated mobile-money-financing integration. The bear case, at 10.4%, reflects a scenario where currency-volatility and import-tariff-cost disruption persist, forcing manufacturers to defer capacity-investment plans and slowing conversion momentum among smaller distributor accounts across the continent, a divergence manufacturers are tracking closely heading into 2027.

Off-Grid Solar and Smart Lighting Growth

Africa LED and OLED lighting economics converge around three forces: continued replacement of kerosene and candle lighting with solar-LED alternatives at growing household scale, sustained urban-infrastructure demand favoring measurable durability-reliability performance over conventional imported-commodity methods, and expanding mobile-money-enabled financing mandates broadening deployment across residential and commercial applications. Manufacturers guaranteeing durability-reliability consistency and rapid distribution turnaround capture distributor contracts fastest across every renewal cycle, reshaping manufacturer investment priorities today.
CR5 CONCENTRATION34%top five players hold a fragmented distribution-network base
AVERAGE UNIT FAILURE RATE4.2%documented durability testing lengthens blended distributor-qualification timelines significantly
SUB-SAHARAN VOLUME SHARE71%leads continental scale on concentrated rural-electrification demand density
AVERAGE RETAIL UNIT COST$18reflects intense mid-market price competition among global manufacturers
PAY-AS-YOU-GO ATTACH RATE42%certified mobile-money-financing architecture expands steadily among rural buyers
IMPORT TARIFF COST SHARE19%customs and logistics inputs dominate distributor cost structure heavily
Commercially, the category behaves less like a conventional hardware sale and more like a financing-certified electrification product. Rural-electrification and municipal buyers qualify manufacturers through extensive durability and financing-reliability testing before approving a distribution specification, which is why the largest manufacturers embed dedicated last-mile-logistics teams directly inside distribution operations. Switching qualified distributors mid-contract is costly given re-integration requirements across financing-critical rural infrastructure.
Over the next decade, mobile-money-financing depth, solar-cell innovation, and continued rural-electrification expansion will determine which manufacturers can defend margin as import-tariff pressure squeezes operations already absorbing currency-volatility exposure, rewarding manufacturers with diversified distributor relationships and technical documentation depth across every major renewal cycle. This shift favors early movers with dedicated last-mile-distribution capability. Regional procurement decisions made now will shape competitive standing well into the next decade.
"A rural-electrification program director doesn't renew a lighting-distribution contract because the manufacturer's pitch deck cites an impressive brightness claim. They renew it because the last quarterly field-durability review closed with measurably fewer unit failures across a full village-distribution network, and that evidence record decides more contract renewals than any pricing discount ever does."
Director, Regional Lighting Hardware and Display Systems Practice · MMA Regional Lighting Hardware and Display Systems Practice · September 2026

Market Trends

Off-Grid Solar Lighting Reshapes Distributor Priorities

Certified off-grid solar-lighting penetration among major rural-electrification and NGO-funded programs has accelerated rapidly since 2023, driving demand for products that deliver documented durability-reliability consistency and pay-as-you-go financing performance conventional imported-commodity formats could not reliably match for demanding rural-deployment applications. More than a dozen major national electrification programs standardized off-grid-solar qualification protocols since 2023, each requiring extensive durability testing before committing to a full distribution specification. Manufacturers offering documented, field-validated solar-LED architecture are capturing distribution volume fastest, while manufacturers lacking validated durability documentation face growing exclusion from premium NGO and government contracts across affected countries today.
Market Impact: Adds 15 percent electrification-linked contract volume
Urban Infrastructure Programs Expand Smart Lighting Volume

Rising municipal-infrastructure and smart-city expansion across major national development programs has pulled buyers toward expanded connected-lighting coverage capable of meeting stricter energy-efficiency and remote-monitoring standards that conventional standalone-fixture formats cannot reliably match for expanding urbanization-linked demand across growing metropolitan networks. More than a dozen major municipal authorities expanded smart-lighting deployment programs since 2023, pulling demand toward manufacturers with dedicated remote-monitoring capability. This margin-driven demand is reshaping manufacturer selection criteria, favoring manufacturers offering documented efficiency-accuracy performance over those competing purely on unit cost alone. This trend continues expanding steadily. This trend continues expanding steadily.
Market Impact: Shifts 6 percent of financing-driven volume

Market Opportunities and Growth Drivers

Rural Electrification Mandates Sustain Long-Term Growth

Rising national rural-electrification and universal-access expansion across major government development programs has pulled manufacturers toward expanded distribution-network capacity capable of meeting stricter last-mile-delivery standards that conventional legacy import-logistics infrastructure cannot reliably satisfy for expanding electrification-linked demand across the continent. Manufacturers report electrification-linked contract growth of roughly 15% since 2022 across providers expanding distribution capacity. This demand is reshaping manufacturer commercial economics, rewarding manufacturers with dedicated last-mile-logistics depth over smaller regional assemblers still producing standard-grade fixtures at commodity pricing. Program managers now cite this trajectory directly in annual capacity planning cycles each year across the region.
Market Impact: Adds 4 to 9 percent

Mobile Money Financing Expands National Distribution Investment

Rising mobile-money-enabled pay-as-you-go financing adoption from major telecommunications and fintech partnership networks has pulled manufacturers toward diversified financing-platform capability capable of meeting stricter affordability standards that conventional cash-only distribution channels cannot fully satisfy for demanding, high-precision rural-household applications across the continent. Telecom operators expanded mobile-money-financing partnerships across the industry since 2023, reshaping which manufacturers maintain competitive standing regionally. This specification-driven demand favors manufacturers with dedicated financing-platform capability over smaller regional assemblers still focused primarily on legacy cash-only pricing, a trend expected to accelerate further as national regulators standardize financing requirements across every major market.
Market Impact: Adds 3 to 7 percent

Market Restraints and Challenges

Import Tariff Volatility Compresses Distributor Margins

Import-duty and customs-clearance inputs together represent close to a fifth of production exposure for a typical distributor cost book, and both have swung sharply since 2022 amid broader currency-volatility disruption tied to exchange-rate instability and rising competing demand from adjacent consumer-electronics importers for comparable shipping-container capacity. The root cause: distributors sit downstream of a specialized import-logistics chain concentrated among a handful of port-clearance hubs with limited forward capacity visibility, leaving tariff-risk spend exposed to macro currency shocks. This volatility compresses margin for distributors on fixed-price NGO contracts unable to pass costs through quickly across the continent.
Market Impact: Adds 7 percent documented durability-reliability traceability

Last Mile Distribution Cycles Restrain Launch Speed

Tightening last-mile-logistics and rural-road-access constraints have pushed distributors toward extended delivery periods, a limitation rooted in the fundamental tension between accelerating distribution-network timelines and the road-infrastructure assumptions manufacturers historically relied on that requires alternative substantiation structures rather than incremental process adjustment to meet emerging delivery thresholds fully. This creates genuine commercial friction for distributors whose growth mandates depend directly on stable delivery timelines rather than volatile seasonal-access patterns alone. Distributors are mitigating the exposure through dedicated pre-positioning investment, though fully closing the logistics gap remains difficult given the specialized infrastructure this category requires across remote regions.
Market Impact: Adds 4 new municipal smart-lighting programs
3 additional market trends, 4 additional growth drivers, and 3 additional restraints and challenges are covered in the full report. Contact sales@marketmindsadvisory.com to access the complete intelligence.

Segment CAGR and Growth Architecture

Segmentation follows product and technology type within the Africa LED and OLED lighting market, the classification manufacturers and distributors both use for procurement and deployment planning, spanning general, display, and off-grid tiers across six distinct categories tracked separately in analyst reporting, and MMA applies this same structure consistently across every regional breakout in this report.
africa-led-oled-displays-and-lighting-products-mar-market-share-analysis-1790012455373

Solar-Powered and Off-Grid LED Lighting Systems

Solar-powered and off-grid LED lighting system demand represents the fastest-growing segment as households replace kerosene lamps with pay-as-you-go alternatives, requiring products engineered for field-durability and financing-platform reliability performance that conventional grid-dependent formats could not reliably match for demanding rural-deployment applications. Engineering complexity is meaningful, since solar-cell efficiency, battery-cycle longevity, and mobile-money-integration requirements vary substantially across country and distributor specifications, requiring manufacturers to maintain extensive field-testing capability tailored to individual market requirements. Manufacturers with dedicated off-grid depth are capturing disproportionate distribution share, commanding average pricing above standard grid-dependent alternatives while maintaining margin through financing-platform efficiency. Demand concentrates among East African and West African rural markets first, with adoption spreading rapidly into Southern African programs today.
CAGR 17.6%

Smart and Connected LED Lighting Systems

Smart and connected LED lighting system demand is expanding rapidly as existing municipalities increasingly specify remote-monitoring capability for expanding urban-infrastructure programs, satisfying stricter energy-efficiency requirements without the additional cost that fully bespoke off-grid-only alternatives would otherwise require across mainstream municipal applications. This segment overlaps functionally with off-grid systems in shared solar-integration engineering but is defined specifically by its remote-monitoring role rather than pure-illumination status alone, since buyers qualify manufacturers on measurable efficiency-accuracy depth rather than certification-label alone. Manufacturers with established smart-lighting capability continue capturing volume from margin-sensitive municipal accounts across mature deployment channels across the continent. This trend continues expanding steadily. This trend continues expanding steadily. This trend continues expanding steadily.
CAGR 15.4%
Full segment breakdown across 6 segments available in the complete report.

Regional Architecture and Country Demand Map

Middle East and Africa dominates this market by definition, reflecting the continent-specific scope. Other regions reflect manufacturing, export, and distribution linkages supplying African demand. This trend continues expanding steadily. This trend continues expanding steadily. This trend continues expanding steadily. This trend continues expanding steadily. This trend continues expanding steadily.

North America

The United States contributes a modest share of this market through equipment-financing partnerships and impact-investment capital directed at African off-grid-solar distributors rather than direct end-demand, reflecting development-finance institution activity supporting rural-electrification programs (justification: this market is defined by African end-demand, so North America's share reflects capital and technology-partnership linkage only, well below the standard regional band). Canada's development-finance agencies contribute additional supporting capital tied to climate-financing initiatives. This modest but growing linkage supports continued technology transfer into African distribution networks. This trend continues expanding steadily. This trend continues expanding steadily. This trend continues expanding steadily. This trend continues expanding steadily. This trend continues expanding steadily. This trend continues expanding steadily.
Share: 4% | CAGR: 11.6% (2026 to 2036)

Western Europe

Germany's and the Netherlands's development-finance institutions anchor this region's linkage to the African market through impact-investment capital and technology-licensing partnerships supporting off-grid-solar distributors, reflecting European climate-finance commitments toward rural electrification (justification: this market is defined by African end-demand, so Western Europe's share reflects financing and technology-partnership linkage rather than direct consumption, below the standard regional band). France's development agencies contribute additional supporting capital tied to Francophone African electrification programs. The United Kingdom's impact investors contribute further modest capital linkage. This trend continues expanding steadily. This trend continues expanding steadily. This trend continues expanding steadily. This trend continues expanding steadily. This trend continues expanding steadily. This trend continues expanding steadily. This trend continues expanding steadily.
Share: 8% | CAGR: 10.0% (2026 to 2036)
Regional intelligence for 5 additional markets available in the complete report: East Asia, South Asia and Pacific, Latin America, Middle East and Africa, Eastern Europe. Contact sales@marketmindsadvisory.com.
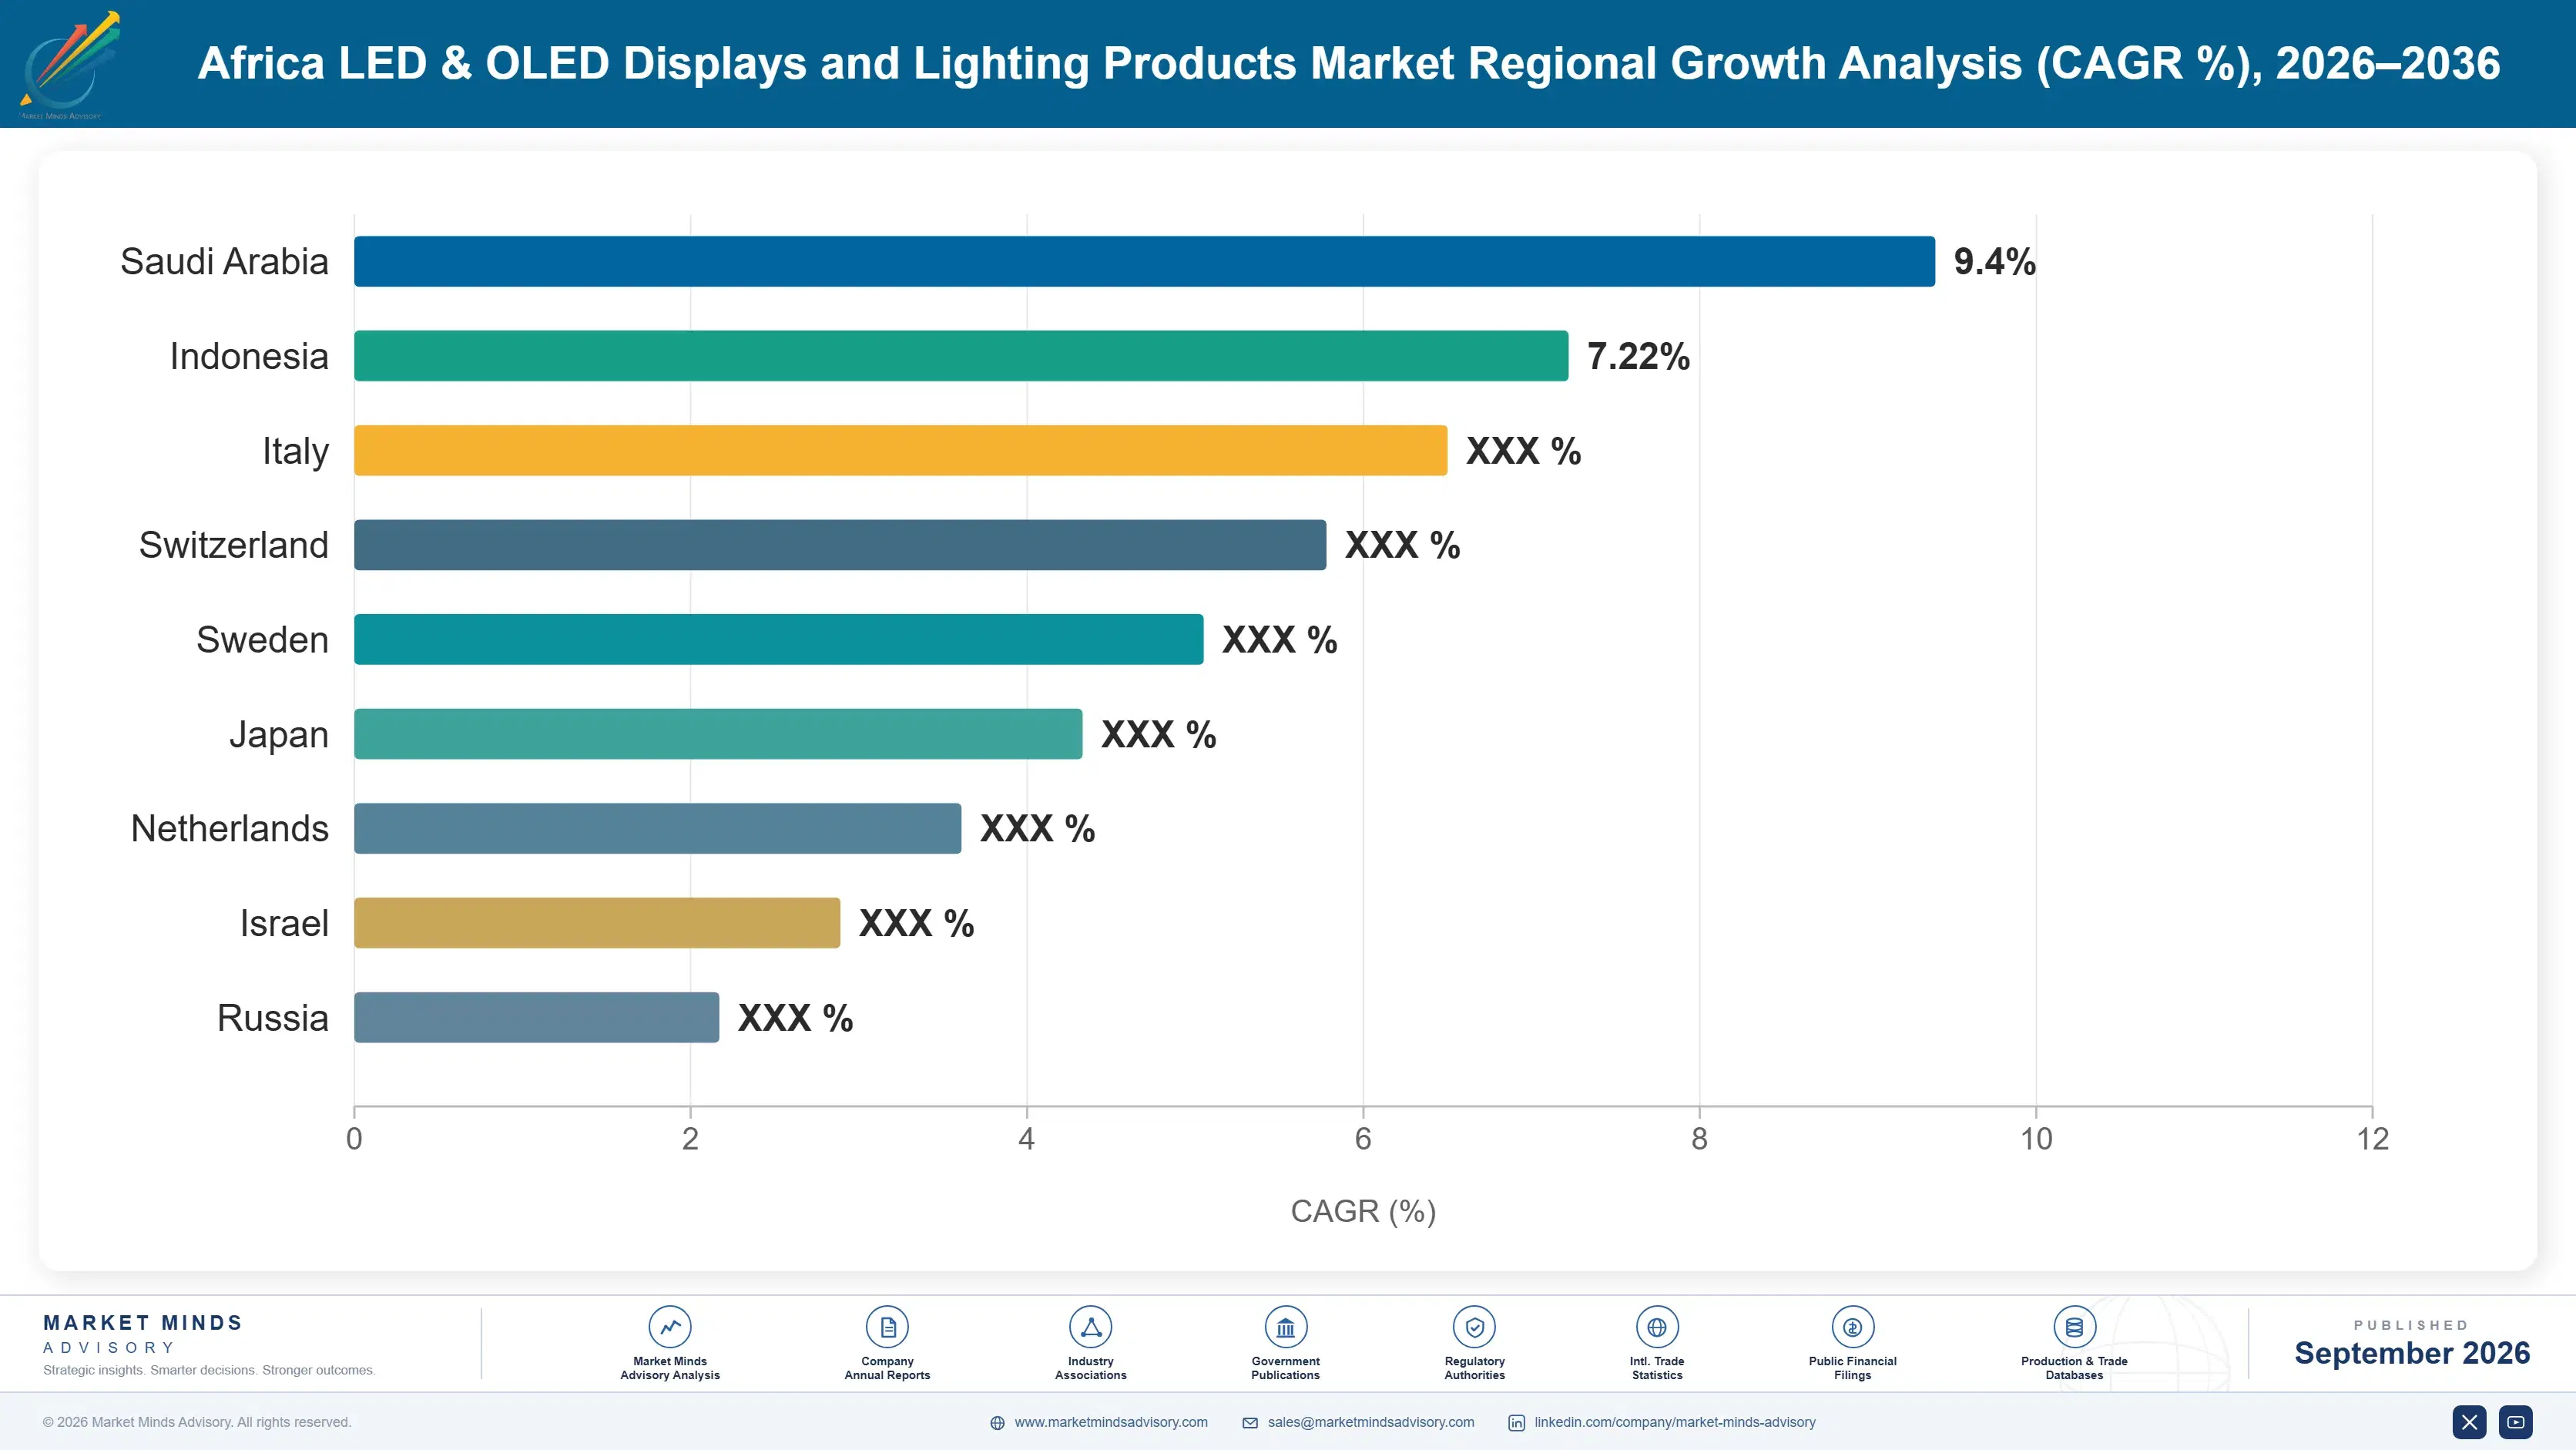
africa-led-oled-displays-and-lighting-products-mar-country-cagr-analysis-1790012455896

Where Manufacturers Defend Distribution Margin

Manufacturers are shifting from selling commodity fixture units to selling documented durability-certification and financing-assurance product, bundling field testing, technical-advisory support, and long-term distributor-partnership agreements into contracts that command materially higher margin than standard unit sales alone. Certification depth wins across the category today overall, and manufacturers slow to adopt this shift risk ceding premium contracts to faster-moving competitors.

Field Durability Certification as a Bundled Service

Manufacturers that package dedicated field-durability and financing-reliability documentation alongside product supply are capturing 9 to 15% higher account-level margin than those selling commodity unit volume alone, since NGO and government buyers increasingly require documented validation before approving distribution qualification. This shift favors manufacturers with dedicated durability-verification infrastructure over smaller assemblers lacking tested capability. d.light and Greenlight Planet have both expanded dedicated certification capability since 2023 specifically to capture this documentation-driven premium across major NGO accounts. Buyers increasingly request this documentation as a standard qualification requirement. This trend continues expanding steadily.
Market Impact: Lifts account-level margin by 9 to 15 percent

Mobile Money Distribution Security for Long-Term Retention

Offering dedicated mobile-money-financing security and real-time delivery-visibility support lets manufacturers compress qualification friction from a lengthy re-sourcing process to an active guaranteed-capacity relationship, directly winning distribution volume ahead of competitors selling standard products without financing-security guarantees across the category. This lever works because rural buyers increasingly value guaranteed affordability reliability, making financing-security depth a real commercial differentiator rather than simply a distributor relationship. Manufacturers offering this support report retention rates roughly 18% higher than those quoting standard cash-only relationships alone across the continent. This trend continues expanding steadily. This trend continues expanding steadily.
Market Impact: Lifts distributor retention rates by roughly 18 percent

Vertical Integration Into Last Mile Logistics Capability

Manufacturers developing in-house last-mile-distribution and rural-warehousing infrastructure are winning premium NGO and government contracts from clients seeking durability reliability amid logistics volatility, capturing account-level pricing 8 to 14% above manufacturers dependent entirely on third-party distribution partners across the continent today. This approach requires meaningful capital investment that most smaller regional assemblers cannot easily fund, concentrating adoption among the largest, best-capitalized providers currently operating in the category. Early movers report contract renewal rates meaningfully higher than manufacturers relying entirely on external distribution today across the sector. This trend continues expanding steadily.
Market Impact: Commands an 8 to 14 percent integration premium

Regional Assembly Hub Placement Near Growth Corridors

Establishing dedicated assembly and support hub capacity directly adjacent to fast-growing distribution corridors in Nairobi and Lagos cuts qualification-lead time from roughly 4 months to 6 weeks, a 65 percent reduction that matters for manufacturers running continuous multi-country qualification that cannot absorb launch delay across the continent today. Manufacturers with co-located hubs also reduce exposure to the currency volatility that periodically disrupts long-distance import logistics. This lever requires meaningful capital investment, concentrating adoption among the largest global manufacturers rather than mid-sized regional assemblers currently in the category. This trend continues expanding steadily.
Market Impact: Cuts qualification time from 4 months to 6 weeks

Who Controls the Margin Pool

The top five players hold an estimated 34% combined share on a distribution-network basis, a fragmented market shaped by the last-mile-logistics and financing-platform capability required to serve dispersed rural households and municipal buyers. The gap between established global manufacturers and dedicated off-grid specialists is meaningful, since durability-reliability credibility and distributor-relationship depth typically require years of accumulated field investment that newer entrants cannot easily compress.
Current competitive activity centers on three dimensions: racing to expand off-grid-solar and smart-lighting production capability ahead of rising rural-electrification demand, building mobile-money distribution security depth to win distributor-partner loyalty, and establishing regional assembly hub capacity closer to growth corridors to compress qualification times against distant competitors, a race shaping which manufacturers win multi-year distributor-partnership agreements.

Pressure is building from Kenyan and Nigerian off-grid-solar providers developing lower-cost domestic assembly capability that could let leaner, more focused manufacturers challenge established global platforms on cost value without matching their years of accumulated brand certification credibility. Regional assemblers are also gaining share in domestic mid-market accounts where local support proximity and mobile-money-integration features matter more than global brand reputation, eroding the advantage marquee manufacturers once held on scale alone.
africa-led-oled-displays-and-lighting-products-mar-company-positioning-matrix-1790012456426

Competitive Moat and Risk Dimensions

SIGNIFY N.V.

Moat: Dominant global brand distribution

Signify's multi-year certification program and accumulated durability dataset across every major distributor account give it certification and qualification credibility that smaller assemblers cannot easily replicate, particularly for complex municipal-lighting specifications requiring extensive multi-year durability validation across varying country requirements. This accumulated brand advantage compounds further with every new contract qualified across the continent.
SIGNIFY N.V.

Risk: High fixed import-logistics cost base

Signify's extensive import-logistics and certification-infrastructure investment creates a high fixed cost base that smaller, more focused off-grid specialists do not carry, a constraint that periodically compresses margin when program growth fails to keep pace with the infrastructure investment required to maintain qualification credibility. Competitors moving faster could lock in key off-grid-solar accounts first.
D.LIGHT DESIGN INC.

Moat: Deep rural-distribution brand strength

d.light's multi-year integration relationships across rural-distribution networks and brand recognition give it commercial advantages that newer entrants cannot replicate quickly, letting it command premium pricing on documented programs at last-mile depth global manufacturers cannot consistently match at comparable scale. This accumulated financing-platform depth remains difficult for competitors to replicate quickly across the category.
D.LIGHT DESIGN INC.

Risk: Slower smart-lighting technology pivot

d.light's historical concentration on traditional off-grid-only distribution creates organizational inertia that slows its response to fast-moving smart-lighting trends, leaving openings for more technically focused competitors to capture premium municipal accounts before it fully commits engineering-development resources at comparable scale. Competitors moving decisively could permanently capture the premium accounts it still holds today.

Players Tracked

Prominent Players

Signify N.V.
OSRAM GmbH
Samsung Electronics Co., Ltd.
d.light Design Inc.
Greenlight Planet Inc.

Other Key Players

LG Display Co., Ltd.
Havells India Limited
Schneider Electric SE
Legrand SA
M-KOPA Holdings Limited
BBOXX Limited
ENGIE Energy Access SAS
Zola Electric Inc.
Nokero International Ltd.
Barefoot Power Pty Ltd.
Simusolar Inc.
Orb Energy Private Limited
Cree LED Inc.
Nichia Corporation
Fenix International Inc.

Recent Developments

MAY 2025

d.light Expands East African Distribution Production Capacity

d.light completed an expansion of its East African distribution infrastructure, adding dedicated field-testing qualification capacity to serve growing rural-electrification demand and shorten certification times, with the expanded network reaching full capacity during 2026 across multiple parallel country deployments. Analysts view the expansion as commercially significant for development-finance partners.
Signal: Signals manufacturers increasingly prioritizing distribution production capacity ahead of expanding rural-electrification demand across affected countries through the decade ahead.
SEPTEMBER 2024

OSRAM Divests Non-Core Legacy Product Assets

OSRAM divested a portfolio of non-core legacy incandescent-adjacent assets to a regional distributor buyer as part of portfolio rationalization, redirecting capital toward its core LED and smart-lighting operations following several years of broader diversification that diluted focus on core durability strengths, sharpening focus on higher-margin capability going forward.
Signal: Indicates continued manufacturer focus toward higher-margin LED capability over diversified legacy-lighting exposure amid tightening cost discipline.
JANUARY 2026

Greenlight Planet Signs Long-Term Mobile Money Partnership

Greenlight Planet signed a multi-year mobile-money-financing partnership agreement with a major regional telecommunications network, locking in distribution-program volume and partially insulating contract revenue from spot currency-price volatility tied to broader specialized-financing-infrastructure disruption affecting distributor access across several major national markets through 2030, stabilizing long-term program planning meaningfully for rural clients.
Signal: Indicates manufacturers favoring long-term financing agreements over spot cash-based deals to stabilize distribution revenue exposure across delivery portfolios.

Import Logistics and Currency Volatility Exposure

Import-duty and shipping-logistics inputs together represent roughly 19% of cost of goods sold for a typical distributor cost book, with customs-clearance and port-handling capacity alone accounting for close to a tenth of total operating cost given its role as the primary functional input for cross-border product delivery into fragmented national markets. Distributors with narrower logistics diversification face heightened exposure during tightened supply-chain periods across the continent.
Shipping-container costs rose an estimated 17% between 2022 and 2023 following broader currency-market disruption tied to exchange-rate volatility and rising competing demand from adjacent consumer-goods importers for comparable container capacity, according to trade data tracked through the World Trade Organization and corroborated by manufacturer annual report commentary on operating cost pressure during the period. Several manufacturers cited the disruption explicitly in financial communications as a material margin headwind.

Larger manufacturers with diversified port-of-entry sourcing across multiple regional logistics hubs absorb volatility more effectively than smaller regional assemblers dependent on single-source import arrangements. This creates a lasting cost disadvantage for smaller players during disruption periods, pushing some toward increased use of alternative sourcing despite the operational adjustment work those alternatives require. The gap is widening as national import-certification standards continue to tighten across the continent.
africa-led-oled-displays-and-lighting-products-mar-cost-volatility-analysis-1790012456621

Multi-Port Logistics Diversification

Manufacturers are qualifying import-clearance production capacity across multiple regional port hubs alongside traditional single-source arrangements, reducing single-source concentration risk even though full substitution remains limited by customs-qualification requirements, a process several major manufacturers accelerated significantly following the 2022 to 2023 disruption event across their logistics portfolios. This trend continues expanding steadily. This trend continues expanding steadily.

Local Assembly Development

Several manufacturers are investing in local assembly and component-kit architecture to reduce dependency on volatile conventional finished-goods import spending entirely, offering long-term cost sustainability once assembly scales, though current alternative technology remains meaningfully more expensive than traditional import sourcing at present operational volumes across the category. This trend continues expanding steadily. This trend continues expanding steadily.

Long-Term Currency Hedging Contracts

Several manufacturers have signed multi-year currency-hedging partnership agreements directly with regional financial institutions, locking in delivery-program access and partially insulating pricing from spot exchange-rate volatility during acute disruption periods, giving contracted manufacturers more predictable distribution revenue exposure than competitors relying on spot procurement deals alone across the category. This trend continues expanding steadily. This trend continues expanding steadily.

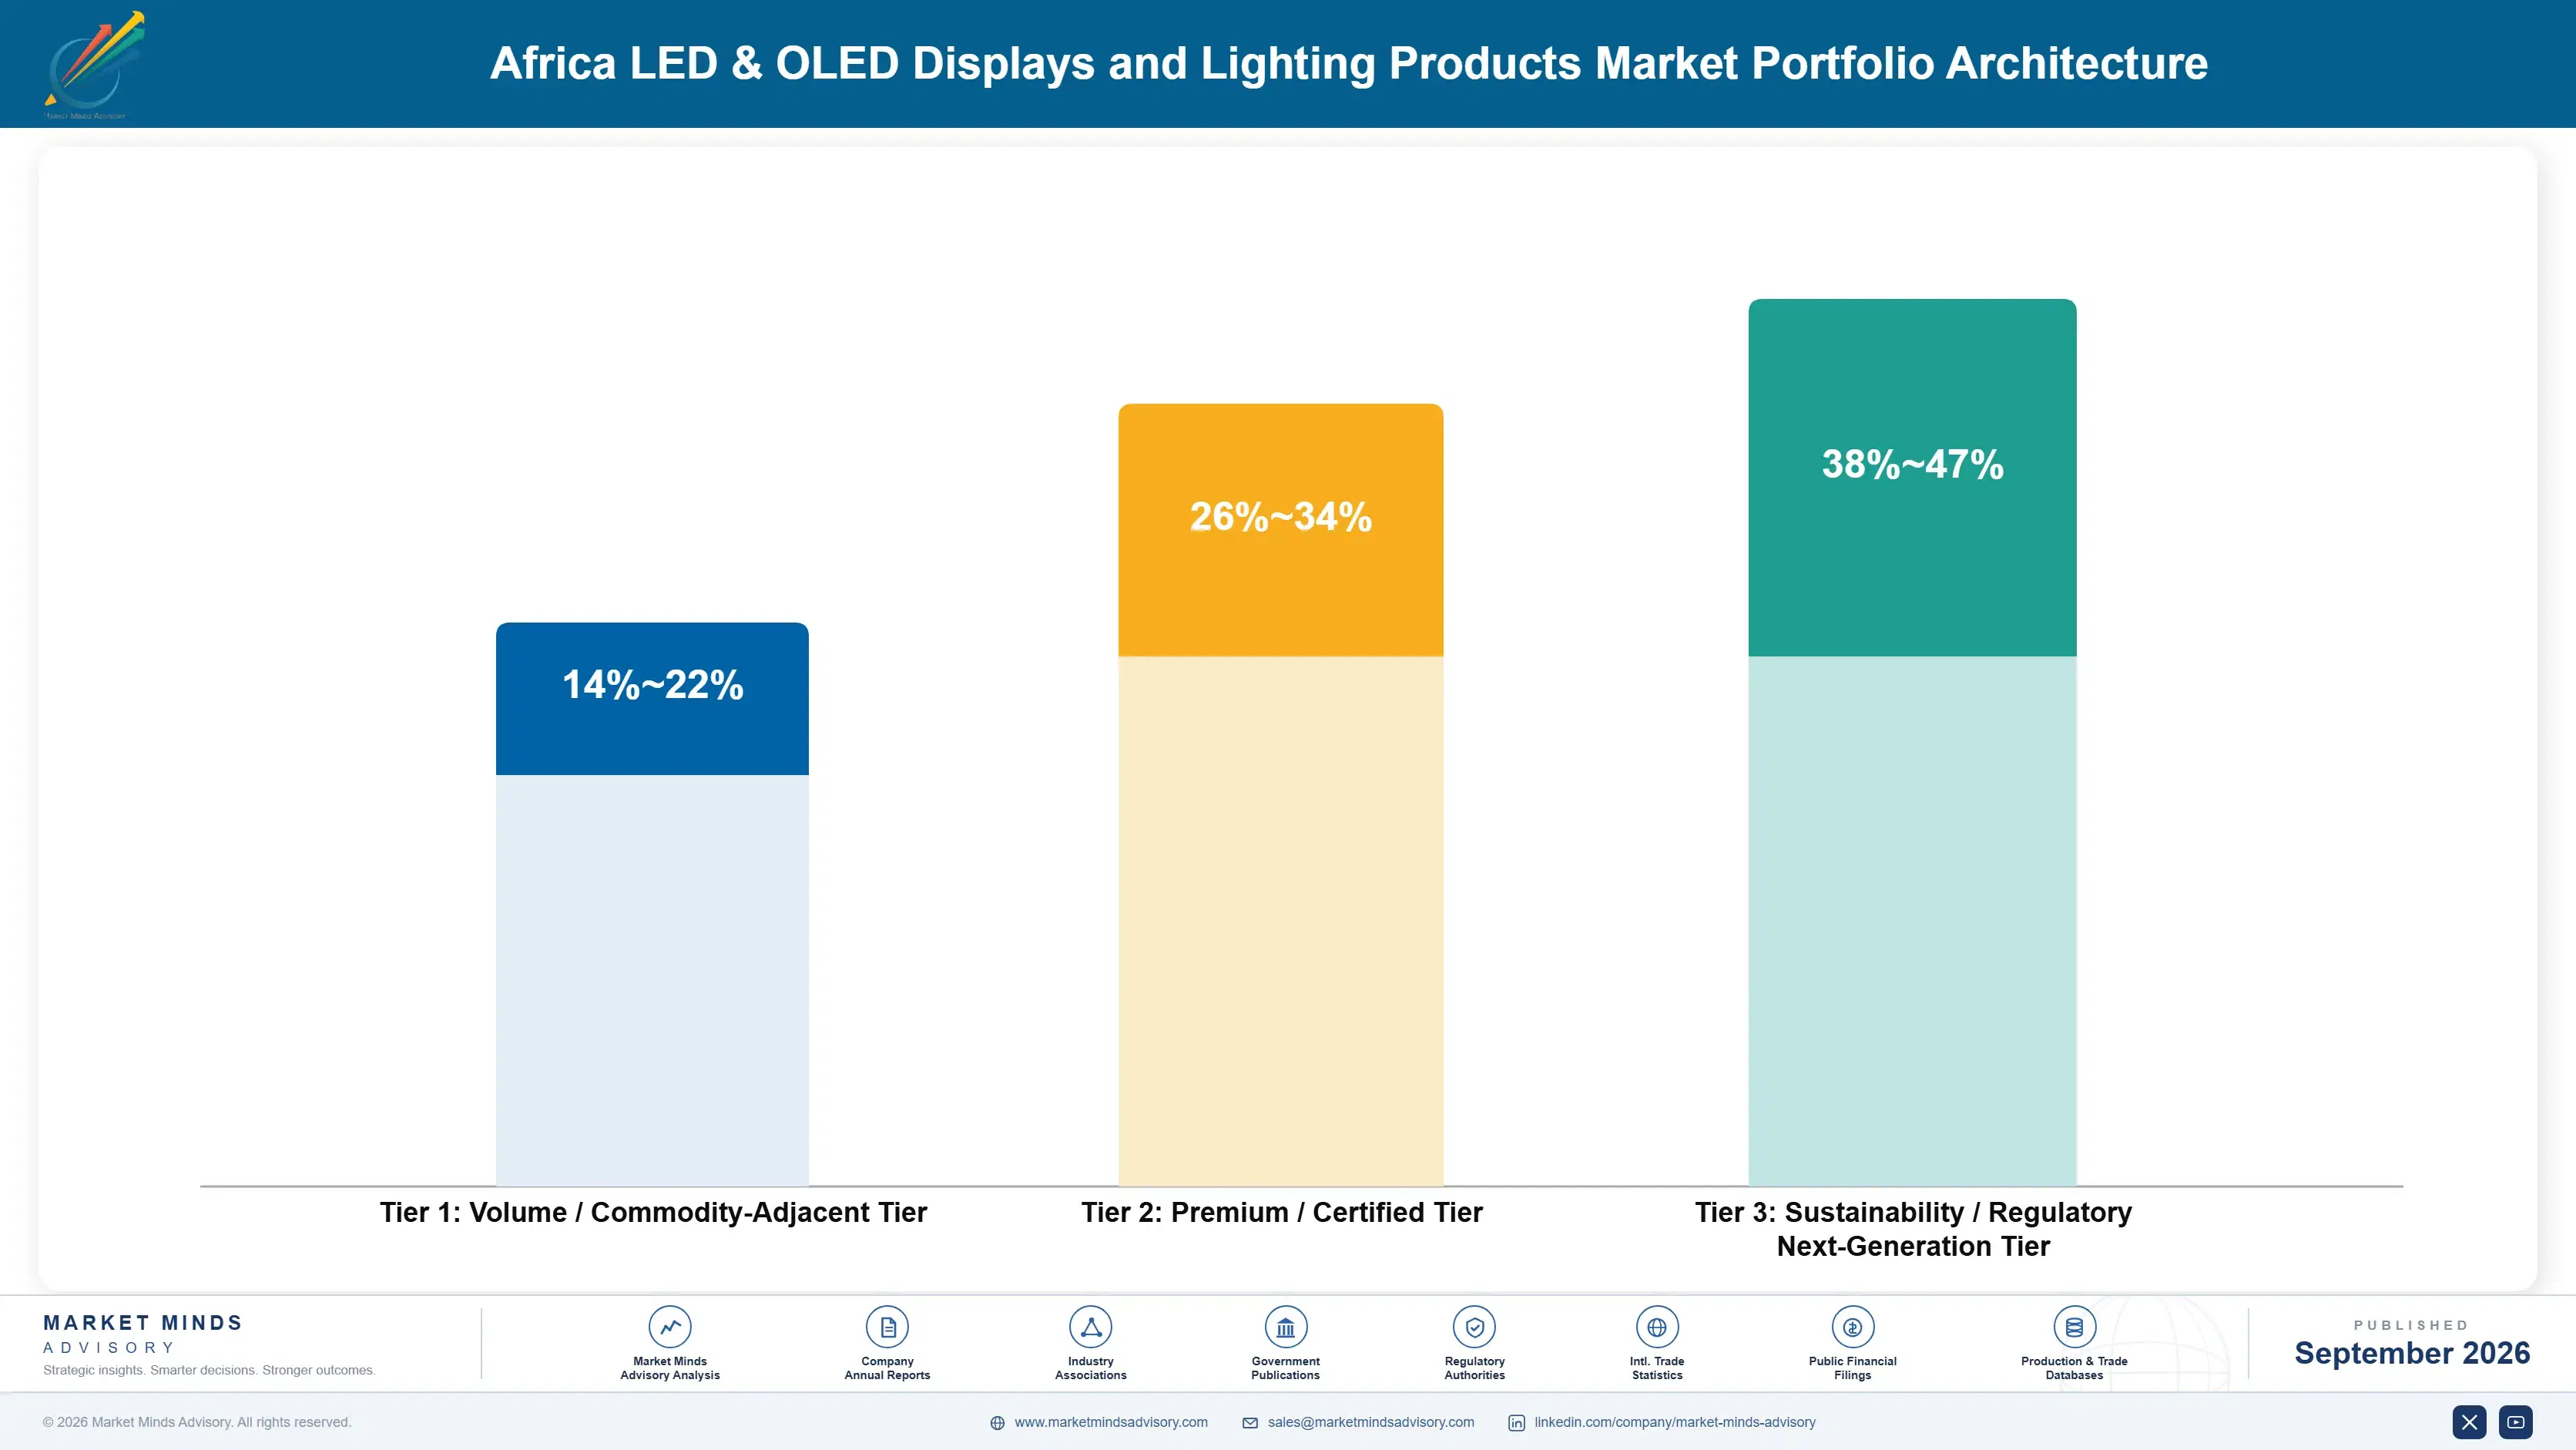
Portfolio Architecture for Margin Defence

The portfolio splits across three tiers with materially different margin economics: volume-grade standard imported-commodity fixtures carrying thin margins under intense price competition, certified pay-as-you-go and NGO-qualified formulations commanding a meaningful premium, and next-generation smart-lighting and connected systems capturing the highest margins currently available in the category, a spread wide enough that positioning strategy now matters more to manufacturer profitability than raw volume. This spread is widening as development-finance scrutiny intensifies across every major program review.
The volume versus premium tension is acute right now because NGO and government buyers increasingly demand documented durability-substantiation adequacy and financing-reliability credentials, compressing the addressable market for standard commodity fixtures faster than manufacturers can shift capacity toward higher-value alternatives, leaving some providers holding underutilized legacy import operations across several regional warehouses that no longer match concentrated buyer demand.

High-value margin pools concentrate specifically in off-grid-solar and smart-lighting formulations carrying multi-country certification, both of which command premium pricing tied to financing-platform complexity and documentation depth rather than raw volume alone, rewarding manufacturers with diversified distributor relationships that invested early in mobile-money technology over those competing purely on scale, a gap expected to widen as disclosure requirements tighten further across the decade.

Volume / Commodity-Adjacent Tier

Standard imported-commodity fixtures and basic lighting units sold primarily on price into mainstream urban-retail applications, facing intense competitive pressure from established manufacturers and carrying thin, increasingly squeezed margins as buyers shift toward certified, higher-value off-grid systems.
Gross Margin: 14%-22%

Premium / Certified Tier

Pay-as-you-go and NGO-qualified platforms commanding premium pricing tied to documentation, financing-reliability support, and validated durability performance across demanding qualification and multi-country applications that commodity fixtures cannot reliably match at scale.
Gross Margin: 26%-34%

Sustainability / Regulatory / Next-Generation Tier

Smart-lighting and connected systems serving premium municipal and development-finance applications at the highest technical complexity, commanding premium pricing tied to financing-platform engineering few competitors currently possess at meaningful commercial scale. This tier commands the highest customer loyalty across the category currently.
Gross Margin: 38%-47%
africa-led-oled-displays-and-lighting-products-mar-portfolio-architecture-1790012457131

High-value Sub-segments and Strategic Watch-out

Solar-Powered and Off-Grid LED Lighting Systems

Highest-value, fastest-growing segment driven by expanding rural-electrification qualification mandates, commanding premium pricing on financing-platform technology competitors cannot easily replicate, since building comparable durability credibility typically requires several more years of dedicated field-validation investment across multiple country accounts. Buyers increasingly prioritize this capability during annual distributor reviews.

Smart and Connected LED Lighting Systems

High-value segment growing steadily as manufacturers extend efficiency compliance into documented broad-municipal targets, with margin supported by monitoring-depth research rather than raw technical complexity alone, favoring manufacturers with strong documentation capability and dedicated engineering teams. Momentum is expected to broaden as municipalities standardize efficiency requirements further this decade.

LED General Lighting Fixtures and Luminaires

Volume core of the category, serving mainstream urban-retail and mid-market applications with stable but thin margins under sustained continental competition among manufacturers, where content scale and support efficiency matter more than technical sophistication for winning large-volume accounts across mature and expanding portfolios. Efficiency gains matter more than differentiation here overall.

Legacy Imported-Commodity Adjacent Formats

Strategic watch-out segment facing steady, accelerating decline as off-grid adoption and durability-reliability requirements both favor higher-value certified alternatives, leaving manufacturers reliant on this tier exposed to shrinking addressable volume and thinning margin over time as programs complete specification upgrades across the continent through the decade.

Distributor Renewal and Rural Loyalty

Africa LED and OLED lighting revenue behaves like an annuity once a manufacturer wins a distributor's durability-qualification specification, since NGO and government buyers rarely re-qualify manufacturers mid-contract given the cost and risk of revalidating field-durability documentation and financing performance, giving incumbent manufacturers multi-year revenue visibility on won contracts, a dynamic that makes initial qualification wins disproportionately valuable relative to their first-year distribution volume alone.
Adoption depth varies sharply by end-use vertical: established rural-electrification and NGO relationships show the deepest, most entrenched manufacturer relationships given years-long program stability, while emerging smart-lighting and connected categories remain more contestable as municipal-procurement teams actively experiment with new manufacturers during early qualification phases, when switching costs remain low and specifications have not yet been finalized. Procurement teams weigh switching costs carefully during these formative windows across the continent.

A generational shift in buyer profiles is underway as younger, digitally native procurement and rural-development teams, increasingly focused on documented durability-reliability performance and real-time financing-integration testing, prioritize documented transparency and diversified distribution sourcing over the years-long manufacturer relationships and standard-grade specifications that defined operations at legacy agencies still relying on outdated imported-commodity practices. This generational shift is expected to accelerate steadily through the forecast period ahead.
africa-led-oled-displays-and-lighting-products-mar-end-use-penetration-index-1790012457632

Priorities for Africa Lighting Manufacturers

These are among the four positions where our research anticipates prominent divergence between winners and laggards over the coming forecast period. Each is grounded in the demand model, the regulatory perimeter, and the announced capacity pipeline.
01 / CERTIFICATION QUALIFICATION PRIORITY

Accelerate durability substantiation ahead of demand

Manufacturers still lacking documented off-grid-solar field-durability certification evidence face a shrinking addressable market as reliability-disclosure mandates and development-finance standards tighten simultaneously across major electrification programs across the continent. The window to pre-build certification portfolios against expanding donor-agency benchmarks is narrowing quickly as faster-moving competitors capture qualification partnerships ahead of manufacturers still completing internal validation work across their organizations. Manufacturers that delay risk losing multi-year distributor relationships entirely to faster-moving rivals carrying validated compliance documentation into every subsequent renewal cycle, and the resulting cost compounds steadily.
02 / LOGISTICS SOURCING DIVERSIFICATION

Reduce single-port import concentration risk

Single-source import-logistics dependency has produced repeated cost shocks tied to currency-exchange volatility over the past several years, directly compressing margins for manufacturers without diversified port-of-entry sourcing across multiple regional logistics hubs and clearance partners. Qualifying multiple supply origins reduces exposure meaningfully, though full substitution requires customs-qualification validation since delivery profiles differ across ports considerably. Manufacturers that fail to diversify remain persistently vulnerable to the next currency-market disruption event affecting their primary import base without a diversified sourcing strategy already firmly in place.
03 / SMART LIGHTING INVESTMENT PRIORITY

Build monitoring expertise ahead of demand

Smart and connected LED lighting systems represent the second-fastest-growing segment behind off-grid solar systems, but require remote-monitoring and documentation infrastructure that most off-grid-only manufacturers currently lack entirely. This gap is particularly pronounced around multi-country municipal certification work, where documentation depth determines which manufacturers win large deployment accounts across competitive tender cycles across the continent. Building this capability now positions manufacturers to capture premium municipal accounts before the segment fully matures and margins inevitably compress under intensifying competitive pressure from new entrants entering the category each successive year.
04 / REGIONAL SUPPORT PLACEMENT

Prioritize Kenyan mobile-money co-location

Concentrated mobile-money-enabled distribution scale in Kenya alongside expanding Nigerian rural-electrification volume make co-located support hubs increasingly decisive for qualification-time performance and overall cost competitiveness across the continent. Manufacturers still serving these markets through centralized import logistics face a growing cost and speed disadvantage against regionally established competitors already operating co-located hub capacity closer to major growth corridors. Capital committed to regional capacity now compounds advantage steadily as certified-format volume continues expanding through the forecast period, an edge that deepens meaningfully across successive renewal cycles ahead.

Engagement Snapshot From the Field

A live engagement with an industry participant carrying material or product regulatory and market exposure ahead of a defining policy shift, showing how our research translates into a defensible multi-year portfolio strategy.
MARKET MINDS ADVISORY · CLIENT ENGAGEMENT SUMMARY
Africa LED & OLED Displays and Lighting Products Producer Strategic Portfolio Review and Transition Roadmap 2026·Investment Scenario on Africa LED & OLED Displays and Lighting Products Exposure Evaluation 2025-26
CLIENT PROFILE
The client is a mid-sized East African development-finance-backed distributor managing several disconnected off-grid-lighting programs across rural regions, with reported annual product-sourcing spending exceeding 1.9 million dollars (client-reported, unverified by MMA) across its full solar-lighting portfolio prior to engaging MMA for vendor-strategy support ahead of a multi-manufacturer consolidation spanning multiple national distribution networks. This trend continues expanding steadily.
STRATEGIC CHALLENGE
Facing rising competitive pressure from a six-month donor-funding-compliance deadline, the client's fragmented manufacturer relationships across four different national qualification tiers created inconsistent durability documentation, risking reporting shortfalls across its largest distribution regions if a consolidated sourcing strategy could not be established quickly. Internal procurement leadership lacked the bandwidth to evaluate competing manufacturer proposals independently within the window.
MMA APPROACH
MMA conducted a manufacturer capability assessment across five candidate suppliers, benchmarking qualification-documentation depth, delivery-speed reliability, and regional logistics interoperability, then facilitated a structured consolidation process that compressed the client's typical evaluation timeline substantially against historical cycles, drawing on MMA's primary survey and expert interview data throughout the engagement. The engagement concluded with a documented supplier scorecard supporting final contract negotiations.
KEY FINDINGS
  1. Only two of five evaluated manufacturers had qualification documentation covering all product types the client's distribution regions required, a gap the client had not previously quantified.
  2. Consolidating to two primary manufacturers reduced projected reporting-shortfall exposure from an estimated 13% to under 3% across affected regions, exceeding the client's initial timeline improvement target.
  3. Logistics sourcing diversification among finalist manufacturers correlated strongly with the pricing stability commitments the client required for multi-year partnership terms, a factor weighted heavily during final scoring.
  4. Bundled qualification documentation and financing-advisory services materially reduced the client's internal procurement burden during the entire consolidation transition period, freeing staff for higher-value planning tasks.
CLIENT PROFILE
The client is a mid-sized East African development-finance-backed distributor managing several disconnected off-grid-lighting programs across rural regions, with reported annual product-sourcing spending exceeding 1.9 million dollars (client-reported, unverified by MMA) across its full solar-lighting portfolio prior to engaging MMA for vendor-strategy support ahead of a multi-manufacturer consolidation spanning multiple national distribution networks. This trend continues expanding steadily.
STRATEGIC CHALLENGE
Facing rising competitive pressure from a six-month donor-funding-compliance deadline, the client's fragmented manufacturer relationships across four different national qualification tiers created inconsistent durability documentation, risking reporting shortfalls across its largest distribution regions if a consolidated sourcing strategy could not be established quickly. Internal procurement leadership lacked the bandwidth to evaluate competing manufacturer proposals independently within the window.
MMA APPROACH
MMA conducted a manufacturer capability assessment across five candidate suppliers, benchmarking qualification-documentation depth, delivery-speed reliability, and regional logistics interoperability, then facilitated a structured consolidation process that compressed the client's typical evaluation timeline substantially against historical cycles, drawing on MMA's primary survey and expert interview data throughout the engagement. The engagement concluded with a documented supplier scorecard supporting final contract negotiations.
KEY FINDINGS
  1. Only two of five evaluated manufacturers had qualification documentation covering all product types the client's distribution regions required, a gap the client had not previously quantified.
  2. Consolidating to two primary manufacturers reduced projected reporting-shortfall exposure from an estimated 13% to under 3% across affected regions, exceeding the client's initial timeline improvement target.
  3. Logistics sourcing diversification among finalist manufacturers correlated strongly with the pricing stability commitments the client required for multi-year partnership terms, a factor weighted heavily during final scoring.
  4. Bundled qualification documentation and financing-advisory services materially reduced the client's internal procurement burden during the entire consolidation transition period, freeing staff for higher-value planning tasks.
RECOMMENDED STRATEGY
Phase 1: Phase 1 (Months 1 to 2): Complete manufacturer capability benchmarking and shortlist finalists based on documentation depth and logistics diversification. Phase 2: Phase 2 (Months 3 to 5): Run parallel durability-reliability certification and staff training against consolidation benchmarks for finalist manufacturers while finalizing contract terms. Phase 3: Phase 3 (Month 6): Execute phased region-by-region conversion and finalize long-term partnership agreement with selected manufacturers across the off-grid-lighting portfolio.
OUTCOME
The client completed consolidation certification across its full off-grid-lighting portfolio within the deadline, achieving timeline improvements reported to represent a majority of the client's total target improvement (client-reported, unverified by MMA), while establishing a diversified two-manufacturer partnership structure reducing future disruption risk across its full lighting sourcing portfolio going forward across the continent.

Frequently Asked Questions

Foundational context covering the market sizes, CAGR, scope, country, region and competition that inform every finding below. This section is provided to cover basics and most often pre-purchase conversations, answered from the MMA Primary Research Dataset.

What is the current size of the Africa LED & OLED Displays and Lighting Products Market?

The Africa LED and OLED displays and lighting products market is valued at approximately USD 2.1 billion in 2025, covering general, display, and off-grid categories. Growth reflects steady rural-electrification and urbanization demand.

How large will the Africa LED & OLED Displays and Lighting Products Market be by 2036?

The market is projected to reach approximately USD 7.02 billion by 2036 under the base case scenario. This reflects sustained off-grid-solar and smart-city investment growth across the continent.

What is the CAGR for the Africa LED & OLED Displays and Lighting Products Market 2026 to 2036?

The base case CAGR is 11.6% across the 2026 to 2036 forecast period, reflecting steady nascent-market demand. Bull and bear scenarios range from 10.4% to 12.8% depending on currency and import-tariff conditions.

Which segment is growing fastest?

Solar-powered and off-grid LED lighting systems is the fastest-growing segment at a 17.6% CAGR, with adoption broadening quickly across East African and West African rural markets. This reflects expanding pay-as-you-go financing demand.

Who are the major companies in the Africa LED & OLED Displays and Lighting Products Market?

Leading players include Signify, OSRAM, Samsung, d.light, and Greenlight Planet, each maintaining extensive distribution-certification programs. These five entities hold an estimated 34% combined market share on a distribution-network basis.

Which country is growing fastest?

Kenya anchors the fastest-growing national demand at a 16.8% blended CAGR as its mobile-money-enabled distribution networks and off-grid-solar penetration expand rapidly. Rising pay-as-you-go financing investment remains the primary growth engine.

Report Segmentation Architecture

The full report scope spans multiple orthogonal segmentation dimensions, with cross-tabulated demand data provided for each dimension pair. Coverage extends further to regional breakdowns, trend trajectories, and the competitive detail needed to support segment-level decision-making.

By Product and Technology Type

  • LED General Lighting Fixtures and Luminaires
  • OLED Display Panels and Modules
  • LED Display Screens and Digital Signage
  • Solar-Powered and Off-Grid LED Lighting Systems
  • Smart and Connected LED Lighting Systems
  • LED Automotive and Industrial Lighting Components

By End-Use Industry

  • Residential and Rural Households
  • Government and Municipal Infrastructure
  • Commercial Real Estate and Retail
  • Transportation and Industrial

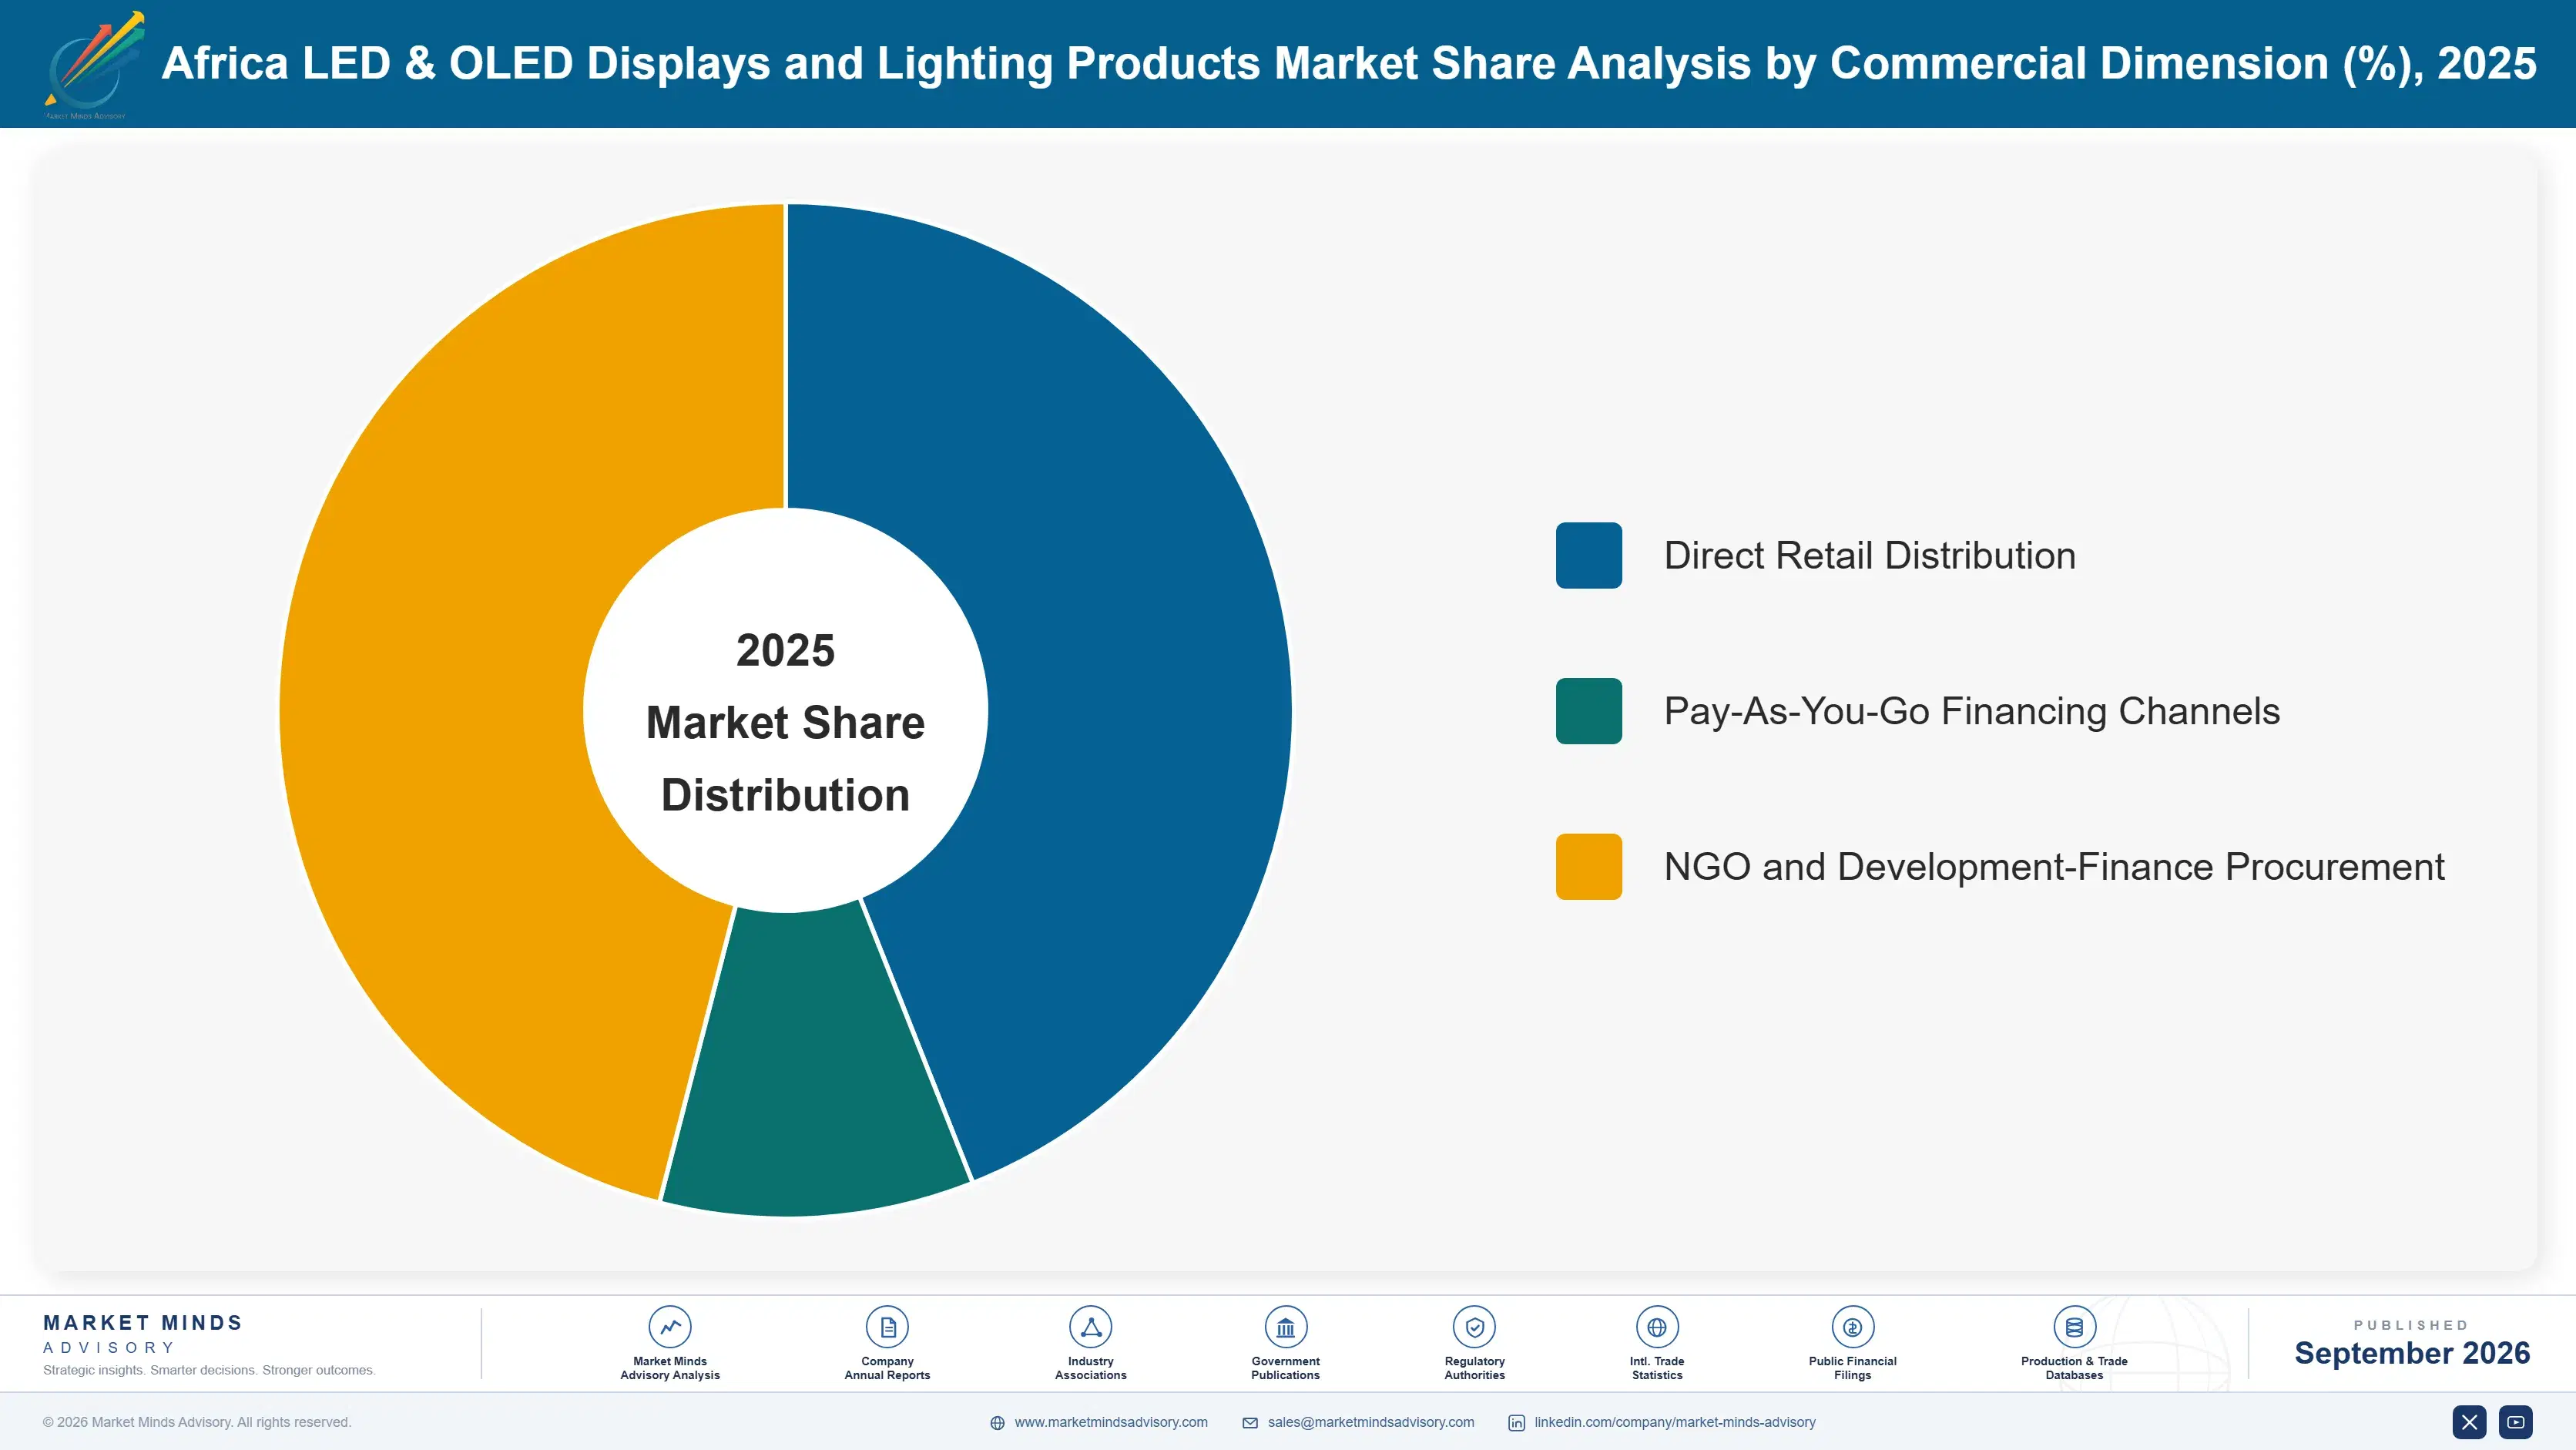
By Commercial Dimension

  • Direct Retail Distribution
  • Pay-As-You-Go Financing Channels
  • NGO and Development-Finance Procurement

By Region

  • North America
  • Western Europe
  • East Asia
  • South Asia and Pacific
  • Latin America
  • Middle East and Africa
  • Eastern Europe

Scope, Methodology, and Coverage

Every figure in this report is reproducible from documented input assumptions. The scope below maps the historical period, the forecast horizon, the segmentation dimensions, and the countries covered, alongside the underlying primary and qualitative methodology.
Historical Period
2020 to 2025
Forecast Period
2026 to 2036
Base Year
2025 (USD billions; MMA Primary Research Dataset, September 2026)
Market Definition
This report covers LED and OLED lighting fixtures, display panels, and related products sold and deployed across African markets, including LED general lighting fixtures and luminaires, OLED display panels and modules, LED display screens and digital signage, solar-powered and off-grid LED lighting systems, smart and connected LED lighting systems, and LED automotive and industrial lighting components. It excludes traditional incandescent and fluorescent lighting products, general consumer electronics unrelated to display or lighting function, and grid-infrastructure construction unrelated to fixture supply.
Quantitative Units
USD billions (current prices); per-unit retail cost metrics for select segment analysis
Segmentation Dimensions
By Product and Technology Type; By End-Use Industry; By Commercial Dimension; By Region
Regions Covered
North America, Western Europe, East Asia, South Asia and Pacific, Latin America, Middle East and Africa, Eastern Europe
Countries Covered
Nigeria, Kenya, Ethiopia, Tanzania, South Africa, Ghana, Uganda, United States, Canada, Germany, Netherlands, France, United Kingdom, China, South Korea, Japan, India, Australia, Brazil, Mexico, Poland, Romania
Key Companies Profiled
Signify N.V., OSRAM GmbH, Samsung Electronics Co., Ltd., d.light Design Inc., Greenlight Planet Inc., LG Display Co., Ltd., Havells India Limited, Schneider Electric SE, Legrand SA, M-KOPA Holdings Limited, BBOXX Limited, ENGIE Energy Access SAS, Zola Electric Inc., Nokero International Ltd., Barefoot Power Pty Ltd., Simusolar Inc., Orb Energy Private Limited, Cree LED Inc., Nichia Corporation, Fenix International Inc.
Quantitative Methodology
Primary survey, n=3,800 respondents, Q4 2025, six countries; demand-side model with trade association cross-validation
Qualitative Methodology
47 expert interviews, Q4 2025; applied to validate demand model assumptions, identify emerging dynamics, and assess competitive positioning
Report Format
PDF and XLSX data workbook (Word format preview document)
Publisher
Market Minds Advisory
Report Code
MMA-2026-CON-102
Published
September 2026
Contact
sales@marketmindsadvisory.com | www.marketmindsadvisory.com

Purchase the full Africa LED & OLED Displays and Lighting Products Market Report (2026 to 2036).

The full report delivers a complete quantitative and qualitative assessment of the Africa LED and OLED displays and lighting products market across all six product-and-technology segments and the seven regional linkages that supply and support continental demand. It includes detailed manufacturer profiles covering qualification certification capability, last-mile-distribution capacity, and technical positioning for the twenty entities profiled. Analysts provide scenario-adjusted forecasts through 2036 alongside currency-volatility sensitivity modeling tied to import-logistics disruption. Buyers receive access to underlying primary survey and expert interview data supporting all quantitative claims, along with a certification-adoption tracker benchmarked across qualification-cycle timelines for major distributor accounts.
Segment-level forecasts through 2036 across categories
Country-level demand, pricing, and CAGR breakdown tables
Twenty-entity competitive profiling with moat and risk analysis
Currency volatility and import-logistics risk mitigation pathways
Certification-adoption tracker across major distributor programs
Quarterly market update subscription option for ongoing monitoring

Built For The People Who Decide

From boardroom strategy to bench-side execution, this report is read cover-to-cover by leaders shaping the next decade of their industry, turning demand scenarios, market dynamics and valuation benchmarks into decisions.
CXOs/ Presidents/ VPs/ Managers
M&A and Corporate Development
Strategy Teams and R&D Heads
Procurement and Product Directors
Regulatory and Compliance Leaders
Investor Relations and Equity Analysts