Market Minds Advisory
Affective Computing Market

Affective Computing Market: Affective Computing Market: Sensing Modalities, Regulatory Divergence and Dataset Economics 2026 to 2036

Whether a machine can read an emotion from a face is still argued about by psychologists. Whether it can tell if a driver's eyes are closing is not, and that is where the money is.

Lead Analyst

Published

September 2026

Make Smarter Decisions with Customized Research Insights

Request a free sample report and evaluate market opportunities, growth trends, and competitive dynamics relevant to your business needs.

2025 MARKET VALUE$3.2BMarket Size 2025
2036 FORECAST VALUE$15.2BBase Case , 2026 to 2036
CAGR 2026 TO 203615.2 %Bull 16.4% / Bear 13.9%
INCREMENTAL OPPORTUNITY$11.5BNet 10- year value creation
EXPANSION MULTIPLE4.12x2036 value over 2026 base
Strategic Levers
M&A Pipeline
Regional Outlook
Country Rankings
Competitive Intelligence
Segmental Deep-dive
Call-Us : 91 93563 13602

Executive Snapshot and Market Trajectory.

The science underneath this market is contested and the commercial part is not. Reading emotion from a face agrees with trained human coders about 72% of the time on posed data and worse on real faces. Detecting a closing eyelid works reliably, and that is what customers buy.
The market reaches USD 3.69 billion in 2026 and USD 15.19 billion by 2036, a 4.12 times expansion at 15.2%. In-cabin driver and occupant monitoring systems grow at 22.8%, half again the market rate of 15.2%, because European and Chinese vehicle rules now require attention monitoring rather than merely encouraging it. East Asia holds 32% of revenue on vehicle production volume, and China grows fastest at 19.4%. Regulation is doing all of this.
Five suppliers hold 36% of product and licence revenue, concentrated by automotive qualification and by the annotated datasets a credible model requires. Smart Eye and Seeing Machines built automotive positions over more than a decade. Cerence and NICE arrived from speech. A long tail of research and marketing analytics vendors sells into applications the European AI Act has now made illegal in workplaces and schools.
Market Definition
This report covers systems that detect, classify and respond to human affective and attentional state: in-cabin driver and occupant monitoring, voice and speech affect analytics, physiological and biosensor affect sensing, facial expression analysis software, multimodal affect inference engines, and text and conversational sentiment analysis. It excludes general computer vision and speech recognition, biometric identification and authentication, clinical diagnostic devices, and the camera and microphone hardware these systems run on.
Base Year Value
$3.2B in 2025 (MMA Primary Research Dataset, September 2026)
Forecast Period
2026 to 2036, eleven discrete annual values
CAGR
15.2% base case. Bull 16.4%. Bear 13.9%.
Fastest Growth Segment
In-Cabin Driver and Occupant Monitoring Systems: 22.8% CAGR
Fastest Growth Country
China: 19.4% CAGR
Fastest Growth Region
South Asia and Pacific: 17.2% CAGR
Largest Region
East Asia: 32% of 2025 global value
Market Leaders
Smart Eye, Seeing Machines, Cerence, Xperi and NICE lead on affective computing product and licence revenue. Source: MMA Analysis.
Primary Survey
n=3,800 procurement and R&D decision-makers, Q4 2025, six countries
Methodology
Demand-side build-up, cross-validated against public data, 47 expert interviews

Affective Computing Market Forecast Scenarios

affective-computing-market-size-forecast-scenario-1789985047115
Between 2020 and 2025 the category compounded at 13.8% and almost none of it came from where the industry had promised. Emotion analytics for advertising testing and hiring stayed small and drew increasing scientific criticism. What grew instead was driver monitoring, because the European General Safety Regulation made attention warning a type-approval requirement rather than a feature anybody had to sell.
The base case holds 15.2% on three mechanisms. Vehicle regulation keeps widening: European rules require attention monitoring, Chinese standards are following, and the content is every new vehicle rather than a premium option. Contact centre voice analytics keeps growing because measuring agent and customer state at scale is useful and depends on no contested emotion claim. And physiological sensing in wearables is moving toward stress and recovery inference, at consumer volumes nothing else here approaches.
The bull case at 16.4% assumes occupant monitoring beyond the driver becomes a regulatory requirement, since child presence detection is already being written into rules. The bear case at 13.9% is regulatory contraction: the European AI Act already prohibits emotion inference in workplaces and education, and if regulators extend that reasoning to advertising and retail, part of this market disappears rather than shrinks.

What Machines Can Actually Measure

There is a real scientific argument underneath this market and it has never been settled. A substantial body of psychology holds that facial expressions do not map reliably onto internal emotional states across people and cultures, and the measured agreement between commercial systems and trained human coders sits around 72% on posed expressions and falls further on spontaneous ones. Vendors rarely publish the second number.
TOP FIVE CONCENTRATION36%Concentrated by automotive qualification and dataset scale requirements
INFERENCE ACCURACY CEILING72%Agreement with trained human coders on posed expression
AUTOMOTIVE DESIGN CYCLE36 monthsSpecification to production on vehicle occupant monitoring programmes
TRAINING DATASET SCALE14 millionAnnotated recordings needed for a credible commercial model
PER VEHICLE LICENCE COSTUSD 6Software content charged on each equipped production vehicle
EDGE INFERENCE LATENCY40 millisecondsCapture to classification on embedded automotive processing hardware
The commercial market has quietly routed around that problem. What a driver monitoring system measures is eyelid closure, gaze direction, head pose and blink rate, all of which are physical observations rather than inferences about feeling. Drowsiness and distraction are behavioural states with objective correlates. That distinction is why the automotive segment compounds at 22.8% while the emotion analytics businesses that named this field have not grown much at all.
Regulation has now drawn the same line in law. The European AI Act prohibits emotion inference in workplaces and educational settings outright, while European vehicle rules require attention monitoring as a condition of type approval. One instrument bans the contested application and another mandates the measurable one, in the same jurisdiction, within the same three years. Very few markets get that clear a signal.
"The companies that named this field are not the ones making money in it. The revenue went to eyelid closure and gaze direction, which nobody would have called affective computing ten years ago and which is the only part a regulator will approve."
Director, Human Machine Interaction Systems Practice · MMA Technology Practice · September 2026

Market Trends

Vehicle Rules Turned Attention Monitoring Into Mandatory Content

The European General Safety Regulation made driver drowsiness and attention warning a type-approval condition rather than a feature a manufacturer could choose to fit, and Chinese standards are moving the same way on a shorter timescale. That converts an optional premium system into content on every new vehicle in two of the three largest production regions. The addressable volume changes by an order of magnitude when the requirement moves from luxury trim to type approval. In-cabin monitoring compounds at 22.8% against 15.2% for the market, and none of that depends on emotion inference at all.
Market Impact: Voice analytics compounds at 18.6%
Regulators Are Prohibiting The Contested Applications Outright

The European AI Act prohibits emotion inference in workplace and educational settings entirely, rather than regulating how it may be used, and several American states have moved against emotion-based hiring assessment. The reasoning is scientific as much as it is about privacy: regulators looked at the evidence base and concluded the claims were not supported well enough to permit consequential decisions. That closes segments vendors had been forecasting for a decade. It also legitimises the measurable applications by contrast, which is a strange kind of favour to the automotive suppliers.
Market Impact: Reaches over 300 million devices

Market Opportunities and Growth Drivers

Contact Centres Measure State Without Claiming Emotion

Voice affect analytics in a contact centre does not need to know what an agent feels. It needs to identify calls that are going badly, agents who are struggling, and customers about to escalate, all of which correlate with measurable acoustic properties like pitch variance, speech rate and interruption frequency. Those signals are useful without any claim about internal states, which is why this segment compounds at 18.6% while facial emotion analytics stalls. Regulators have raised far fewer objections to it, and the customers who buy it can point at handled outcomes.
Market Impact: Accuracy tops out near 72%

Wearables Push Physiological Sensing To Consumer Volumes

Heart rate variability, electrodermal activity and skin temperature all correlate with arousal and stress in ways that are measurable rather than interpretive, and consumer wearables now carry the sensors to capture them continuously. Every major watch and ring vendor has shipped stress or recovery scoring, which puts affective inference in front of hundreds of millions of people without ever using the word. The clinical validity of those scores varies enormously and the commercial appetite does not. This is the only part of the market that reaches genuine consumer scale. Nobody regulates it closely yet.
Market Impact: Requires 14 million annotated recordings

Market Restraints and Challenges

The Underlying Science Remains Genuinely Contested

A large body of psychological research holds that facial expressions do not map reliably onto internal emotional states across individuals and cultures, and commercial systems agree with trained human coders only about 72% of the time on posed material. The root cause is that the mapping being claimed may simply not exist in the form the products assume. Commercially this makes every consequential deployment vulnerable to challenge and keeps sophisticated buyers away. Mitigation runs through reframing the product around measurable behaviour rather than inferred feeling, which is exactly what the automotive suppliers did.
Market Impact: Content on 100% of vehicles

Demographic Performance Gaps Invite Regulatory Challenge

Affect classification accuracy varies measurably across skin tone, age, gender presentation and cultural background, because training datasets were assembled from whoever was convenient rather than from a representative population. The root cause is dataset composition, and fixing it requires collecting annotated recordings at a scale that costs more than most vendors have raised in total. Commercially this exposes any deployment affecting individuals to discrimination claims and makes procurement at large organisations slow and defensive. Mitigation runs through dataset expansion and published per-group performance, which very few vendors have been willing to disclose.
Market Impact: Prohibited across 27 member states
3 additional market trends, 4 additional growth drivers, and 2 additional restraints and challenges are covered in the full report. Contact sales@marketmindsadvisory.com to access the complete intelligence.

Segment CAGR and Growth Architecture

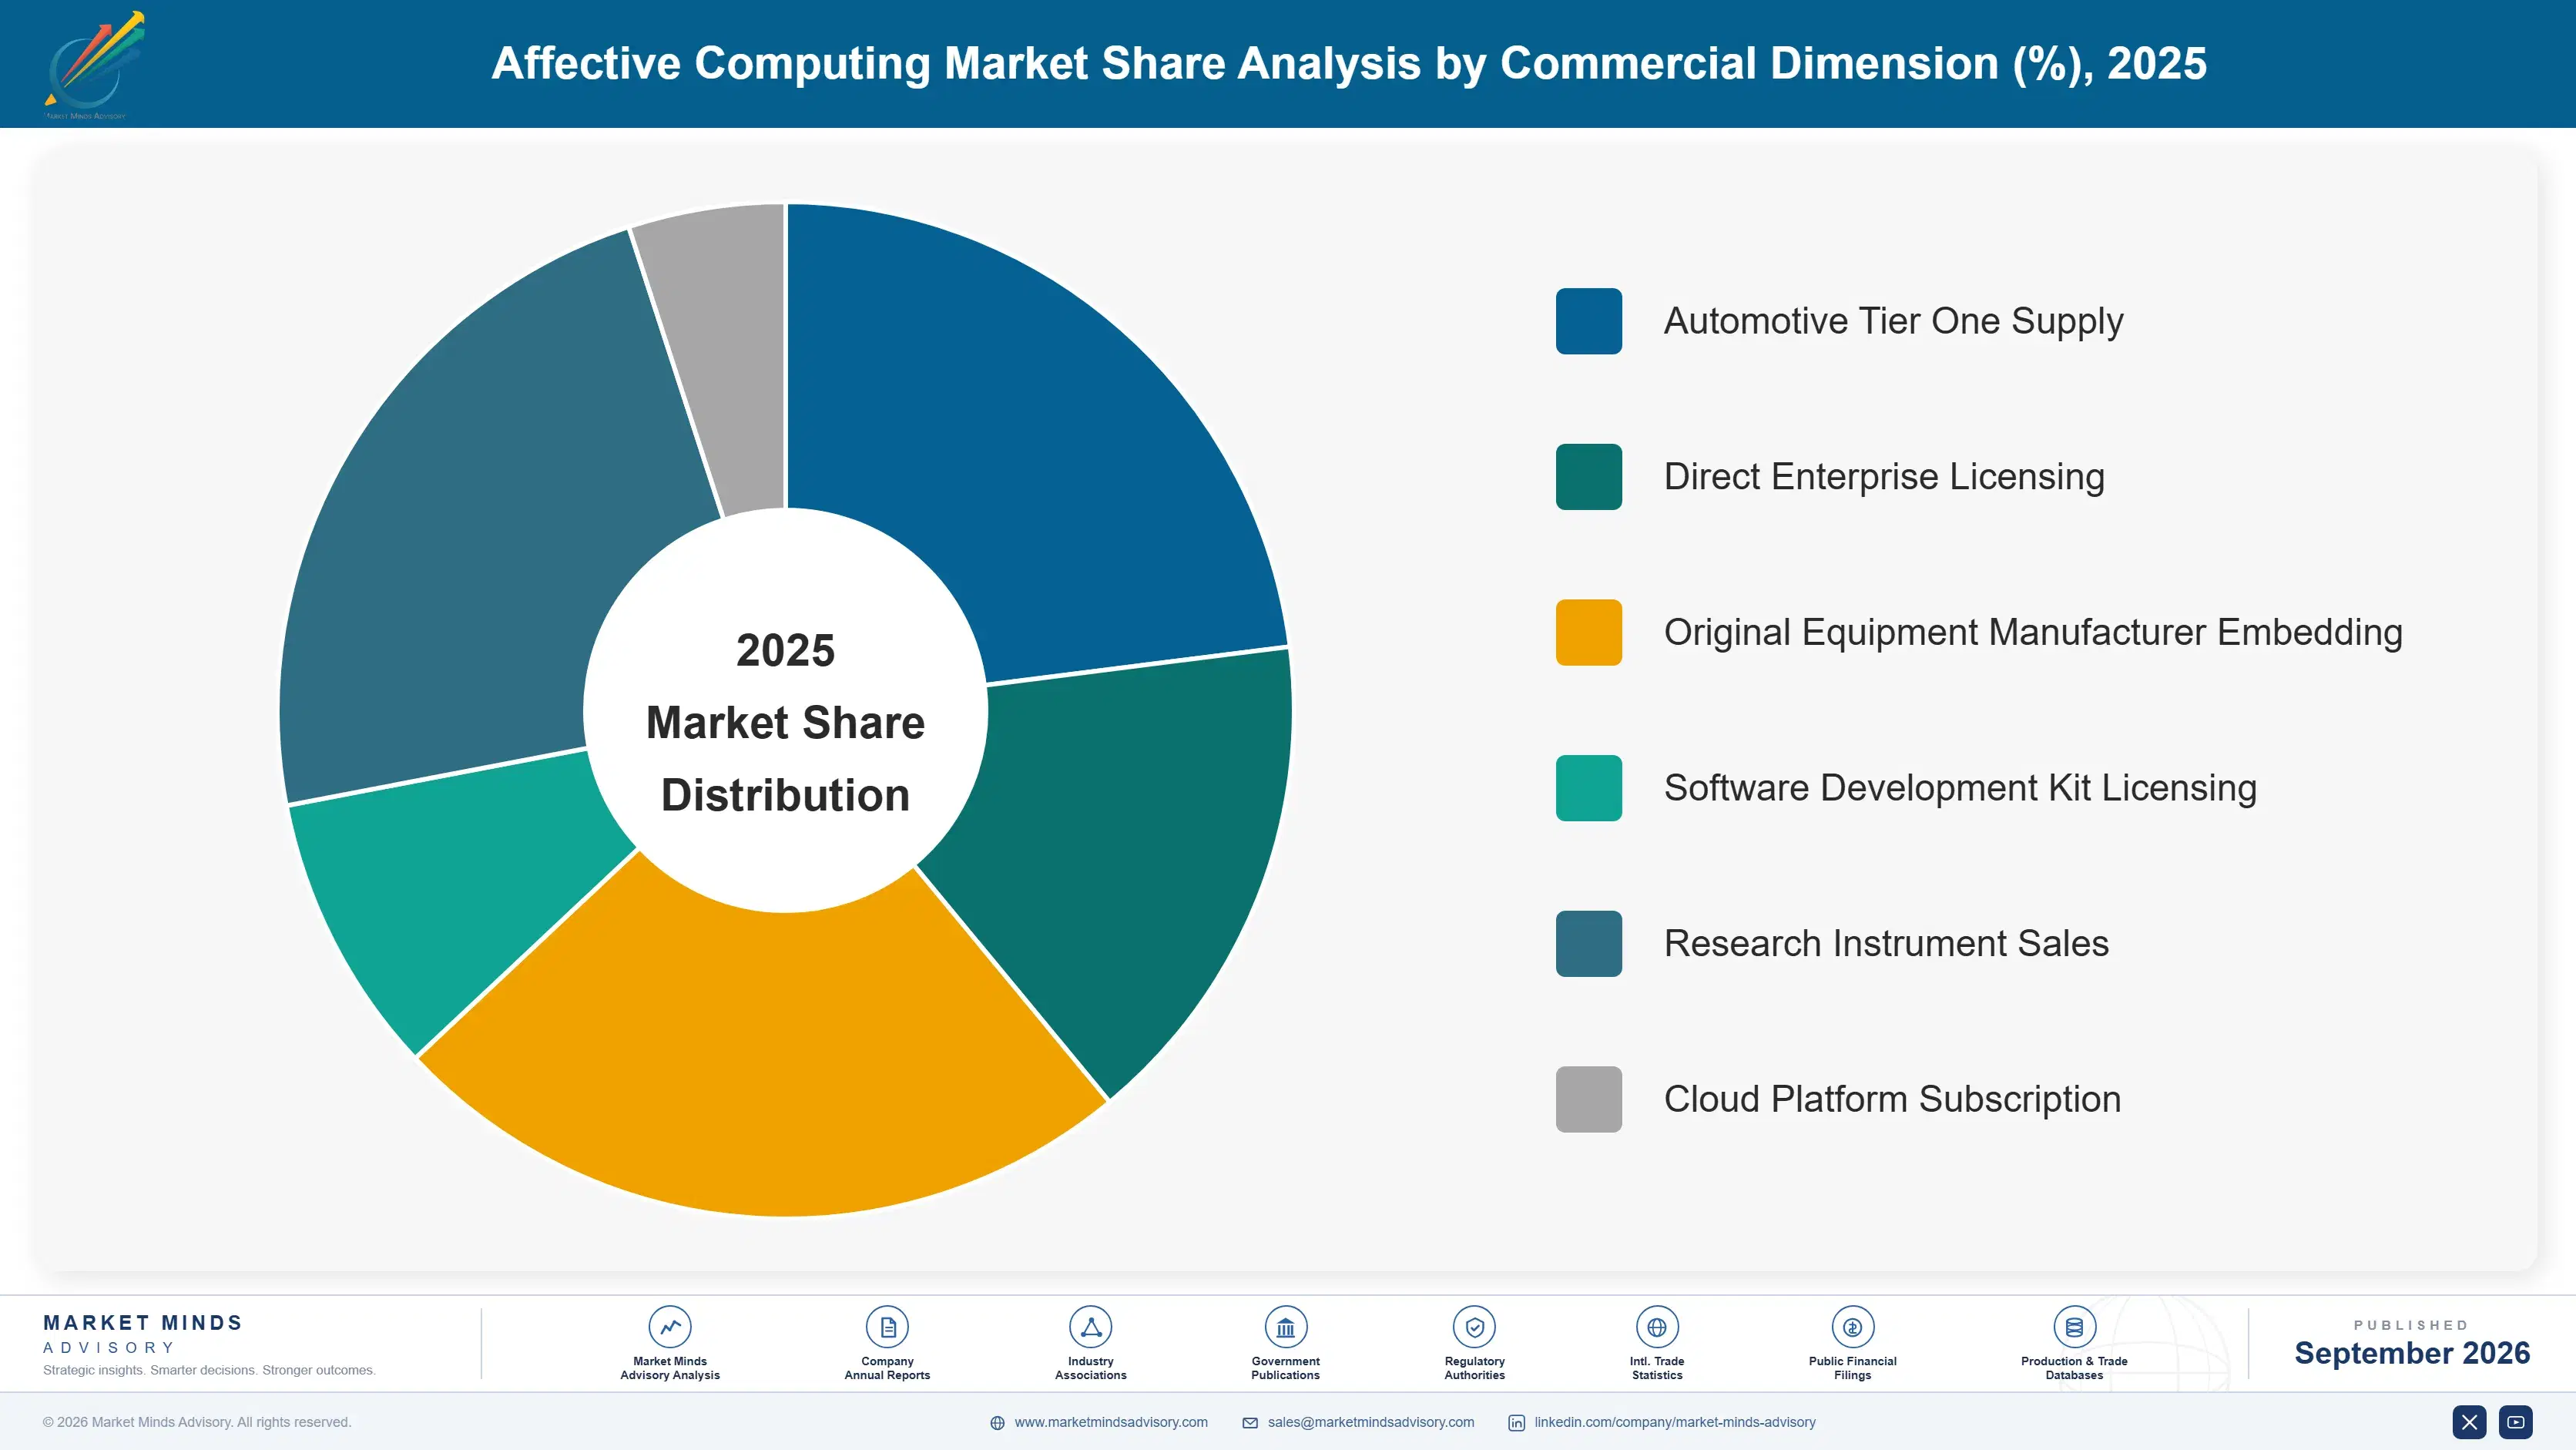
Segmentation follows sensing modality, because what a system measures determines its accuracy, its regulatory standing and which applications will buy it. Six modalities cover the market: in-cabin driver and occupant monitoring, voice and speech affect analytics, multimodal affect inference engines, physiological and biosensor sensing, text and conversational sentiment analysis, and facial expression analysis software. Application and deployment sit separately.
affective-computing-market-market-share-analysis-1789985047680

In-Cabin Driver and Occupant Monitoring Systems

In-cabin monitoring grows at 22.8%, half again the market rate of 15.2%, and regulation rather than technology produced that number. The European General Safety Regulation made attention warning a type-approval condition and Chinese standards are following, which converts a premium option into content fitted to every new vehicle. What the system actually measures is eyelid closure, gaze direction, head pose and blink rate, none of which requires any claim about emotion, and that is precisely why it survives regulatory scrutiny the rest of this market does not. Design cycles run 36 months and per-vehicle software content is a few dollars, so the business is volume rather than price. That suits some suppliers far better than others.
CAGR 22.8%

Voice and Speech Affect Analytics

Voice affect analytics grows at 18.6% and succeeds by not claiming very much. A contact centre application does not need to know what anybody feels; it needs to flag calls going badly, agents under strain and customers about to escalate, and those correlate with acoustic properties like pitch variance, speech rate and interruption frequency that a microphone measures directly. The claim is behavioural rather than emotional, which keeps regulators comfortable and gives buyers an outcome they can audit against handled call data. Cerence and NICE both built substantial positions here from speech processing rather than from affect research, and that origin shows in how the products are sold. Modesty turns out to be commercially useful.
CAGR 18.6%
Full segment breakdown across 6 segments available in the complete report.

Regional Architecture and Country Demand Map

East Asia leads at 32%, above the standard band, because in-cabin monitoring is the largest application by volume and most of the world's vehicles are built there. Western Europe writes the rules that everybody else follows, both the mandates and the prohibitions. That division shapes this section.

East Asia

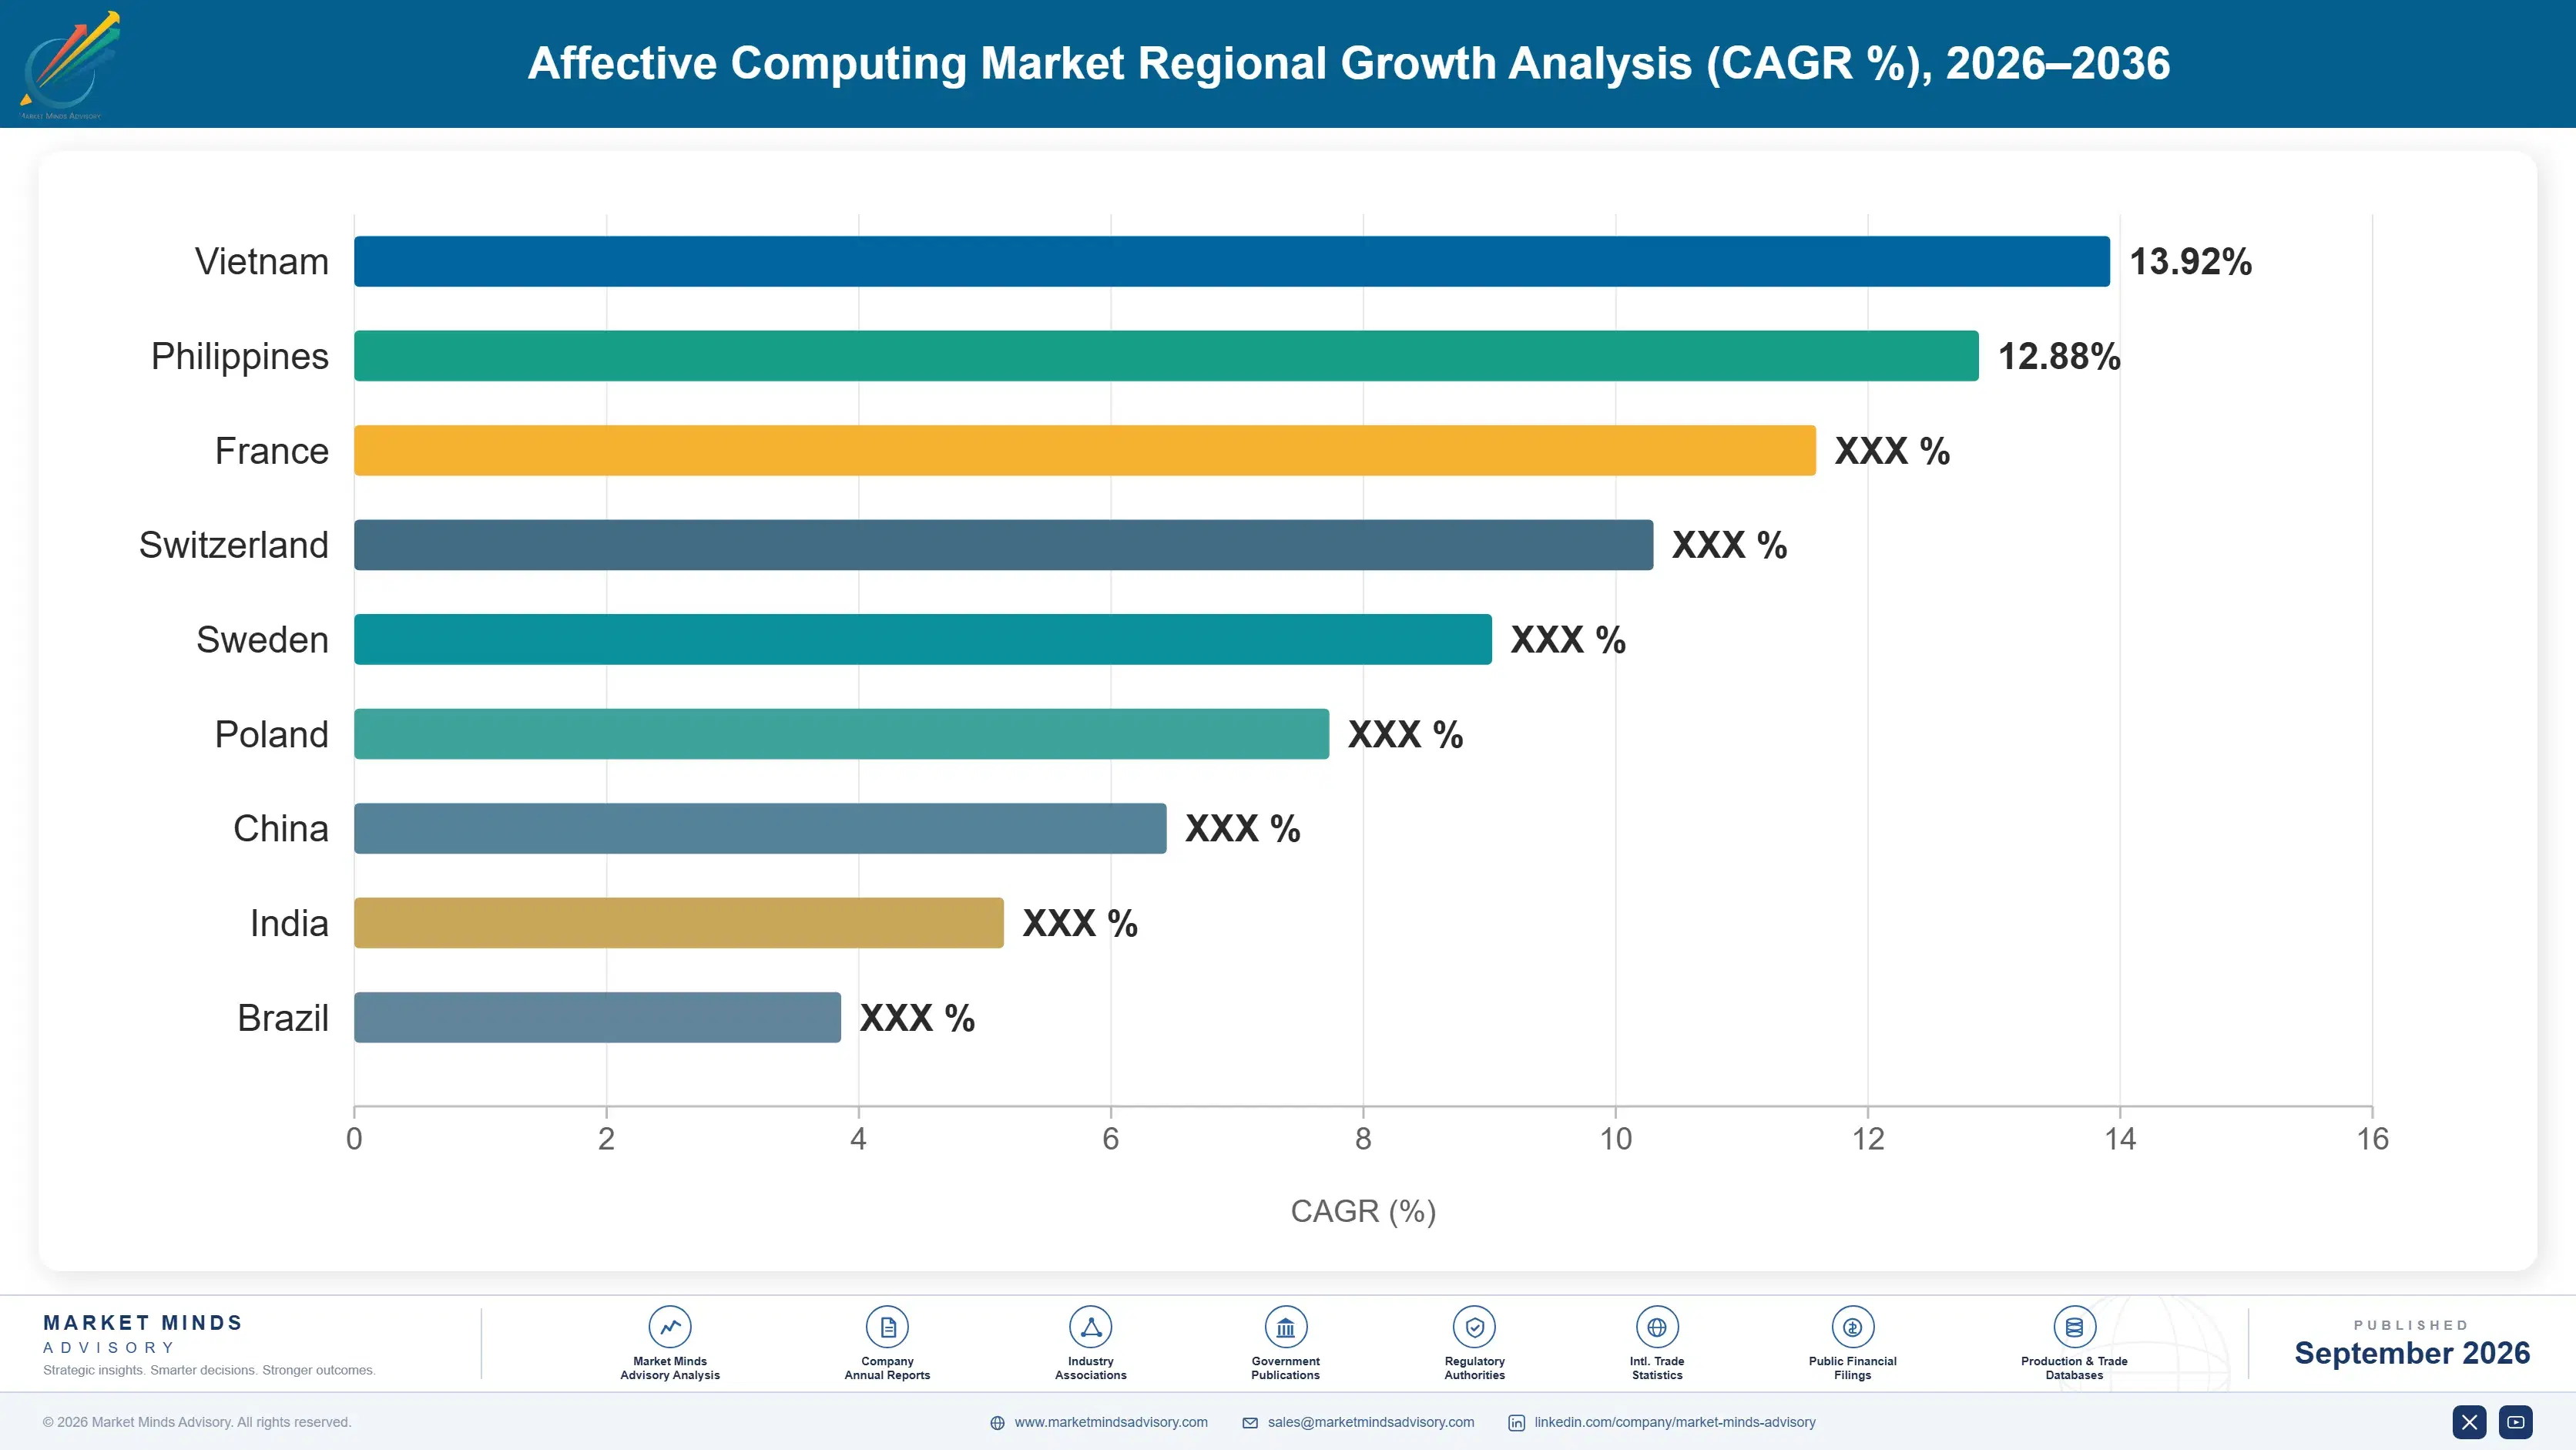
East Asia holds 32% of revenue, above the 30% band ceiling, because in-cabin monitoring is the largest application in this market by volume and Chinese, Japanese and Korean plants build most of the world's vehicles. Chinese national standards are moving toward attention monitoring requirements on a shorter timescale than the European equivalent took, and domestic suppliers and several Chinese vision firms are taking that content. China grows at 19.4%, faster than any other country here. Regulatory constraints on emotion inference are also considerably lighter than in Europe, which keeps retail and public space applications commercially alive here. That divergence is widening rather than closing, and it changes what gets built.
Share: 32% | CAGR: 16.4% (2026 to 2036)

North America

Contact centre analytics rather than automotive accounts for most of North America's 24%. American enterprises deploy voice affect analytics across service operations at a scale nobody else matches, and the sale is made on handled call outcomes rather than on any emotional claim. Automotive monitoring is fitted here to satisfy safety rating programmes rather than a type-approval requirement, which makes adoption commercial rather than mandatory. Several states have moved against emotion-based hiring assessment, which closed an application vendors had promoted heavily. Growth at 14.6% sits close to the global rate. The regulatory picture here is a patchwork rather than a single instrument, and it will stay that way for years.
Share: 24% | CAGR: 14.6% (2026 to 2036)
Regional intelligence for 5 additional markets available in the complete report: Western Europe, South Asia and Pacific, Latin America, Middle East and Africa, Eastern Europe. Contact sales@marketmindsadvisory.com.
affective-computing-market-country-cagr-analysis-1789985048210

Where This Market Actually Pays

The applications that named this field are the ones regulators are closing, and the ones nobody thought to call affective computing are the ones generating revenue. What separates a supplier that grows from one that does not is whether it sells a measurable behaviour or an inferred feeling. The four levers below follow that line.

Sell Measurable Behaviour, Not Inferred Feeling

Emotion inference from a face agrees with trained human coders about 72% of the time on posed material and worse on spontaneous expression, which is a number no sophisticated buyer will build a consequential decision on. Eyelid closure, gaze direction and blink rate are physical observations with no interpretive step at all. Automotive suppliers rebuilt their claims around exactly that distinction and their segment now compounds at 22.8% against 15.2% for the market. Vendors still selling emotion classification are defending a scientific position that regulators have started ruling against outright.
Market Impact: Accuracy at just 72% will not carry decisions

Win Automotive Programmes Before The Design Freeze

In-cabin monitoring compounds at 22.8% and design cycles run 36 months from specification to production, so a supplier arriving after a platform is frozen has missed a vehicle generation rather than a quarter. The content is now type-approval mandated in Europe and moving that way in China, which means volumes measured in millions of units at a few dollars each. That is a volume business with automotive qualification requirements, warranty exposure and price pressure that software companies consistently underestimate. Winning it requires being present three years before anybody signs a purchase order.
Market Impact: Design cycles run a full 36 months to production

Publish Per-Group Accuracy Before Somebody Else Does

Classification accuracy varies measurably across skin tone, age and cultural background because training datasets were assembled from whoever was available rather than from a representative population, and building a credible corpus means collecting something like 14 million annotated recordings. Almost no vendor publishes performance by demographic group. The first supplier to do so honestly gains a procurement advantage at large organisations that have become slow and defensive about exactly this exposure, and loses nothing that a competitor could not eventually measure independently. The disclosure is uncomfortable and the alternative is a discrimination claim.
Market Impact: A credible corpus needs 14 million annotated recordings

Follow Physiological Sensing Into Consumer Wearables

Heart rate variability, electrodermal activity and skin temperature correlate with arousal in ways that are measured rather than interpreted, and consumer wearables now carry those sensors on over 300 million devices. Every major watch and ring vendor ships stress or recovery scoring without ever using the phrase affective computing. That is the only route in this market to genuine consumer volume, and the regulatory scrutiny applied to it has so far been almost nonexistent. The commercial requirement is a licensing relationship with a device manufacturer rather than a direct product.
Market Impact: Those sensors already ship on 300 million devices

Who Controls the Margin Pool

Five suppliers hold 36% of product and licence revenue, concentrated by automotive qualification and by the dataset scale a credible model demands. Smart Eye leads after a decade of automotive programme wins and an acquisition that consolidated the field. Seeing Machines competes directly on the same programmes. Cerence and NICE hold voice positions built from speech processing. Xperi comes through in-cabin systems integration. All participants are assessed on affective computing product and licence revenue.
Competition splits along the same line the science does. Automotive suppliers compete on qualification, latency on embedded hardware and per-unit cost, where a few dollars of software content decides programmes worth millions of units. Voice and text vendors compete on integration with contact centre platforms. Neither group competes with the emotion analytics firms that named this category and now face prohibition in their largest applications.

Rankings shift with regulation more than with technology. Chinese domestic suppliers are taking in-cabin content in the largest vehicle market as standards there tighten, and Western firms priced for European premium programmes are struggling on cost. The other pressure is consolidation: the automotive tier one suppliers are acquiring rather than partnering, which will absorb several independents inside the current design cycle.
affective-computing-market-company-positioning-matrix-1789985048737

Competitive Moat and Risk Dimensions

SMART EYE

Moat: Automotive Programme Incumbency

Smart Eye holds design wins across a large number of vehicle programmes accumulated over more than a decade, and each one is effectively fixed for that platform's production life because requalifying costs more than the software content ever will. An acquisition consolidated much of the remaining independent capability. A competitor cannot shorten a 36 month design cycle by any amount.
SMART EYE

Risk: Chinese Cost Competition

Chinese vehicle production is the largest volume in this market and domestic suppliers are taking that content at price points built for a different cost base entirely. A company priced around European premium programmes cannot easily answer that without damaging its existing contracts. The largest single growth opportunity in the category is also the one hardest for it to win.
CERENCE

Moat: In-Vehicle Voice Incumbency

Cerence already runs the voice interaction stack in a very large share of shipping vehicles, so adding affect and driver state inference requires no new hardware, supplier qualification or processing budget. A specialist selling affect analytics separately is asking a manufacturer to add a supplier for a marginal capability. Incumbency decides most of these conversations.
CERENCE

Risk: Vision Capability Gap

The regulatory requirement driving this market is camera-based attention monitoring rather than voice, and eyelid closure and gaze direction are not problems a speech company solves by extension. Vision specialists hold the design wins on the mandated function and can add voice more easily than a voice company adds vision. The mandate went to the modality it does not lead.

Players Tracked

Prominent Players

Smart Eye
Seeing Machines
Cerence
Xperi
NICE

Other Key Players

Uniphore
Verint
Behavioral Signals
audEERING
Realeyes
iMotions
Noldus Information Technology
Emotiv
OMRON
Valeo
Aptiv
Robert Bosch
Continental
Cipia Vision
Eyeris

Recent Developments

MARCH 2025

Smart Eye Wins Additional Occupant Monitoring Vehicle Programmes

Smart Eye announced additional design wins for interior sensing across several vehicle programmes, competitive supply awards rather than acquisitions or partnerships. The wins reflect European type-approval requirements moving from driver attention warning toward broader occupant sensing, including child presence detection, which widens the content on each equipped vehicle.
Signal: The regulatory requirement is widening from the driver to the whole cabin, which multiplies the content per vehicle.
OCTOBER 2024

Cerence Extends Driver State Inference Across Voice Platform

Cerence extended driver state and attention inference across its in-vehicle voice platform, an organic product development rather than an acquisition or partnership. The work uses processing hardware already present for speech interaction, which avoids a separate supplier qualification and the additional silicon budget a standalone system would require.
Signal: Incumbency on existing vehicle hardware is a stronger position than any accuracy advantage a specialist holds.
MAY 2025

Seeing Machines Expands Fleet Monitoring Business Beyond Automotive

Seeing Machines expanded its commercial fleet and aviation monitoring business alongside its automotive programmes, an organic expansion rather than a transaction. Fleet operators buy fatigue monitoring on a measurable insurance return rather than a regulatory obligation, which gives the company a demand source that does not depend on type-approval timing.
Signal: An insurance return sells this technology where no regulator has yet required anything of anybody at all.

What These Systems Cost To Build

Annotated training data accounts for roughly 33% of development cost in this market, collected and labelled by specialist annotation operations concentrated in India, the Philippines and Eastern Europe. Machine learning engineering headcount adds about 28%, drawn from a narrow talent pool. Automotive qualification, validation and functional safety documentation carry around 19%, and embedded optimisation work most of the balance.
Smart Eye Annual Report 2024 records data collection and annotation alongside research headcount as the dominant cost variables in its automotive interior sensing business. Cerence Annual Report 2024 notes comparable pressure on machine learning engineering costs. Demand for annotation capacity rose sharply through 2023 and 2024 as every technology sector competed for the same operations, and vendors collecting demographically representative datasets paid a premium for exactly the recordings hardest to source at scale.

The competitive disadvantage mechanism is dataset scale rather than any input price. A credible commercial model needs something like 14 million annotated recordings, and that corpus amortises across every subsequent programme a supplier wins. An incumbent with a decade of collection behind it spreads that cost across millions of shipped units, while an entrant carries the whole burden against no revenue. None of this favours new entry.
affective-computing-market-cost-volatility-analysis-1789985048932

Reuse Annotated Corpora Across Every Product Line

Annotated training data runs about 33% of development cost and is the single largest one-time investment any vendor in this field makes. A corpus collected for automotive interior sensing also serves fleet, aviation and research applications with modest additional labelling. Vendors who scope collection to a single programme pay that cost repeatedly for no additional coverage.

Contract Annotation Capacity Ahead Of Collection Campaigns

Annotation capacity became genuinely scarce through 2023 and 2024 as every technology sector competed for the same operations in India, the Philippines and Eastern Europe. Contracting capacity before a collection campaign begins removes both the price exposure and the scheduling risk that delayed several vendors' model releases. The commitment is modest against a cost line running a third of development.

Amortise Functional Safety Documentation Across Vehicle Platforms

Automotive qualification, validation and functional safety documentation carry around 19% of cost, and suppliers who scoped it narrowly repeat most of it per programme. Building the documentation set to cover a platform family rather than a single vehicle spreads it across far more shipped units. The constraint is that manufacturers specify differently, and considerably less than they claim.

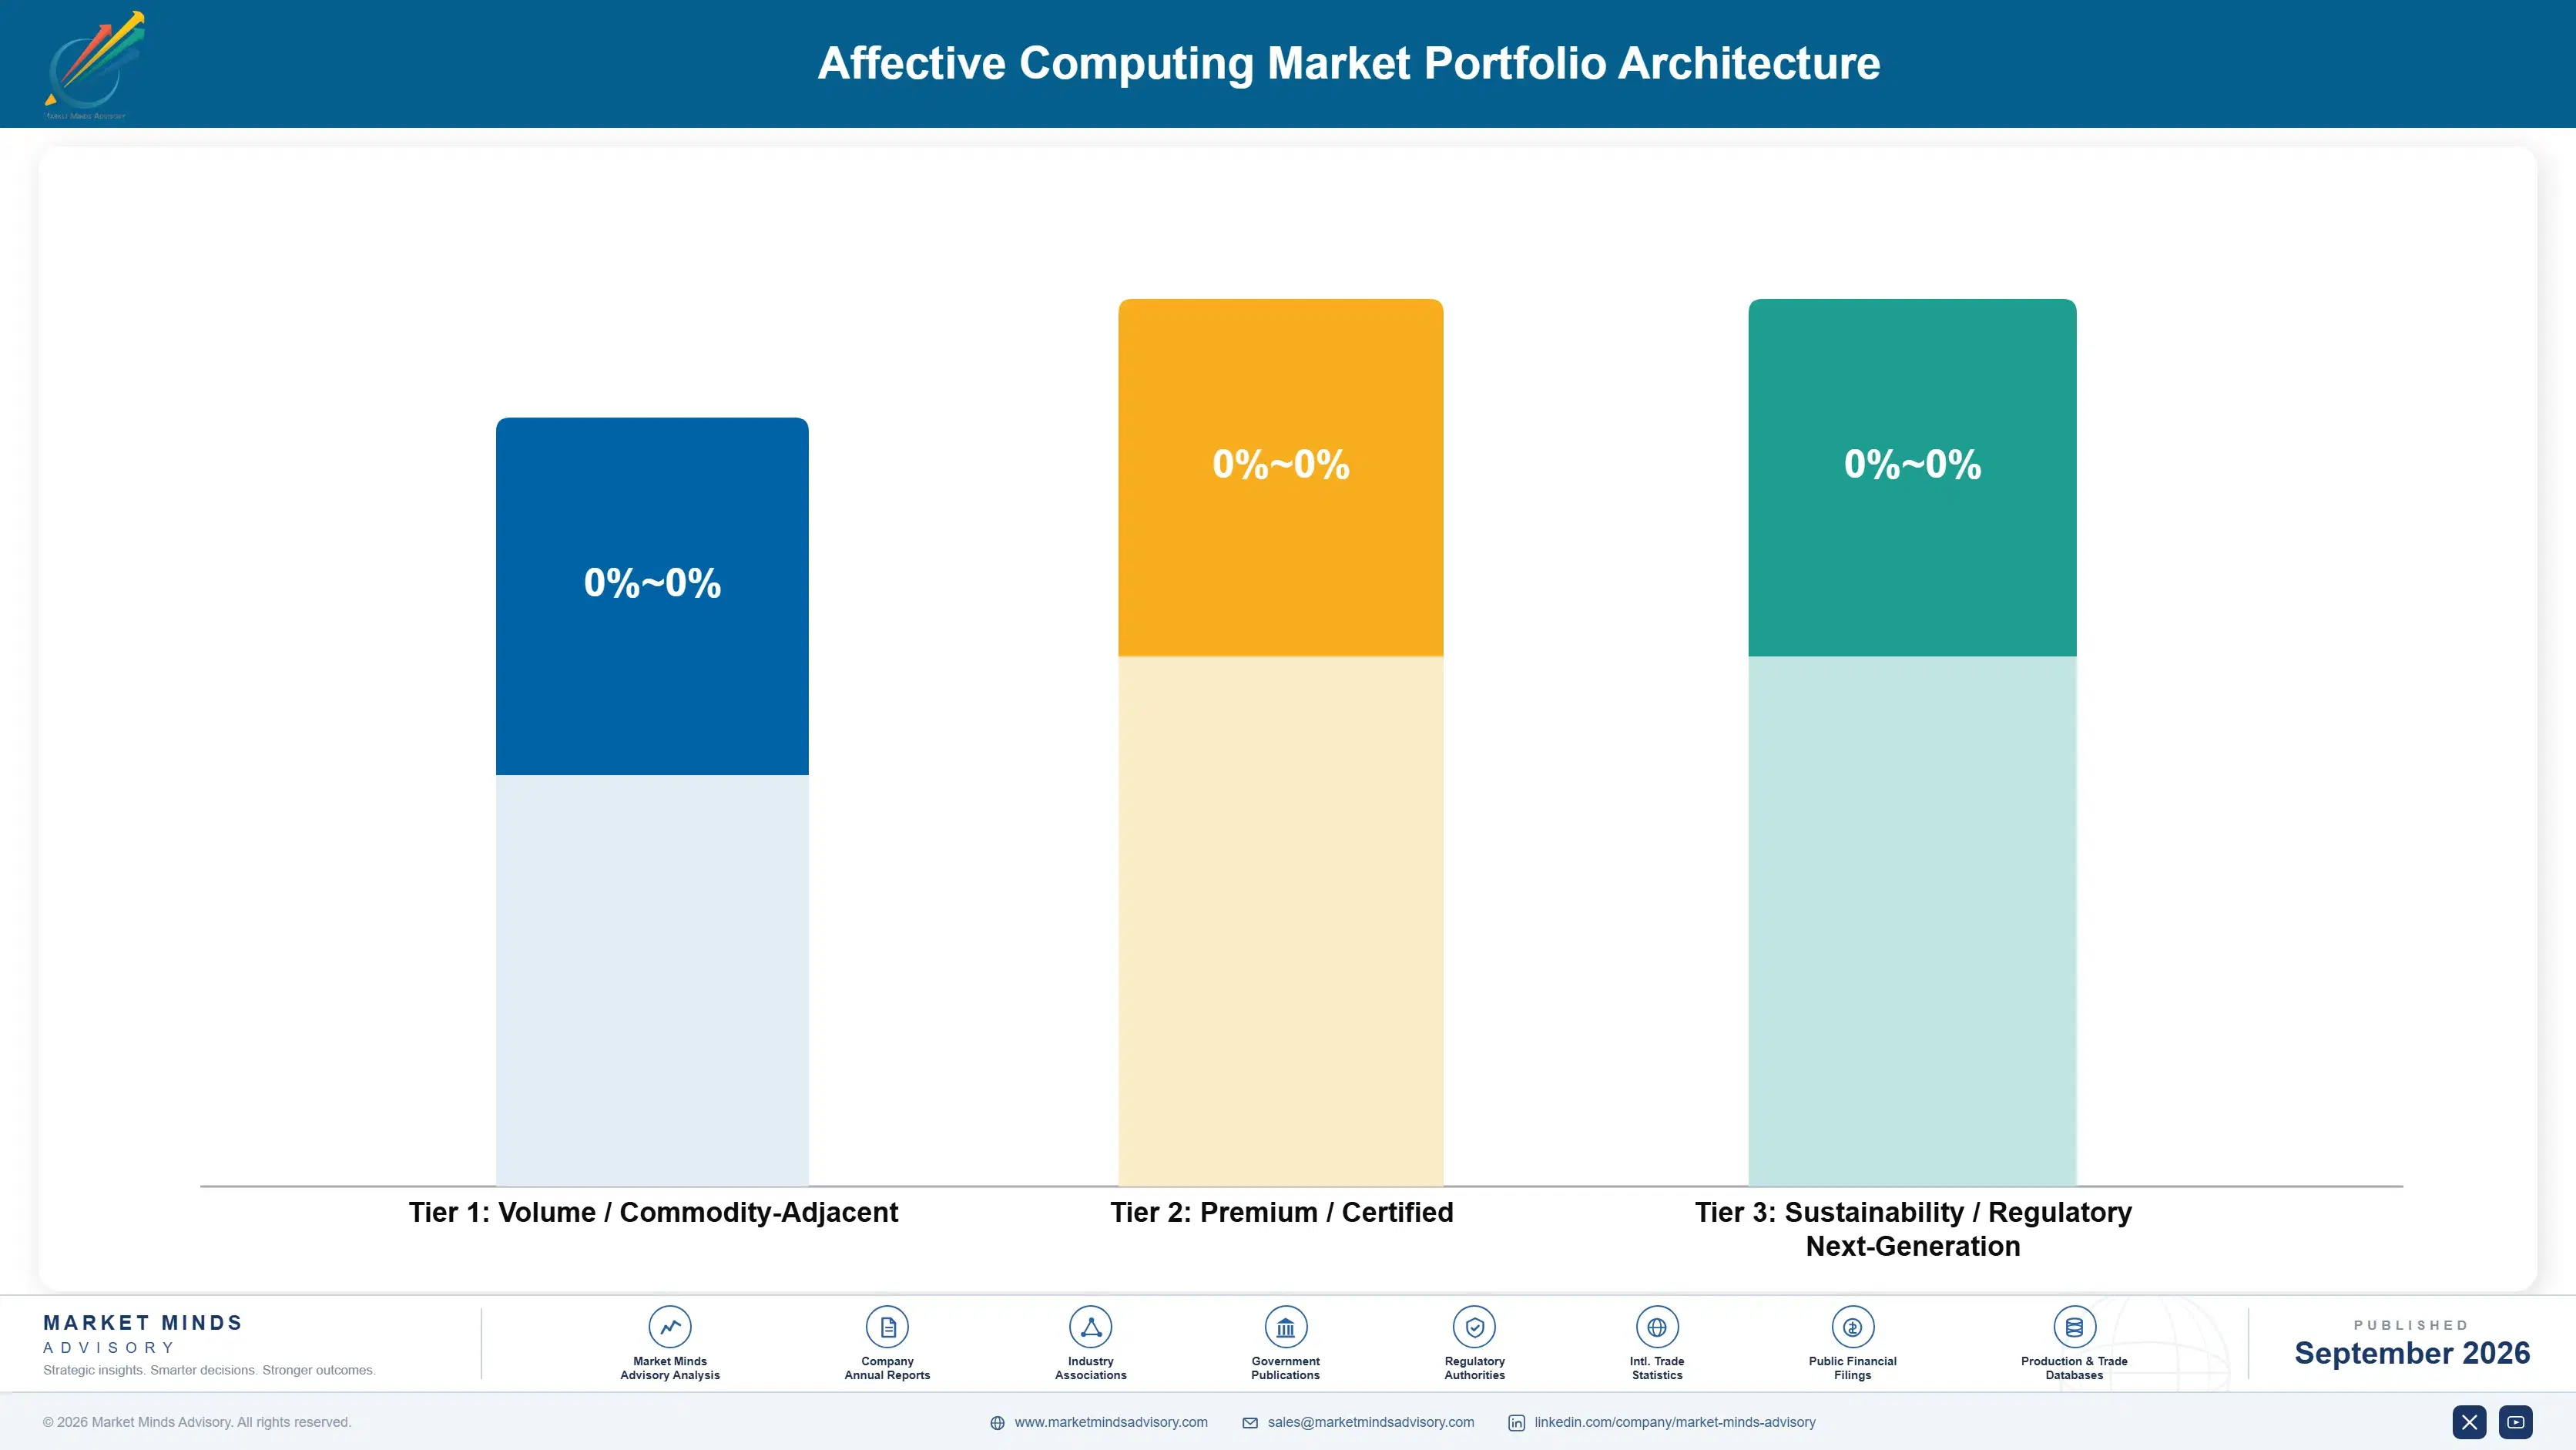
Portfolio Architecture for Margin Defence

Margin architecture separates on whether the claim survives scrutiny. Facial expression analysis and text sentiment earn least, competed by many suppliers against a scientific position that regulators have started rejecting. Physiological sensing and multimodal engines sit in the middle. In-cabin monitoring and voice affect analytics earn most, not because they are technically harder but because each measures something observable and each sits inside a regulated or contractually mandated requirement.
The volume versus premium tension in automotive runs the wrong way from most software businesses. Per-vehicle software content is a few dollars against programmes measured in millions of units, so margin depends entirely on how widely the development and qualification cost spreads. A supplier holding many programmes earns comfortably and one holding a few does not, on identical technology. Scale is the whole business model here.

High-value pools sit in in-cabin monitoring and in voice affect analytics, and neither is where the founding companies of this field concentrated. In-cabin rewards automotive incumbency and dataset scale. Voice rewards contact centre platform integration. Both reward not claiming to read emotions, which is an uncomfortable conclusion for an industry named after doing exactly that.

Volume / Commodity-Adjacent

Facial expression analysis software and text sentiment analysis, competed by many suppliers against a contested scientific claim regulators are moving against. The eight point spread separates vendors with existing dataset scale from those still building a corpus.
Gross Margin: 38% to 46%

Premium / Certified

Physiological and biosensor affect sensing plus multimodal inference engines, sold on measured signals with modest interpretive claims attached. The ten point spread tracks whether a vendor licenses into device volume or sells directly at research scale.
Gross Margin: 52% to 62%

Sustainability / Regulatory / Next-Generation

In-cabin driver and occupant monitoring plus voice affect analytics, each measuring observable behaviour inside a mandated or contractually required deployment. The twelve point spread reflects how widely each supplier amortised its dataset and qualification investment across programmes.
Gross Margin: 64% to 76%
affective-computing-market-portfolio-architecture-1789985049442

High-value Sub-segments and Strategic Watch-out

In-Cabin Driver And Occupant Monitoring

Grows at 22.8% because European type approval mandates attention warning and Chinese standards are following, converting a premium option into universal content. The twelve point spread reflects how many programmes each supplier amortises development across. Design cycles run 36 months, so arriving late means missing a generation.
Gross Margin: 64% to 76%

Voice And Speech Affect Analytics

Grows at 18.6% by measuring acoustic properties that correlate with escalation risk rather than claiming to read emotions at all. The twelve point spread reflects contact centre platform integration depth. Regulators have raised far fewer objections to this modality than to facial analysis so far.
Gross Margin: 64% to 76%

Physiological And Biosensor Affect Sensing

Grows at 14.2% and reaches genuine consumer scale through wearables already carrying these sensors on over 300 million devices. The ten point spread tracks licensing volume rather than technical capability. Clinical validity of the resulting scores varies enormously and commercial appetite does not at all.
Gross Margin: 52% to 62%

Facial Expression Analysis Software

Grows at 9.6%, slowest of the six modalities, because the European AI Act prohibits its largest addressable applications and the underlying accuracy tops out near 72%. The eight point spread reflects dataset scale. Several of the vendors that named this whole field sit entirely inside this segment.
Gross Margin: 38% to 46%

How Design Wins Actually Work

The annuity is the vehicle programme. A supplier whose software is qualified onto a platform ships on every unit built for that platform's production life, typically seven years and frequently longer, because requalifying costs more than the few dollars of content ever will. Revenue therefore reflects design decisions taken three years ago, and the 36 month cycle means today's engineering effort produces income well into the next decade.
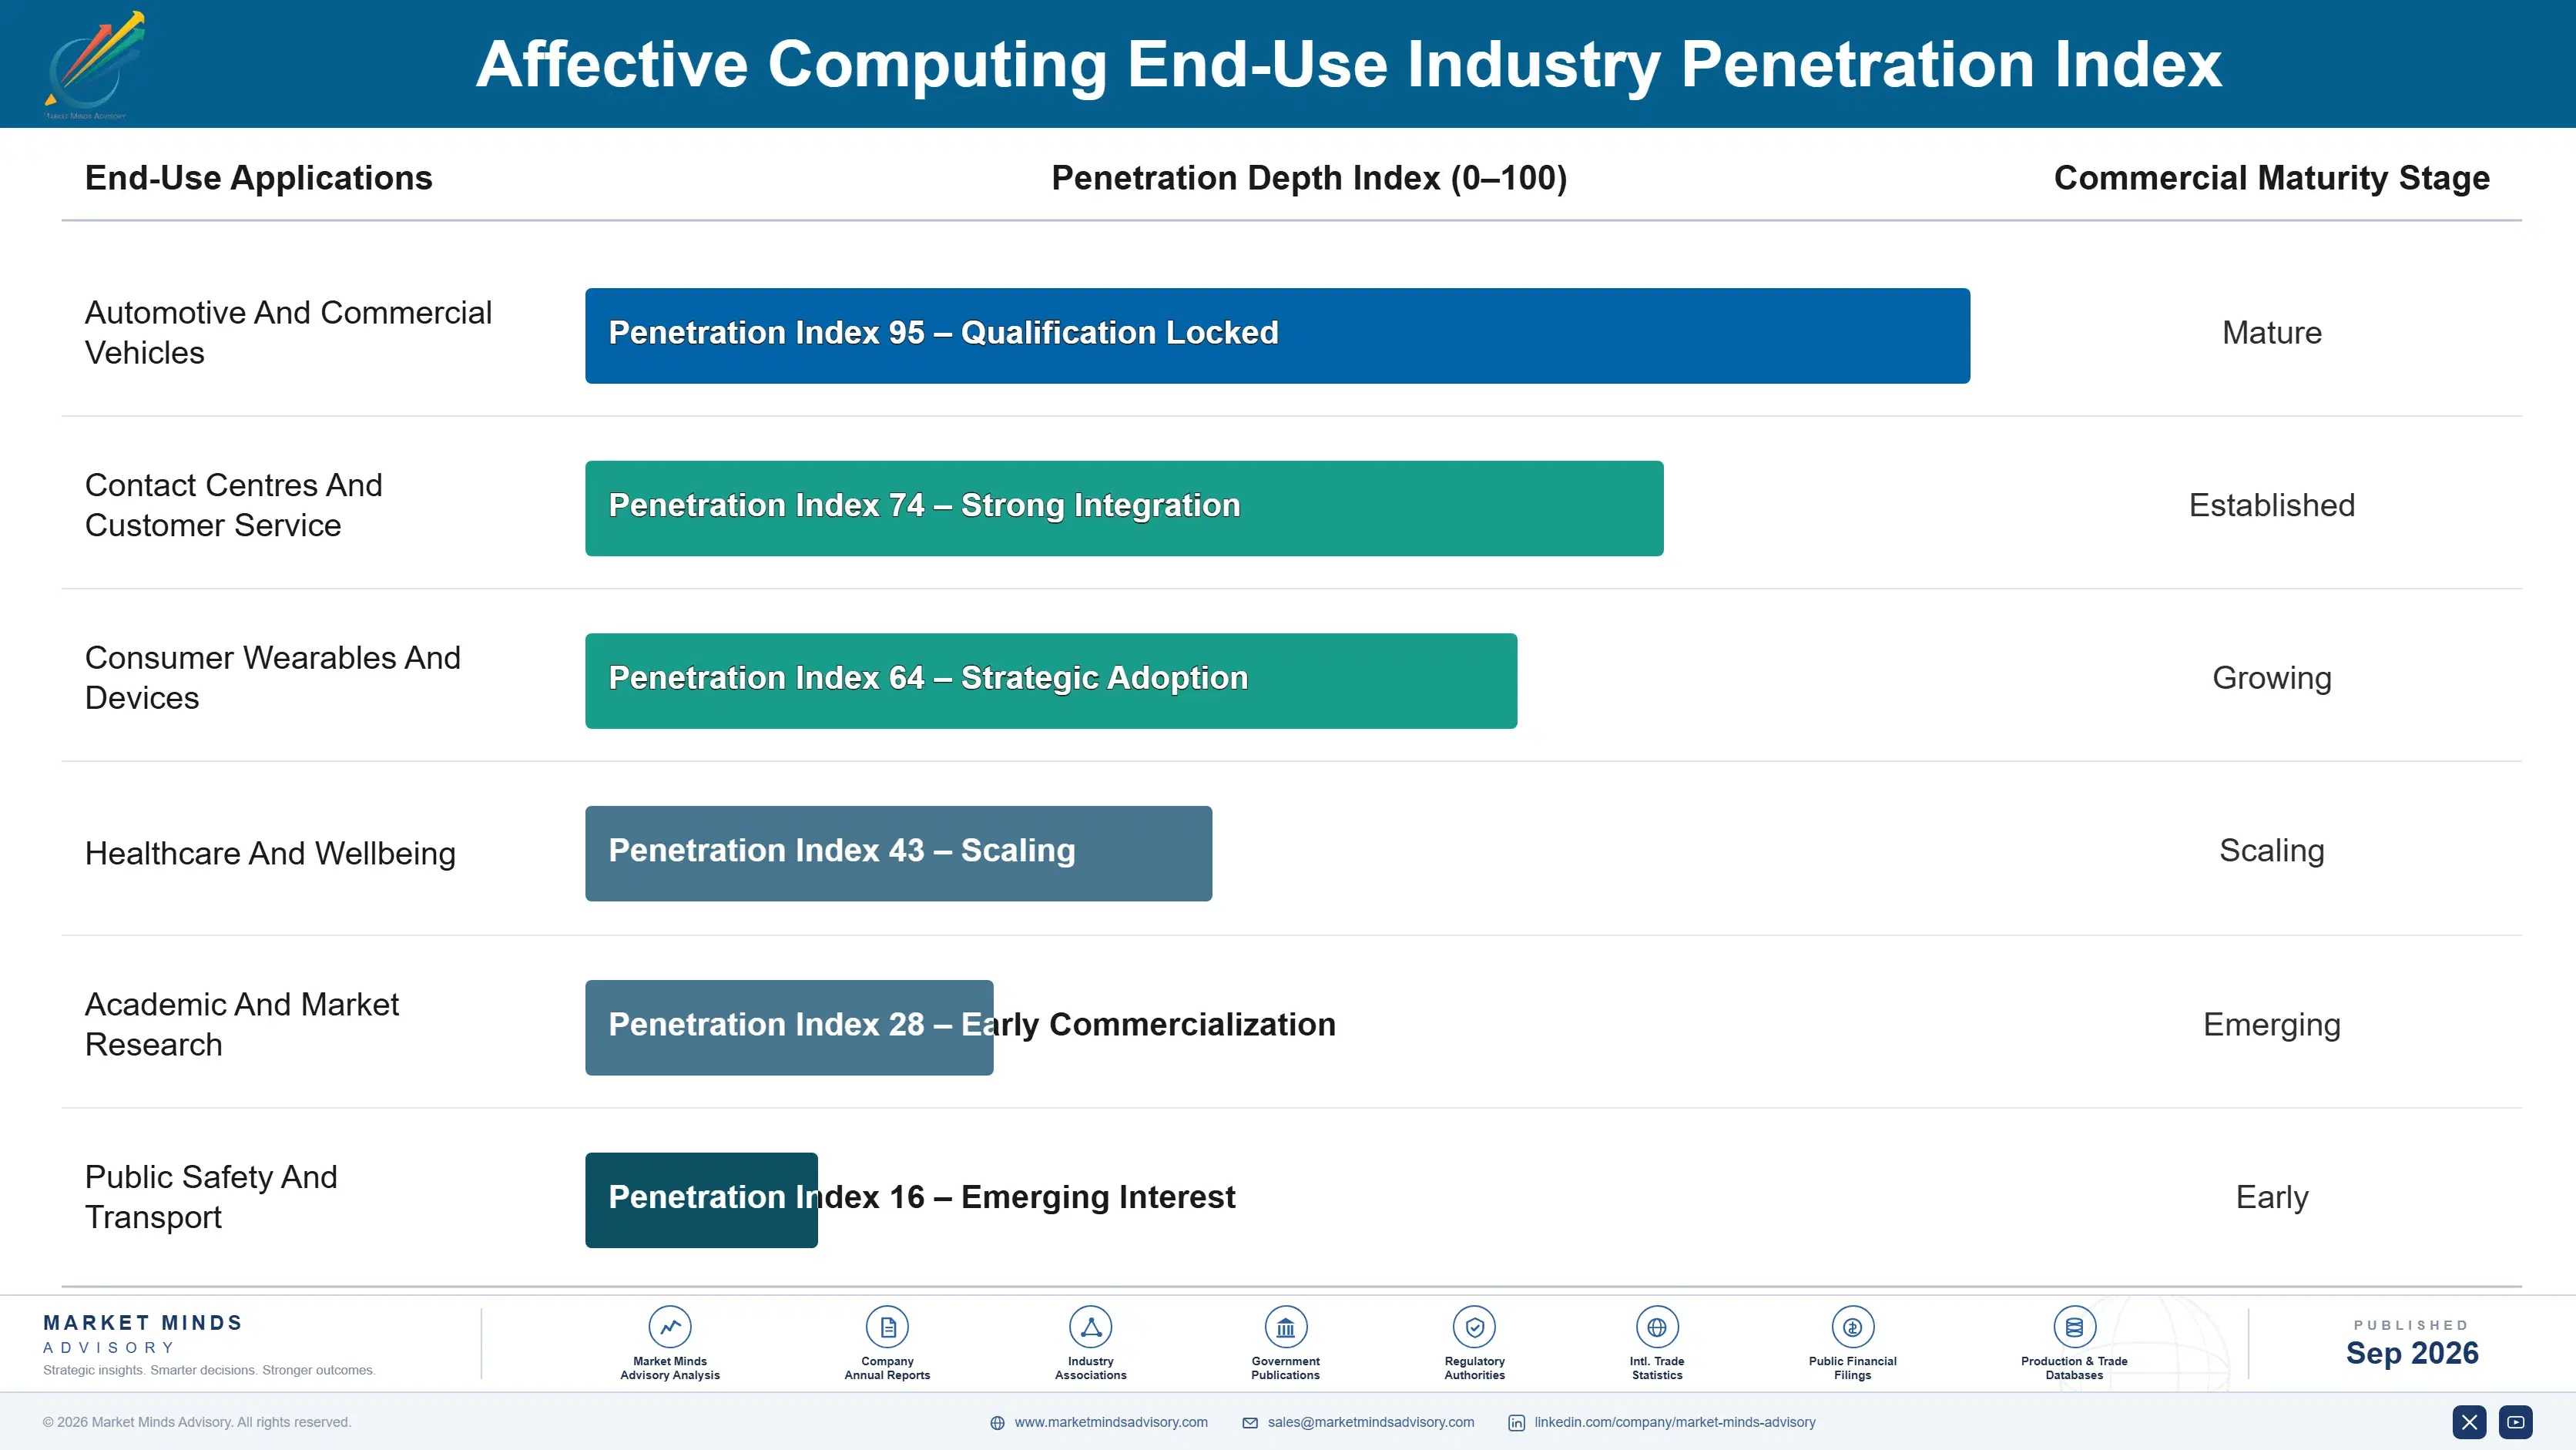
Adoption depth varies enormously by application and by what the buyer is permitted to do. Automotive adopts universally because a regulator requires it. Commercial fleets adopt on a measurable insurance return and stay for the asset life. Contact centres adopt broadly and shallowly, deploying across operations and using a fraction of what the product offers. Workplace and education applications have stopped adopting entirely in Europe, by law.

The deciding buyer has moved from a marketing researcher to a safety engineer, which changed everything about how this technology is sold. A marketing researcher wanted an interesting signal and tolerated uncertainty. A safety engineer needs a measurement that holds under type approval and will not accept a probabilistic claim about feelings. That shift explains which companies grew and which did not.
affective-computing-market-end-use-penetration-index-1789985049931

Where The Evidence Supports Investment

These are among the four positions where our research anticipates prominent divergence between winners and laggards over the coming forecast period. Each is grounded in the demand model, the regulatory perimeter, and the announced capacity pipeline.
01 / CLAIM DISCIPLINE PRIORITY

Sell Observations, Never Emotional Interpretations

Emotion inference from a face agrees with trained human coders about 72% of the time on posed material and worse on spontaneous expression, which is not a number any sophisticated buyer will build a consequential decision on. Eyelid closure, gaze direction and blink rate are physical observations with no interpretive step, which is why automotive suppliers rebuilt their claims around exactly that distinction and now compound at 22.8% against 15.2% for the market. Vendors still selling emotion classification are defending a scientific position European regulators have already rejected.
02 / AUTOMOTIVE CYCLE TIMING

Be In The Room Three Years Early

In-cabin monitoring compounds at 22.8% and design cycles run 36 months from specification to production, so a supplier arriving after a platform freeze has missed a vehicle generation rather than a quarter. The content is type-approval mandated in Europe and moving that way in China, which means volumes measured in millions of units at a few dollars of software content each. That is a volume business carrying automotive qualification requirements, warranty exposure and price pressure that software companies consistently underestimate until the first programme review.
03 / DATASET SCALE INVESTMENT

Build The Corpus Once, Reuse Everywhere

A credible commercial model needs something like 14 million annotated recordings, and annotated training data runs about 33% of development cost in this field. That corpus amortises across every subsequent programme a supplier wins, so an incumbent with a decade of collection spreads the cost over millions of shipped units while an entrant carries all of it against no revenue at all. Vendors who scope collection to a single automotive programme pay that cost repeatedly and gain no additional demographic coverage, which is the second problem this investment should solve.
04 / CONSUMER VOLUME ACCESS

License Physiological Sensing Into Wearable Devices

Heart rate variability, electrodermal activity and skin temperature correlate with arousal in ways that are measured rather than interpreted, and consumer wearables already carry those sensors on over 300 million devices. Every major watch and ring vendor ships stress or recovery scoring without ever using the phrase affective computing, which is the only route in this market to genuine consumer volume. The regulatory scrutiny applied to it has so far been almost nonexistent, and the commercial requirement is a licensing relationship with a device manufacturer rather than a direct product.

Engagement Snapshot From the Field

A live engagement with an industry participant carrying material or product regulatory and market exposure ahead of a defining policy shift, showing how our research translates into a defensible multi-year portfolio strategy.
MARKET MINDS ADVISORY · CLIENT ENGAGEMENT SUMMARY
Affective Computing Producer Strategic Portfolio Review and Transition Roadmap 2026·Investment Scenario on Affective Computing Exposure Evaluation 2025-26
CLIENT PROFILE
A European tier one supplier with an established camera and radar business, evaluating whether to build interior sensing capability or to acquire it ahead of the next platform cycle. Vehicle manufacturers had begun specifying occupant monitoring as type-approval content rather than as an option, and the company held no design wins in the category at all. The board wanted a decision within two quarters.
STRATEGIC CHALLENGE
Engineering believed the algorithms were within reach and finance questioned whether the annotated dataset could be assembled in time. Neither side had costed the corpus, and the 36 month design cycle meant a build decision taken late would miss the platform generation entirely. Two acquisition targets were available and both were priced against incumbent design win positions.
MMA APPROACH
MMA costed the annotated corpus required for a credible automotive model against the client's collection capability and timeline, then modelled both acquisition targets on design win value rather than on technology. We tested the demographic coverage of each available dataset against European and Chinese population profiles, and drew on 47 expert interviews conducted in Q4 2025 with manufacturers, suppliers and annotation operations.
KEY FINDINGS
  1. Assembling a credible corpus from scratch would have taken about 4 years, which is longer than the design cycle allowed (client-reported, unverified by MMA).
  2. Neither acquisition target's dataset covered Chinese population profiles adequately, which mattered because 2 of the 3 target platforms were built for that market.
  3. Design win value rather than algorithm quality explained almost the whole valuation gap between the two targets, which nobody in the evaluation had modelled.
  4. The client's existing exterior camera datasets transferred poorly to interior conditions, contributing under 1 in 10 usable recordings toward the required corpus (client-reported, unverified by MMA).
CLIENT PROFILE
A European tier one supplier with an established camera and radar business, evaluating whether to build interior sensing capability or to acquire it ahead of the next platform cycle. Vehicle manufacturers had begun specifying occupant monitoring as type-approval content rather than as an option, and the company held no design wins in the category at all. The board wanted a decision within two quarters.
STRATEGIC CHALLENGE
Engineering believed the algorithms were within reach and finance questioned whether the annotated dataset could be assembled in time. Neither side had costed the corpus, and the 36 month design cycle meant a build decision taken late would miss the platform generation entirely. Two acquisition targets were available and both were priced against incumbent design win positions.
MMA APPROACH
MMA costed the annotated corpus required for a credible automotive model against the client's collection capability and timeline, then modelled both acquisition targets on design win value rather than on technology. We tested the demographic coverage of each available dataset against European and Chinese population profiles, and drew on 47 expert interviews conducted in Q4 2025 with manufacturers, suppliers and annotation operations.
KEY FINDINGS
  1. Assembling a credible corpus from scratch would have taken about 4 years, which is longer than the design cycle allowed (client-reported, unverified by MMA).
  2. Neither acquisition target's dataset covered Chinese population profiles adequately, which mattered because 2 of the 3 target platforms were built for that market.
  3. Design win value rather than algorithm quality explained almost the whole valuation gap between the two targets, which nobody in the evaluation had modelled.
  4. The client's existing exterior camera datasets transferred poorly to interior conditions, contributing under 1 in 10 usable recordings toward the required corpus (client-reported, unverified by MMA).
RECOMMENDED STRATEGY
Phase 1: Phase one: abandon the build option outright, since corpus assembly alone exceeds the design cycle and the platform generation would be lost. Phase 2: Phase two: acquire the target with the stronger design win position rather than the better algorithms, and fund Chinese dataset collection separately afterwards. Phase 3: Phase three: publish per-group accuracy once the combined corpus is representative, since no competitor has done so and procurement teams keep asking.
OUTCOME
The client acquired the target with the stronger design win position and funded a separate Chinese collection programme (client-reported, unverified by MMA). Two platform design wins followed within four quarters, on programmes the build option would have missed entirely. Per-group accuracy disclosure remains under legal review and has not yet been published.

Frequently Asked Questions

Foundational context covering the market sizes, CAGR, scope, country, region and competition that inform every finding below. This section is provided to cover basics and most often pre-purchase conversations, answered from the MMA Primary Research Dataset.

What is the current size of the Affective Computing Market?

Global value reaches USD 3.69 billion in 2026, measured as product and licence revenue across all affective computing modalities. The 2025 base is USD 3.2 billion.

How large will the Affective Computing Market be by 2036?

Product and licence revenue reaches USD 15.19 billion by 2036, an increase of USD 11.50 billion over the forecast period. That represents 4.12 times expansion from the 2026 base.

What is the CAGR for the Affective Computing Market 2026 to 2036?

The base case runs at 15.2% annually, with a bull case at 16.4% if occupant monitoring beyond the driver becomes mandatory and a bear case at 13.9% if regulators extend current prohibitions.

Which segment is growing fastest?

In-cabin driver and occupant monitoring systems grow at 22.8%, half again the market rate of 15.2%. European type approval requires attention monitoring and Chinese standards are following it.

Who are the major companies in the Affective Computing Market?

Smart Eye, Seeing Machines, Cerence, Xperi and NICE lead on product and licence revenue, together holding 36%. Uniphore, Verint, audEERING and Cipia Vision hold smaller positions.

Which country is growing fastest?

China leads at 19.4%, on vehicle production volume and national standards tightening toward attention monitoring requirements. India and Indonesia follow some way behind on vehicle assembly.

Report Segmentation Architecture

The full report scope spans multiple orthogonal segmentation dimensions, with cross-tabulated demand data provided for each dimension pair. Coverage extends further to regional breakdowns, trend trajectories, and the competitive detail needed to support segment-level decision-making.

By Sensing Modality

  • In-Cabin Driver And Occupant Monitoring
  • Voice And Speech Affect Analytics
  • Multimodal Affect Inference Engines
  • Physiological And Biosensor Affect Sensing
  • Text And Conversational Sentiment Analysis
  • Facial Expression Analysis Software

By End-Use Industry

  • Automotive And Commercial Vehicles
  • Contact Centres And Customer Service
  • Consumer Wearables And Devices
  • Healthcare And Wellbeing
  • Academic And Market Research
  • Public Safety And Transport

By Commercial Dimension

  • Automotive Tier One Supply
  • Direct Enterprise Licensing
  • Original Equipment Manufacturer Embedding
  • Software Development Kit Licensing
  • Research Instrument Sales
  • Cloud Platform Subscription

By Region

  • North America
  • Western Europe
  • East Asia
  • South Asia and Pacific
  • Latin America
  • Middle East and Africa
  • Eastern Europe

Scope, Methodology, and Coverage

Every figure in this report is reproducible from documented input assumptions. The scope below maps the historical period, the forecast horizon, the segmentation dimensions, and the countries covered, alongside the underlying primary and qualitative methodology.
Historical Period
2020 to 2025
Forecast Period
2026 to 2036
Base Year
2025 (USD billions; MMA Primary Research Dataset, September 2026)
Market Definition
This report covers systems that detect, classify and respond to human affective and attentional state: in-cabin driver and occupant monitoring, voice and speech affect analytics, physiological and biosensor affect sensing, facial expression analysis software, multimodal affect inference engines, and text and conversational sentiment analysis. It excludes general computer vision and speech recognition, biometric identification and authentication, clinical diagnostic devices, and the camera and microphone hardware these systems run on.
Quantitative Units
USD millions, product and licence revenue basis; equipped vehicle units; classification agreement with human coders as a percentage; annotated recordings in the training corpus; per-vehicle software content in USD.
Segmentation Dimensions
Sensing modality; end-use industry; commercial channel; geography across seven regions.
Regions Covered
North America, Western Europe, East Asia, South Asia and Pacific, Latin America, Middle East and Africa, Eastern Europe
Countries Covered
China, Japan, South Korea, Taiwan, India, Indonesia, Australia, United States, Canada, Mexico, Brazil, Chile, Germany, Sweden, France, United Kingdom, Czechia, Poland, Israel, Saudi Arabia.
Key Companies Profiled
Smart Eye, Seeing Machines, Cerence, Xperi, NICE, Uniphore, Verint, Behavioral Signals, audEERING, Realeyes, iMotions, OMRON, Valeo, Cipia Vision, Eyeris.
Quantitative Methodology
Primary survey, n=3,800 respondents, Q4 2025, six countries; demand-side model with trade association cross-validation
Qualitative Methodology
47 expert interviews, Q4 2025; applied to validate demand model assumptions, identify emerging dynamics, and assess competitive positioning
Report Format
PDF and XLSX data workbook (Word format preview document)
Publisher
Market Minds Advisory
Report Code
MMA-2026-TEC-361
Published
September 2026
Contact
sales@marketmindsadvisory.com | www.marketmindsadvisory.com

Purchase the full Affective Computing Market Report (2026 to 2036).

This report sizes the global affective computing market from 2026 to 2036 across six sensing modalities, six end-use industries and seven regions. It separates the applications regulators are mandating from those they are prohibiting, and explains why the measurable half of this field carries almost all the revenue. Development cost composition is sourced to company annual reports, with annotated training data at 33% of cost. Regional analysis explains why East Asia leads at 32% on vehicle production volume while Western Europe writes the rules. Competitive assessment covers 20 named suppliers with four revenue lever analyses and an anonymised tier one strategy engagement.
Mandated and prohibited applications separated by jurisdiction
Six sensing modalities sized through to 2036
Dataset and qualification cost composition from filings
Twenty named suppliers assessed on licence revenue
Four revenue levers with quantified commercial impact
Anonymised automotive tier one strategy engagement included

Built For The People Who Decide

From boardroom strategy to bench-side execution, this report is read cover-to-cover by leaders shaping the next decade of their industry, turning demand scenarios, market dynamics and valuation benchmarks into decisions.
CXOs/ Presidents/ VPs/ Managers
M&A and Corporate Development
Strategy Teams and R&D Heads
Procurement and Product Directors
Regulatory and Compliance Leaders
Investor Relations and Equity Analysts