

Market Minds Advisory
Advanced Drill Data Management Solutions Market

Advanced Drill Data Management Solutions Market: Advanced Drill Data Management Solutions Market: The Aggregation Layer Is The Asset

A deepwater rig costs about half a million dollars a day. Software that saves one day pays for itself across an entire fleet, and everybody in this business knows it.

Lead Analyst

Published

September 2026

Make Smarter Decisions with Customized Research Insights

Request a free sample report and evaluate market opportunities, growth trends, and competitive dynamics relevant to your business needs.

2025 MARKET VALUE$2.4BMarket Size 2025
2036 FORECAST VALUE$8.7BBase Case , 2026 to 2036
CAGR 2026 TO 203612.4 %Bull 13.7% / Bear 11.1%
INCREMENTAL OPPORTUNITY$6.0BNet 10- year value creation
EXPANSION MULTIPLE3.22x2036 value over 2026 base
Strategic Levers
M&A Pipeline
Regional Outlook
Country Rankings
Competitive Intelligence
Segmental Deep-dive
Call-Us : 91 93563 13602

Executive Snapshot and Market Trajectory.

The economics here are unusually simple and unusually favourable. A deepwater rig day costs around USD 480,000, so software that removes a single day across a drilling programme has paid for a decade of licences. Almost nothing else in industrial software has that arithmetic sitting behind it.
Autonomous drilling control software grows at 18.6%, half again the market rate of 12.4%, and it remains the smallest segment because closed-loop control raises liability questions nobody has answered, so only 7% of rigs run it. North America holds 34% of demand on well count and unconventional drilling density, though the most advanced single deployments sit in Gulf national oil company operations centres rather than anywhere in Texas. That distinction is worth understanding properly.
Concentration is moderate at 44% of rigs under contract and the interesting position is not analytics at all. It is the aggregation layer, where data from dozens of vendor systems is normalised into a common standard before anything is done with it. Whoever holds that layer sits between the operator and every service company on the rig. That is the position worth holding, and remarkably few contest it.
Market Definition
The advanced drill data management solutions market covers software and data platforms that acquire, normalise, store, analyse and act on drilling data across the well construction process, spanning real-time data acquisition and aggregation, drilling analytics and optimisation platforms, well planning and engineering data systems, historical well data management and archiving, autonomous drilling control software, and remote operations centre platforms. Scope is measured as software licence, subscription and associated service revenue. Excluded are downhole sensors and measurement hardware, surface data acquisition instrumentation, reservoir simulation and seismic interpretation software, production operations platforms, and general enterprise data infrastructure.
Base Year Value
$2.4B in 2025 (MMA Primary Research Dataset, September 2026)
Forecast Period
2026 to 2036, eleven discrete annual values
CAGR
12.4% base case. Bull 13.7%. Bear 11.1%.
Fastest Growth Segment
Autonomous Drilling Control Software: 18.6% CAGR
Fastest Growth Country
Australia: 14.6% CAGR
Fastest Growth Region
South Asia and Pacific: 14.6% CAGR
Largest Region
North America: 34% of 2025 global value
Market Leaders
SLB, Halliburton, Baker Hughes, NOV and Pason Systems. Source: MMA Analysis, July 2026.
Primary Survey
n=3,800 procurement and R&D decision-makers, Q4 2025, six countries
Methodology
Demand-side build-up, cross-validated against public data, 47 expert interviews

Advanced Drill Data Management Solutions Market Forecast Scenarios

advanced-drill-data-management-solutions-market-size-forecast-scenario-1788234614610
Between 2020 and 2025 the sector compounded at 11.0% while rig counts fell and then partly recovered, which tells you the growth was not activity driven. The 2020 collapse forced operators to move drilling supervision onshore because nobody could fly crews, and the centres built as an emergency were kept because they worked. That accident did more for adoption than a decade of selling had.
The 12.4% base case rests on three mechanisms. Remote operations centres now supervise around six rigs from one onshore team, which makes the data platform a dependency rather than an aid. Unconventional drilling generates enough repeated wells for analytics to find genuine patterns rather than anecdotes. And a rig day worth USD 480,000 makes almost any software licence look inexpensive. None of the three requires rig counts to rise at all.
The bull case at 13.7% turns on liability frameworks for autonomous control being settled, which would move closed-loop drilling from 7% of rigs toward the majority within a decade. The bear case at 11.1% is operator consolidation: fewer, larger operators negotiate harder, standardise on fewer vendors and squeeze pricing across a fleet in a way individual well contracts never allowed.

Half A Million Dollars A Day

The business case writes itself and that is genuinely rare in industrial software. A deepwater rig day costs around USD 480,000 and a land rig day a serious fraction of that, so a platform avoiding one stuck pipe incident has justified itself many times over. Nobody in this sector has to argue about return on investment, which is why the sales conversation is about trust instead.
TOP FIVE CONCENTRATION44%Share of rigs under data contract held by five
RIG DAY COST AVOIDEDUSD 480kValue of a single deepwater day saved through optimisation
DATA STREAMS PER RIG1,400 tagsDistinct measurement channels aggregated from all wellsite vendor systems
REMOTE CENTRE RATIO6 rigsWells supervised by a single onshore engineering team
CONTRACT RENEWAL RATE91%Portion of rig data contracts renewed at term expiry
AUTONOMOUS CONTROL ADOPTION7%Portion of rigs running closed-loop control without human intervention
The technical position that matters is the least visible one. A modern rig produces around 1,400 measurement channels from mud logging, measurement while drilling, top drive, pumps, cementing and a dozen other vendor systems never designed to talk to each other. Normalising all of that into one usable stream is the hard part, and whoever does it sits between the operator and every service company working on that rig.
Remote operations centres changed the dependency completely. One onshore engineering team now supervises around six rigs, which is only possible because the data arrives reliably, quickly and in a form somebody can act on. That reduced headcount permanently and made the platform load-bearing. Renewal runs at 91%, because cancelling now means rebuilding an operating model rather than switching a vendor.
"Everybody sells analytics and the money is in the plumbing underneath. The vendor that normalised fourteen hundred tags from nine competitors' systems owns the customer relationship, and the clever application sitting on top is replaceable in an afternoon."
Director, Upstream Digital Practice · MMA Technology Practice · September 2026

Market Trends

Remote operations centres made the platform load-bearing

Operators moved drilling supervision onshore during the 2020 travel restrictions as an emergency measure and then kept the arrangement, because one engineering team supervising around six rigs costs far less than crews on each of them. That only works if the data arrives reliably and in a form somebody can act on immediately, which converted the software from a useful tool into an operating dependency. Contract renewal now runs at 91%, and the reason is not satisfaction. Cancelling means rebuilding an entire operating model rather than simply changing a supplier.
Market Impact: Saves USD 480k per day

Aggregation became more valuable than analytics

A modern rig generates around 1,400 measurement channels from mud logging, measurement while drilling, top drive, pump and cementing systems supplied by companies that compete with each other and never designed for interoperability. Normalising that into one coherent stream against a common data standard is difficult, unglamorous and absolutely necessary before any analysis happens at all. The vendor holding that layer sits between the operator and every service company on the rig, and the applications running on top of it are comparatively easy to replace. Very few participants have priced that difference correctly.
Market Impact: Learns across 400 similar wells

Market Opportunities and Growth Drivers

A saved rig day pays for years of licences

A deepwater rig day costs around USD 480,000 and a modern land rig a substantial fraction of that, so avoiding one stuck pipe incident, one twist-off or a few hours across every connection pays for software many times over across a drilling programme. That asymmetry removes the return on investment argument that slows adoption in almost every other industrial software category. The consequence is that the sale turns on trust in the data and in the vendor rather than on price, which favours incumbents and disadvantages technically superior newcomers considerably.
Market Impact: Runs on only 7% of rigs

Unconventional drilling generates enough repetition to learn from

Shale programmes drill hundreds of broadly similar wells from similar pads into similar formations, which produces the repeated observations that analytics need and that conventional exploration drilling never provides. A pattern seen across four hundred wells is a finding, while the same pattern across four wells is an anecdote nobody will act on. That is why optimisation platforms took hold first in North American unconventional operations and why drilling analytics grows at 15.4% against a market rate of 12.4%. Repetition, not sophistication, is what made the mathematics work. Exploration drilling will never deliver that.
Market Impact: Cuts unit pricing across 6 rigs

Market Restraints and Challenges

Nobody has resolved liability for autonomous control

Closed-loop software that moves the drawworks and adjusts weight on bit without a human in the loop runs on only 7% of rigs, and the obstacle is legal rather than technical, because no operator, contractor or vendor will accept responsibility for a well control incident caused by an algorithm. The root cause is that existing contracts, insurance and regulation all assume a named person made the decision. Commercial impact is the fastest growing segment remaining the smallest. Participants are responding through advisory rather than control modes, staged authority limits, contractual liability caps and regulator engagement well ahead of deployment.
Market Impact: Supervises 6 rigs per team

Operators are consolidating and negotiating as fleets

Upstream consolidation has produced fewer and larger operators who standardise on one vendor across an entire fleet and negotiate accordingly, which replaces many small well-level contracts with a handful of enterprise agreements at considerably lower unit pricing. The root cause is that software scales without marginal cost and every procurement department knows it. Commercial impact is falling revenue per rig even as rig coverage grows. Mitigation runs through usage-based pricing tied to wells drilled, outcome-linked commercial terms, modular products priced separately and deep integration that raises the cost of switching.
Market Impact: Normalises 1,400 channels per rig
3 additional market trends, 4 additional growth drivers, and 2 additional restraints and challenges are covered in the full report. Contact sales@marketmindsadvisory.com to access the complete intelligence.

Segment CAGR and Growth Architecture

Segmentation follows solution function, the dimension on which technical difficulty, switching cost and commercial value all move together. Acquisition, archiving and planning systems carry the installed base at modest prices. Analytics and autonomous control carry the growth, because both act on the rig in real time rather than describing what already happened to it.
advanced-drill-data-management-solutions-market-market-share-analysis-1788234615208

Autonomous Drilling Control Software

Autonomous drilling control software grows at 18.6%, half again the market rate of 12.4%, and it is simultaneously the fastest growing and the smallest segment in this category, which tells you where the obstacle sits. Closed-loop systems that adjust weight on bit, rotation and flow without human intervention demonstrably drill faster and more consistently than a driller does, and they run on only 7% of rigs because no operator, contractor or vendor will accept liability for a well control incident that an algorithm caused. The technology is ready and the contracts, the insurance and the regulation are not. Whoever resolves that question commercially will find the technical competition considerably easier than the legal one.
CAGR 18.6%

Drilling Analytics and Optimisation Platforms

Drilling analytics and optimisation platforms at 15.4% earn their position from repetition rather than from sophistication. Unconventional programmes drill hundreds of similar wells into similar formations from similar pads, which produces enough repeated observation for a pattern to be a finding rather than an anecdote, and that is exactly what conventional exploration drilling never delivers. Stick-slip detection, hole cleaning assessment and connection time analysis all became reliable once the sample size arrived. The commercial position is weaker than it looks, though, because these applications sit on top of an aggregation layer somebody else may control, and an application is far easier to replace than a data infrastructure. Very few application vendors price that risk.
CAGR 15.4%
Full segment breakdown across 6 segments available in the complete report.

Regional Architecture and Country Demand Map

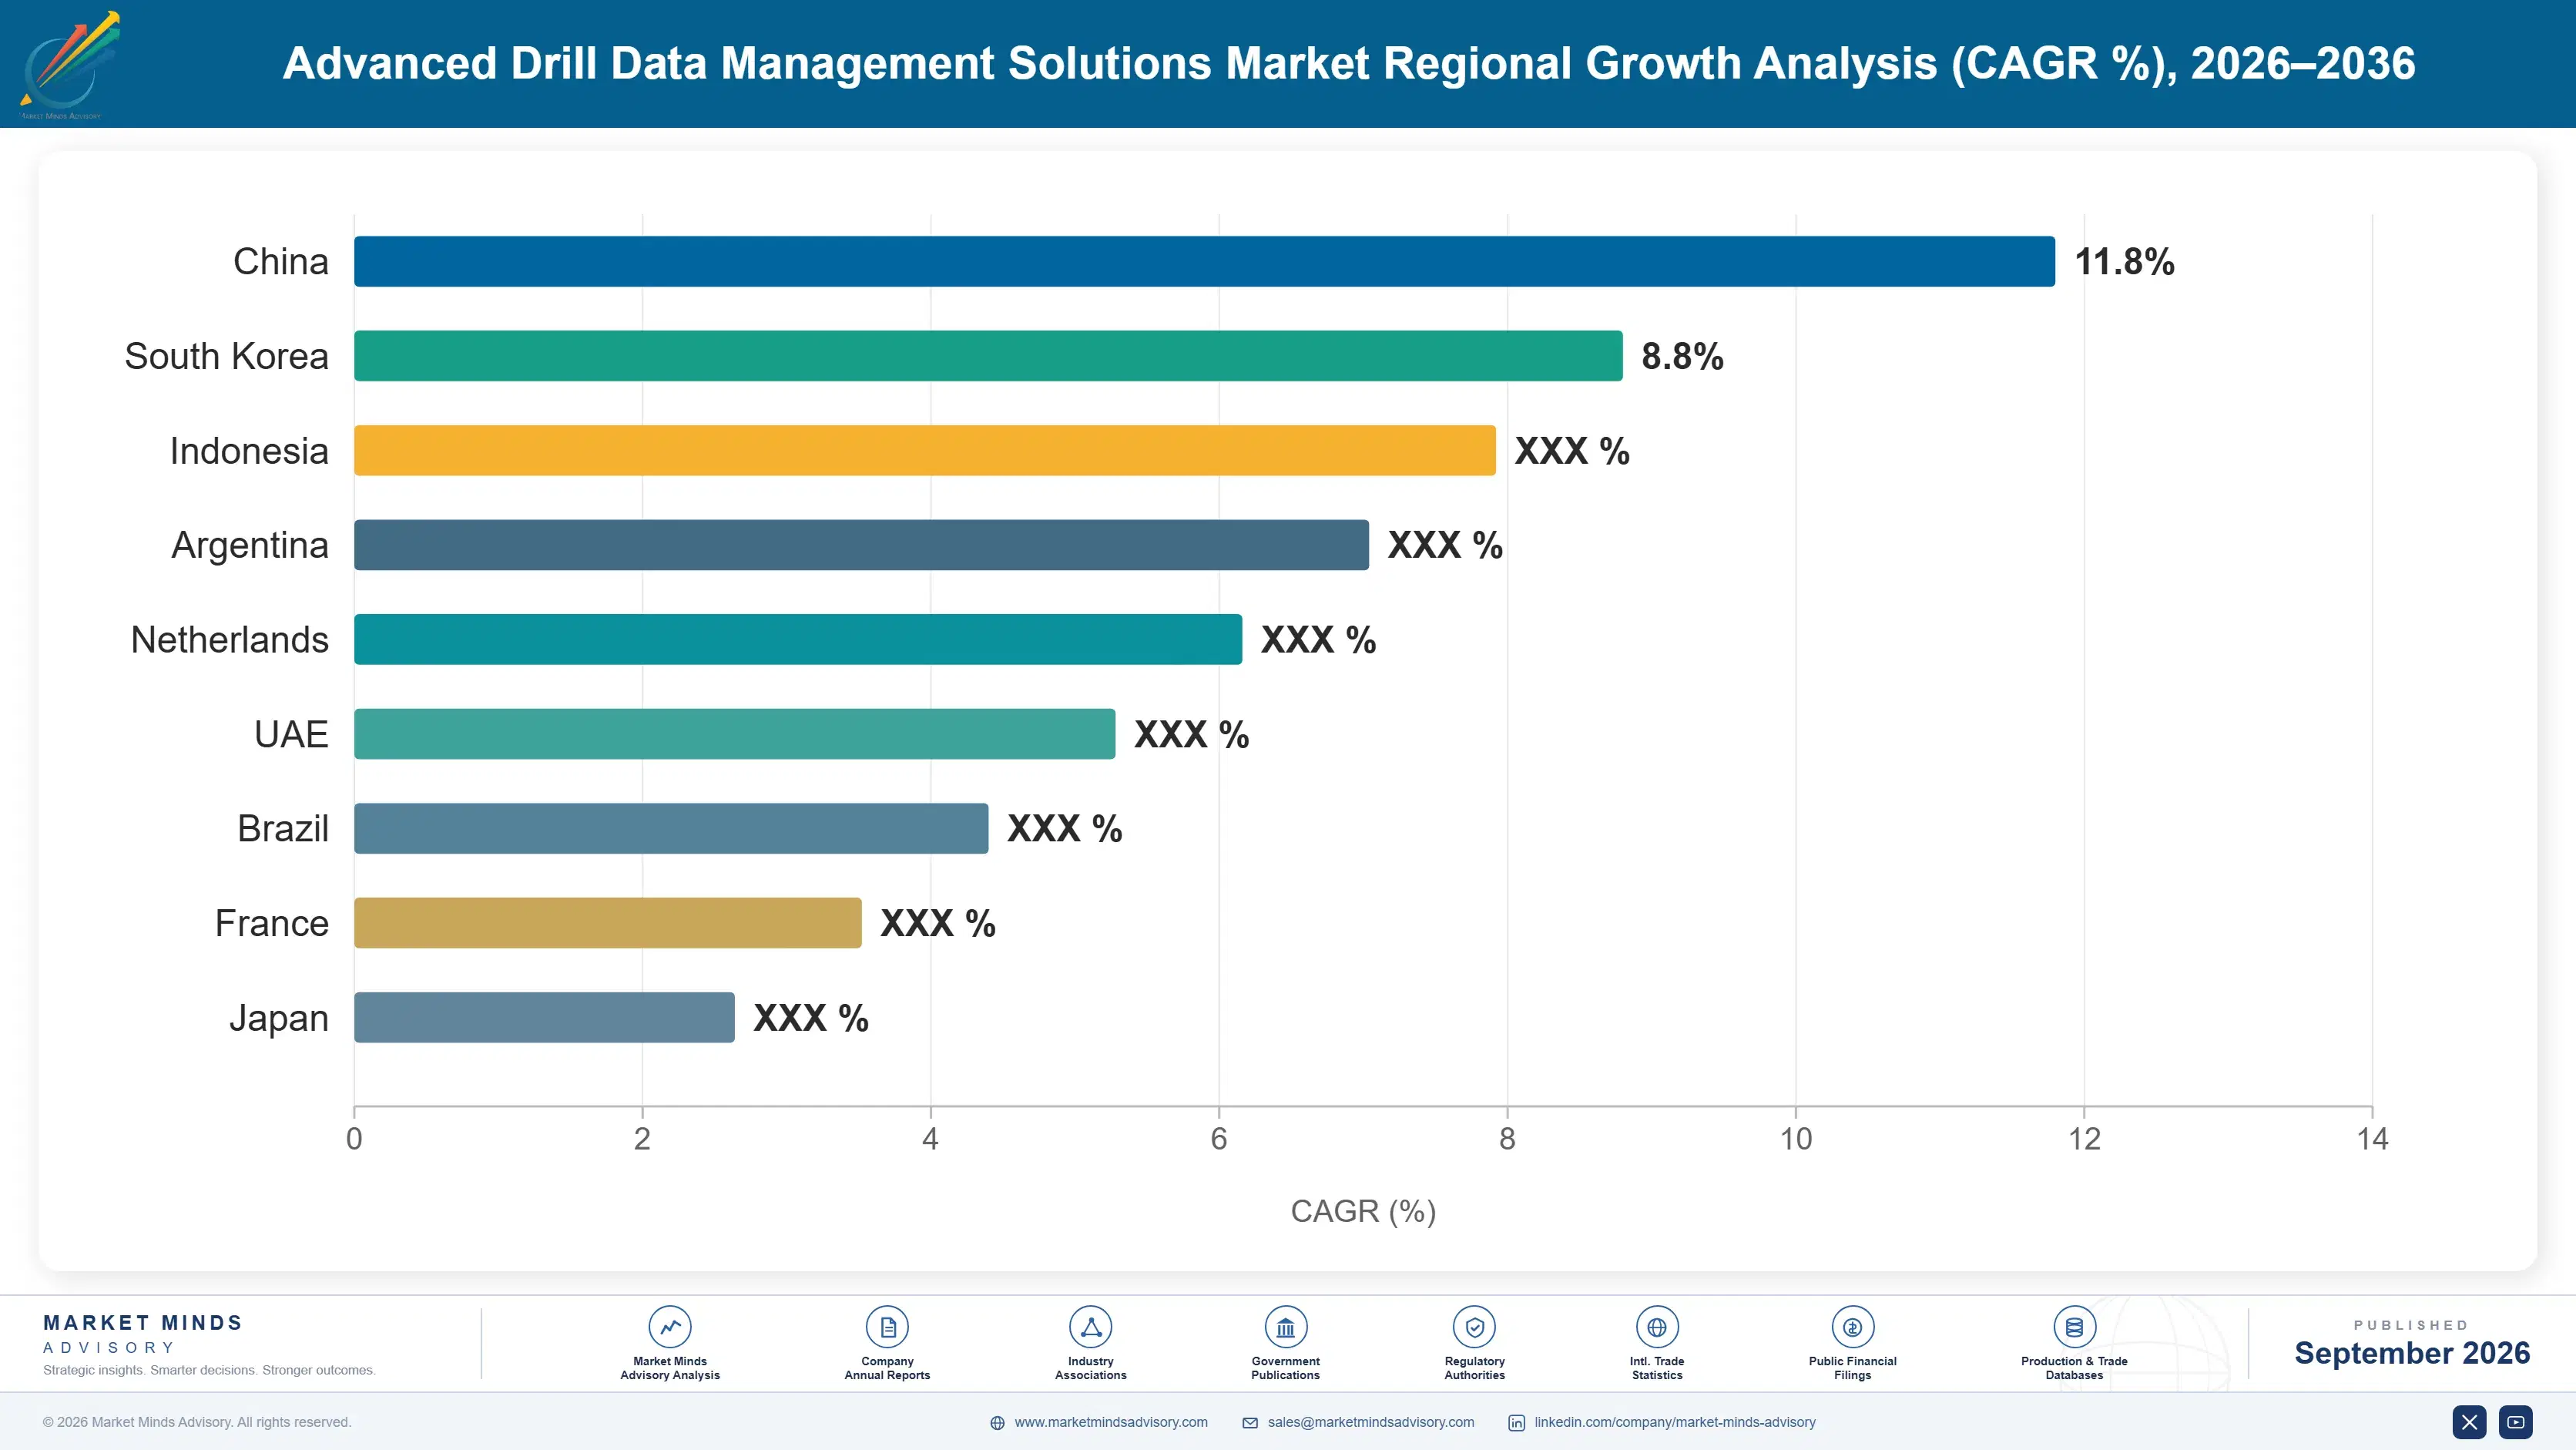
North America takes 34% on well count and unconventional density, above its usual band. Middle East and Africa reaches 17% on national oil company digital investment. Australia grows fastest. Well count decides one position and national investment decides the other, and neither follows economic size at all.

North America

A 34% share above the usual band comes from volume and repetition rather than from sophistication. The United States and Canada drill more wells than anywhere else and most of them are unconventional, which produces the hundreds of near-identical wells that analytics require to distinguish a pattern from noise. Independent operators adopt software faster than national companies because the decision sits with an engineering manager rather than a committee. The vendor base is concentrated here too, in Houston, Calgary and Austin. Data standards work and interoperability initiatives originate largely in this region as well, which shapes what the rest of the world eventually implements. Everybody in the sector is selling here, which shows in the pricing.
Share: 34% | CAGR: 11.8% (2026 to 2036)

Middle East and Africa

The 17% share sits far above the usual band, and the most advanced individual deployments anywhere are here rather than in North America. Saudi and Emirati national companies have built integrated operations centres supervising very large rig fleets, funded at levels no independent operator could contemplate and staffed as permanent engineering organisations rather than as cost-saving measures. Those centres set the reference for what the technology can achieve. Long-term national company contracts favour major vendors with local presence and disadvantage smaller specialists entirely. African activity outside North Africa and Nigeria is limited and served through international operator programmes rather than locally. Vendors without a permanent local office are effectively excluded from all of it.
Share: 17% | CAGR: 12.8% (2026 to 2036)
Regional intelligence for 5 additional markets available in the complete report: Western Europe, East Asia, South Asia and Pacific, Latin America, Eastern Europe. Contact sales@marketmindsadvisory.com.
advanced-drill-data-management-solutions-market-country-cagr-analysis-1788234615736

Four Moves On The Data Layer

None of these four is about better algorithms, because the mathematics is well understood and published, and every serious vendor can build the same models. Each works on position: who owns the plumbing, who carries the liability, and what a customer would actually have to do to leave. Two of the four are legal problems software companies solve badly.

Own the aggregation layer, licence the applications

A rig produces around 1,400 measurement channels from systems built by companies that compete with each other, and normalising them into one coherent stream is the difficult, unglamorous work that everything else depends on. A vendor holding that layer sits between the operator and every service company on the rig and can permit or refuse access to anybody. Applications on top are replaceable in an afternoon. Pricing the infrastructure as infrastructure and treating the analytics as the commodity inverts how almost every participant currently sells, and it matches where the value actually is.
Market Impact: Controls all 1,400 of the rig data channels

Sell the liability answer, not the autonomy

Autonomous control grows at 18.6% and runs on 7% of rigs, and the gap between those two numbers is entirely legal. Operators want the performance and will not accept responsibility for an algorithm causing a well control incident, and neither will contractors or vendors. A supplier arriving with staged authority limits, contractual liability caps, insurance arrangements and a regulator already engaged is selling the thing that is actually blocking the purchase. It is a commercial and legal package rather than a software feature, and almost nobody is building one. It is a contract, not a release.
Market Impact: Unblocks the 93% of rigs not running it

Price against the rig day, not the seat

A deepwater rig day costs around USD 480,000 and this software is still frequently sold on user seats and server licences, which bears no relationship whatsoever to the value delivered or to what the customer is comparing it against. Outcome-linked pricing tied to non-productive time reduction or to wells delivered aligns the vendor with the operator and defends against procurement departments benchmarking software against other software. It requires measurement both sides trust. The vendors who moved to this basis report both higher pricing and considerably easier renewals. Nobody benchmarks a rig day against a seat licence.
Market Impact: Prices against a USD 480k daily rig cost

Serve the repetitive drilling nobody is chasing

Coal seam gas in Queensland, Argentine unconventional development and Indian modernisation programmes all drill repetitive wells where analytics work best, and none is well served by vendors organised around North American shale and Gulf national companies. Australia grows at 14.6%, the fastest of any country covered, largely on that repetition. Serving these markets requires local presence and patience rather than any product change at all. The vendors chasing the same twenty large operators are competing hardest where the pricing pressure is worst. Local presence and patience are the whole requirement here.
Market Impact: Targets basins now growing at 14.6% each year

Who Controls the Margin Pool

CR5 stands at 44% of rigs under active data contract, which is the only comparable basis since software revenue is buried inside far larger service reporting for most participants. Concentration is moderate because the integrated service companies hold position through their measurement businesses while independent specialists hold the aggregation layer. The gap between them is a gap in access rather than in capability.
Competition runs on data access, switching cost and trust. Data access decides who can normalise the rig, since a vendor whose competitor supplies the measurement systems may be refused the feed entirely. Switching cost decides renewal, which runs at 91% because leaving means rebuilding an operating model. Trust decides the sale, because the return on investment argument was settled years ago. Algorithm quality differentiates far less than any vendor claims.

Rankings will move on whoever resolves the liability question for autonomous control, which is worth more than any technical advance available. That segment grows at 18.6% and sits at 7% adoption purely because nobody will sign for the consequences. The pressure comes from contract law and insurance rather than from engineering, which is not a contest software companies are organised to win.
advanced-drill-data-management-solutions-market-company-positioning-matrix-1788234616255

Competitive Moat and Risk Dimensions

SLB

Moat: Measurement systems supply the data

Supplying the measurement while drilling, logging and surface systems that generate much of a rig's data gives the group first access to the feed and a natural position in the aggregation layer above it. A competing software vendor may need permission it will not receive. Owning the sensors is a considerably stronger position than owning the analytics that read them.
SLB

Risk: Operators resist single vendor dependence

Operators are increasingly wary of a supplier controlling both the measurement hardware and the data platform interpreting it, and several have mandated open data standards specifically to prevent that concentration from forming. Procurement policy rather than technical failure is the threat. Defending an integrated position against a customer that has decided against integration is a difficult argument to win.
PASON SYSTEMS

Moat: Independent aggregation on land rigs

A long-established position supplying rig instrumentation and data infrastructure across North American land drilling gives the company an aggregation layer that operators trust precisely because it does not compete with them in services. Neutrality is the product. Contractors and operators both accept a party that has no interest in the interpretation, which the integrated groups cannot easily claim.
PASON SYSTEMS

Risk: Concentrated in land drilling

Revenue weighted heavily toward North American land rigs exposes the company to a rig count that moves sharply with commodity prices and to a region where operator consolidation is compressing unit pricing fastest. Offshore and international expansion faces incumbents with established relationships. The neutrality advantage travels well and the commercial position built around it does not.

Players Tracked

Prominent Players

SLB
Halliburton
Baker Hughes
NOV
Pason Systems

Other Key Players

Weatherford International
Corva
Enverus
Petrolink
Katalyst Data Management
Nabors Industries
Helmerich and Payne
Precision Drilling
Sekal
TDE Group
Emerson
AVEVA
IBM
Microsoft
Schlumberger Cameron

Recent Developments

FEBRUARY 2025

Operators mandated open data standards across contracts

Several large operators wrote open data standard requirements into their drilling service contracts, obliging every vendor on the rig to publish measurements in a common format regardless of who supplied the equipment. Independent software vendors gained access to feeds that had previously been controlled by the measurement suppliers themselves.
Signal: A procurement clause did more to open this market than a decade of standards committee work.
JUNE 2025

Gulf national company expanded integrated operations centre

A Gulf national oil company expanded its integrated drilling operations centre to supervise a substantially larger rig fleet from a single onshore facility, an organic expansion rather than any acquisition or joint venture. The deployment now supervises more rigs from one location than any comparable Western operation.
Signal: The most advanced deployment of this technology is nowhere near where most vendors are actually selling.
OCTOBER 2025

Contractor accepted staged liability for automated sequences

A drilling contractor agreed contractual terms accepting defined liability for automated drilling sequences within specified operating envelopes, with authority limits and human override requirements written into the agreement. It is among the first commercial arrangements to address the question that has held autonomous adoption at low levels.
Signal: The obstacle here was never the software, and somebody has finally gone and written the contract instead.

Engineers, Connectivity And Support

Software engineering and data science salaries account for roughly 42% of delivered cost, field and customer support around 21%, and satellite or remote connectivity to rig sites a further 13%. Cloud infrastructure is smaller than most expect at around 9%. The cost base is almost entirely people, moving with a technology labour market unconnected to drilling activity.
The technology hiring market through 2021 and 2022 demonstrated that exposure sharply. Software engineering compensation rose across every sector at once, as US Bureau of Labor Statistics wage reporting recorded, while upstream vendors competed for the same people as far better funded technology companies. Vendors with established engineering teams and low attrition absorbed it. Those hiring into growth faced costs that made contracted multi-year pricing look badly judged.

The disadvantage falls on customer concentration rather than on wage management. A vendor serving twenty large operators supports each of them intensively with named engineers, which is expensive and difficult to scale, while one serving hundreds of smaller customers supports them through documentation and self-service. Neither model is wrong and they carry entirely different cost structures. Most have drifted into the first without deciding to.
advanced-drill-data-management-solutions-market-cost-volatility-analysis-1788234616452

Hold engineering teams rather than rehire them

Engineering and data science salaries are 42% of delivered cost and attrition costs far more than retention does, particularly when replacement happens in a hot technology labour market that upstream software vendors cannot outbid. Retention spending is cheaper than recruitment and dramatically cheaper than lost domain knowledge. Vendors with stable teams absorbed the last wage cycle without repricing anything.

Design support for self-service from the start

Support is 21% of cost and scales linearly with customers when it depends on named engineers rather than on documentation, diagnostics and tooling the customer can use alone. Building that during development costs engineering time and avoids a support organisation growing with every contract. Most vendors add it after the cost has already become a problem they cannot reverse.

Contract connectivity across the whole fleet

Satellite and remote connectivity to rig sites is 13% of cost and is frequently bought site by site at rates that bear no relation to what fleet-level contracting achieves. Consolidating across every rig under contract, and negotiating jointly with the operator, reduces a line most vendors treat as an unavoidable pass-through. It is straightforward procurement work nobody has bothered doing.

Portfolio Architecture for Margin Defence

Margin here follows switching cost rather than product sophistication, which is not how any vendor presents its portfolio. An analytics application delivering genuine insight can be replaced over a weekend and prices accordingly. A data aggregation layer wired into every vendor system on a rig and feeding an operations centre cannot be removed without rebuilding an operating model, and it earns what that implies.
Volume and premium pull against each other through the rig relationship rather than the product line. Archiving and planning systems earn modestly and put the vendor inside the operator's data environment, which is what makes the real-time products specifiable when a programme is designed. Selling only the high-value real-time products means arriving at each new programme as an outsider bidding against whoever already holds the data.

High-value pools sit in aggregation infrastructure, in autonomous control once liability is settled, and in the data itself, which almost nobody has monetised. Anonymised cross-operator drilling performance benchmarks are commercially valuable to every operator and to every contractor, and the vendors holding fleet-wide data could sell that insight without touching anybody's proprietary information at all.

Volume / Commodity-Adjacent

Historical well data archiving, document management and basic reporting sold against competing platforms on price and compliance capability. Switching cost is low and differentiation is minimal. The 9 point spread reflects whether hosting is managed by the vendor or by the customer.
Gross Margin: 44 to 53%

Premium / Certified

Real-time acquisition, aggregation and analytics platforms embedded in daily drilling operations and integrated with multiple vendor systems. Switching cost rather than features supports the price. The 9 point spread reflects how many vendor systems the platform has been integrated with.
Gross Margin: 58 to 67%

Sustainability / Regulatory / Next-Generation

Autonomous control software, remote operations centre platforms and cross-operator benchmarking data services sold on outcomes rather than licences. Margins are high because alternatives barely exist. The 18 point spread separates software licensing from data and benchmarking services entirely.
Gross Margin: 64 to 82%
advanced-drill-data-management-solutions-market-portfolio-architecture-1788234616953

High-value Sub-segments and Strategic Watch-out

Autonomous Drilling Control Software

High value and high growth at 18.6%. It runs on only 7% of rigs because liability is unresolved rather than because the technology fails, which makes this a legal opportunity. The 8 point spread reflects whether the vendor carries any of the operating liability contractually.
Gross Margin: 70 to 78%

Drilling Analytics and Optimisation Platforms

High value with strong growth at 15.4%. Repetitive unconventional drilling gave these models the sample size they needed, but they sit on aggregation infrastructure a competitor may control. The 8 point spread reflects whether the vendor also owns the underlying data aggregation layer beneath it.
Gross Margin: 60 to 68%

Real-Time Data Acquisition and Aggregation

The volume core and the position that actually matters. It earns solidly and it holds the customer relationship that every application above it depends on entirely. The 8 point spread reflects how many competing vendor systems the platform has already integrated on a given rig.
Gross Margin: 52 to 60%

Historical Well Data Management and Archiving

The strategic watch-out. Compliance archiving is being absorbed into the general enterprise data platforms that operators already own and pay for elsewhere in the business. The 22 point spread separates specialist subsurface data services from the commodity storage that almost any infrastructure provider now supplies.
Gross Margin: 36 to 58%

Ninety One Percent Come Back

The annuity here is exceptionally strong and the reason is operational rather than contractual. Renewal runs at 91%, not because customers are delighted but because an operations centre supervising six rigs cannot function without the data feed it was built around. Cancelling means rebuilding an operating model, retraining engineers and renegotiating with every service company on the rig, which nobody does to save a licence fee.
Stickiness varies enormously by where the software sits in the stack. An aggregation layer wired into nine vendors' systems is effectively permanent once commissioned. An analytics application reading a standard data feed can be swapped between Friday and Monday, and several operators have done exactly that. Vendors frequently price these two positions identically, which understates one and overstates the other considerably.

Buyer profiles have shifted from drilling engineers toward digital and data functions, and the sales approach has not entirely caught up. A drilling engineer asked whether the software would help avoid a stuck pipe. A data leader asks about interoperability, data ownership, egress and whether the platform locks the operator into anything. The second conversation is now deciding the contract, and it is a considerably less comfortable one for incumbent vendors.
advanced-drill-data-management-solutions-market-end-use-penetration-index-1788234617443

Where The Position Really Sits

These are among the four positions where our research anticipates prominent divergence between winners and laggards over the coming forecast period. Each is grounded in the demand model, the regulatory perimeter, and the announced capacity pipeline.
01 / AGGREGATION LAYER OWNERSHIP

Own the plumbing and give away the analytics

A rig generates around 1,400 measurement channels from systems built by companies that compete directly with each other and never designed for interoperability, and normalising that into one coherent stream is the difficult work everything else depends on entirely. A vendor holding that layer sits between the operator and every service company on the rig, while the applications above it can genuinely be replaced over a weekend. Pricing the infrastructure as infrastructure inverts how almost everybody in this sector currently sells it.
02 / LIABILITY PACKAGE DESIGN

Sell the contract, not the autonomy

Autonomous control software grows at 18.6% and runs on just 7% of rigs, and every part of that gap is legal rather than technical, because nobody will accept responsibility for a well control incident an algorithm caused. A supplier arriving with staged authority limits, contractual liability caps, insurance arrangements and a regulator already engaged is selling the thing genuinely blocking the purchase decision. It is a commercial and legal package rather than a software feature, and almost nobody in this sector is building one.
03 / OUTCOME BASED PRICING

Bill against the rig day, not the seat

A deepwater rig day costs around USD 480,000 and this software is still frequently sold on user seats and server licences, which bears no relationship at all to the value delivered or to the number the customer is actually comparing it against. Pricing tied to non-productive time reduction or to wells delivered aligns the vendor with the operator and defends against procurement benchmarking software against other software. Vendors who moved to that basis report higher pricing and easier renewals together.
04 / UNDERSERVED BASIN FOCUS

Go where the wells repeat and nobody is selling

Queensland coal seam gas, Argentine unconventional development and Indian modernisation programmes all drill the repetitive wells that make analytics work properly, and none of them is well served by vendors organised entirely around North American shale and Gulf national companies. Australia grows at 14.6%, the fastest of any country covered, substantially on that repetition alone. Serving these markets needs local presence and patience rather than any product change at all, while everybody else competes hard for the same twenty accounts.

Engagement Snapshot From the Field

A live engagement with an industry participant carrying material or product regulatory and market exposure ahead of a defining policy shift, showing how our research translates into a defensible multi-year portfolio strategy.
MARKET MINDS ADVISORY · CLIENT ENGAGEMENT SUMMARY
Advanced Drill Data Management Solutions Producer Strategic Portfolio Review and Transition Roadmap 2026·Investment Scenario on Advanced Drill Data Management Solutions Exposure Evaluation 2025-26
CLIENT PROFILE
An independent drilling software vendor supplying real-time analytics to operators across North America and the North Sea, with annual recurring revenue in the tens of millions of dollars and renewal rates well below the category benchmark (client-reported, unverified by MMA). The product was technically well regarded and repeatedly displaced by competitors at contract renewal. Nobody understood why.
STRATEGIC CHALLENGE
Customers praised the analytics and then switched vendors anyway, usually within a single renewal cycle and often to a technically weaker product. Management had responded by accelerating feature development, which improved reviews and changed nothing about retention. They needed to understand what was actually deciding the renewal conversation. Feature parity was clearly not the issue.
MMA APPROACH
MMA reconstructed every renewal and every loss across four years, mapping each against where the client's software sat in the customer's data architecture and who controlled the aggregation layer beneath it. Forty-seven expert interviews with drilling engineers, data leaders, procurement staff and competing vendors established what made a platform difficult to remove and what made one easy.
KEY FINDINGS
  1. Every account lost sat above an aggregation layer controlled by a competitor, and every account retained sat on infrastructure the client had integrated itself.
  2. Switching the client's analytics took a customer under 2 weeks, while replacing an aggregation layer took 9 months and nobody attempted it.
  3. The client had priced its analytics and its aggregation identically, despite the switching costs differing between them by roughly an order of magnitude.
  4. Data leaders rather than drilling engineers decided 3 of every 4 renewals, and the client's sales organisation had no relationship with any of them.
CLIENT PROFILE
An independent drilling software vendor supplying real-time analytics to operators across North America and the North Sea, with annual recurring revenue in the tens of millions of dollars and renewal rates well below the category benchmark (client-reported, unverified by MMA). The product was technically well regarded and repeatedly displaced by competitors at contract renewal. Nobody understood why.
STRATEGIC CHALLENGE
Customers praised the analytics and then switched vendors anyway, usually within a single renewal cycle and often to a technically weaker product. Management had responded by accelerating feature development, which improved reviews and changed nothing about retention. They needed to understand what was actually deciding the renewal conversation. Feature parity was clearly not the issue.
MMA APPROACH
MMA reconstructed every renewal and every loss across four years, mapping each against where the client's software sat in the customer's data architecture and who controlled the aggregation layer beneath it. Forty-seven expert interviews with drilling engineers, data leaders, procurement staff and competing vendors established what made a platform difficult to remove and what made one easy.
KEY FINDINGS
  1. Every account lost sat above an aggregation layer controlled by a competitor, and every account retained sat on infrastructure the client had integrated itself.
  2. Switching the client's analytics took a customer under 2 weeks, while replacing an aggregation layer took 9 months and nobody attempted it.
  3. The client had priced its analytics and its aggregation identically, despite the switching costs differing between them by roughly an order of magnitude.
  4. Data leaders rather than drilling engineers decided 3 of every 4 renewals, and the client's sales organisation had no relationship with any of them.
RECOMMENDED STRATEGY
Phase 1: Phase one: build and sell the aggregation layer directly, even where it means integrating competitors' analytics on top of it. Phase 2: Phase two: reprice aggregation well above analytics to reflect the switching cost difference, rather than treating both as one product. Phase 3: Phase three: build relationships with data and digital functions, who now decide most renewals and were never being called on.
OUTCOME
Within six quarters the client held the aggregation layer in a majority of its accounts and renewal rates rose to near the category benchmark (client-reported, unverified by MMA). Analytics revenue per account fell and total revenue per account rose. Two competitors now run their applications on the client's infrastructure.

Frequently Asked Questions

Foundational context covering the market sizes, CAGR, scope, country, region and competition that inform every finding below. This section is provided to cover basics and most often pre-purchase conversations, answered from the MMA Primary Research Dataset.

What is the current size of the Advanced Drill Data Management Solutions Market?

The global advanced drill data management solutions market was valued at USD 2.4 billion in 2025, covering software that acquires, normalises and acts on drilling data. The 2026 figure reaches USD 2.70 billion.

How large will the Advanced Drill Data Management Solutions Market be by 2036?

MMA forecasts USD 8.69 billion by 2036, an increase of USD 5.99 billion over the 2026 base. That represents an expansion multiple of 3.22 times across the forecast period.

What is the CAGR for the Advanced Drill Data Management Solutions Market 2026 to 2036?

The base case compound annual growth rate is 12.4%, with a bull case at 13.7% and a bear case at 11.1%. Historical growth between 2020 and 2025 ran at 11.0%.

Which segment is growing fastest?

Autonomous drilling control software grows at 18.6%, half again the market rate of 12.4%, though it runs on only 7% of rigs because liability is unresolved. Analytics platforms follow at 15.4%.

Who are the major companies in the Advanced Drill Data Management Solutions Market?

SLB, Halliburton, Baker Hughes, NOV and Pason Systems lead on rigs under active data contract, with combined CR5 of 44%. Integrated service groups and independent specialists hold different positions.

Which country is growing fastest?

Australia grows fastest at 14.6%, on Queensland coal seam gas programmes drilling the repetitive wells that analytics work best against. South Asia and Pacific leads regionally at 14.6%.

Report Segmentation Architecture

The full report scope spans multiple orthogonal segmentation dimensions, with cross-tabulated demand data provided for each dimension pair. Coverage extends further to regional breakdowns, trend trajectories, and the competitive detail needed to support segment-level decision-making.

By Solution Function

  • Real-Time Data Acquisition and Aggregation
  • Drilling Analytics and Optimisation Platforms
  • Well Planning and Engineering Data Systems
  • Historical Well Data Management and Archiving
  • Autonomous Drilling Control Software
  • Remote Operations Centre Platforms

By End-Use Industry

  • Onshore Unconventional Drilling
  • Offshore and Deepwater Operations
  • National Oil Company Programmes
  • Drilling Contractor Fleets
  • Geothermal Well Construction
  • Mining and Exploration Drilling

By Commercial Dimension

  • Enterprise Fleet Agreements
  • Per Well Subscription
  • Rig Day Rate Bundling
  • Outcome Linked Contracts
  • Perpetual Licence and Maintenance
  • Data and Benchmarking Services

By Region

  • North America
  • Western Europe
  • East Asia
  • South Asia and Pacific
  • Latin America
  • Middle East and Africa
  • Eastern Europe

Scope, Methodology, and Coverage

Every figure in this report is reproducible from documented input assumptions. The scope below maps the historical period, the forecast horizon, the segmentation dimensions, and the countries covered, alongside the underlying primary and qualitative methodology.
Historical Period
2020 to 2025
Forecast Period
2026 to 2036
Base Year
2025 (USD billions; MMA Primary Research Dataset, September 2026)
Market Definition
The advanced drill data management solutions market covers software and data platforms that acquire, normalise, store, analyse and act on drilling data across the well construction process, spanning real-time data acquisition and aggregation, drilling analytics and optimisation platforms, well planning and engineering data systems, historical well data management and archiving, autonomous drilling control software, and remote operations centre platforms. Scope is measured as software licence, subscription and associated service revenue. Excluded are downhole sensors and measurement hardware, surface data acquisition instrumentation, reservoir simulation and seismic interpretation software, production operations platforms, and general enterprise data infrastructure.
Quantitative Units
USD billion, 2025 base year, 2026 to 2036 forecast period
Segmentation Dimensions
Solution function, drilling application, commercial model, region
Regions Covered
North America, Western Europe, East Asia, South Asia and Pacific, Latin America, Middle East and Africa, Eastern Europe
Countries Covered
United States, Canada, United Kingdom, Norway, Netherlands, Romania, Kazakhstan, Poland, China, Japan, Malaysia, India, Australia, Brazil, Argentina, Saudi Arabia, United Arab Emirates, Nigeria
Key Companies Profiled
20 companies across integrated service groups, independent software vendors and drilling contractors
Quantitative Methodology
Primary survey, n=3,800 respondents, Q4 2025, six countries; demand-side model with trade association cross-validation
Qualitative Methodology
47 expert interviews, Q4 2025; applied to validate demand model assumptions, identify emerging dynamics, and assess competitive positioning
Report Format
PDF and XLSX data workbook (Word format preview document)
Publisher
Market Minds Advisory
Report Code
MMA-2026-TEC-561
Published
September 2026
Contact
sales@marketmindsadvisory.com | www.marketmindsadvisory.com

Purchase the full Advanced Drill Data Management Solutions Market Report (2026 to 2036).

The full MMA report on the advanced drill data management solutions market runs to detailed function and regional models across the 2026 to 2036 forecast period, with pricing benchmarks separated by commercial model and position in the data stack. It profiles 20 companies on a consistent rigs under contract basis, covering integrated service groups, independent software vendors and drilling contractors. Switching cost is analysed by architectural position, alongside renewal behaviour observed across operator fleets. Regional chapters cover the seven MMA regions with country-level detail on the eighteen markets surveyed. Primary research draws on a quantitative survey of 3,800 respondents across six countries and 47 expert interviews conducted in Q4 2025.
Pricing benchmarks by commercial model and data stack position
Switching cost analysed by architectural position across operator fleets
Autonomous control adoption tracked against liability contract structures
Twenty company profiles on consistent rigs under contract basis
Remote operations centre deployment mapped by operator and region
Seven regional chapters with eighteen country detail tables

Built For The People Who Decide

From boardroom strategy to bench-side execution, this report is read cover-to-cover by leaders shaping the next decade of their industry, turning demand scenarios, market dynamics and valuation benchmarks into decisions.
CXOs/ Presidents/ VPs/ Managers
M&A and Corporate Development
Strategy Teams and R&D Heads
Procurement and Product Directors
Regulatory and Compliance Leaders
Investor Relations and Equity Analysts