Advance Renal Cell Carcinoma Therapeutics Market
Advance Renal Cell Carcinoma Therapeutics Market: HIF-2alpha Inhibitors and Combination Regimens Reshape Growth Beyond Monotherapy
HIF-2alpha inhibitor approvals and IO-TKI combination regimens are pulling treatment share away from legacy monotherapy, forcing established tyrosine kinase inhibitor makers to defend decades-old oncologist relationships against faster-growing novel-mechanism rivals.
2025 MARKET VALUE$9.8BMarket Size 2025
2036 FORECAST VALUE$25.8BBase Case , 2026 to 2036
CAGR 2026 TO 20369.2 %Bull 10.4% / Bear 7.9%
INCREMENTAL OPPORTUNITY$15.1BNet 10- year value creation
EXPANSION MULTIPLE2.41x2036 value over 2026 base
Strategic Levers
M&A Pipeline
Regional Outlook
Country Rankings
Competitive Intelligence
Segmental Deep-dive
Executive Snapshot and Market Trajectory
Bristol Myers Squibb and Merck built the modern advanced renal cell carcinoma therapeutics category on checkpoint inhibitor monotherapy and TKI combination regimens, and HIF-2alpha inhibitors are now the fastest-growing answer to oncologists facing treatment-resistant disease that older mechanisms cannot reliably control. That shift is reshaping pipeline investment plans.
Merck and Bristol Myers Squibb still command meaningful combined share of the category through decades-old oncologist and payer relationships, while expanding first-line combination adoption keeps growing the addressable treatment pool feeding every manufacturer's pipeline steadily year after year without pause. Rising treatment-resistant and later-line disease incidence has pulled novel-mechanism therapies firmly into mainstream prescribing decisions across major oncology centers worldwide overall today.
Five companies account for more than half of category revenue, a moderately concentrated structure built on high clinical trial and regulatory barriers, and the order shifts gradually as oncology centers standardise around manufacturers offering both combination and novel-mechanism pipelines under one long-term treatment protocol established well in advance. Expanding combination regimen adoption and tightening later-line treatment guidelines, still accelerating, will determine how quickly novel-mechanism therapies capture share from monotherapy-focused incumbents worldwide overall. That unfolds gradually.
Market Definition
This market covers pharmaceutical therapeutics used to treat advanced and metastatic renal cell carcinoma, including immune checkpoint inhibitors, tyrosine kinase inhibitors, mTOR inhibitors, HIF-2alpha inhibitors, and combination regimens. It excludes therapies for early-stage localized renal cell carcinoma and surgical or ablative treatment procedures.
Base Year Value
$9.8B in 2025 (MMA Primary Research Dataset, August 2026)
Forecast Period
2026 to 2036, eleven discrete annual values
CAGR
9.2% base case. Bull 10.4%. Bear 7.9%.
Fastest Growth Segment
HIF-2alpha Inhibitors: 15.4% CAGR
Fastest Growth Country
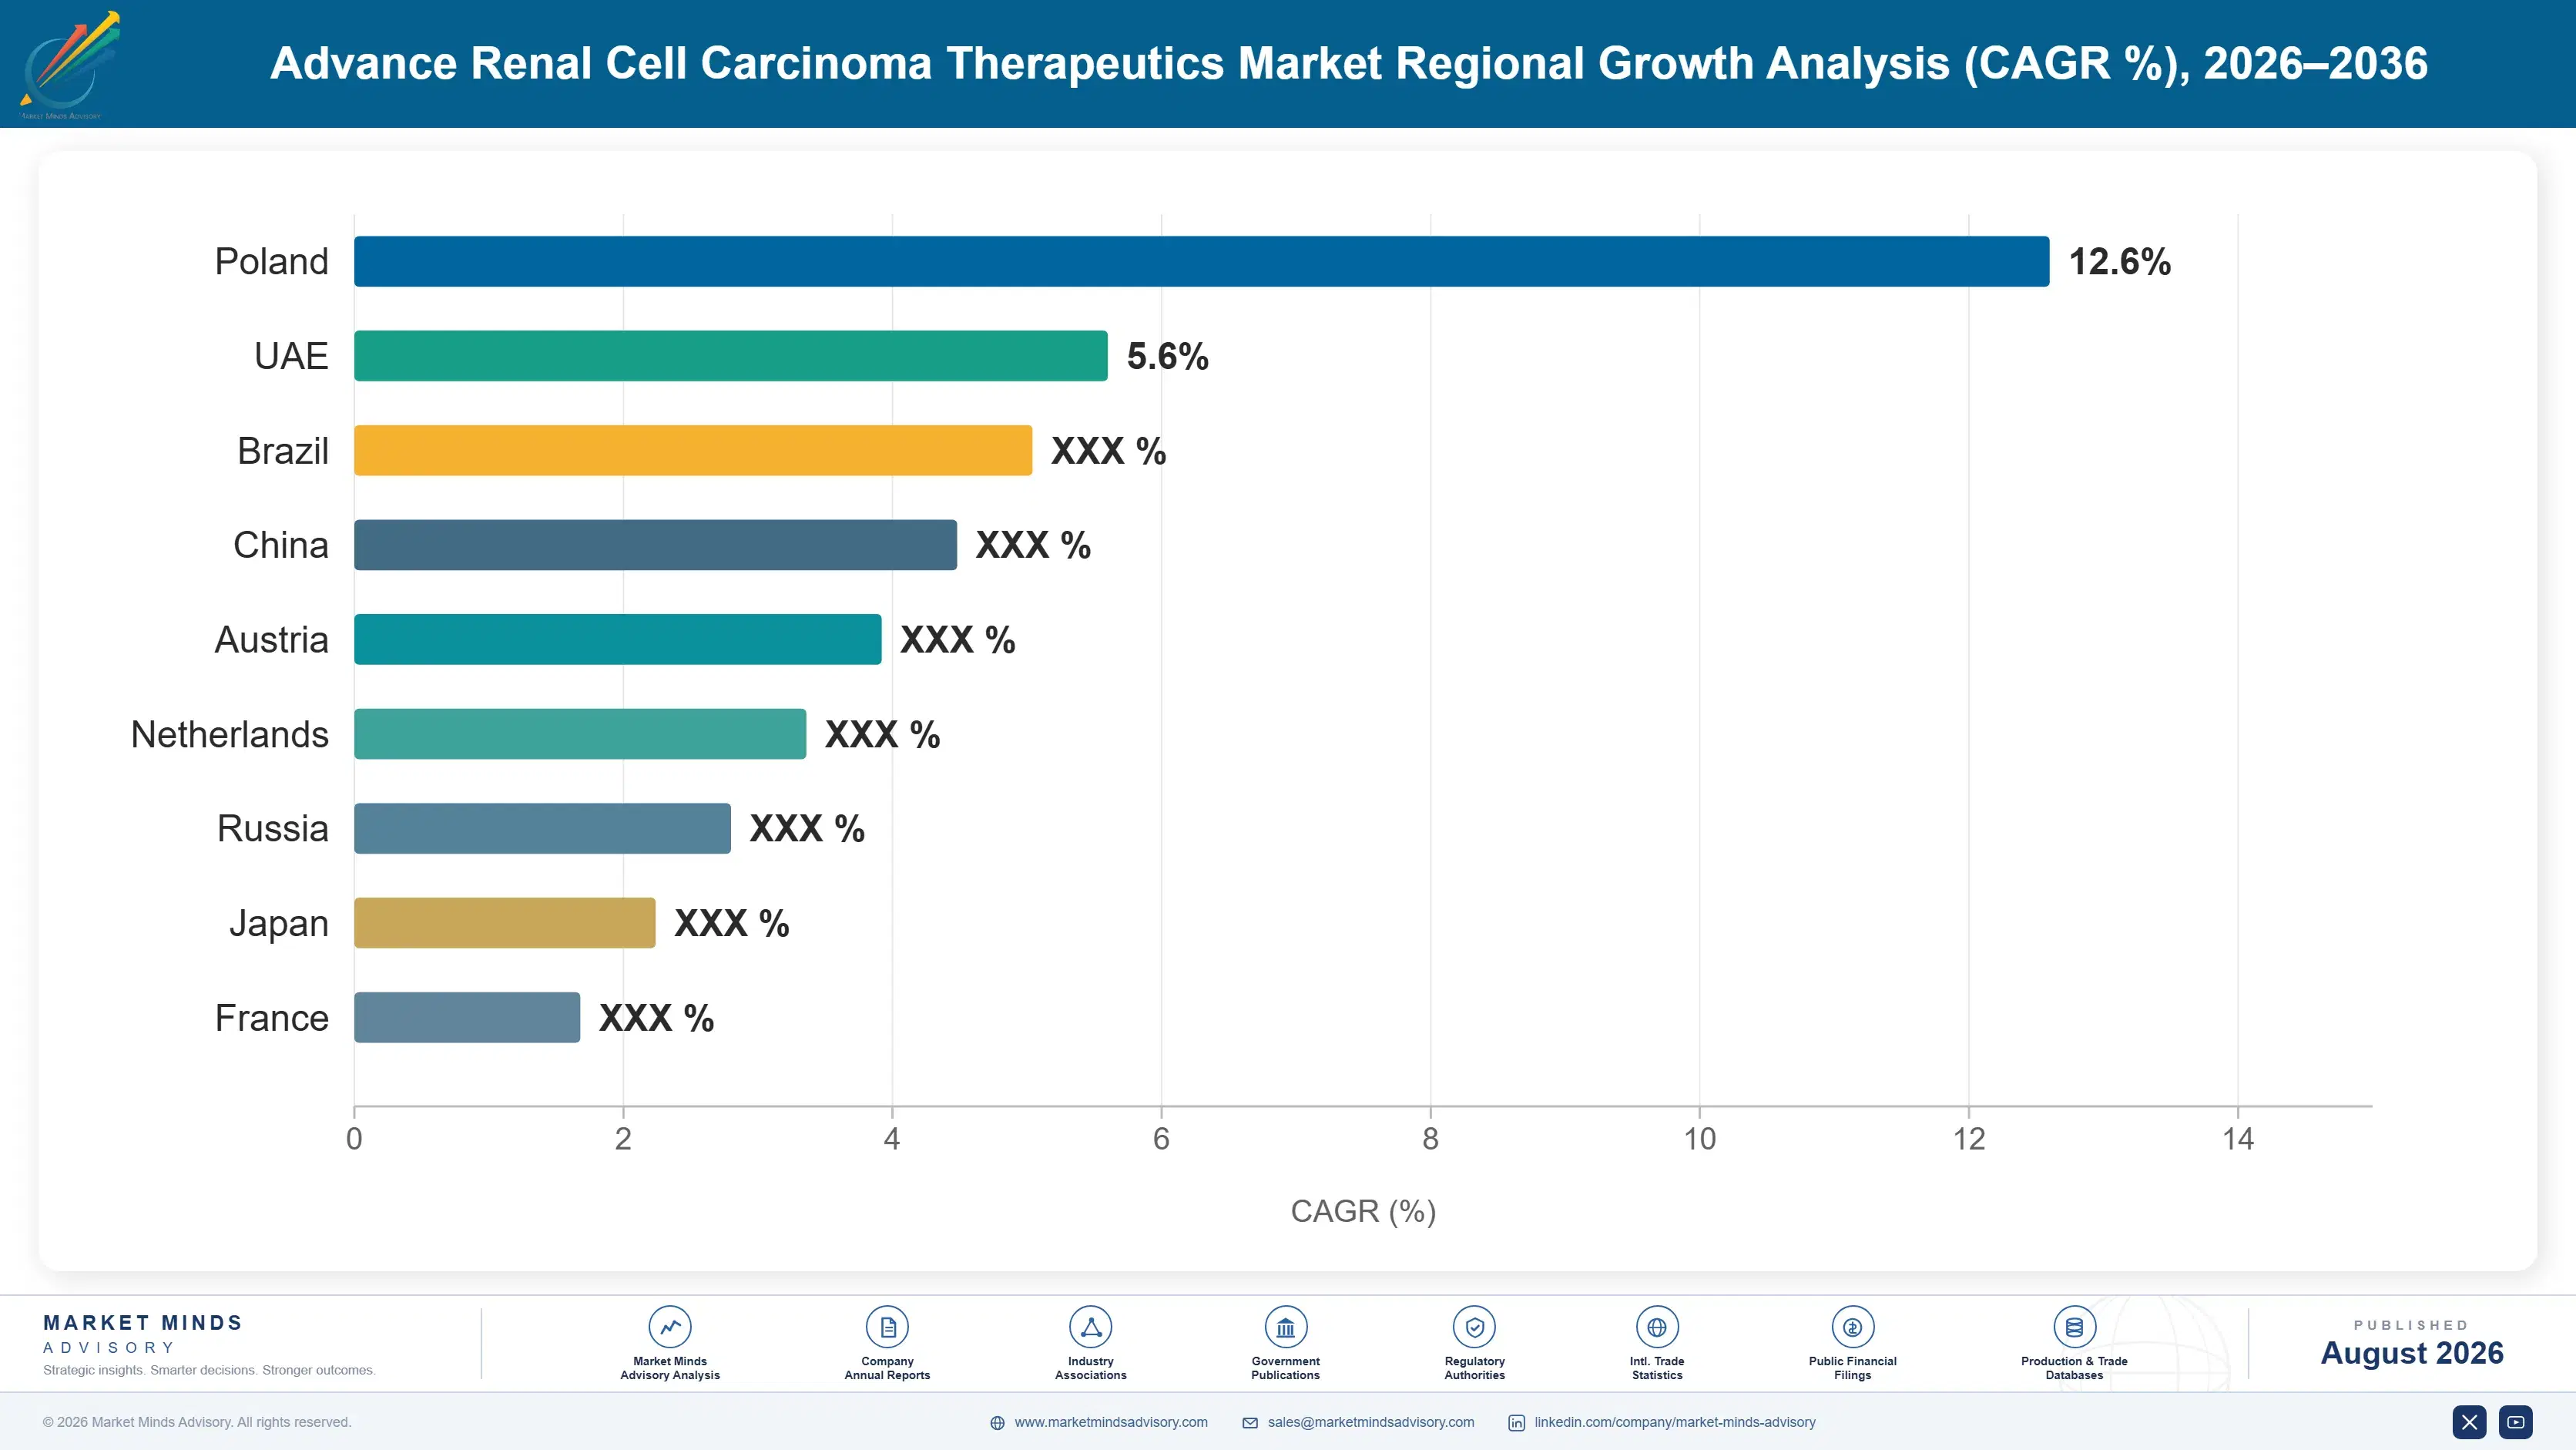
China: 10.8% CAGR
Fastest Growth Region
South Asia and Pacific: 11.2% CAGR
Largest Region
North America: 32% of 2025 global value
Market Leaders
Bristol Myers Squibb, Merck & Co, Exelixis, Eisai, Pfizer. Source: MMA Analysis based on company annual reports.
Primary Survey
n=3,800 procurement and R&D decision-makers, Q4 2025, six countries
Methodology
Demand-side build-up, cross-validated against public data, 47 expert interviews
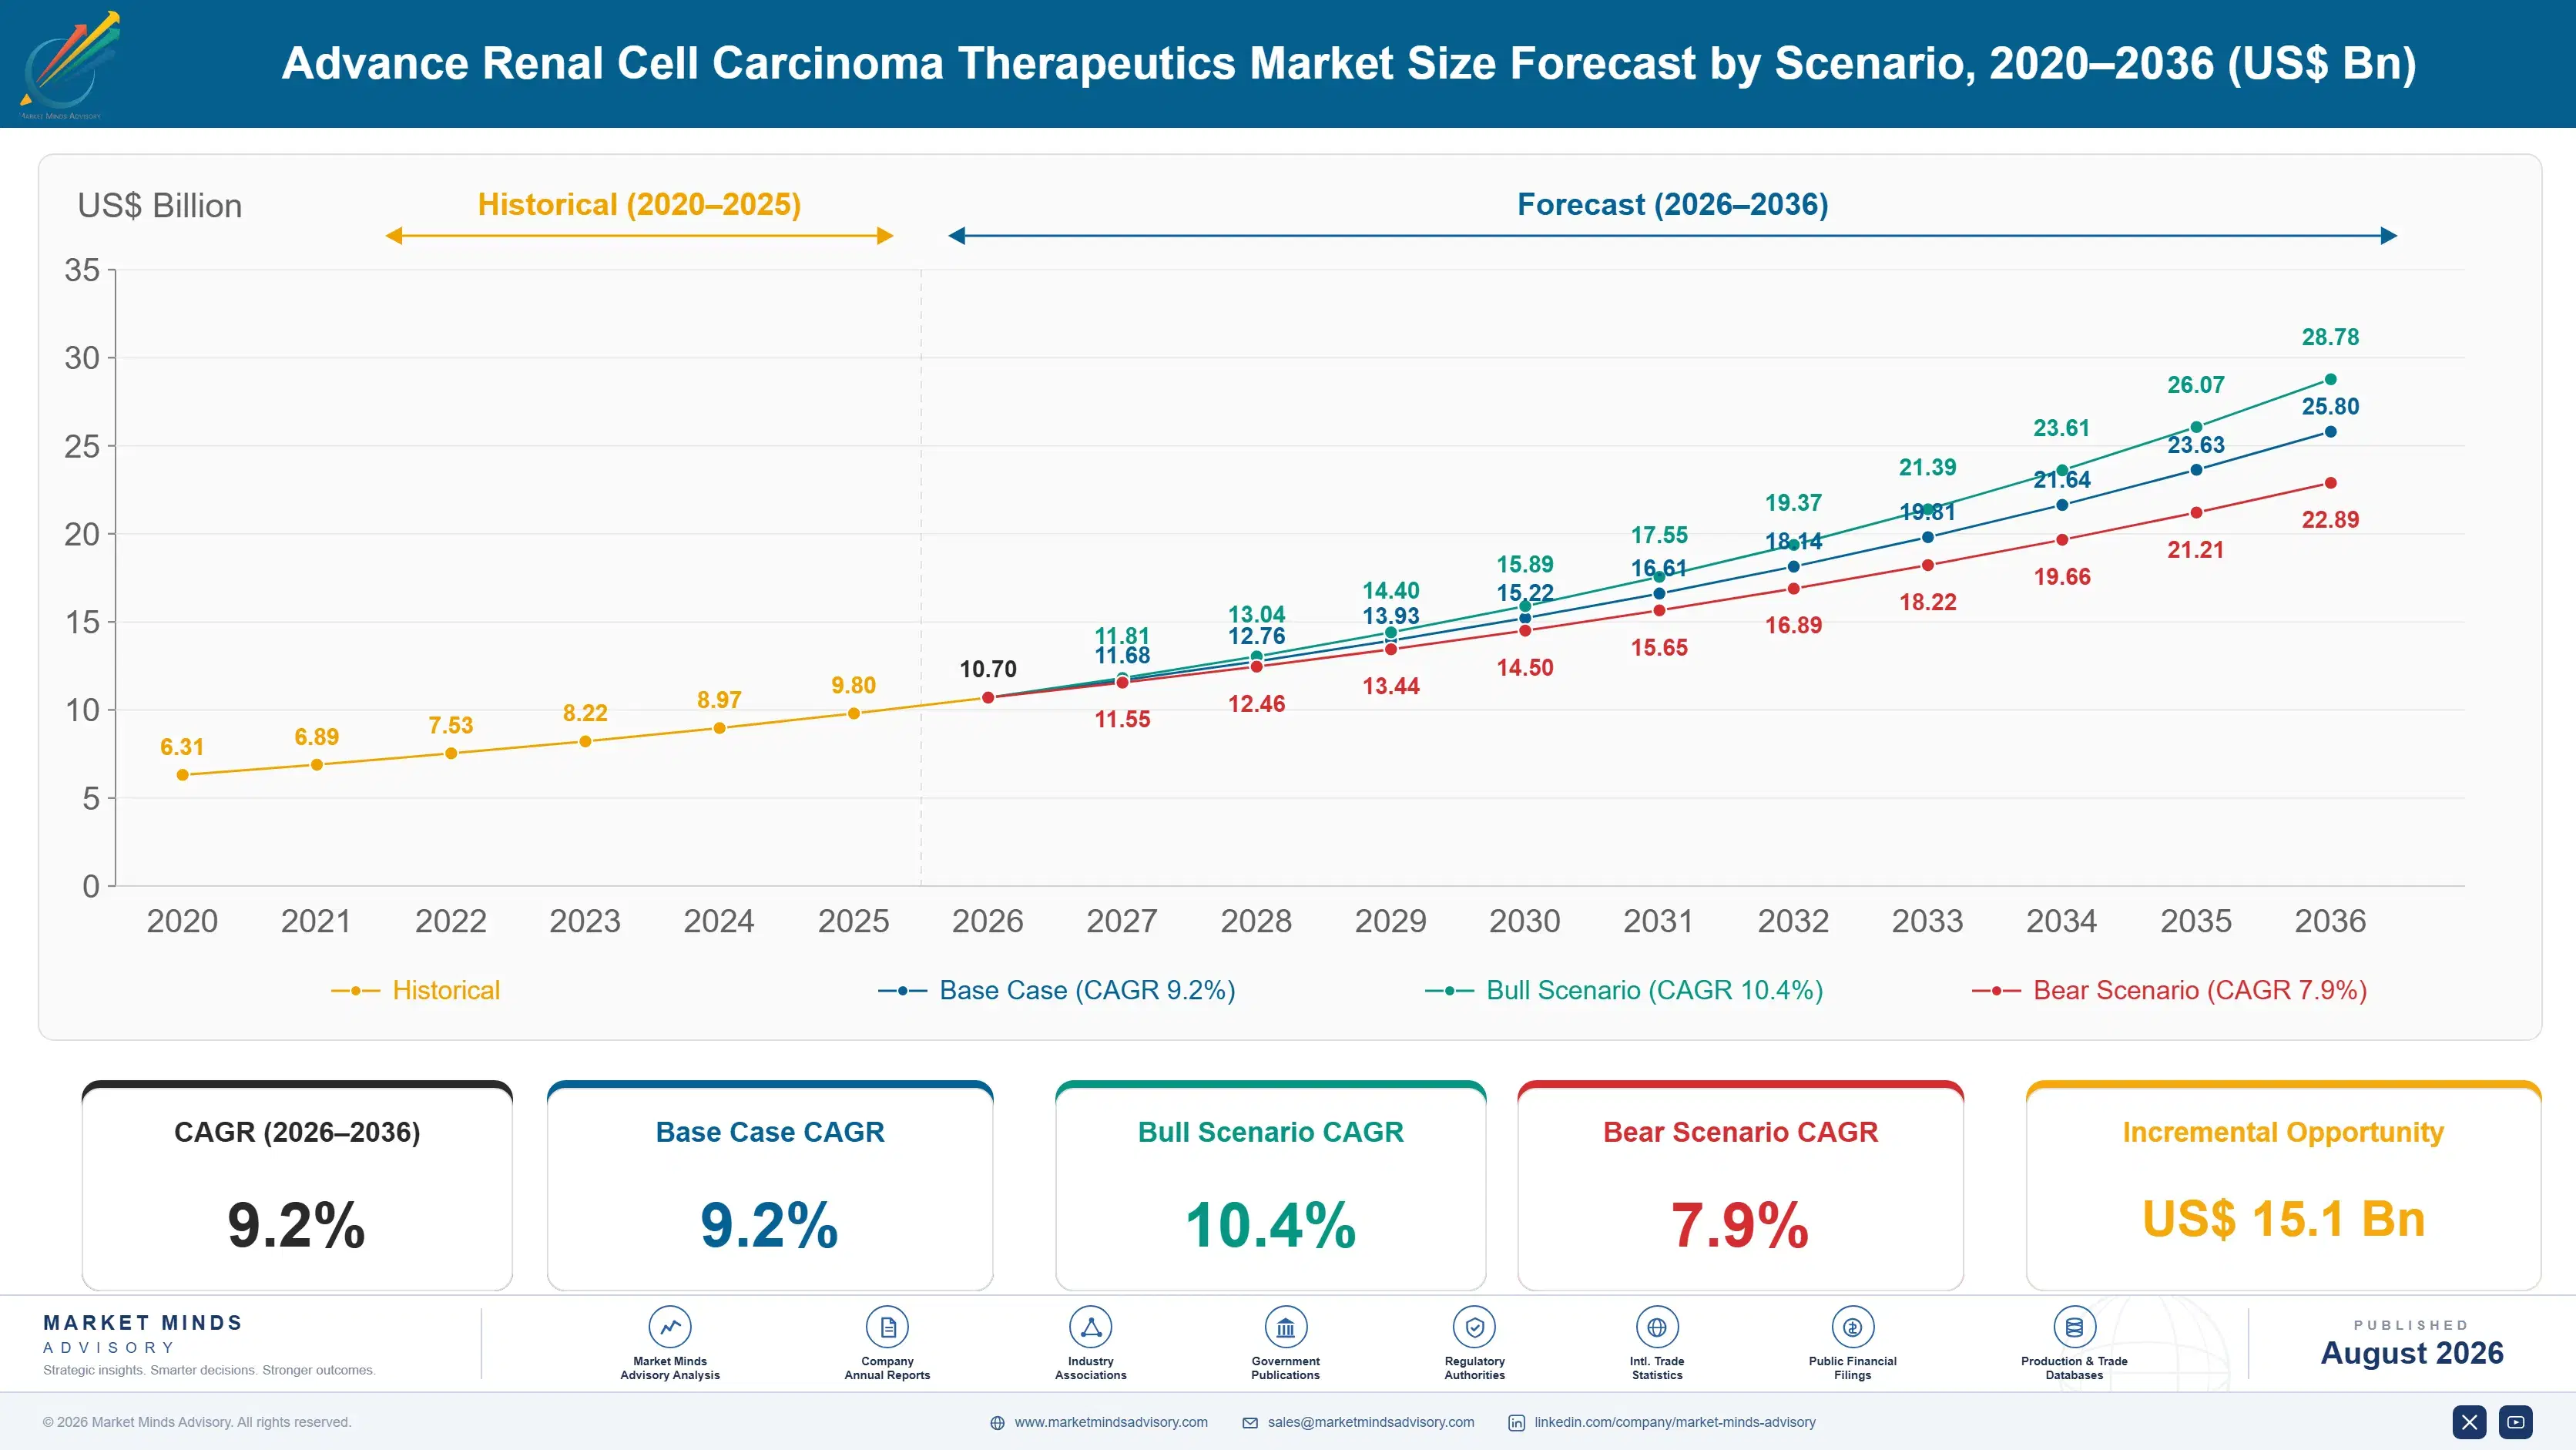
Advance Renal Cell Carcinoma Therapeutics Market Forecast Scenarios

Between 2020 and 2025, the market grew at a historical rate near 8.0 percent, tracking steady global adoption of first-line combination regimens and gradual checkpoint inhibitor uptake across major oncology markets, with HIF-2alpha inhibitors remaining a comparatively small share of total treatment volume through most of this recovery period. Manufacturers largely maintained existing pipeline investment rather than accelerating aggressively during this window.
The base case assumes 9.2 percent annual growth through 2036, built on three mechanisms: expanding first-line combination regimen adoption replacing legacy monotherapy, rising treatment-resistant disease incidence driving novel-mechanism prescribing, and Asian oncology capacity expansion pulling forward treatment volume well ahead of comparable Western case growth still under gradual modernisation across most major producing regions, tracked closely across every affected treatment center through the ten-year outlook period overall each cycle reviewed.
A bull case near 10.4 percent depends on HIF-2alpha inhibitor label expansion holding firm across major markets still finalizing earlier-line approval pathways today. The bear case near 7.9 percent reflects continued payer caution around premium combination regimen cost differentials pushing some treatment decisions toward legacy monotherapy alternatives in cost-constrained healthcare systems worldwide, particularly across reimbursement-constrained regions.
The base case assumes 9.2 percent annual growth through 2036, built on three mechanisms: expanding first-line combination regimen adoption replacing legacy monotherapy, rising treatment-resistant disease incidence driving novel-mechanism prescribing, and Asian oncology capacity expansion pulling forward treatment volume well ahead of comparable Western case growth still under gradual modernisation across most major producing regions, tracked closely across every affected treatment center through the ten-year outlook period overall each cycle reviewed.
A bull case near 10.4 percent depends on HIF-2alpha inhibitor label expansion holding firm across major markets still finalizing earlier-line approval pathways today. The bear case near 7.9 percent reflects continued payer caution around premium combination regimen cost differentials pushing some treatment decisions toward legacy monotherapy alternatives in cost-constrained healthcare systems worldwide, particularly across reimbursement-constrained regions.
Monotherapy Legacy Meets Combination Regimen Demand
Advanced renal cell carcinoma therapeutics has quietly become a treatment-sequencing specification decision as much as a pharmacology one. The core function, controlling tumor progression and extending survival, has not changed, but oncologists increasingly weigh resistance-mechanism coverage alongside raw response rate when planning new treatment protocols across every affected oncology center. That shift already shapes new prescribing evaluations.
TOP 5 CONCENTRATION58% CR5revenue share held by five largest global manufacturers
AVERAGE TREATMENT COST$186,000 per patient yeartypical annual treatment cost, per patient covered overall
LEADING PRESCRIBING COUNTRYUSA, 34%share of global treatment value, by home country
COMBINATION REGIMEN SHARE58% of prescriptionsshare of total first-line prescriptions using combination therapy
LATER-LINE TREATMENT SHARE31% of revenueshare of category revenue from second-line and later treatment
CLINICAL TRIAL COST SHARE44% of COGSinput cost weight from clinical trial and regulatory investment
Commercial behaviour splits by treatment line and disease complexity. Mainstream first-line treatment still relies heavily on established combination regimens that have performed reliably for years, while treatment-resistant and later-line cases increasingly specify novel-mechanism therapies where resistance-pathway coverage and durability carry meaningfully higher clinical consequence for continuous patient management. Distributors report this split sharpening recently across every affected treatment channel.
The next decade turns on whether combination regimen manufacturers can build sufficient novel-mechanism pipeline depth to compete for treatment-resistant prescribing while defending their core first-line relationships against rising specialty pipeline competitors. Manufacturers that solve both problems stand to capture share from an installed monotherapy base that has dominated renal cell carcinoma treatment specification for more than two decades of continuous, uninterrupted clinical use worldwide. That transition will not happen overnight across most major producing markets.
"Nobody switches a stable patient off a working regimen. The growth is entirely in the patients who progress, and that population is growing faster than anyone modeled five years ago."
Market Trends
Novel HIF-2alpha inhibitor mechanisms have moved from niche later-line applications into mainstream specification for treatment-resistant renal cell carcinoma, where oncologists value durable response rates that legacy TKI and checkpoint mechanisms cannot deliver entirely on their own. Merck and Eisai have both reported expanded prescribing across major oncology centers in recent years, driven by physicians specifically seeking regimens that extend progression-free survival in resistant disease. Clinical data from oncology centers has documented meaningfully longer treatment duration versus comparable later-line alternatives across audited case series reviewed by MMA analysts each cycle overall.
Market Impact: Reaches 34% of new pipeline investment
First-Line Combination Guidelines Expand Standard-of-Care Adoption
Major oncology guideline bodies have converted combination regimen prescribing from a discretionary physician preference into a formally recommended first-line standard for covered patient risk categories, forcing treatment centers to specify combination protocols capable of delivering consistently superior outcomes versus legacy monotherapy. Bristol Myers Squibb and Exelixis have both expanded dedicated combination regimen portfolios targeting the more than 140,000 newly diagnosed advanced cases treated annually according to oncology registry data reviewed by MMA analysts. Treatment centers in Europe and Asia have announced comparable protocol expansions over the past eighteen months alone, reflecting the guideline shift's broadening geographic reach.
Market Impact: Adds 300-plus new treatment centers
Market Opportunities and Growth Drivers
Rising Treatment-Resistant Disease Incidence Drives Novel-Mechanism Volume
Global treatment-resistant and later-line renal cell carcinoma incidence continues rising considerably as first-line survival extends, a shift that has fundamentally changed therapeutic demand patterns since resistant-disease treatment commands meaningfully higher value per patient than routine first-line therapy. Manufacturers have responded with dedicated novel-mechanism development programmes specifically engineered for these higher-margin treatment requirements. An estimated 34 percent of new therapeutic pipeline investment now targets resistant-disease and later-line applications, up considerably from a meaningfully smaller share just a decade earlier, reflecting accelerating clinical need across major healthcare markets worldwide each year overall.
Market Impact: Loses 6 to 9% share
Expanding Diagnostic Screening Drives Earlier Treatment Initiation
Global imaging and diagnostic screening capacity continues expanding across major healthcare systems, a shift that has fundamentally changed treatment initiation patterns since earlier detection identifies advanced cases sooner than historical diagnostic pathways allowed. Manufacturers have responded by developing dedicated earlier-line treatment protocols specifically engineered for these expanding diagnosed populations. New oncology diagnostic capacity is projected to grow considerably across major markets through the coming decade, each expanded programme requiring treatment protocols capable of sustaining higher patient volume than historical case detection allowed, across nearly every major oncology hub, tracked closely worldwide.
Market Impact: Limits adoption to 22% of practices
Market Restraints and Challenges
High Treatment Cost Slows Reimbursement-Constrained Adoption
Many healthcare systems in reimbursement-constrained markets find the cost premium of novel combination and HIF-2alpha regimens over legacy monotherapy economically difficult, even where the survival benefit case is well documented. The root cause is that national reimbursement policy, not clinical outcome data, drives most treatment selection decisions in cost-constrained systems, and lower-reimbursement healthcare systems see meaningfully slower novel-therapy adoption than well-reimbursed systems facing the same clinical decision. Manufacturers have responded by developing tiered access programmes and patient assistance schemes specifically intended to narrow the cost gap across multiple reimbursement-constrained healthcare markets.
Market Impact: Lifts resistant-disease share 19%
Toxicity Management Requirements Slow Combination Adoption
Combination regimen prescribing requires specialized toxicity monitoring and management protocols that many smaller oncology practices lack, since combination-related adverse event management differs meaningfully from conventional monotherapy protocols most practices already maintain. This restricts combination regimen adoption among smaller community oncology practices serving fragmented, resource-constrained patient populations rather than large academic center accounts. Manufacturers have responded by developing simplified monitoring protocols and dedicated clinical support teams specifically intended to lower the adoption barrier across multiple underserved practice settings worldwide, particularly among smaller regional oncology providers with limited staffing and clinical support resources.
Market Impact: Covers 140,000-plus new cases annually
3 additional market trends, 4 additional growth drivers, and 3 additional restraints and challenges are covered in the full report. Contact sales@marketmindsadvisory.com to access the complete intelligence.
Segment CAGR and Growth Architecture
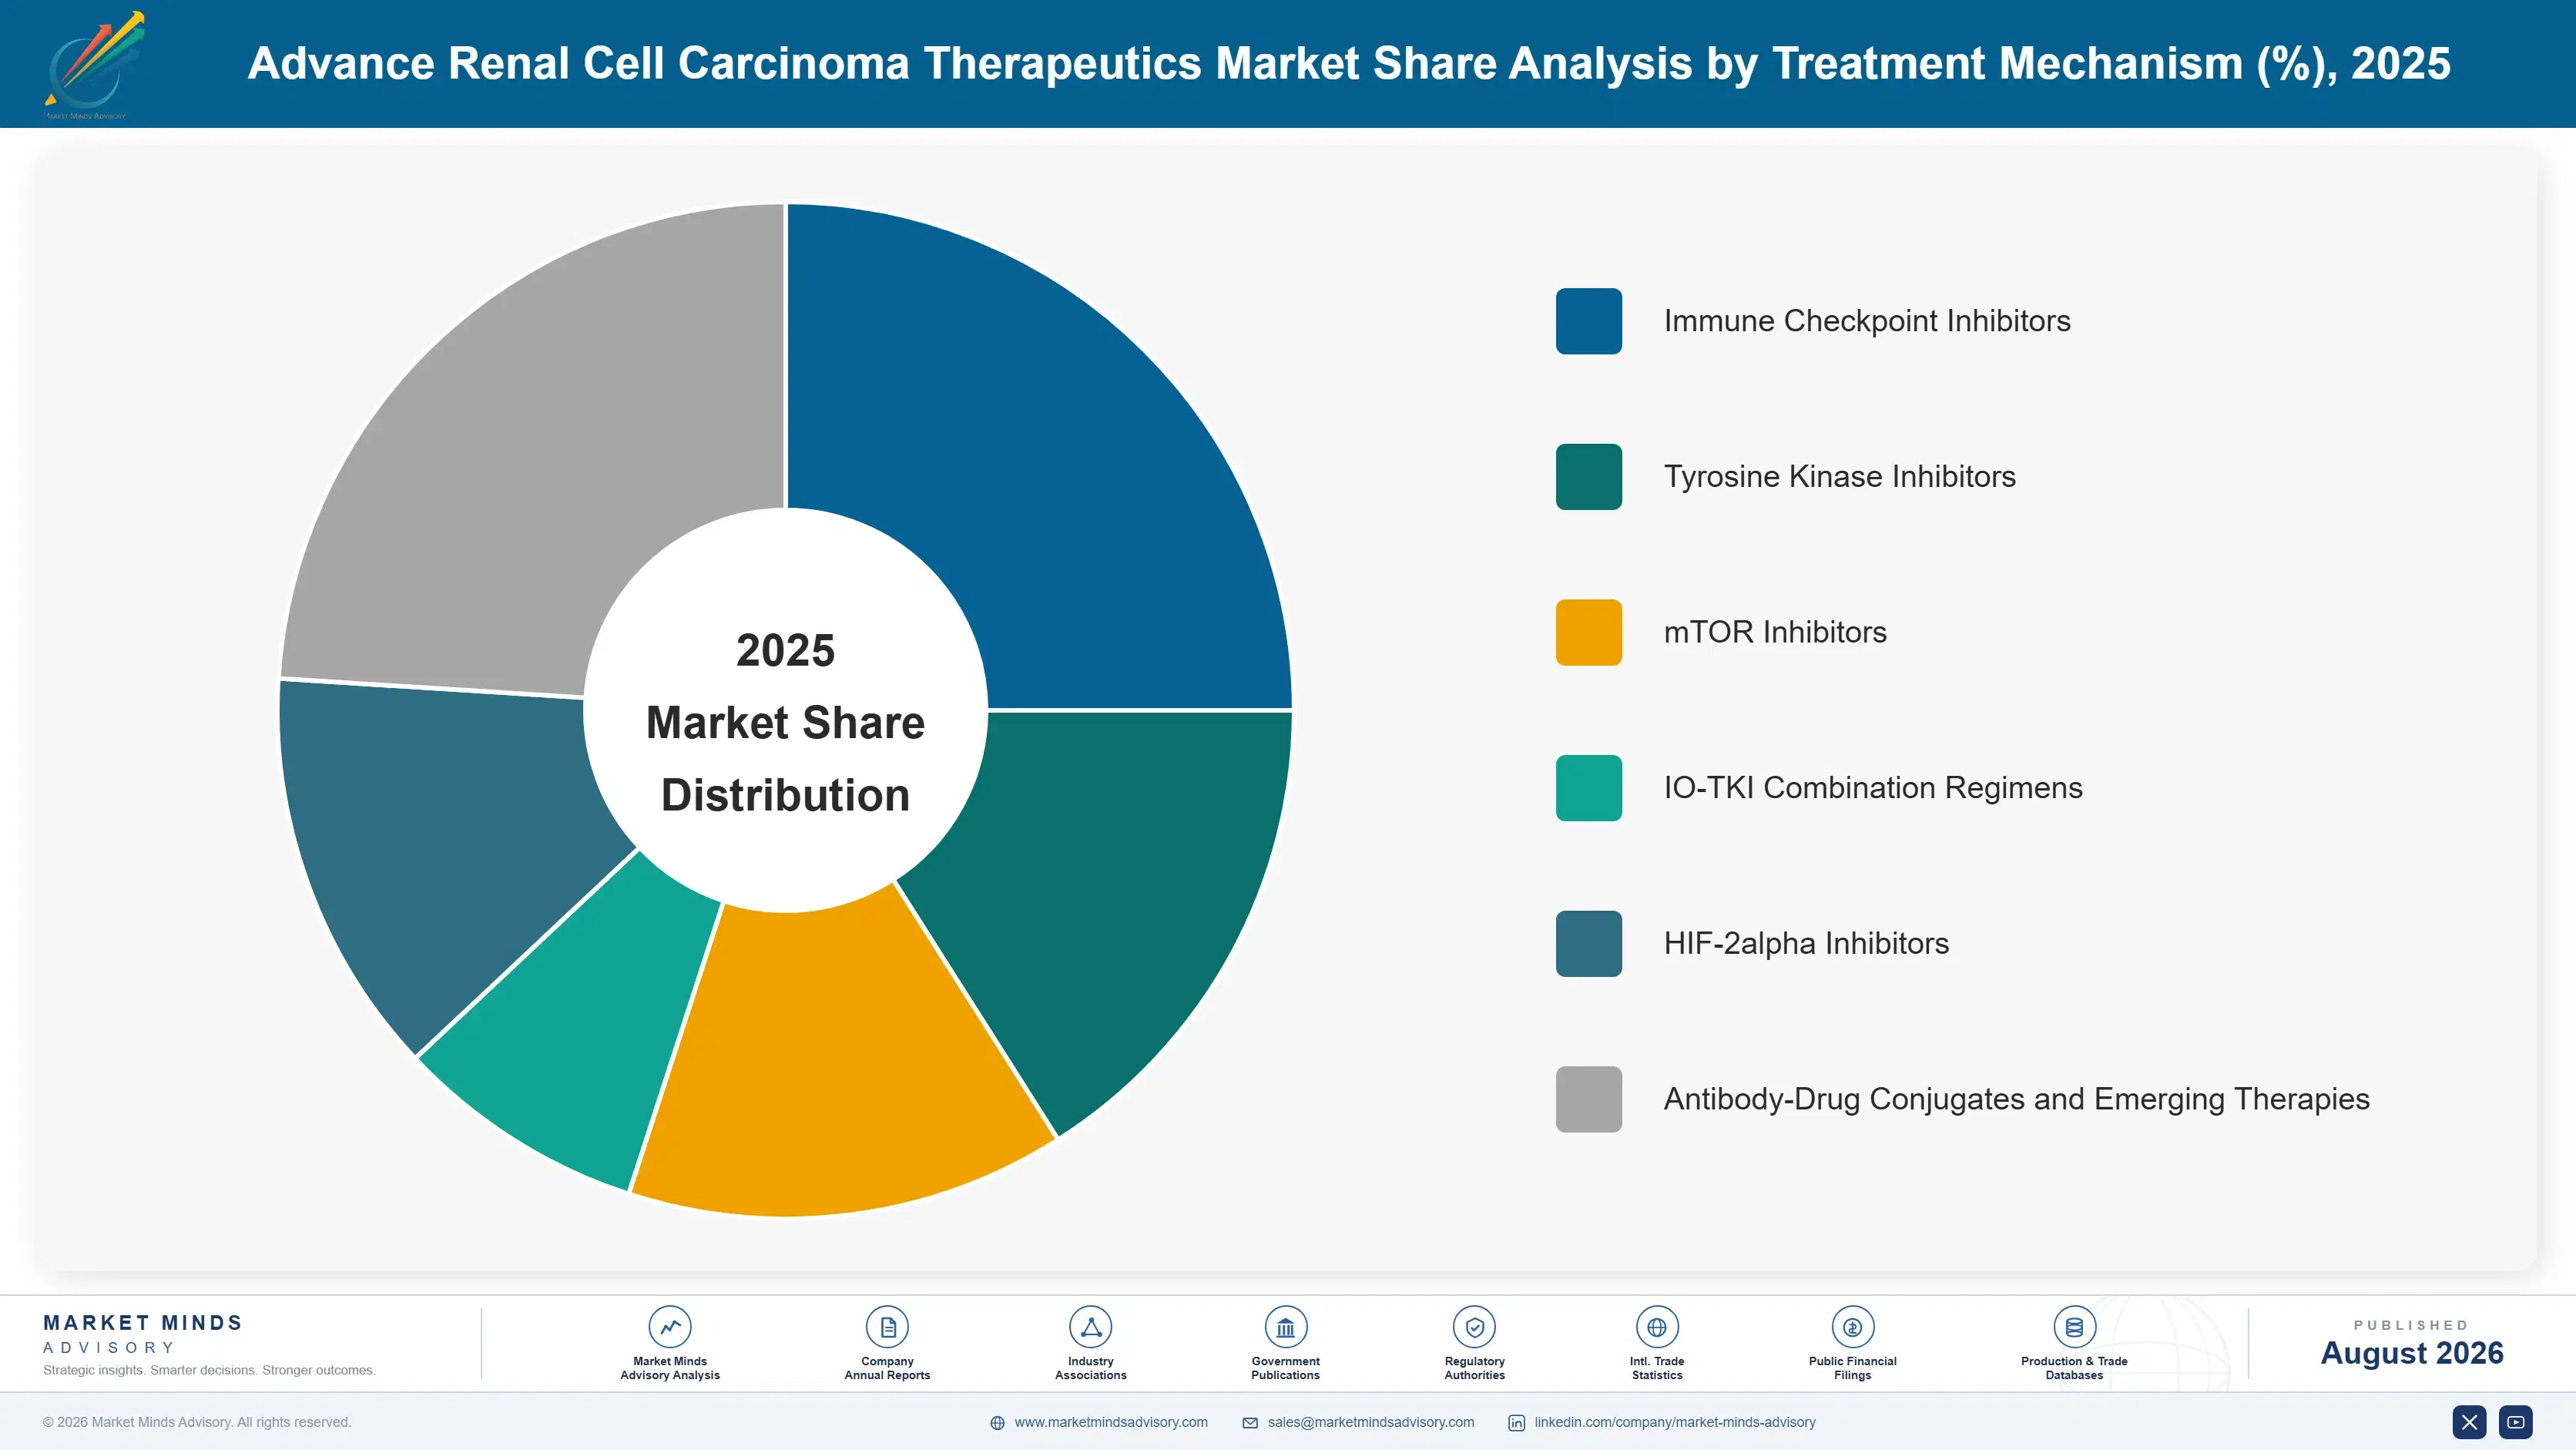
Segmentation follows treatment mechanism, the classification oncologists, treatment centers, and payers already use to distinguish checkpoint inhibitor, TKI, mTOR, and HIF-2alpha therapy categories across every regimen type this report covers, spanning both mature combination and rapidly emerging novel-mechanism categories overall, each cycle, from routine first-line management through next-generation resistant-disease platforms now scaling worldwide overall.

HIF-2alpha Inhibitors
HIF-2alpha inhibitors are the fastest-growing category as oncologists increasingly specify novel-mechanism therapy for treatment-resistant disease unresponsive to legacy checkpoint and TKI mechanisms. The mechanism targets a distinct hypoxia-driven signaling pathway rather than direct angiogenesis or immune checkpoint blockade, delivering meaningfully durable responses than commodity-mechanism alternatives typically achieve in comparable resistant-disease applications. Merck and Eisai both compete directly in this segment, each pursuing expanded prescribing relationships with major oncology centers worldwide. Growth concentrates among centers treating resistant and later-line disease, though broader first-line adoption still depends on expanding label indications across major regulatory jurisdictions each year. Manufacturers investing early in this transition stand to capture disproportionate share as reimbursement pathways broaden across major producing regions.
CAGR 15.4%
IO-TKI Combination Regimens
IO-TKI combination regimens grow fastest among established treatment categories as oncology guideline bodies increasingly recommend combination protocols for first-line treatment where response depth outperforms legacy monotherapy alternatives. Bristol Myers Squibb and Merck both hold significant positions in this segment, backed by years of clinical trial investment and established oncologist prescribing relationships across major healthcare systems worldwide. Growth concentrates among centers specifically adopting guideline-recommended first-line protocols, though manufacturers face rising competitive pressure from novel-mechanism entrants in applications where resistance-pathway coverage weighs more heavily than combination breadth on prescribing decisions. Manufacturers with modular, lower-cost regimens increasingly win these smaller-scale prescribing decisions ahead of larger legacy competitors, particularly across community oncology practice networks and secondary treatment centers.
CAGR 12.6%
Full segment breakdown across 6 segments available in the complete report.
Regional Architecture and Country Demand Map
North America accounts for nearly a third of global advanced renal cell carcinoma therapeutics revenue, reflecting the United States' concentration of premium drug pricing and first-to-market launch timing, while South Asia and Pacific posts the fastest regional growth on expanding oncology treatment capacity nationwide, supported by rising healthcare funding.
North America
The United States drives the overwhelming majority of regional demand through its concentration of premium drug pricing and its position as the first-launch market for nearly every major novel therapy approved in recent years. Bristol Myers Squibb and Merck both maintain deep domestic commercial and clinical trial presence serving this demand directly. Rising treatment-resistant disease incidence has meaningfully expanded demand for novel-mechanism therapy across multiple regional academic oncology networks in particular. Canada contributes a smaller but stable share, with provincial healthcare systems gradually expanding coverage for combination therapy following patterns already established south of the border. Mexico's demand ties increasingly to cross-border oncology referral networks serving both domestic and regional patients.
Share: 32% | CAGR: 8.6% (2026 to 2036)
Western Europe
Germany anchors regional demand through its well-established oncology treatment infrastructure and long-standing manufacturer distributor relationships built over decades of continuous therapeutic development. The United Kingdom follows closely, with National Health Service combination regimen coverage expansion driving accelerated first-line prescribing across oncology centers nationwide. France and Italy contribute meaningful shares tied to established oncology treatment centers and long-standing manufacturer relationships across the continent. Regional growth trails North America and East Asia because much of Western Europe's combination regimen adoption is already relatively mature, reflected in slower incremental growth than most other global regions currently show, a pattern regional manufacturers expect to persist through the coming decade of continued gradual modernisation overall.
Share: 24% | CAGR: 7.6% (2026 to 2036)
Regional intelligence for 5 additional markets available in the complete report: East Asia, South Asia and Pacific, Latin America, Middle East and Africa, Eastern Europe. Contact sales@marketmindsadvisory.com.

Where Renal Cell Carcinoma Therapeutics Margin Concentrates
Margin follows treatment-line positioning and clinical evidence depth, not prescription volume alone. Manufacturers who win early oncologist adoption relationships lock in multi-year treatment protocol inclusion that legacy monotherapy makers increasingly struggle to match once the prescribing relationship is fully established across the treatment center's entire oncology programme, a dynamic reshaping how manufacturers prioritise clinical evidence investment.
Winning Early Academic Oncologist Adoption Relationships
Manufacturers who secure prescribing adoption during an academic center's early protocol design phase typically retain that center's prescribing volume across successive treatment generations, since switching manufacturers mid-protocol requires costly clinical retraining that centers avoid wherever possible across every affected oncology department. Merck and Bristol Myers Squibb have both invested heavily in early engagement with academic oncologists specifically to secure these relationships ahead of formal guideline competitions. Early-established manufacturers typically capture pricing 8 to 14 percent above what competitive late-stage positioning would produce, reflecting the switching-cost advantage built into the relationship timing itself.
Market Impact: Adds an 8 to 14% pricing edge overall
Building Patient Support and Access Programmes
Manufacturers who pair novel therapy with proprietary patient support and reimbursement navigation programmes capture higher-margin recurring prescriptions beyond the drug cost itself, since treatment centers increasingly value integrated access support when justifying premium therapy specification internally to formulary committees each budget cycle. Exelixis and Eisai both run dedicated patient access teams that work directly with customer oncology practice administrators throughout the specification process. This access support layer has widened effective programme margins by an estimated 10 to 16 percentage points versus therapy-only supply agreements documented in recent investor materials, across multiple major markets.
Market Impact: Widens margins by 10 to 16 points overall
Regional Clinical Trial Capacity for Local Regulatory Eligibility
Manufacturers establishing local clinical trial capacity in markets with national regulatory content requirements, notably China's National Reimbursement Drug List inclusion pathway, secure preferential access to reimbursement decisions tied to those same requirements set by policy and periodically revised over time. Several global manufacturers have expanded Chinese clinical operations specifically to capture this advantage ahead of competitors still supplying from import-based positions and lacking comparable local presence of their own. Local clinical programmes report winning an estimated 17 to 24 percent more reimbursement approvals in content-linked markets than comparable import-dependent competitors face each year.
Market Impact: Wins 17 to 24% more reimbursement approvals overall
Building Real-World Outcome Registry Evidence Programmes
Manufacturers who develop structured real-world outcome registries documenting long-term patient results capture higher-margin premium therapy revenue while shortening the evidence-gathering timeline for payers otherwise facing lengthy independent outcome studies entirely on their own. Bristol Myers Squibb and Merck both maintain dedicated real-world evidence teams that work directly with academic investigators throughout the evidence generation and publication process. Registry-backed therapies have historically captured 18 to 25 percent higher formulary approval rates than therapies lacking comparable published outcome data, based on comparable prior programme patterns MMA has tracked closely across multiple recent registry cycles.
Market Impact: Lifts formulary approval rate 18 to 25% overall
Who Controls the Margin Pool
CR5 sits at 58 percent, moderately concentrated for a specialty oncology category this size, reflecting the high clinical trial and regulatory barriers that keep new entrants limited. Bristol Myers Squibb and Merck hold the largest positions, with a meaningful gap to Exelixis and Eisai in the next tier of established challengers.
Current competitive activity centres on three fronts: established combination regimen makers defending first-line oncologist relationships while expanding into novel-mechanism pipelines, specialty biotech firms racing to expand resistant-disease prescribing ahead of incumbent responses, and all major players investing in real-world evidence registries targeting rapidly tightening formulary documentation requirements worldwide. Payers increasingly compare manufacturers on total lifecycle cost rather than list price alone.
Emerging pressure comes from Chinese domestic oncology therapeutics manufacturers, who have moved from basic generic TKI supply toward broader novel-mechanism ambitions as domestic reimbursement expansion creates a genuine opening against established Western incumbents defending their core franchise across every major treatment category. Rankings shift most at the treatment-line level rather than globally: a manufacturer's dominant position in first-line combination therapy carries limited weight in resistant-disease treatment, where durability and mechanism-coverage credentials increasingly determine prescribing outcomes each budget cycle.

Competitive Moat and Risk Dimensions
Moat: Full-Portfolio Treatment-Line Coverage
Bristol Myers Squibb's full-portfolio checkpoint inhibitor and combination product line, spanning first-line through later-line treatment, lets it win comprehensive treatment center and oncologist prescribing agreements that single-mechanism competitors cannot match, giving it a durable revenue base across nearly every applicable treatment line and patient volume tier worldwide.
Risk: HIF-2alpha Pipeline Underexposure
Bristol Myers Squibb's comparatively limited presence in HIF-2alpha inhibitor mechanisms leaves it exposed to Merck and Eisai capturing the fastest-growing segment of resistant-disease prescribing, a gap that could widen as novel-mechanism adoption continues expanding faster than Bristol Myers Squibb's core combination franchise grows each year overall.
Moat: Novel-Mechanism Pipeline Scale
Merck's novel-mechanism pipeline scale and deep relationships with academic oncology centers give it a clinical evidence advantage in resistant-disease treatment that combination-focused competitors have struggled to match on comparable large treatment center tenders across multiple developed healthcare markets worldwide, reinforced by continued clinical trial investment.
Risk: Premium Pricing Reimbursement Exposure
Merck's premium novel-mechanism pricing leaves it exposed to reimbursement pushback in cost-constrained healthcare systems, a gap that could widen as payer scrutiny continues expanding faster than Merck's core pricing power grows each year. That exposure has grown more pronounced amid recent formulary policy shifts across multiple regions.
Players Tracked
Prominent Players
Bristol Myers Squibb
Merck & Co
Exelixis
Eisai
Pfizer
Other Key Players
Ipsen SA
Bayer AG
AVEO Pharmaceuticals Inc
Novartis AG
Roche Holding AG
Astellas Pharma Inc
AstraZeneca plc
Eli Lilly and Company
Sanofi SA
GSK plc
Takeda Pharmaceutical Company
Johnson & Johnson
Regeneron Pharmaceuticals Inc
Incyte Corporation
Jazz Pharmaceuticals plc
Recent Developments
Merck Receives Expanded First-Line Indication for HIF-2alpha Inhibitor
Merck received regulatory approval for an expanded first-line indication of its HIF-2alpha inhibitor in combination with existing standard-of-care regimens, covering an estimated 45,000 additional eligible patients annually across major markets. The approval followed extensive clinical trial data demonstrating improved progression-free survival across participating treatment centers.
Signal: Regulatory bodies are expanding novel-mechanism label indications as clinical evidence accumulates across major oncology markets nationwide.
Bristol Myers Squibb Acquires Specialty RCC-Focused Biotech
Bristol Myers Squibb completed an acquisition of a clinical-stage biotech developing a novel antibody-drug conjugate targeted at treatment-resistant renal cell carcinoma, strengthening its later-line pipeline ahead of rising resistant-disease demand. The deal covers exclusive access to specific conjugate chemistry developed by the acquired company, alongside shared future improvement rights.
Signal: Established combination regimen makers are acquiring specialty pipeline assets to defend against resistant-disease-focused competitors emerging quickly.
Exelixis Extends Ex-US Commercialization Agreement With Ipsen
Exelixis extended its ex-US commercialization agreement with Ipsen for continued distribution of its combination therapy across European and emerging markets, covering an estimated 40 additional countries under the renewed partnership. The extension followed strong sales performance across existing commercialization territories and affiliated regional distribution networks.
Signal: Established manufacturers are extending regional commercialization partnerships to maintain global market access without direct infrastructure investment.
Clinical Trial and Manufacturing Investment Costs
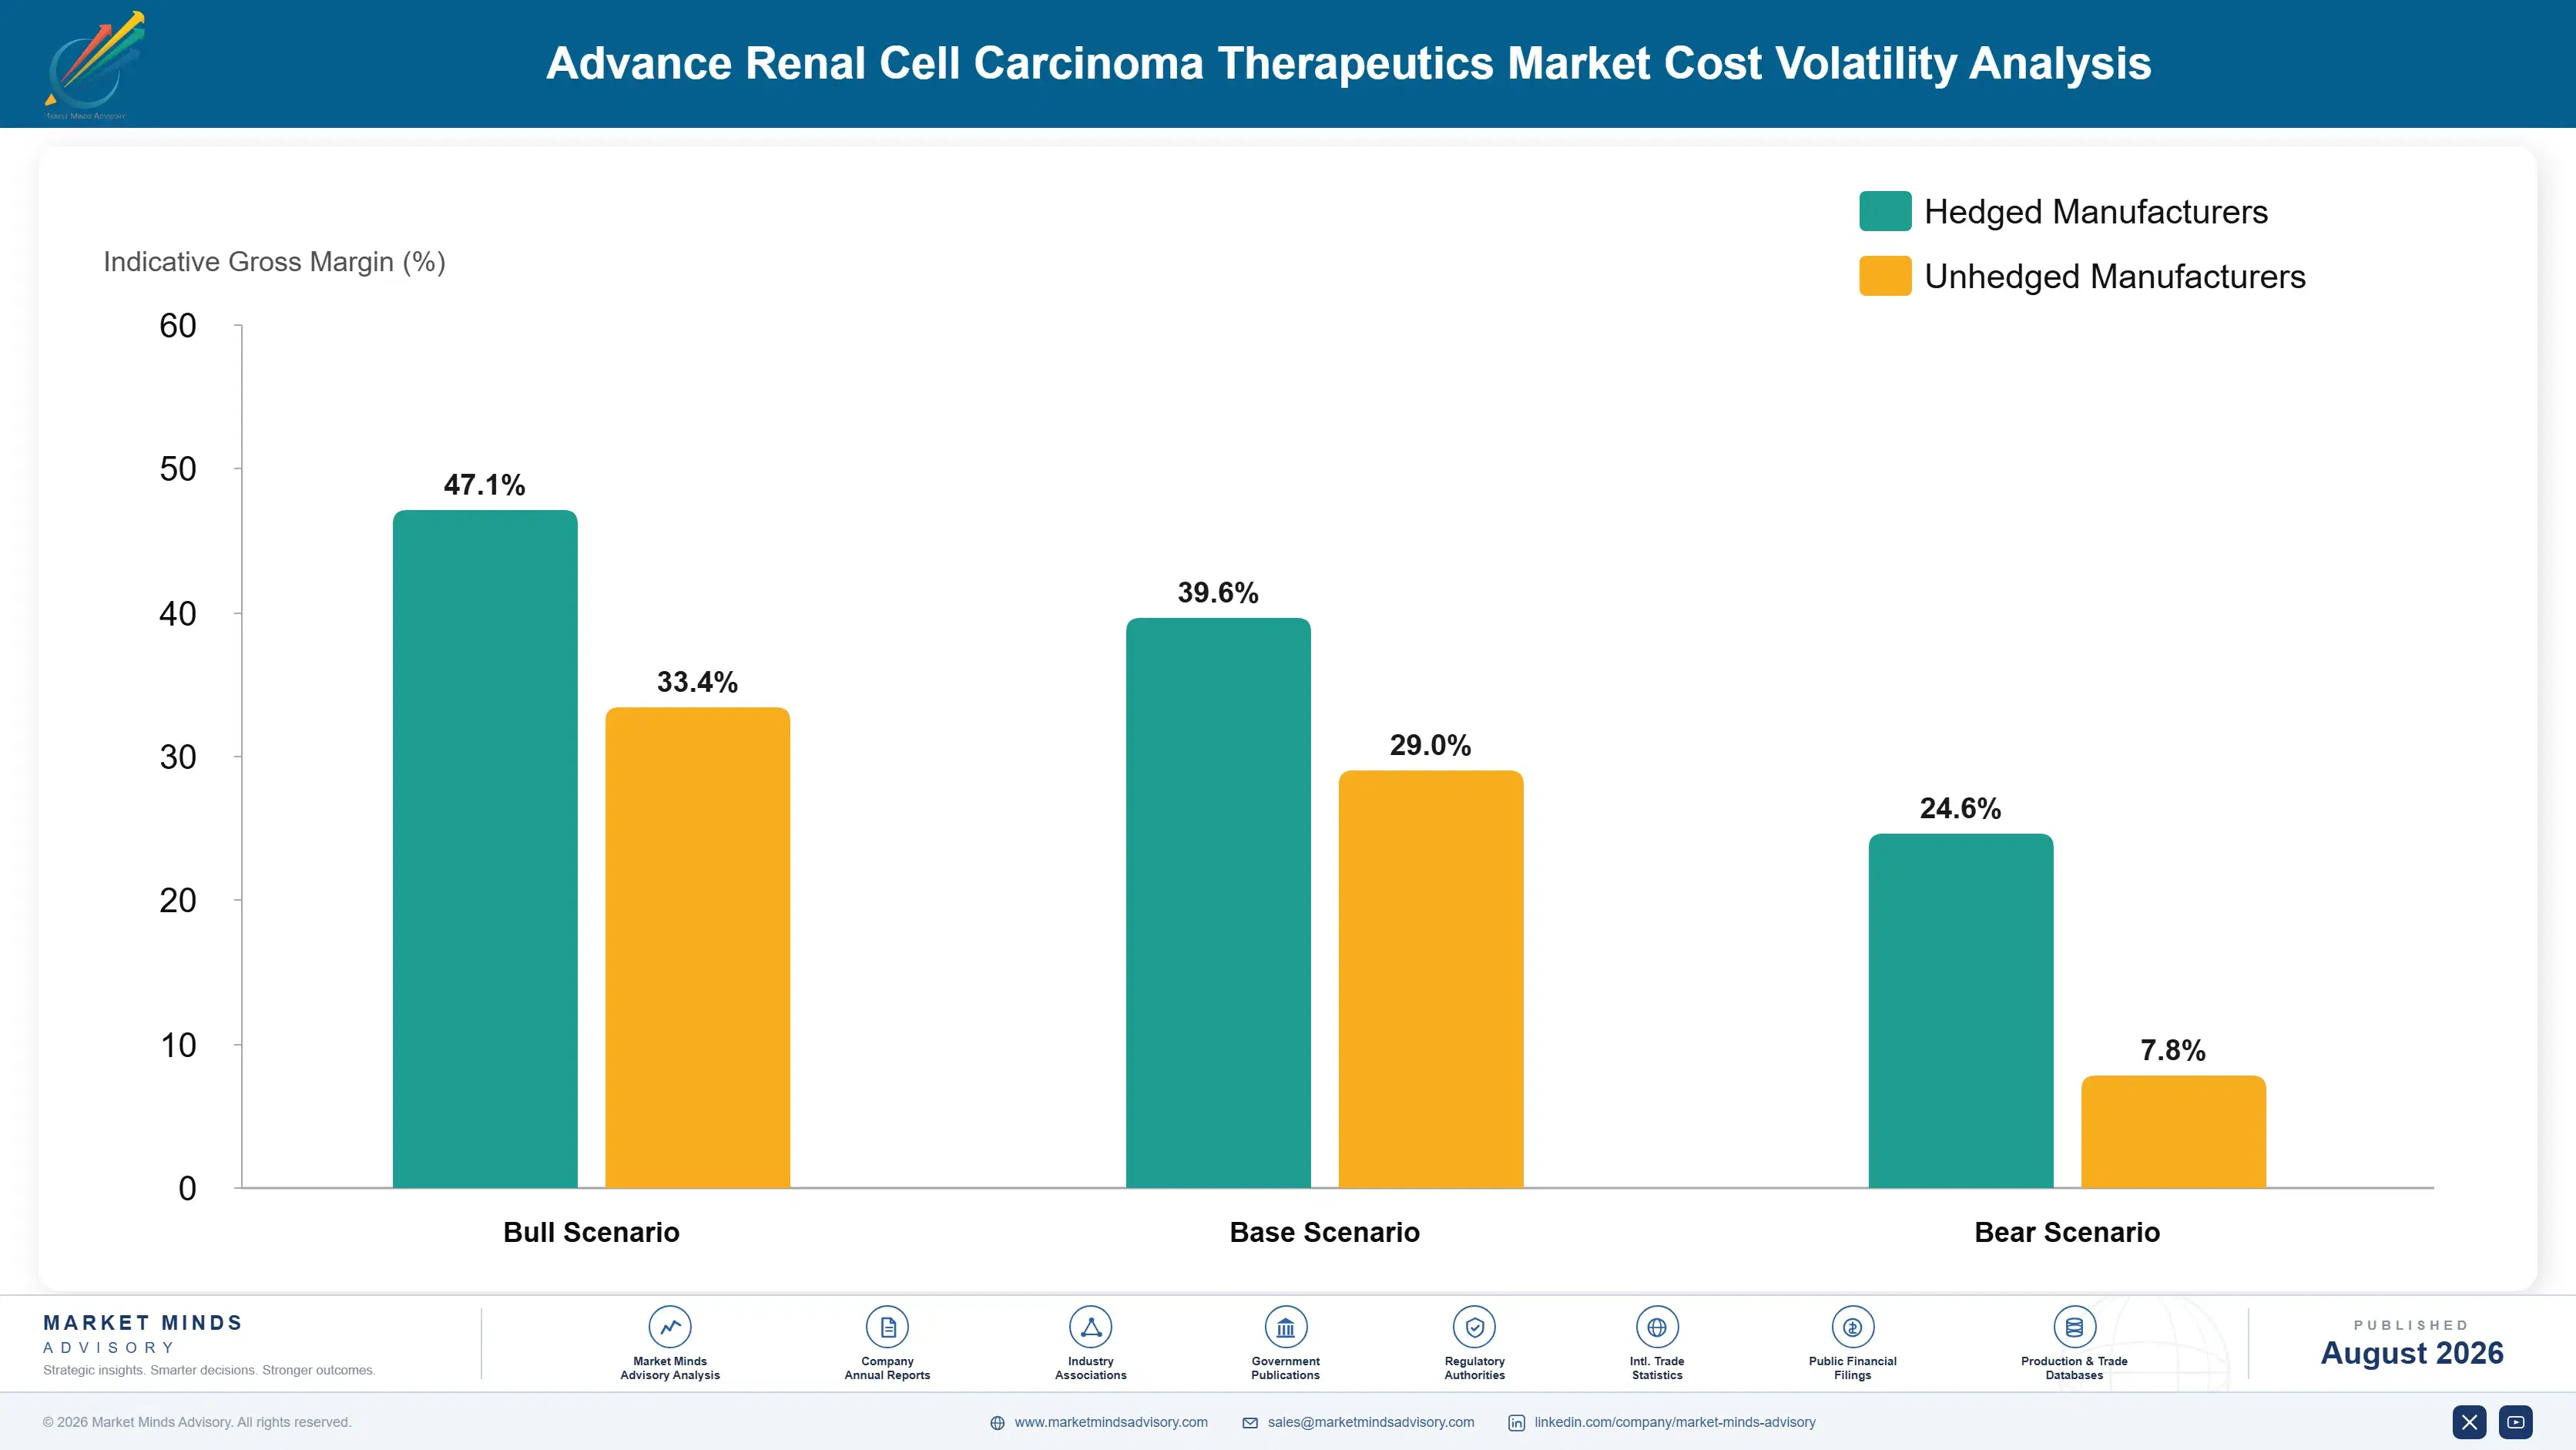
Clinical trial and regulatory investment together represent roughly 44 percent of advanced renal cell carcinoma therapeutics development COGS, sourced from a global base of contract research organizations and a smaller set of specialty biologics manufacturers qualified to regulatory specifications required across every major therapeutic segment worldwide, particularly for novel-mechanism biologics, across every major clinical development hub overall.
Clinical trial cost volatility during 2021 and 2022 pushed development costs up a documented 26 percent according to industry clinical trial cost benchmarking data, forcing several manufacturers to renegotiate multi-year fixed-price contract research agreements signed before the increase took hold across the industry. Biologics manufacturing capacity, particularly relevant to antibody-based and combination therapies, has added further cost pressure given periodic tightness in specialized manufacturing capacity shared with broader biologics end markets.
Exposure varies by manufacturer scale and pipeline mix. Smaller manufacturers reliant on outsourced clinical trial capacity remain most exposed to cost swings given limited negotiating leverage, while larger integrated manufacturers with in-house clinical and manufacturing capability face comparatively more stable development costs tied to scale efficiencies that have expanded considerably over recent years of vertical integration across the industry worldwide.

Long-Term Contract Research Organization Agreements
Larger manufacturers now lock in multi-year contract research organization agreements with fixed scope commitments, insulating development cost from short-term capacity swings that previously forced costly mid-trial renegotiations with research partners across the industry and delayed clinical timelines considerably each development cycle observed across multiple manufacturing regions and supplier tiers worldwide today and abroad each cycle.
In-House Biologics Manufacturing Capability
Several leading manufacturers have built internal biologics manufacturing and quality control capability specifically to reduce dependence on external contract manufacturers for standard and premium applications, trading higher fixed capital investment for greater supply certainty during periods of industry-wide demand and constrained third-party manufacturing capacity across the entire supply chain each fiscal year overall and beyond.
Dual-Sourcing Contract Manufacturing Partners
Manufacturers increasingly qualify two contract manufacturing partners per therapy line rather than one, adding validation cost upfront but avoiding single-supplier exposure during periods of raw material and capacity tightness affecting the broader biologics supply chain simultaneously across multiple concurrent development and testing programmes worldwide each cycle of ongoing procurement planning and budget review overall.
Portfolio Architecture for Margin Defence
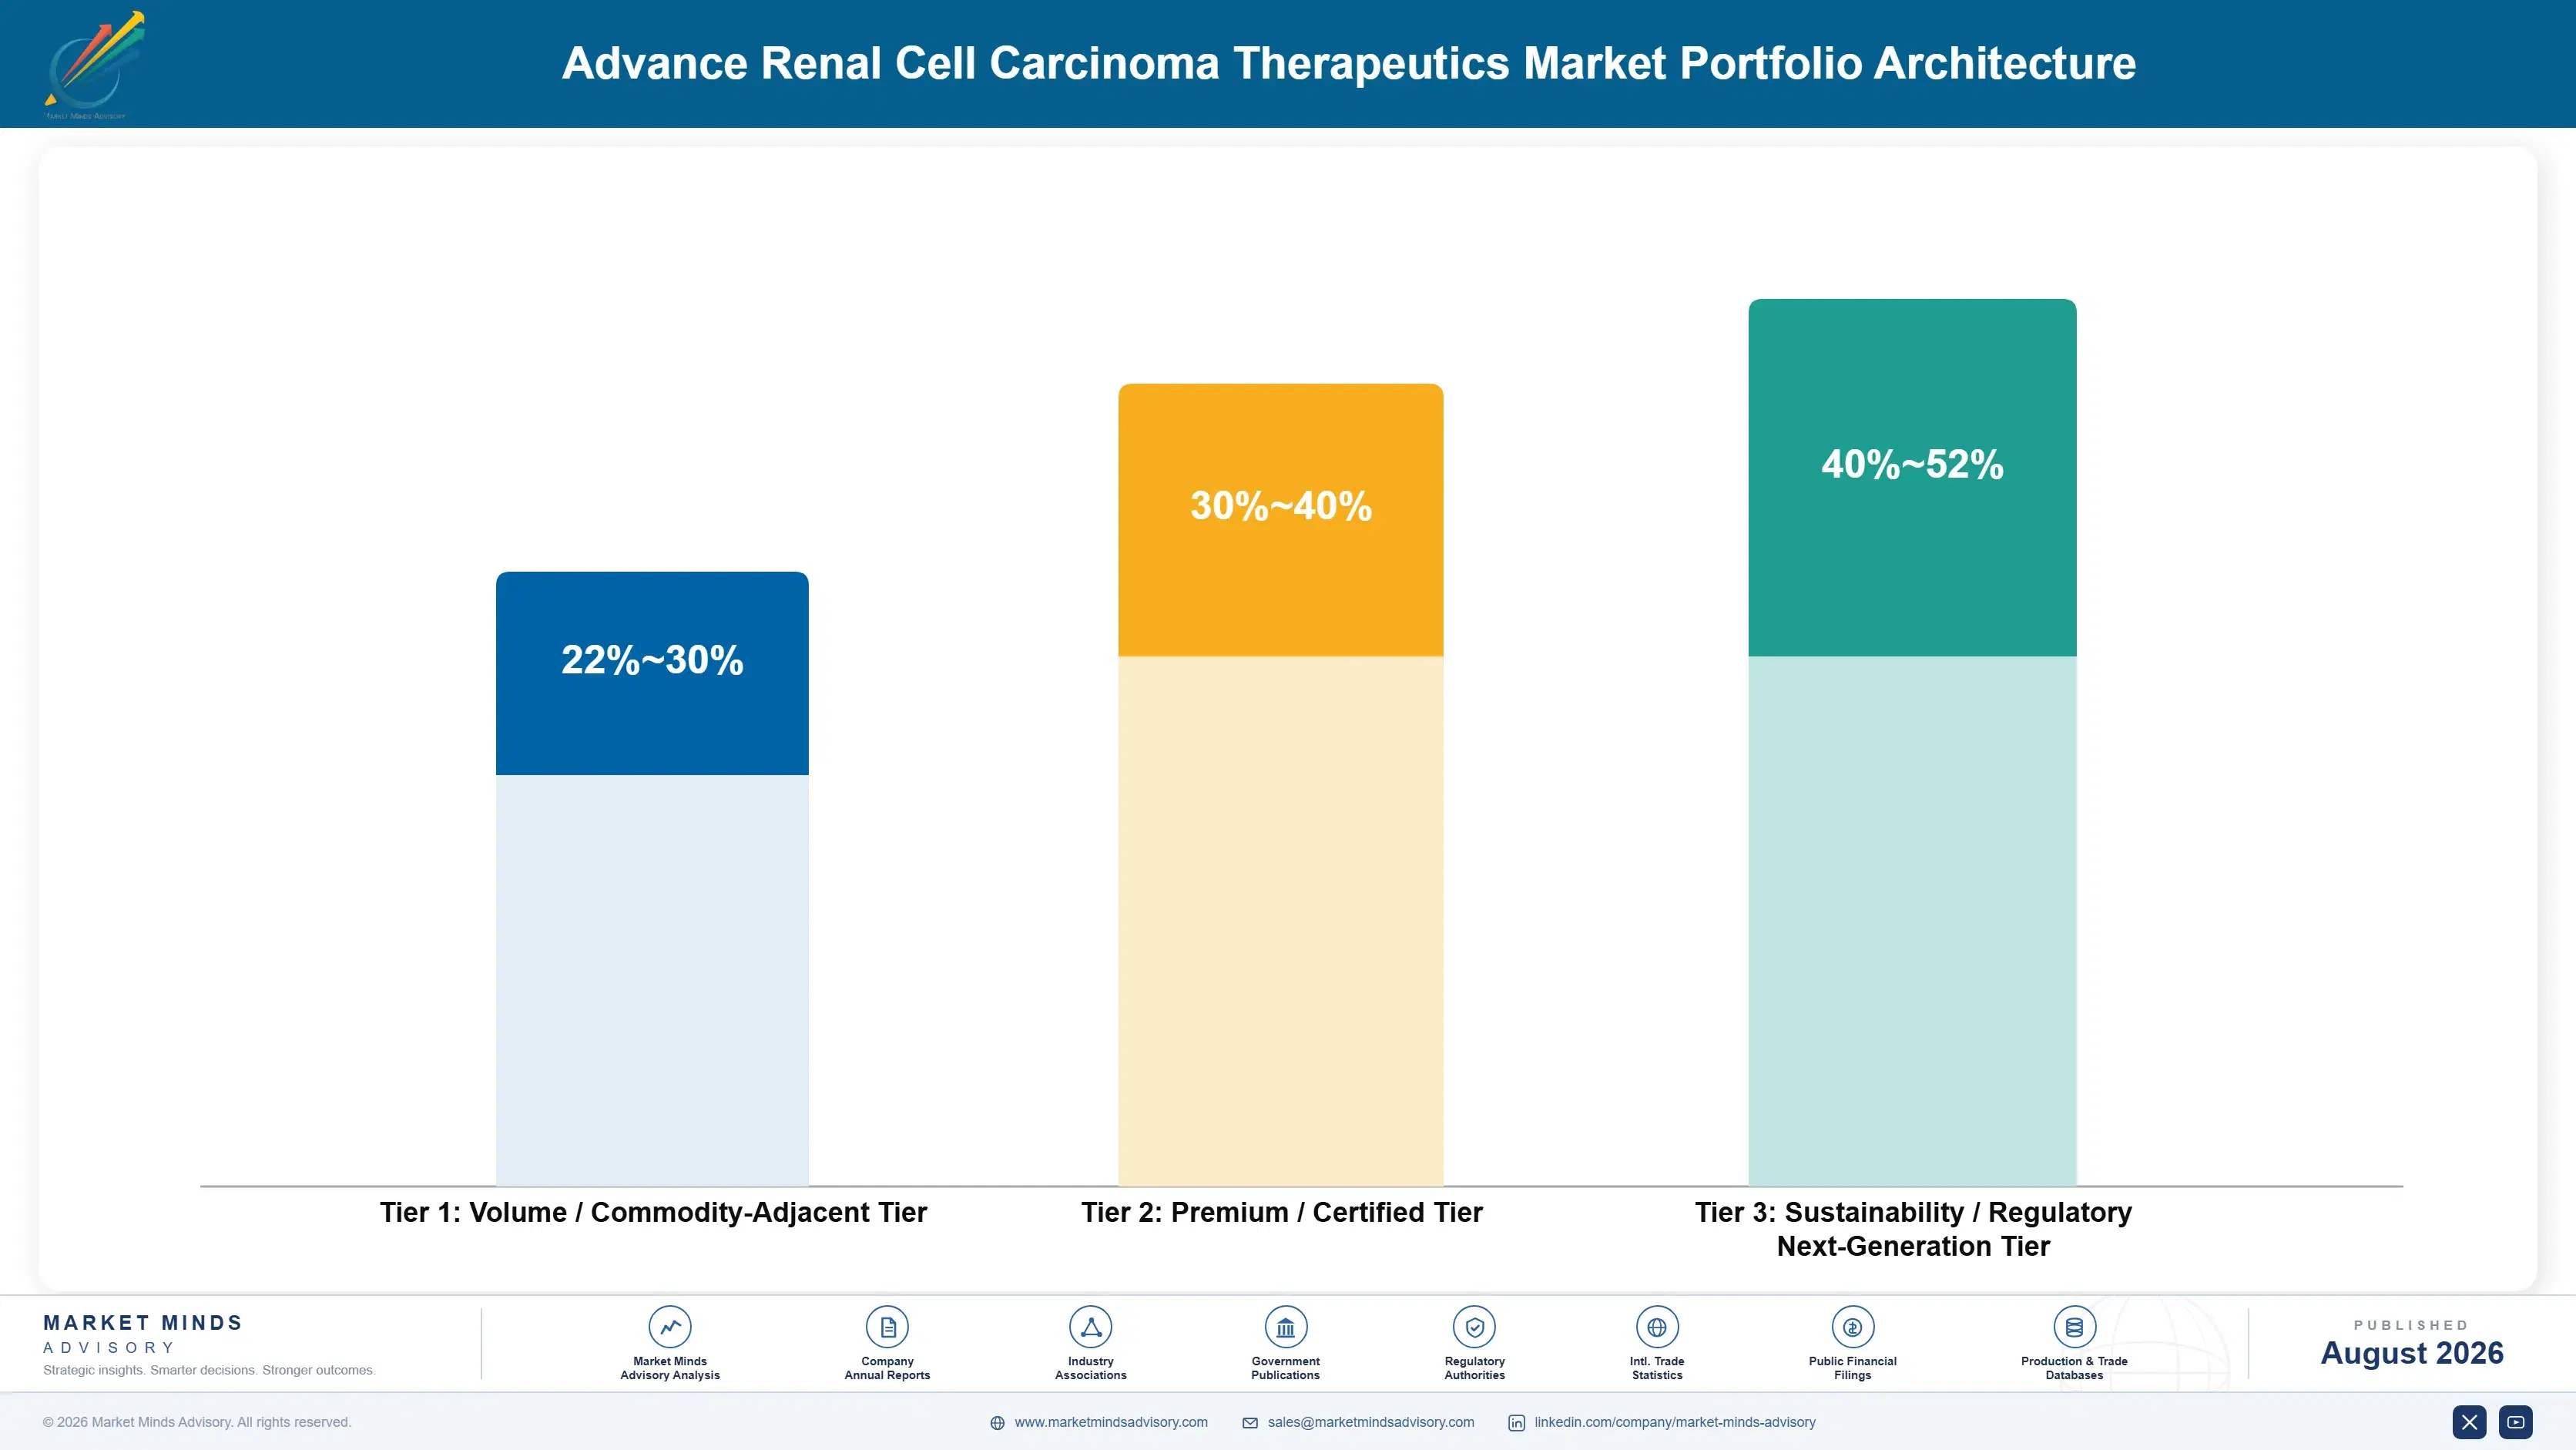
Portfolio economics split across three tiers. Standard legacy TKI monotherapy for mainstream first-line treatment competes mainly on price in a moderately consolidated market shaped by years of manufacturing efficiency gains, while HIF-2alpha and novel combination therapies command the highest margins, reflecting the clinical premium payers pay for capabilities legacy therapy cannot deliver in high-value, resistance-constrained applications built from the ground up around modern treatment-resist
The tension between volume and premium plays out most visibly in the transition period underway right now, where manufacturers must simultaneously defend mature combination regimen business generating predictable cash flow while investing heavily in novel-mechanism pipeline capacity that may not reach profitable scale for several more years of clinical trial ramp-up and regulatory qualification testing across multiple oncology programmes still working through validation processes worldwide and across nearly every affected jurisdiction.
High-value margin pools concentrate in early-stage oncologist adoption relationships and real-world evidence registry programmes, where limited qualified competition keeps pricing power intact well past what the mature monotherapy segment retains after years of established, price-competitive manufacturing among a stable group of global manufacturers serving nearly every major treatment category worldwide, across nearly every procurement channel available today.
Volume / Commodity-Adjacent Tier
Standard legacy TKI monotherapy for mainstream first-line treatment applications, competing primarily on price against multiple qualified global manufacturers with comparable clinical scale, delivery reliability, and treatment center coverage nationwide and abroad.
Gross Margin: 22%-30%
Premium / Certified Tier
Standard combination regimens and established checkpoint inhibitors carrying established brand equity or proven reliability credentials across multiple treatment center platforms sold worldwide each year and every affected region and market segment.
Gross Margin: 30%-40%
Sustainability / Regulatory / Next-Generation Tier
HIF-2alpha inhibitors and novel combination pipelines capturing premium pricing during this early commercial adoption phase across leading academic oncology platforms and compliance-driven segments today and every fiscal year beyond that.
Gross Margin: 40%-52%

High-value Sub-segments and Strategic Watch-out
Academic Oncology Novel-Mechanism Design Wins
Early novel-mechanism prescribing relationships on academic oncology platforms combine high per-patient value with the fastest specification growth in the category, as centers commit to the technology across successive treatment generations following initial validation and extended clinical testing programmes across multiple markets and customer segments each year.
Gross Margin: 40%-50%
China Reimbursement Expansion Contracts
Therapeutic supply agreements tied to China's National Reimbursement Drug List expansion trend carry solid margins with a growth curve still accelerating rapidly, as domestic healthcare systems scale treatment volume faster than most Western modernisation programmes have managed to date across comparable case volume timelines now firmly in place today.
Gross Margin: 28%-38%
Established First-Line Monotherapy Base
Long-established first-line monotherapy generates steady, predictable revenue tied to case volume replacement cycles but carries moderate margins after years of price-competitive manufacturing among a broad group of qualified manufacturers worldwide competing mainly on price and treatment center service quality offered nationwide each year overall and abroad.
Gross Margin: 22%-30%
Bispecific Antibody Combination Therapies
Bispecific antibody combination therapies designed to target multiple resistance pathways simultaneously represent a strategic watch-out: it remains unclear how quickly long-term durability and safety data will accumulate for mainstream adoption given unresolved long-term validation questions across major markets tracked closely by MMA analysts each year.
Gross Margin: N/A pre-validation
Treatment Sequencing Lifecycle Economics
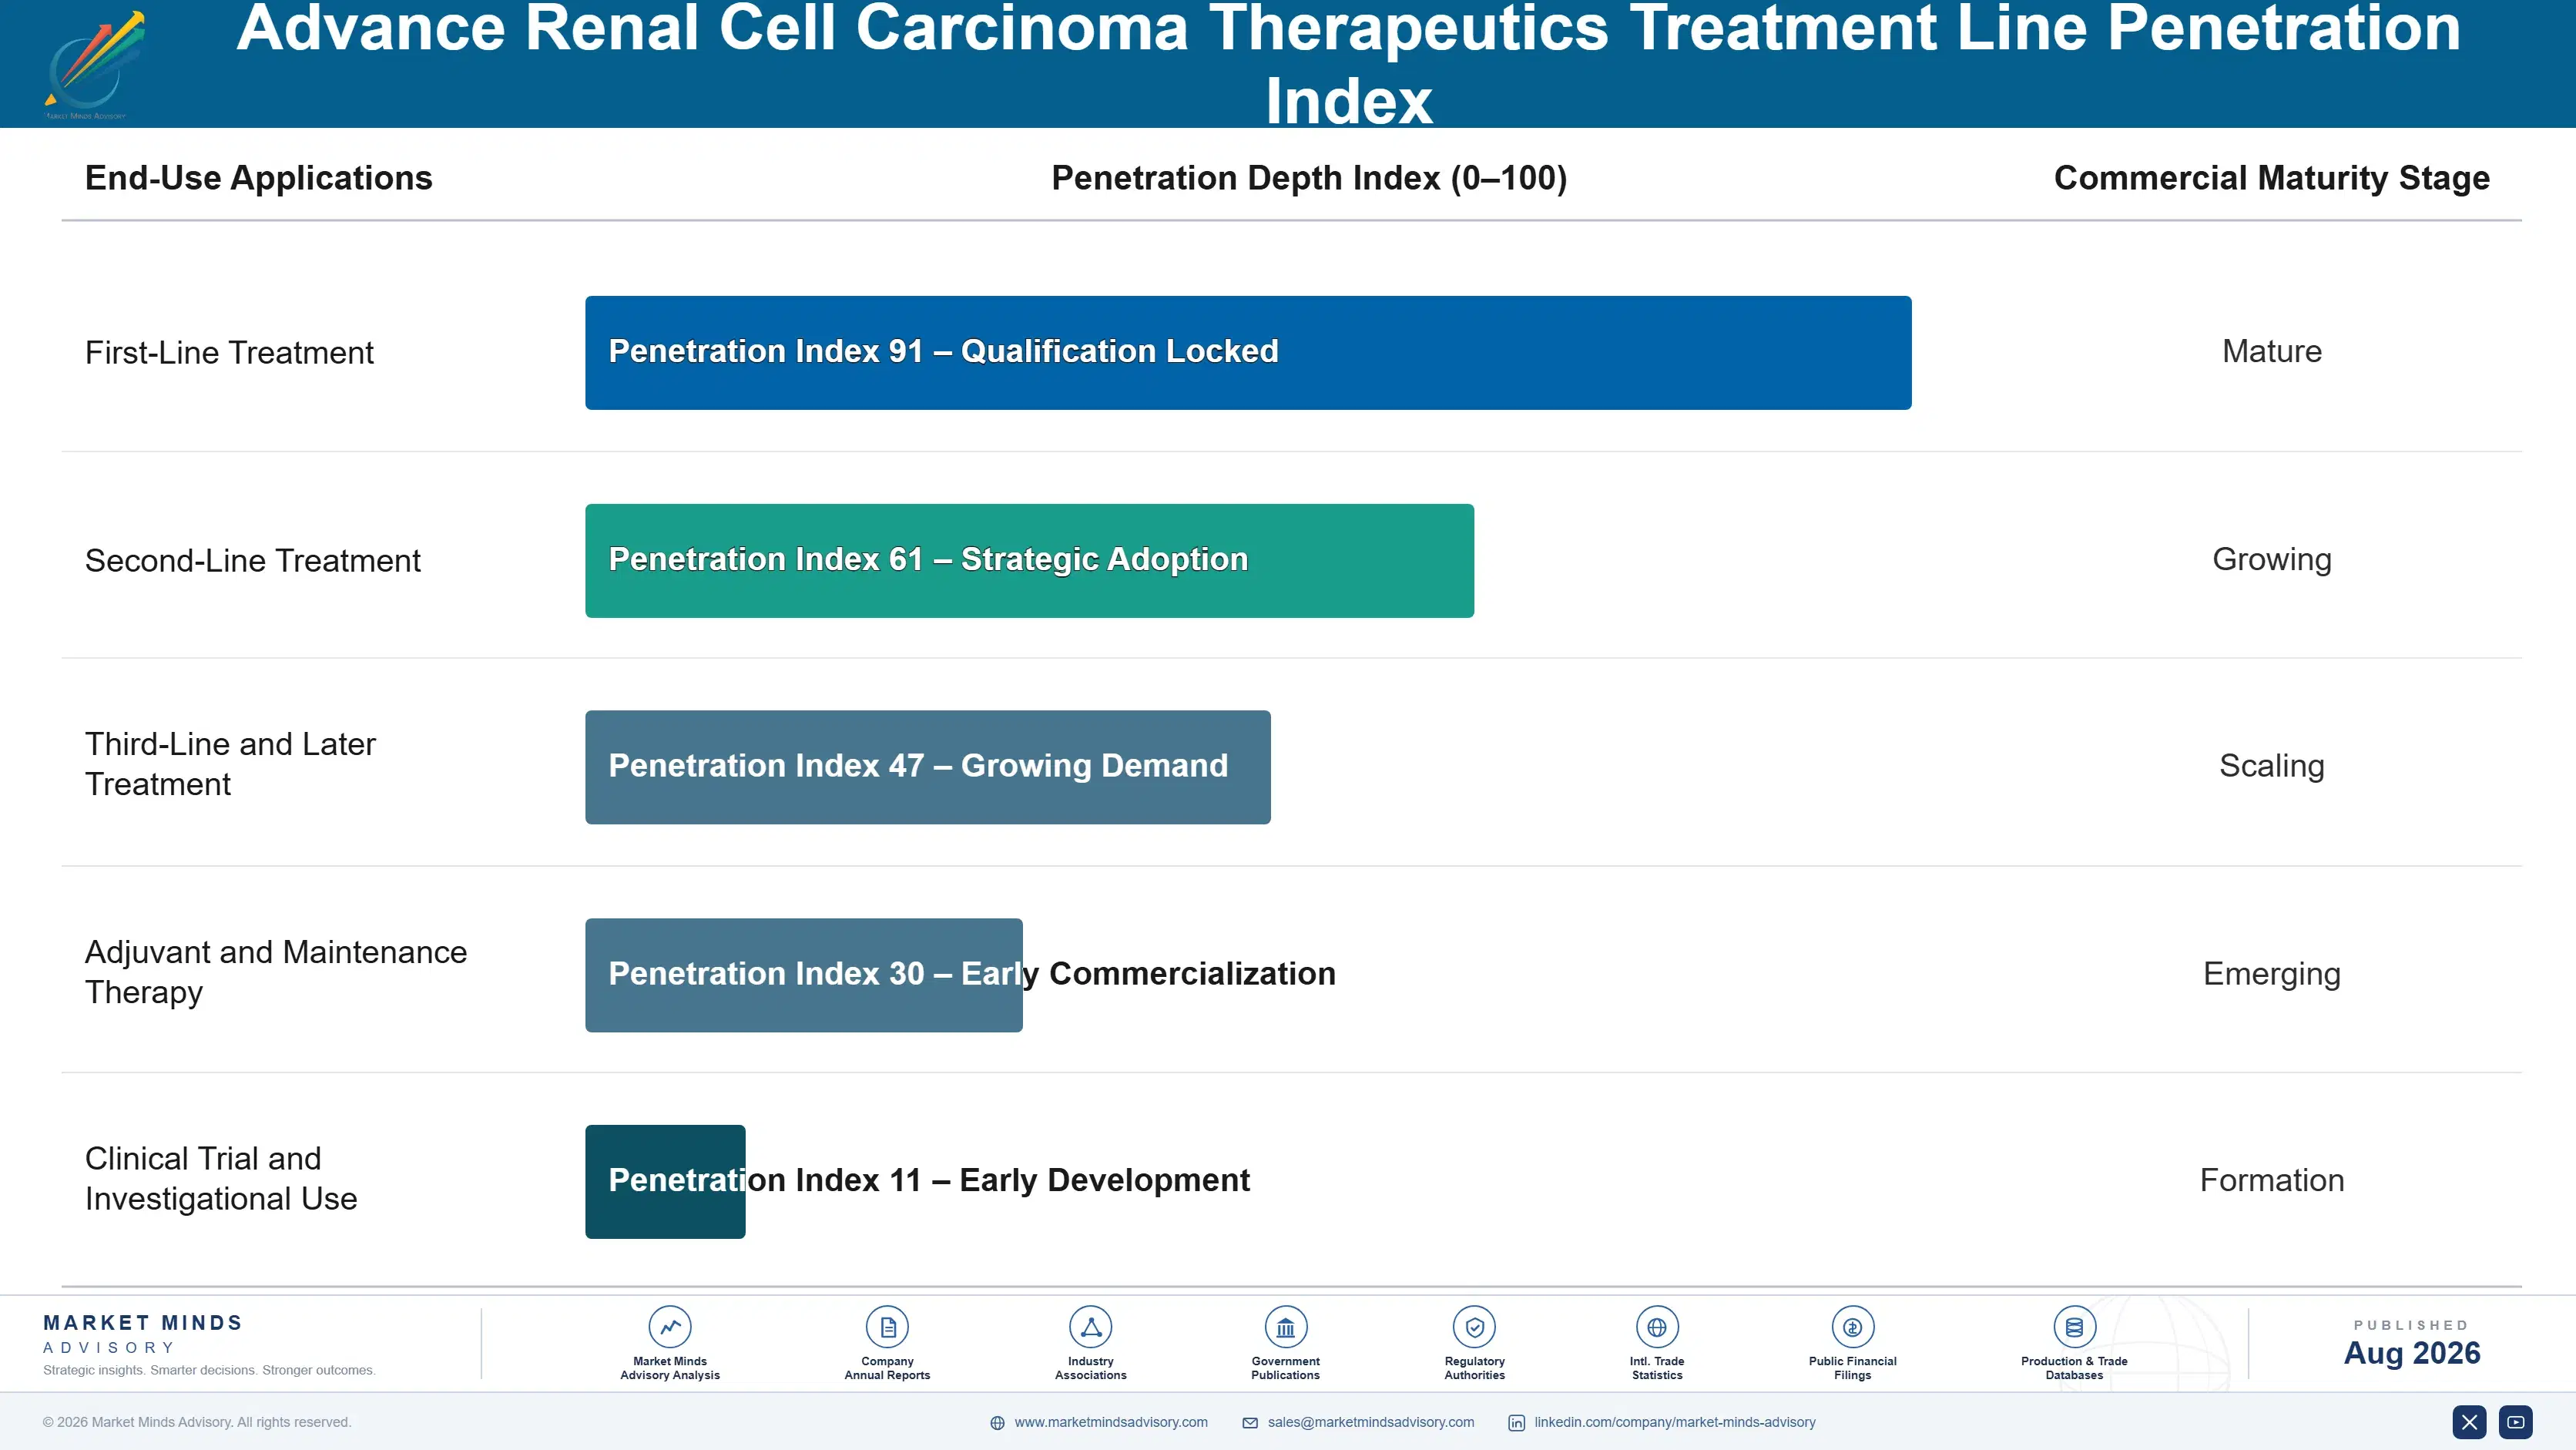
Advanced renal cell carcinoma therapeutics demand behaves like a per-patient treatment sequence annuity rather than a purely discretionary purchase, since every diagnosed patient consumes sequential treatment lines regardless of how long that treatment center has run its oncology programme, generating predictable recurring revenue tied directly to diagnosed patient volume rather than a one-time prescription negotiated and forgotten.
Adoption depth varies considerably by treatment line and disease complexity. Academic medical centers and resistant-disease specialists adopt novel-mechanism therapy fastest, since treatment failure in these categories carries meaningfully higher clinical consequence than in routine first-line management. Community oncology practices and smaller treatment centers show far slower migration to novel therapies, as reimbursement constraints and functional legacy regimens keep conventional monotherapy the default choice until disease progression or guideline updates force change.
A generational shift is underway in oncology fellowship training programmes. Oncologists trained on novel-mechanism and precision combination therapy design after 2015 show meaningfully more comfort specifying resistance-pathway-targeted treatment than predecessors trained purely on legacy monotherapy technique, a shift that should widen novel-mechanism adoption further as this cohort gains seniority within academic and community oncology practices over the next decade of continued therapeutic transition.

Positioning for the Novel-Mechanism Treatment Transition
These are among the four positions where our research anticipates prominent divergence between winners and laggards over the coming forecast period. Each is grounded in the demand model, the regulatory perimeter, and the announced capacity pipeline.
Engage academic oncologist teams years before formal guideline updates
Manufacturers who wait for formal guideline competitions to begin lose adoption relationship opportunities to rivals who engaged academic oncologist teams during early protocol design collaboration, well before any formal guideline update process starts. Merck's adoption success traces directly to years of early engagement with oncologist teams that competitors are now scrambling to replicate across comparable treatment programmes. Manufacturers without comparable early relationships face a lasting competitive disadvantage in treatment center sourcing that formal guideline processes alone cannot fully overcome once prescribing decisions are already locked.
Offer both combination and novel-mechanism options across treatment lines
Treatment centers remain genuinely divided on whether to adopt full novel-mechanism protocols immediately or continue relying on proven combination regimens for critical applications. Manufacturers offering only one mechanism risk losing prescribing decisions to centers whose clinical risk tolerance does not match that single mechanism choice at this particular point in the budget cycle and planning horizon. The most successful manufacturers maintain both combination and novel-mechanism product lines simultaneously, letting oncologist clinical judgment rather than manufacturer limitation determine which mechanism ultimately wins each prescribing decision.
Build local capacity ahead of content-linked reimbursement deadlines
Content-linked reimbursement programmes like China's National Reimbursement Drug List pathway increasingly determine which manufacturers win formulary decisions in fast-growing markets, yet several established manufacturers still treat regional clinical trial capacity as a secondary consideration rather than a near-mandatory market entry requirement worth prioritising early on. That sequencing costs real formulary share during a market's critical early growth phase, when reimbursement review moves fastest and decisions lock in for years. Manufacturers who establish local capacity ahead of reimbursement deadlines consistently outperform import-dependent competitors on formulary win rates.
Diversify clinical trial capacity before cost volatility returns
Clinical trial cost volatility during 2021 and 2022 forced several manufacturers to renegotiate fixed-price contract research agreements at a loss, and outsourced capacity exposure tied to standard development programmes now presents a comparable emerging risk few manufacturers have fully hedged against. Manufacturers still relying entirely on outsourced spot-market capacity remain exposed to the same risk as pipeline volume scales considerably over the coming years. In-house capacity investment has already proven its value for manufacturers who adopted it ahead of recent cost volatility cycles.
Engagement Snapshot From the Field
A live engagement with an industry participant carrying material or product regulatory and market exposure ahead of a defining policy shift, showing how our research translates into a defensible multi-year portfolio strategy.
MARKET MINDS ADVISORY · CLIENT ENGAGEMENT SUMMARY
Advance Renal Cell Carcinoma Therapeutics Producer Strategic Portfolio Review and Transition Roadmap 2026·Investment Scenario on Advance Renal Cell Carcinoma Therapeutics Exposure Evaluation 2025-26
CLIENT PROFILE
The client is a mid-size academic oncology network preparing for expanded novel-mechanism treatment protocol coverage across three treatment centers, with annual advanced renal cell carcinoma case volume reported in the 900 to 1,400 patient range (client-reported, unverified by MMA), evaluating treatment protocol options ahead of a binding formulary budget deadline across multiple treatment centers and affiliated academic partners.
STRATEGIC CHALLENGE
The network's clinical pharmacy team was divided between committing to full novel-mechanism protocol adoption for maximum resistant-disease coverage or choosing a more conservative combination regimen baseline with established reliability, given internal disagreement over total cost of ownership across the centers' expected multi-year formulary timeline and reimbursement assumptions used in financial modelling.
MMA APPROACH
MMA benchmarked comparable academic oncology network formulary decisions made by four networks over the prior three years, analysing treatment response rate, durability, and total system cost across both protocol options under consideration. The team conducted primary interviews with clinical pharmacists and manufacturer medical affairs teams actively developing both treatment paths in parallel across the industry.
KEY FINDINGS
- Full novel-mechanism protocol adoption offered meaningfully longer progression-free survival than combination regimen alternatives across every comparable patient scenario reviewed in detail by the team.
- Three of four benchmarked networks had delayed full novel-mechanism adoption in at least one center due to unresolved formulary budget approval requirements still pending internal review.
- Combination regimen protocols carried a 11 to 17 percent lower total treatment cost given their reliance on more established prescribing patterns already proven at scale.
- Manufacturer support programme setup for novel-mechanism protocols ran approximately three months longer than combination regimen alternatives across the benchmarked comparable programmes reviewed by the team overall.
CLIENT PROFILE
The client is a mid-size academic oncology network preparing for expanded novel-mechanism treatment protocol coverage across three treatment centers, with annual advanced renal cell carcinoma case volume reported in the 900 to 1,400 patient range (client-reported, unverified by MMA), evaluating treatment protocol options ahead of a binding formulary budget deadline across multiple treatment centers and affiliated academic partners.
STRATEGIC CHALLENGE
The network's clinical pharmacy team was divided between committing to full novel-mechanism protocol adoption for maximum resistant-disease coverage or choosing a more conservative combination regimen baseline with established reliability, given internal disagreement over total cost of ownership across the centers' expected multi-year formulary timeline and reimbursement assumptions used in financial modelling.
MMA APPROACH
MMA benchmarked comparable academic oncology network formulary decisions made by four networks over the prior three years, analysing treatment response rate, durability, and total system cost across both protocol options under consideration. The team conducted primary interviews with clinical pharmacists and manufacturer medical affairs teams actively developing both treatment paths in parallel across the industry.
KEY FINDINGS
- Full novel-mechanism protocol adoption offered meaningfully longer progression-free survival than combination regimen alternatives across every comparable patient scenario reviewed in detail by the team.
- Three of four benchmarked networks had delayed full novel-mechanism adoption in at least one center due to unresolved formulary budget approval requirements still pending internal review.
- Combination regimen protocols carried a 11 to 17 percent lower total treatment cost given their reliance on more established prescribing patterns already proven at scale.
- Manufacturer support programme setup for novel-mechanism protocols ran approximately three months longer than combination regimen alternatives across the benchmarked comparable programmes reviewed by the team overall.
RECOMMENDED STRATEGY
Phase 1: Phase 1 (Months 1 to 4): Finalise target center treatment protocol requirements and confirm formulary budget approval by center and site. Phase 2: Phase 2 (Months 5 to 10): Select a combination regimen baseline protocol for early adoption while maintaining a novel-mechanism upgrade path. Phase 3: Phase 3 (Months 11 to 19): Execute formulary qualification and begin protocol conversion ahead of the network's later treatment adoption phases.
OUTCOME
The network selected a phased approach combining combination regimen baseline protocol for immediate treatment with novel-mechanism therapy planned for a later formulary upgrade cycle, avoiding an estimated 3 to 5 month formulary adoption delay across its initial deadline (client-reported, unverified by MMA). The decision reduced near-term budget risk while preserving the option to adopt full novel-mechanism protocols later.
Frequently Asked Questions
Foundational context covering the market sizes, CAGR, scope, country, region and competition that inform every finding below. This section is provided to cover basics and most often pre-purchase conversations, answered from the MMA Primary Research Dataset.
What is the current size of the Advance Renal Cell Carcinoma Therapeutics Market?
The global market reached an estimated 9.8 billion dollars in 2025, anchored by a mature combination regimen prescribing base. Growth is concentrated in HIF-2alpha and novel-mechanism segments.
How large will the Advance Renal Cell Carcinoma Therapeutics Market be by 2036?
MMA projects the market will reach approximately 25.8 billion dollars by 2036 under the base-case forecast scenario. This reflects expanding combination adoption and treatment-resistant disease incidence worldwide.
What is the CAGR for the Advance Renal Cell Carcinoma Therapeutics Market 2026 to 2036?
The base-case compound annual growth rate is 9.2 percent across the full ten-year forecast period. Bull and bear scenarios range from 7.9 to 10.4 percent.
Which segment is growing fastest?
HIF-2alpha inhibitors lead at a 15.4 percent CAGR, roughly 1.67 times the overall market rate. IO-TKI combination regimens follow as the second-fastest segment across most major markets.
Who are the major companies in the Advance Renal Cell Carcinoma Therapeutics Market?
Bristol Myers Squibb, Merck & Co, Exelixis, Eisai, and Pfizer hold the top five positions by revenue. Chinese domestic manufacturers are closing the novel-mechanism gap.
Which country is growing fastest?
China leads at an estimated 10.8 percent CAGR, driven by National Reimbursement Drug List expansion and rising oncology treatment access. Government reimbursement policy supports continued adoption.
Report Segmentation Architecture
The full report scope spans multiple orthogonal segmentation dimensions, with cross-tabulated demand data provided for each dimension pair. Coverage extends further to regional breakdowns, trend trajectories, and the competitive detail needed to support segment-level decision-making.
By Treatment Mechanism
- Immune Checkpoint Inhibitors
- Tyrosine Kinase Inhibitors
- mTOR Inhibitors
- IO-TKI Combination Regimens
- HIF-2alpha Inhibitors
- Antibody-Drug Conjugates and Emerging Therapies
By Treatment Line
- First-Line Treatment
- Second-Line Treatment
- Third-Line and Later Treatment
- Adjuvant and Maintenance Therapy
- Clinical Trial and Investigational Use
By Commercial Dimension
- Original Manufacturer Supply
- Specialty Pharmacy Distribution
- Patient Access and Support Programmes
- Real-World Evidence and Registry Services
By Region
- North America
- Western Europe
- East Asia
- South Asia and Pacific
- Latin America
- Middle East and Africa
- Eastern Europe
Scope, Methodology, and Coverage
Every figure in this report is reproducible from documented input assumptions. The scope below maps the historical period, the forecast horizon, the segmentation dimensions, and the countries covered, alongside the underlying primary and qualitative methodology.
Historical Period
2020 to 2025
Forecast Period
2026 to 2036
Base Year
2025 (USD billions; MMA Primary Research Dataset, August 2026)
Market Definition
This market covers pharmaceutical therapeutics used to treat advanced and metastatic renal cell carcinoma, including immune checkpoint inhibitors, tyrosine kinase inhibitors, mTOR inhibitors, HIF-2alpha inhibitors, and combination regimens. It excludes therapies for early-stage localized renal cell carcinoma and surgical or ablative treatment procedures.
Quantitative Units
USD billions (current prices); treated patient volume where applicable
Segmentation Dimensions
By Treatment Mechanism; By Treatment Line; By Commercial Dimension; By Region
Regions Covered
North America, Western Europe, East Asia, South Asia and Pacific, Latin America, Middle East and Africa, Eastern Europe
Countries Covered
USA, China, Germany, France, UK, Japan, South Korea, India, Australia, Canada, Brazil, Mexico, Indonesia, Vietnam, Italy, UAE, Saudi Arabia, South Africa, Nigeria, Turkey, Poland, Netherlands, Spain, Sweden, Switzerland, Argentina, Colombia, Singapore, and additional markets relevant to this sector
Key Companies Profiled
Bristol Myers Squibb, Merck & Co, Exelixis, Eisai, Pfizer, Ipsen SA, Bayer AG, AVEO Pharmaceuticals Inc, Novartis AG, Roche Holding AG, Astellas Pharma Inc, AstraZeneca plc, Eli Lilly and Company, Sanofi SA, GSK plc, Takeda Pharmaceutical Company, Johnson & Johnson, Regeneron Pharmaceuticals Inc, Incyte Corporation, Jazz Pharmaceuticals plc
Quantitative Methodology
Primary survey, n=3,800 respondents, Q4 2025, six countries; demand-side model with trade association cross-validation
Qualitative Methodology
47 expert interviews, Q4 2025; applied to validate demand model assumptions, identify emerging dynamics, and assess competitive positioning
Report Format
PDF and XLSX data workbook (Word format preview document)
Publisher
Market Minds Advisory
Report Code
MMA-2026-HLT-118
Published
August 2026
Contact
sales@marketmindsadvisory.com | www.marketmindsadvisory.com
Purchase the full Advance Renal Cell Carcinoma Therapeutics Market Report (2026 to 2036).
The full report delivers a company-by-company pipeline and clinical development tracker covering every major renal cell carcinoma therapeutics developer through 2030 with disclosed trial timelines and anticipated regulatory milestones. It includes a reimbursement and guideline policy tracker mapping coverage requirements across every profiled treatment category and region worldwide. Oncologist and treatment center adoption survey data is provided from MMA's primary research programme, alongside clinical trial cost benchmarking across major producing regions tracked closely. Buyers also receive a company-level financial and pipeline-milestone model updated quarterly throughout the subscription period each year.
Company-by-company pipeline and clinical development tracker
Reimbursement and guideline policy tracking database
Oncologist and treatment center adoption survey data collected
Quarterly competitor financial and milestone model updates
Clinical trial cost benchmark and comparison data set
Custom clinical strategy and formulary workshops
Built For The People Who Decide
From boardroom strategy to bench-side execution, this report is read cover-to-cover by leaders shaping the next decade of their industry, turning demand scenarios, market dynamics and valuation benchmarks into decisions.
CXOs/ Presidents/ VPs/ Managers
M&A and Corporate Development
Strategy Teams and R&D Heads
Procurement and Product Directors
Regulatory and Compliance Leaders
Investor Relations and Equity Analysts