Market Minds Advisory
Adaptive Sports Lighting System Market

Adaptive Sports Lighting System Market: Adaptive Sports Lighting: Broadcast Specification, Flicker Tolerance And The Control Layer Nobody Priced

Super slow motion cameras exposed lighting that ordinary human eyes had always found perfectly acceptable, and broadcast requirements have been driving venue capital spending ever since that discovery was first made.

Lead Analyst

Published

September 2026

Make Smarter Decisions with Customized Research Insights

Request a free sample report and evaluate market opportunities, growth trends, and competitive dynamics relevant to your business needs.

2025 MARKET VALUE$3.1BMarket Size 2025
2036 FORECAST VALUE$8.3BBase Case , 2026 to 2036
CAGR 2026 TO 20369.4 %Bull 10.6% / Bear 8.1%
INCREMENTAL OPPORTUNITY$4.9BNet 10- year value creation
EXPANSION MULTIPLE2.46x2036 value over 2026 base
Strategic Levers
M&A Pipeline
Regional Outlook
Country Rankings
Competitive Intelligence
Segmental Deep-dive
Call-Us : 91 93563 13602

Executive Snapshot and Market Trajectory.

Broadcast changed this market and nobody in it was consulted. Super slow motion capture at high frame rates exposed flicker that human vision never registered, and venues that looked perfectly well lit suddenly failed a specification. Nobody at the venue had any say in it at all.
Control, scene management and show systems grow fastest at 14.1%, because the value moved above the luminaire once fixtures became instantly dimmable and individually addressable. A venue no longer buys light. It buys the ability to change what the light does within a frame, and that capability sits in software and control architecture rather than in the fitting on the pole. The fitting on the pole has quietly become the least interesting part.
Concentration is high at 58% and rests on broadcast qualification rather than on lighting engineering. A fixture that fails a flicker measurement at 1,000 frames per second cannot be specified for a televised venue whatever else it does, and demonstrating compliance takes evidence that new entrants find genuinely difficult to assemble. Efficiency and price decide nothing at all if the measurement result rules a product out first anyway.
Market Definition
Revenue from lighting systems installed at sports venues with electronically controllable output, covering broadcast-grade adaptive floodlighting, control, scene management and show systems, training and community facility lighting, indoor arena and multipurpose venue systems, retrofit and conversion programmes, and lighting design, measurement and commissioning services. Excludes general architectural and street lighting, scoreboard and video display systems, stadium electrical infrastructure beyond the lighting installation, and temporary event lighting hired rather than installed.
Base Year Value
$3.1B in 2025 (MMA Primary Research Dataset, August 2026)
Forecast Period
2026 to 2036, eleven discrete annual values
CAGR
9.4% base case. Bull 10.6%. Bear 8.1%.
Fastest Growth Segment
Control, Scene Management and Show Systems: 14.1% CAGR
Fastest Growth Country
India: 11.6% CAGR
Fastest Growth Region
South Asia and Pacific: 11.6% CAGR
Largest Region
East Asia: 27% of 2025 global value
Market Leaders
Signify, Musco Lighting, ABB, Zumtobel Group and Stadium Lighting Solutions lead on adaptive sports lighting system revenue. Source: company annual reports and MMA Primary Research Dataset, July 2026.
Primary Survey
n=3,800 procurement and R&D decision-makers, Q4 2025, six countries
Methodology
Demand-side build-up, cross-validated against public data, 47 expert interviews

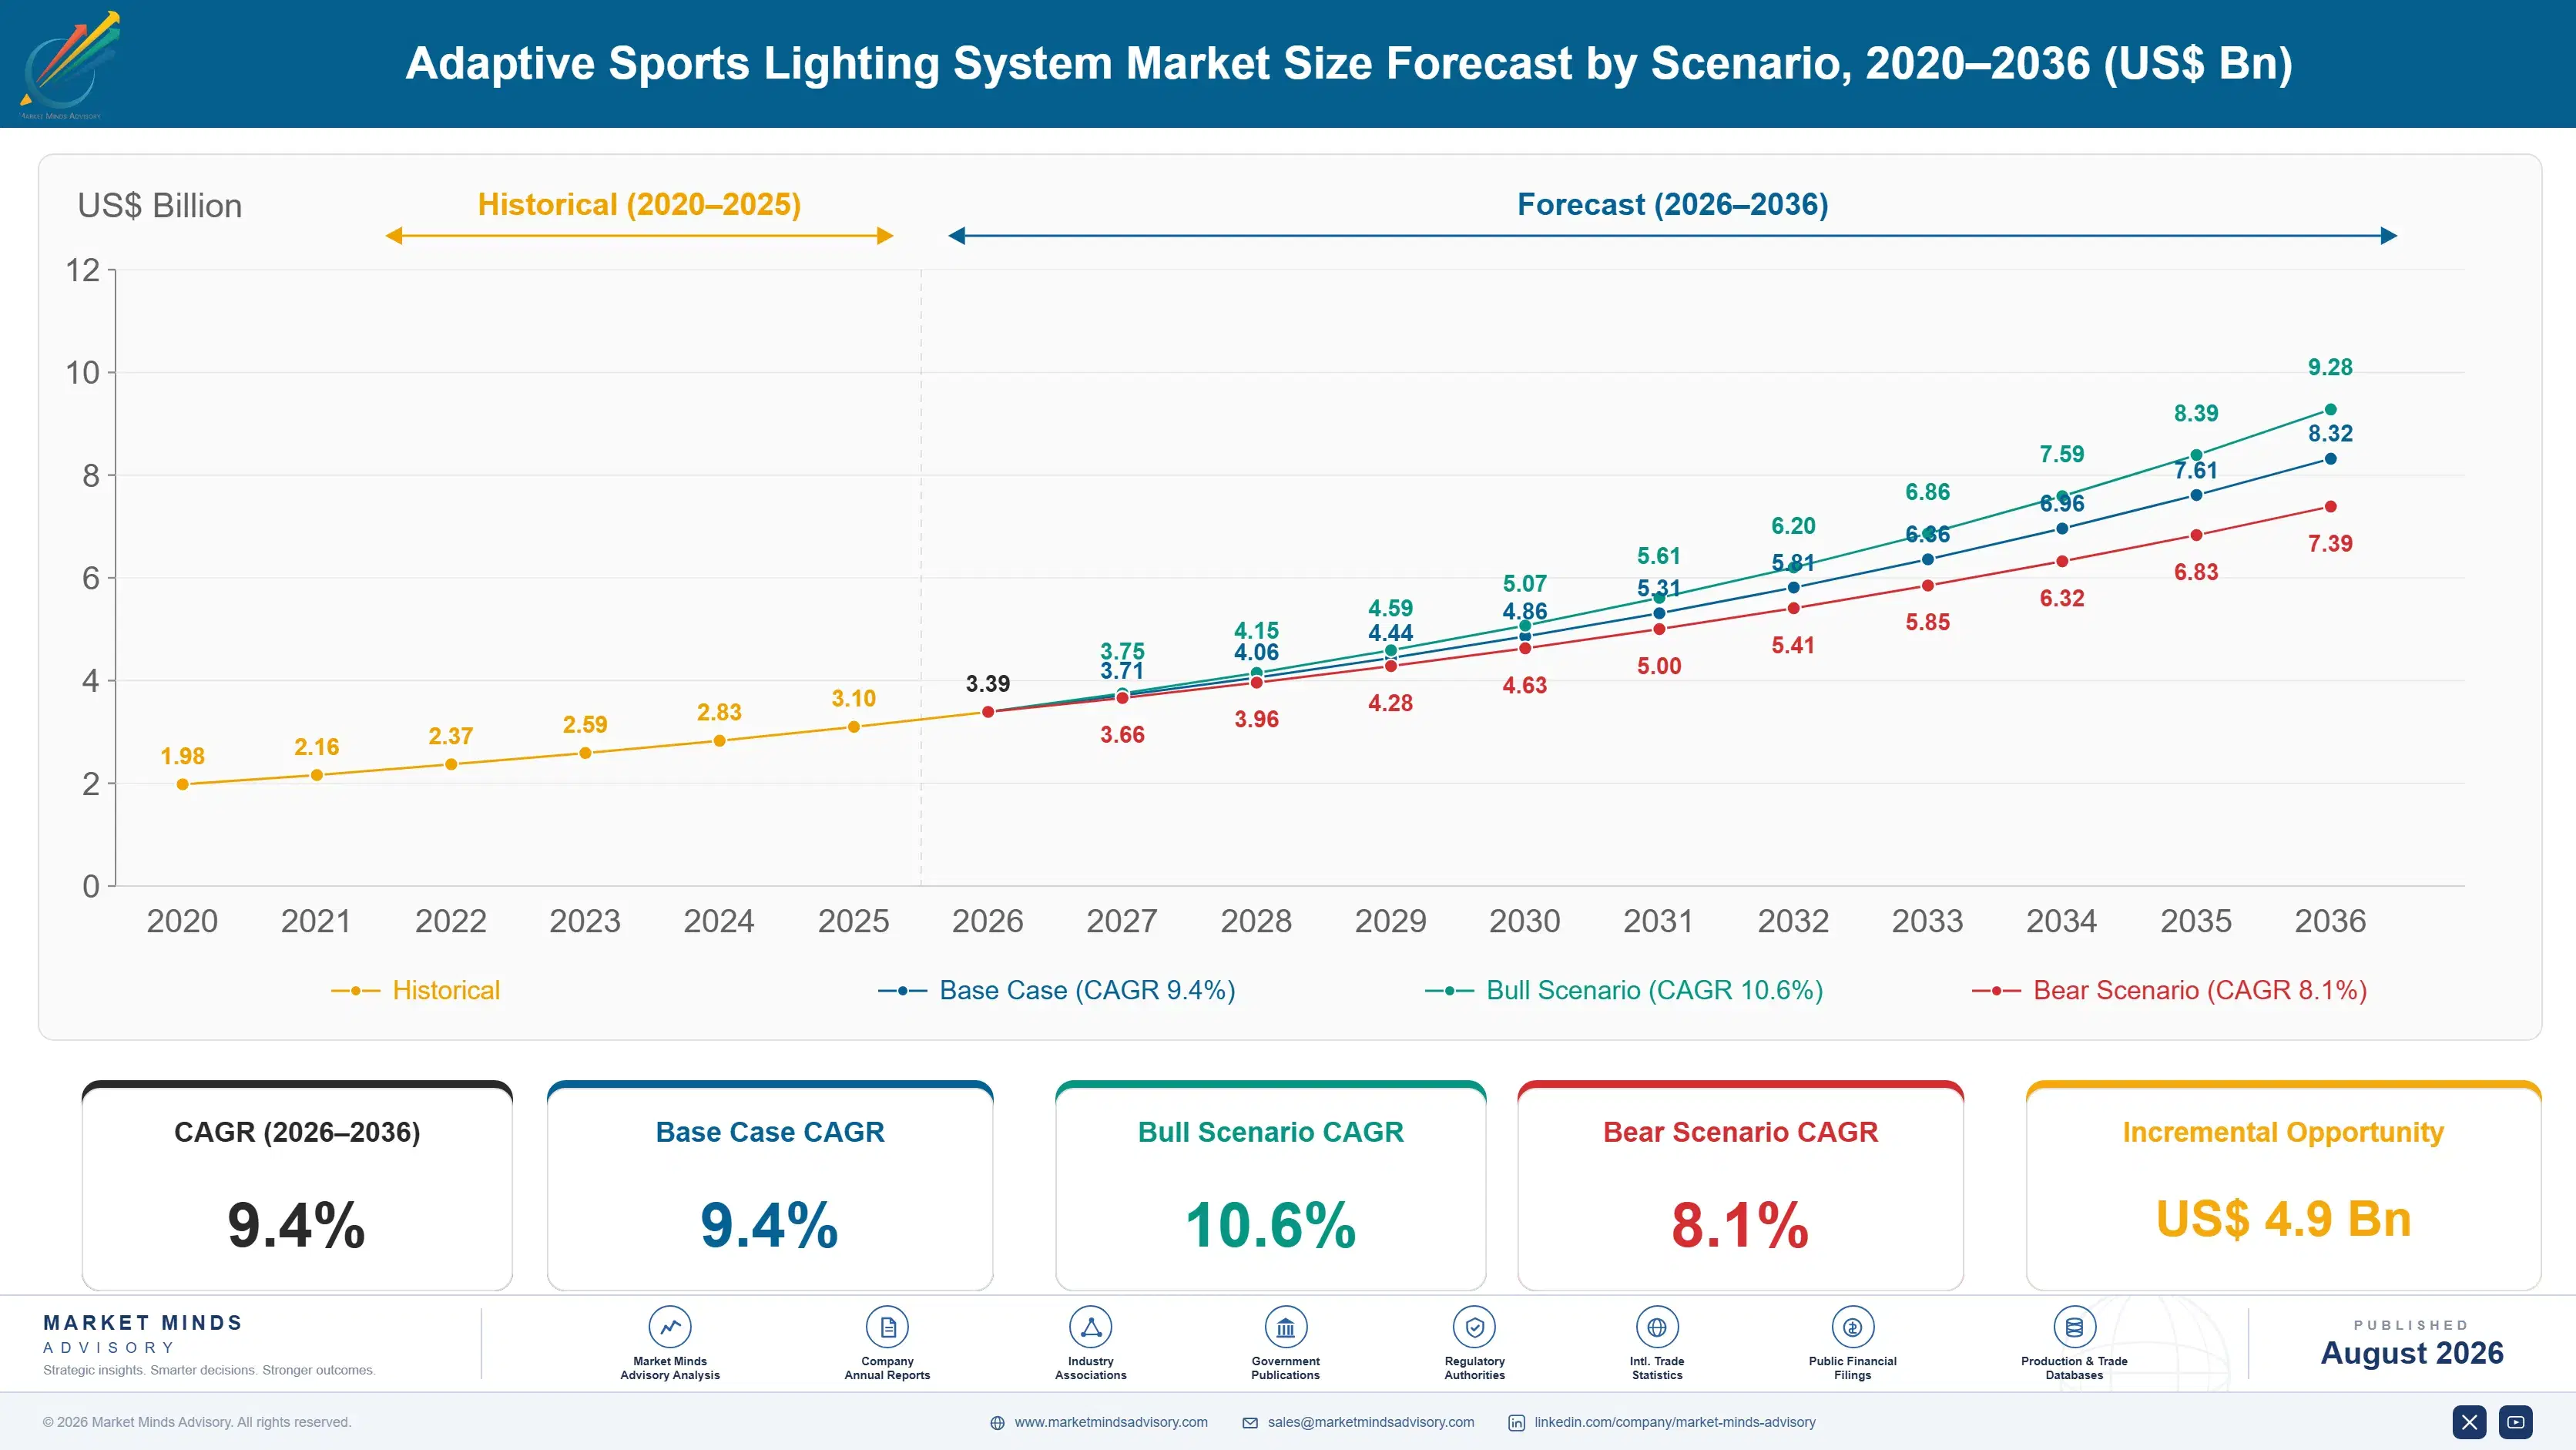
Adaptive Sports Lighting System Market Forecast Scenarios

adaptive-sports-lighting-system-market-size-forecast-scenario-1788165743773
The 2020 to 2025 period completed a technology transition and started a commercial one. Discharge lighting was displaced almost entirely by electronically driven sources across professional venues, which removed the warm-up constraint that had made instant control impossible. Broadcast specifications tightened as capture frame rates rose. Revenue compounded near 8.0%, with the fixture conversion largely finished and the control opportunity only beginning to be understood properly.
Three mechanisms carry the base case. Broadcast specification requirements continue tightening as capture technology advances, obliging venues to upgrade systems that were compliant when installed. Control and show capability is being specified as a venue experience requirement rather than a lighting one. And community and training facility conversion continues on energy cost arguments that hold regardless of whether anybody televises the venue. None of the three depends on any new venue being built.
The bull catalyst is a major broadcast rights holder writing lighting performance into venue standards contractually, which would oblige upgrade across an entire competition rather than venue by venue. The bear risk is public facility budgets: community conversion depends on capital that competes against every other municipal priority and disappears quickly whenever those budgets tighten.

Cameras Set The Specification

The specification in this market is written by camera manufacturers rather than by anybody in lighting. Capture at 1,000 frames per second reveals flicker and colour instability that human vision comfortably ignores, and venues that looked perfectly lit to spectators began failing assessment as capture rates climbed. Vertical illuminance requirements near 2,000 lux for premium coverage compound that, since the camera photographs faces rather than pitches.
MARKET CONCENTRATION CR558%Share of system revenue held by the leading suppliers
BROADCAST FRAME RATE1,000 fpsCapture rate against which flicker performance is now assessed
VERTICAL ILLUMINANCE REQUIREMENT2,000 luxTypical level demanded for premium competition broadcast coverage
CONTROL SHARE OF COST24%Portion of installed system value in control rather than fixtures
ENERGY REDUCTION ON CONVERSION61%Typical consumption saving where discharge lighting was replaced
SYSTEM REPLACEMENT INTERVAL16 yearsTypical period before a venue lighting installation is renewed
The technology transition that enabled all this is essentially finished. Electronically driven sources replaced discharge lighting across professional venues and removed the warm-up delay that made instant control impossible, which is why a venue can now black out and restore output within a frame. That change delivered energy reductions around 61% almost incidentally, and the energy argument has funded conversion at community facilities no broadcaster will ever visit.
What follows is a commercial shift the industry is still absorbing. Control now represents 24% of installed system value and rising, because a venue buying adaptive lighting is buying the ability to change what the light does rather than the light itself. Fixture manufacturers who treated control as an accessory to the hardware are competing against participants who understood it was becoming the product.
"Nobody in this industry decided that flicker at a thousand frames per second mattered. A camera manufacturer decided it, a broadcaster wrote it into a specification, and every venue in the competition discovered its lighting had failed a test nobody told them about."
Director, Sports Infrastructure Practice · MMA Sports Infrastructure and Lighting Practice · August 2026

Market Trends

Value Moved Above The Luminaire Into Control

Once fixtures became instantly dimmable and individually addressable, the interesting capability stopped being the light and became what a venue could make it do. Control and show systems now represent 24% of installed value and are growing at 14.1% against a market rate of 9.4%. Fixture manufacturers treating control as an accessory bundled with hardware are competing against participants who recognised earlier that the control architecture had quietly become the actual product being purchased. Giving away the fastest growing part of a sale to protect the slowest is an odd commercial choice.
Market Impact: Assesses at 1,000 frames per second
Broadcast Requirements Tighten Faster Than Venues Can Upgrade

Capture frame rates have risen faster than venue replacement cycles running around 16 years, which means installations compliant when commissioned fail assessment well before they reach the end of their service life. Venues face upgrade obligations driven entirely by external technology decisions they have no involvement in. That produces demand independent of any venue's own condition or intention, and it is the most reliable revenue mechanism anywhere in this market. Demand created by somebody else's technology roadmap arrives whether a venue has budgeted for it or not, which is unusual and commercially convenient.
Market Impact: Cuts energy consumption by 61%

Market Opportunities and Growth Drivers

Broadcast Specification Obliges Upgrade Regardless Of Condition

A venue hosting televised competition must satisfy flicker, colour and vertical illuminance requirements set by broadcasters rather than by anything the venue itself decides. Capture at 1,000 frames per second exposes performance that was perfectly adequate a decade ago. Systems still working well are therefore replaced because a camera specification changed, which is unusually reliable demand. The venue has no discretion in the matter and generally no involvement in setting the requirement either. Replacing equipment that works perfectly is a peculiar thing to fund and venues do it every season.
Market Impact: Holds concentration at 58%

Energy Savings Fund Conversion Where Broadcast Never Reaches

Replacing discharge lighting reduces consumption by around 61%, which produces a payback argument that works entirely without any broadcast requirement behind it. Community pitches, training facilities and municipal venues convert on that basis alone. The volume here is far larger than professional venues in facility count even though revenue per site is much smaller. Energy cost movement across recent years has strengthened that argument considerably rather than weakening it. Nobody televising a school pitch is the point, because the argument here rests entirely on the electricity bill rather than on anything a camera might reveal.
Market Impact: Repays in under 5 years

Market Restraints and Challenges

Broadcast Qualification Excludes Otherwise Capable Suppliers

A fixture failing flicker measurement at high capture rates cannot be specified for a televised venue whatever its efficiency or price, and demonstrating compliance requires measurement evidence that takes time and equipment to assemble. The root cause is that broadcast performance is verified rather than declared. Commercially it holds concentration at 58% and keeps capable general lighting manufacturers out. Mitigation runs through independent laboratory measurement, broadcaster engagement, reference installations and partnership with qualified control suppliers. Nobody has ever once successfully argued a broadcaster out of a measurement result they took.
Market Impact: Holds 24% of installed value

Community Conversion Depends On Budgets That Vanish Quickly

Municipal and community facility conversion is funded from capital budgets competing against every other local priority, and those budgets disappear faster than almost any other demand source in infrastructure. The root cause is that sports lighting is discretionary spending for a public authority however good the payback case looks. Commercially it makes the largest facility population the least predictable revenue. Mitigation runs through energy performance contracting, third party financing, grant programme alignment and phased conversion across multiple budget years. A payback case nobody funds is not much of a payback case.
Market Impact: Outpaces 16 year replacement cycles
4 additional market trends, 3 additional growth drivers, and 2 additional restraints and challenges are covered in the full report. Contact sales@marketmindsadvisory.com to access the complete intelligence.

Segment CAGR and Growth Architecture

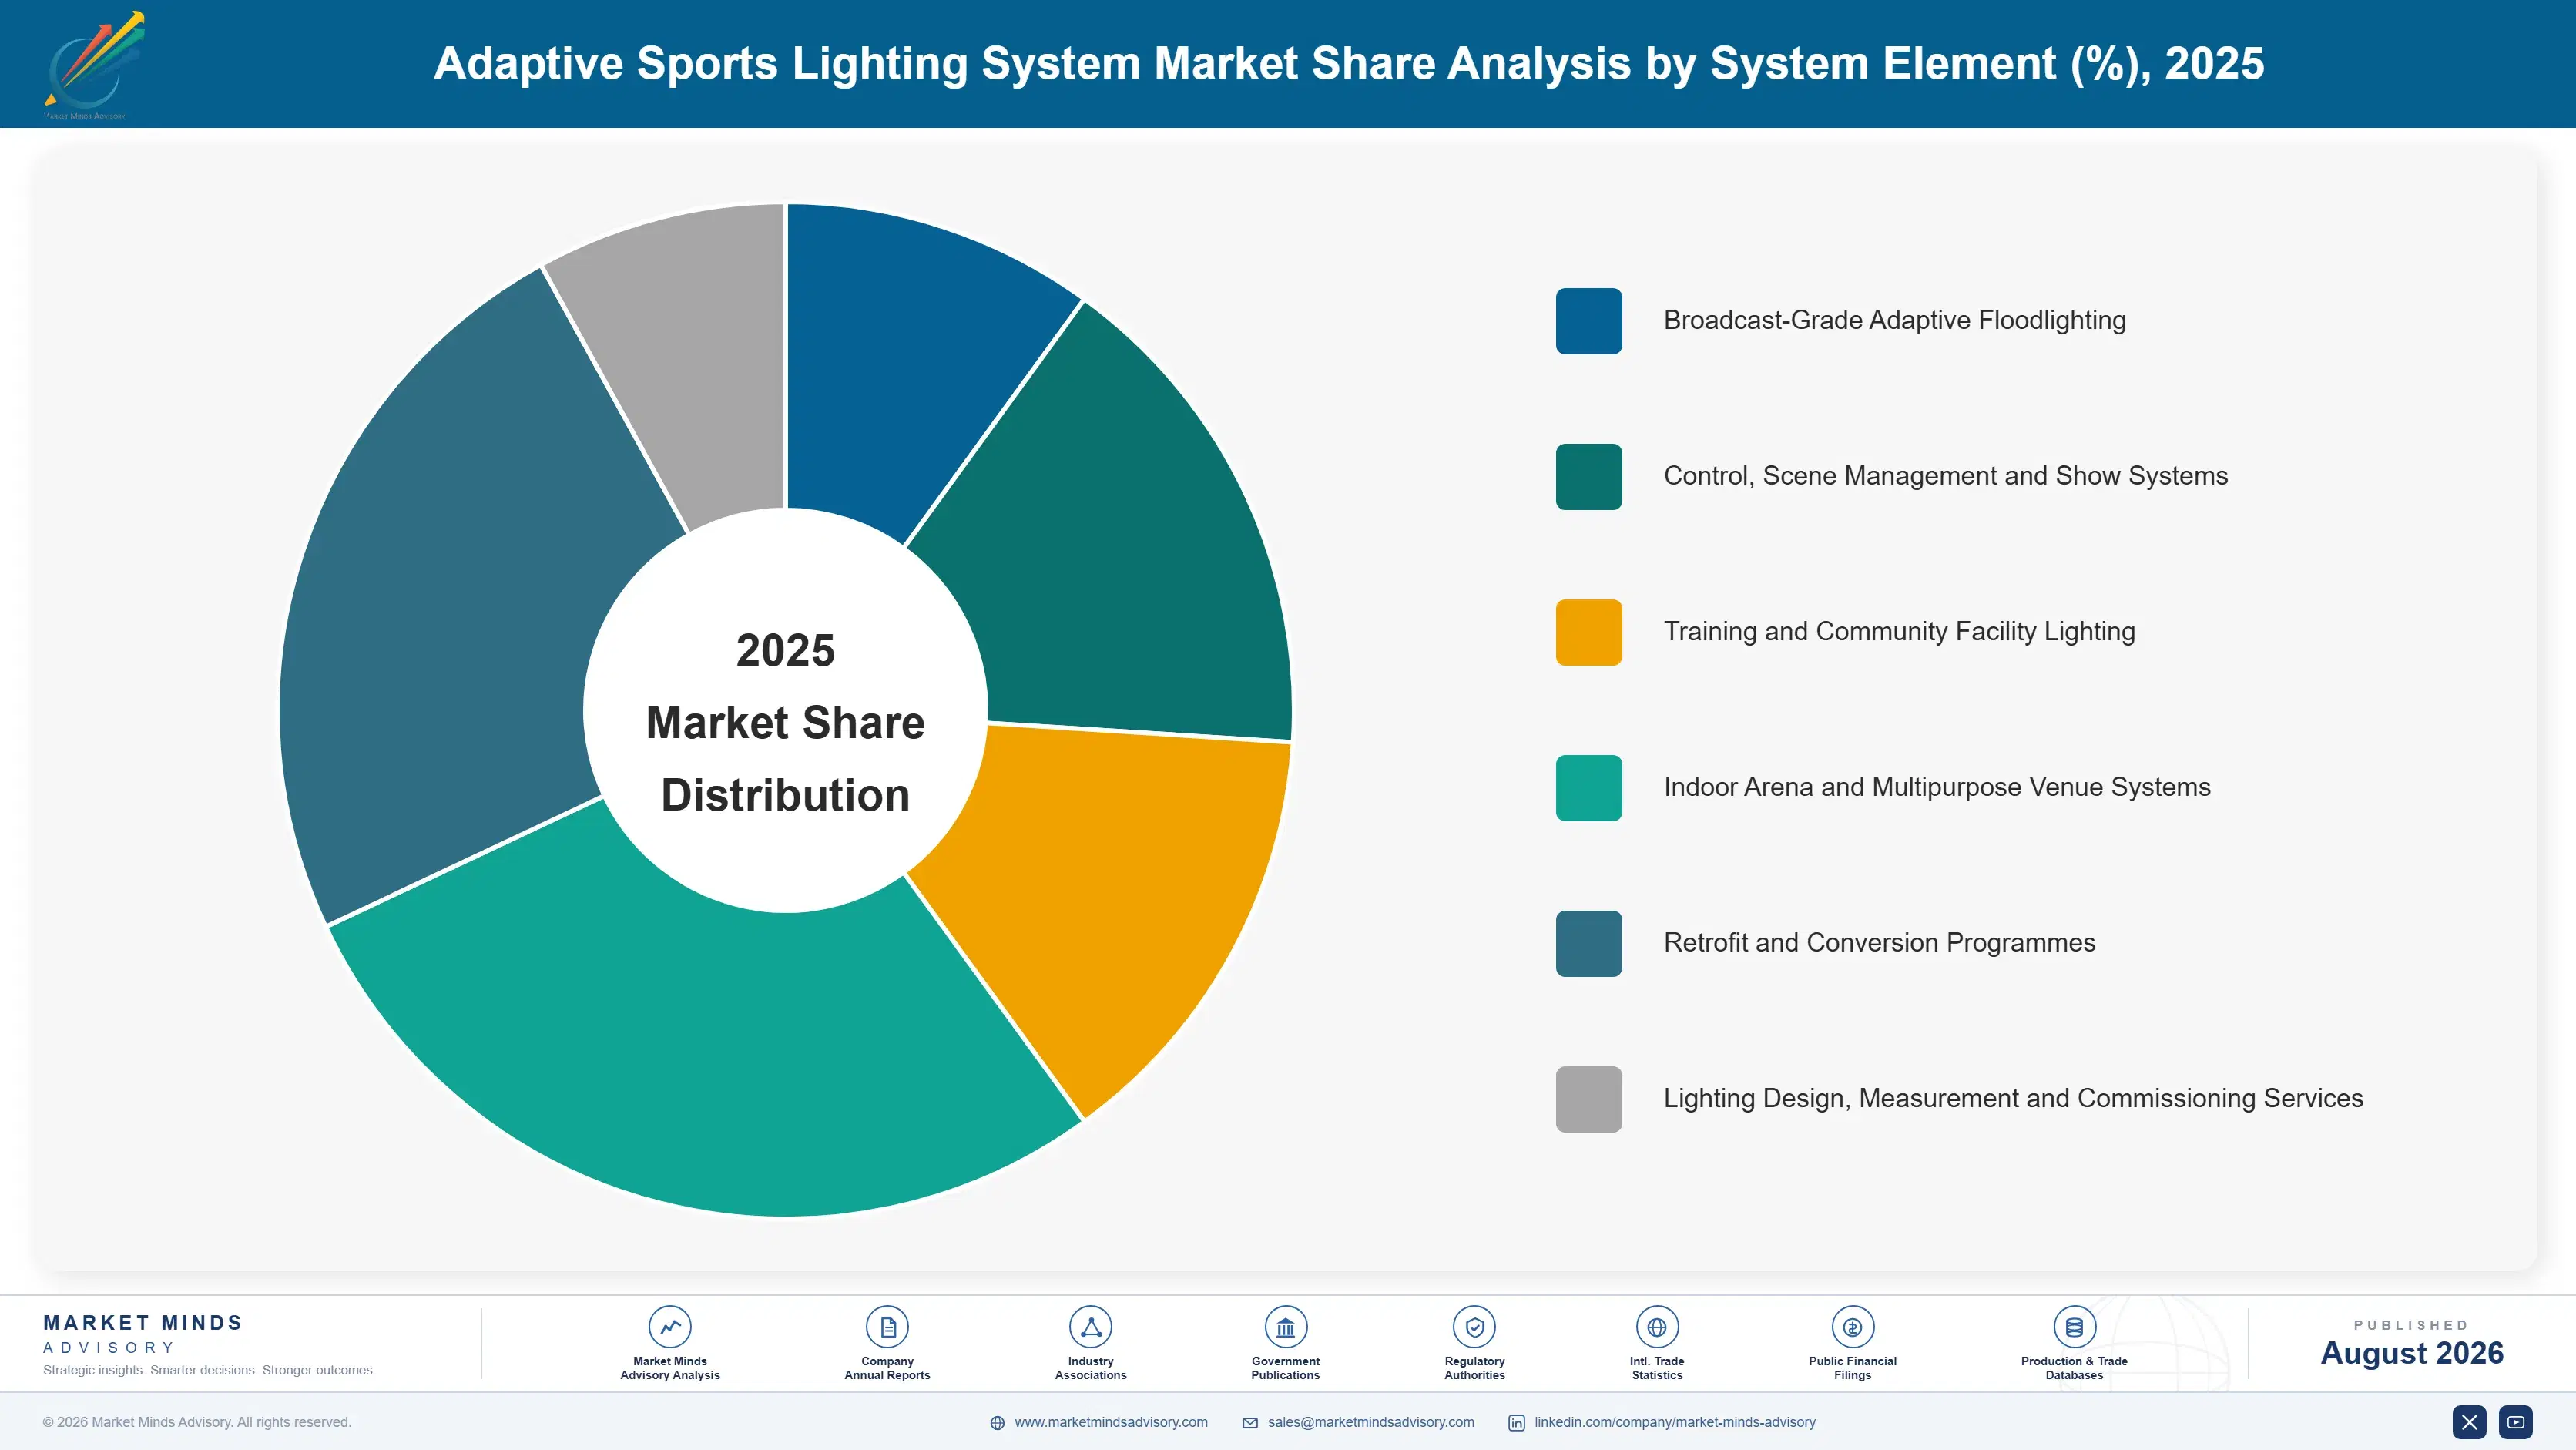
Segmentation follows system element, since broadcast floodlighting, control architecture, community conversion and design services are bought by different people against entirely different criteria. Six elements describe the market completely, from community facility lighting purchased on energy payback through to control systems where the value has been quietly relocating for most of the past decade now.
adaptive-sports-lighting-system-market-market-share-analysis-1788165744347

Control, Scene Management and Show Systems

The fastest element grows at 14.1%, half again the market rate of 9.4%, and it grows because the product changed underneath everybody. Once fixtures became instantly dimmable and individually addressable, a venue stopped buying light and started buying the ability to change what that light does within a single frame. Control now represents 24% of installed system value and is rising steadily. Show sequences, broadcast integration, scene recall and event choreography all live in that layer rather than in the fitting on the pole, and fixture manufacturers who treated it as bundled software have been slow to notice what they were giving away. Nobody sells light to a venue any more.
CAGR 14.1%

Broadcast-Grade Adaptive Floodlighting

Broadcast floodlighting grows at 10.7% on requirements that venues have no part in setting and no ability to decline. Capture at 1,000 frames per second exposes flicker and colour instability invisible to spectators, and vertical illuminance demands near 2,000 lux exist because the camera photographs faces rather than grass. Systems commissioned as fully compliant fail assessment years later because capture technology advanced, which produces replacement demand entirely disconnected from equipment condition. Qualification evidence is what separates suppliers here, and it is considerably harder to assemble than the fixtures themselves are to manufacture. Replacement demand disconnected from equipment condition is the most dependable revenue anywhere in venue infrastructure, by a distance.
CAGR 10.7%
Full segment breakdown across 6 segments available in the complete report.

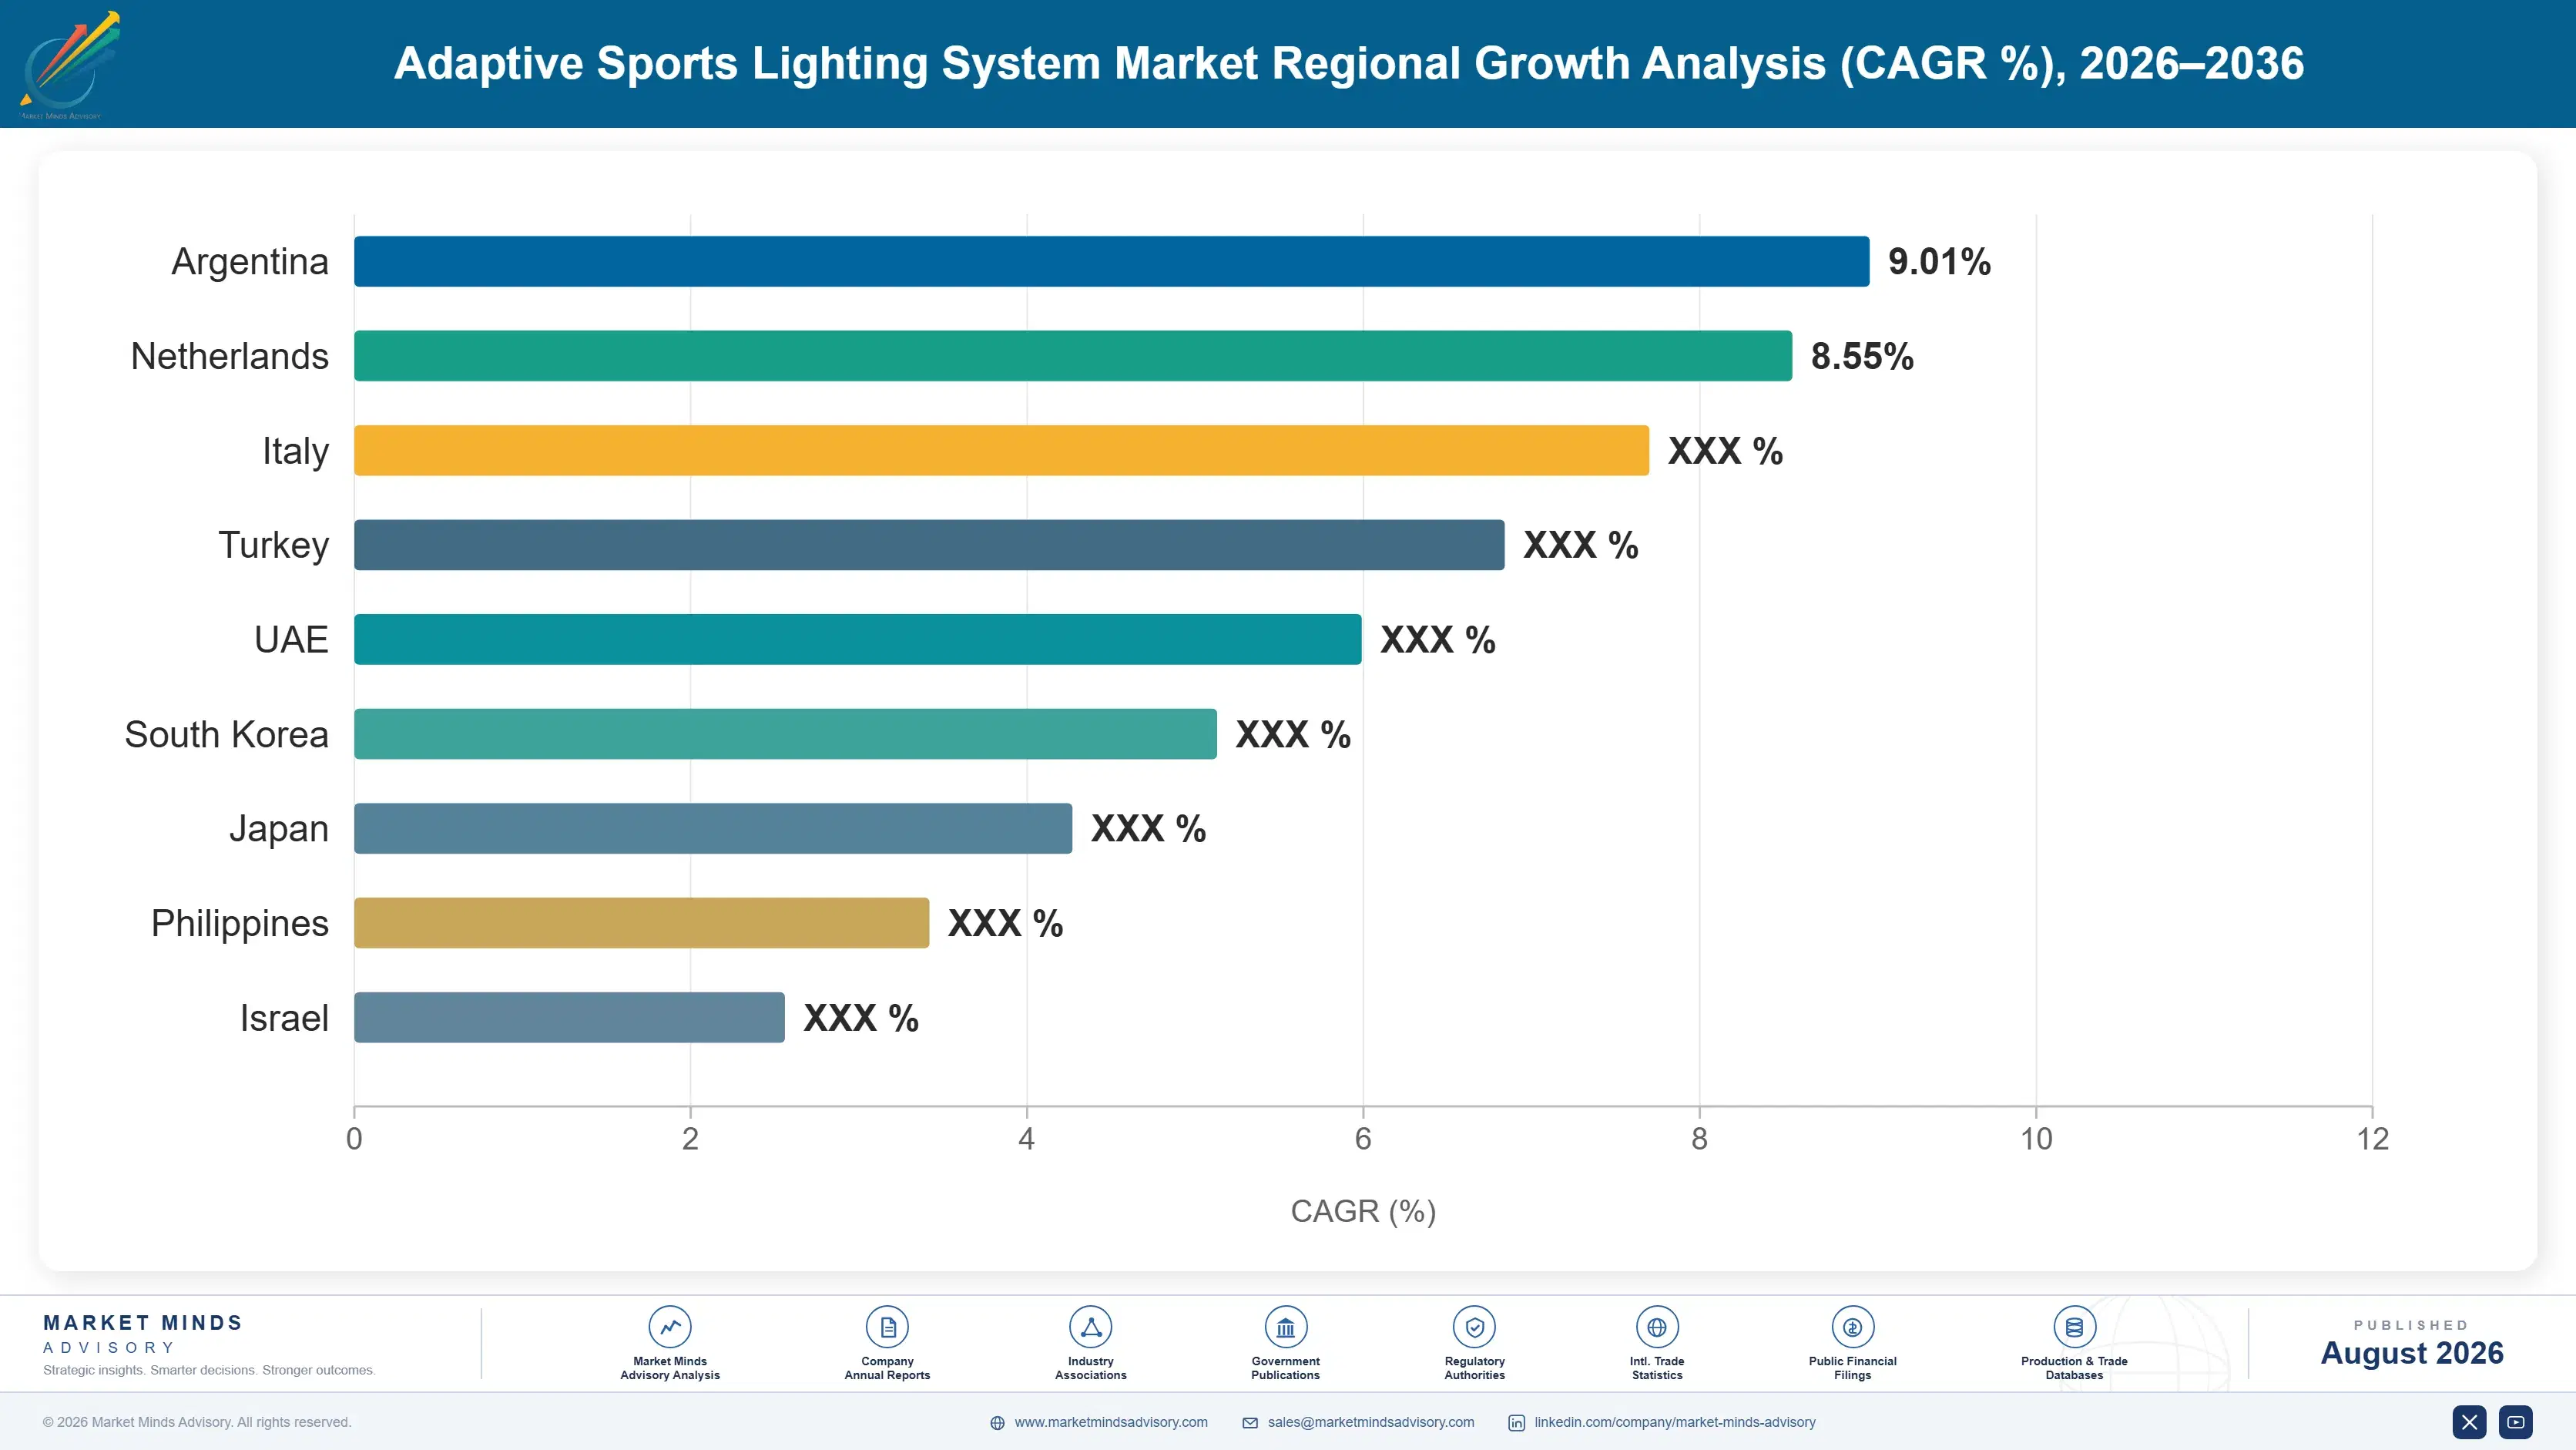
Regional Architecture and Country Demand Map

Demand follows broadcast investment, venue construction and public facility funding rather than participation levels. East Asia leads on new venue construction and conversion scale, with South Asia and Pacific growing fastest and mature markets spending mainly on broadcast-driven replacement. New construction rather than participation levels drives it.

East Asia

The largest share at 27% follows new venue construction at a scale no other region approaches, and new build is where complete systems including control architecture get specified together rather than retrofitted piece by piece. Chinese stadium and arena construction has continued across a decade at volumes that dwarf Western replacement activity. Japanese and Korean venues have upgraded broadcast capability aggressively against domestic competition requirements. Regional manufacture supplies a growing share of fixtures, though broadcast qualification remains concentrated among established international suppliers. Specifying a complete system including control at the design stage is considerably cheaper than retrofitting one afterwards, which gives new build regions a cost advantage that retrofit markets can never recover.
Share: 27% | CAGR: 10.4% (2026 to 2036)

North America

Replacement rather than new construction drives most spending here, with broadcast specification obliging upgrades at venues whose existing lighting works perfectly well. Professional league requirements are set centrally and applied across member venues, which produces coordinated upgrade programmes rather than individual decisions. Collegiate and high school facility conversion is enormous in facility count and modest in revenue per site. Show and entertainment lighting capability is specified more aggressively here than anywhere, since venues compete on the whole spectator experience. Central specification across a league produces coordinated demand that individual venue decisions never would, and suppliers able to deliver an entire competition inside one close season win work that smaller participants cannot even bid for.
Share: 25% | CAGR: 9.8% (2026 to 2036)
Regional intelligence for 5 additional markets available in the complete report: Western Europe, South Asia and Pacific, Latin America, Middle East and Africa, Eastern Europe. Contact sales@marketmindsadvisory.com.
adaptive-sports-lighting-system-market-country-cagr-analysis-1788165744872

Where Sports Lighting Margin Sits

Four levers work on control position, qualification evidence and financing structure rather than on fixture efficiency, which every serious supplier can now demonstrate adequately. Control ownership, broadcaster engagement, performance contracting and service capability each address something a supplier can pursue immediately. None of the four requires a more efficient fixture than anybody else already builds today.

Own The Control Layer Rather Than Bundling It

Control represents 24% of installed system value, grows at 14.1% against 9.4% for the market, and is where a venue's actual purchasing interest has migrated. Suppliers bundling control software free with fixtures are giving away the fastest growing and highest margin part of what they sell. Pricing and developing it as a product rather than an accessory changes the revenue mix substantially. Fixture efficiency is now a threshold requirement that everybody meets and nobody pays a premium for. The 24% share is rising and nobody is charging for it properly.
Market Impact: Holds the growing 24% control share of value

Engage Broadcasters Before Specifications Are Written

Broadcast requirements are set by rights holders and camera technology rather than by venues or lighting suppliers, and they arrive as obligations rather than as consultations. Suppliers with relationships inside those discussions understand requirement direction 2 years before it reaches a tender document. That lead time decides who has qualification evidence ready when the specification lands. Participants learning about a new requirement from a tender are already competing against somebody who helped shape it. Requirements always arrive as obligations, and knowing about about them early is the whole available advantage.
Market Impact: Gains roughly 2 years of specification lead time

Fund Community Conversion Through Performance Contracting

Municipal facility conversion repays in under 5 years on energy savings around 61%, and it stalls because public capital budgets compete against every other local priority rather than because the case is weak. Energy performance contracting removes the capital decision entirely by funding installation against the savings it generates. Suppliers offering that structure reach a facility population that outright sale cannot, and they capture a multi-year revenue relationship rather than a single equipment transaction. The whole facility population reachable this way is very considerably larger than the professional venue population.
Market Impact: Repays within a 5 year performance contract term

Sell Measurement And Commissioning As A Service

Broadcast compliance is verified rather than declared, and venues need measurement evidence at commissioning and again whenever a specification changes underneath them. Very few venues hold that capability and most suppliers treat it as a cost of sale rather than as a service worth charging for. Recurring compliance verification typically adds 6 to 9 percent to system revenue across a venue relationship. It also puts the supplier in the room when the next upgrade is being discussed. Being in that room when the next specification lands is worth a great deal.
Market Impact: Adds roughly 8% more in recurring service revenue

Who Controls the Margin Pool

Concentration is high at around 58% across the five largest participants measured on adaptive sports lighting system revenue, and broadcast qualification rather than manufacturing capability is what holds it there. A fixture that cannot demonstrate flicker performance at high capture rates is excluded from televised venues entirely, whatever its efficiency, price or general lighting quality happens to be. Nothing else keeps them out.
Competition runs on qualification evidence, control capability and delivery scale. Qualification evidence decides whether a supplier can bid for broadcast work at all. Control capability decides who captures the fastest growing part of installed value. Delivery scale decides who can execute a league-wide programme within a single close season, which is a genuine constraint that eliminates smaller participants regularly. All three are genuine filters.

Pressure is arriving from control and entertainment lighting specialists rather than from general lighting manufacturers. Show lighting participants hold software and choreography capability that fixture makers assembled late and reluctantly. Venue operators meanwhile increasingly specify control separately from fixtures. Rankings will shift toward participants holding broadcast qualification alongside genuine control architecture, since very few currently hold both convincingly. Very few hold both at present.
adaptive-sports-lighting-system-market-company-positioning-matrix-1788165745398

Competitive Moat and Risk Dimensions

SIGNIFY

Moat: Broadcast qualification with global delivery

Signify holds broadcast qualification evidence across major competition standards alongside delivery capability that can execute a league-wide programme within a single close season, which is a combination very few participants can offer. Reference installations at premium venues carry weight in specification that no laboratory result replicates. Scale across general lighting funds development that sports volumes alone would never justify.
SIGNIFY

Risk: Control capability assembled comparatively late

Value has moved toward control architecture that specialist entertainment lighting participants built earlier and understand better, and a fixture-led organisation has genuine difficulty treating software as the primary product. Venue operators specifying control separately reduce the advantage of bundled supply. Retrofitting organisational priorities is slower than acquiring the underlying capability.
MUSCO LIGHTING

Moat: Sports specialisation and service model

Musco Lighting focuses entirely on sports and outdoor venue lighting rather than treating it as one application among many, which shows in specification depth, service model and understanding of how venues actually operate. Long-term service and warranty arrangements create relationships that persist across replacement cycles. Broadcast qualification and reference installations at major venues are extensive and difficult to replicate quickly.
MUSCO LIGHTING

Risk: Narrow application base concentrates exposure

Specialising entirely in sports lighting concentrates exposure to venue construction and broadcast upgrade cycles that are irregular and occasionally slow considerably. General lighting participants absorb those troughs across other applications. Community facility conversion depends on public budgets that disappear quickly, which affects a specialist far more directly than a diversified competitor.

Players Tracked

Prominent Players

Signify
Musco Lighting
ABB
Zumtobel Group
Stadium Lighting Solutions

Other Key Players

Acuity Brands
Eaton Lighting
Thorn Lighting
Abacus Lighting
GE Current
Ephesus Lighting
Qtrans Lighting
Anolis
Chauvet Professional
Osram
Fagerhult Group
LEDVANCE
SGM Light
Sportsbeams Lighting
Vision Lighting

Recent Developments

MARCH 2024

Competition organiser raised broadcast lighting requirements across member venues

A competition organiser raised flicker and vertical illuminance requirements applying across all member venues, obliging upgrades at facilities whose existing installations were fully compliant when commissioned and remain in perfectly serviceable condition. This was a competition standards decision rather than any commercial arrangement between lighting suppliers.
Signal: Requirements set centrally across a competition produce coordinated upgrade demand that individual venue decisions never would.
AUGUST 2024

Venue specified control architecture separately from fixture supply

A major venue tendered lighting control and show management architecture as a separate procurement from fixture supply, treating the control layer as a distinct system rather than as software bundled with whichever luminaires were selected. This was a procurement structure decision rather than any transaction between the suppliers involved.
Signal: Separating control from fixtures confirms where venues now believe the actual value in this market sits.
JANUARY 2025

Municipal authority converted facilities under energy performance contract

A municipal authority converted a large portfolio of community sports facilities to controllable lighting under an energy performance contract, funding installation against measured consumption savings rather than from a capital budget it did not have available. This was a financing arrangement rather than any corporate transaction between participants.
Signal: Performance contracting reaches a facility population that outright capital purchase could never have reached at all.

What A Venue System Costs

Cost divides four ways and installation is heavier than the equipment suggests. Installation, access equipment and commissioning absorb roughly 33% of system cost, luminaires and drivers near 30%, control architecture and software near 24%, and design, measurement and compliance evidence the remaining 13%. Working at height above a playing surface inside a close season window drives that share, since the same work in an empty building costs far less.
Driver electronics and aluminium pricing moved sharply across recent years and raised luminaire cost accordingly, since these are electronically complex fittings with substantial metal housings. Signify and Zumtobel Group have both discussed component cost and supply conditions across recent reporting periods. Specialist installation labour with height access and venue clearance has been the more damaging constraint, because a close season window that slips has nowhere to move to.

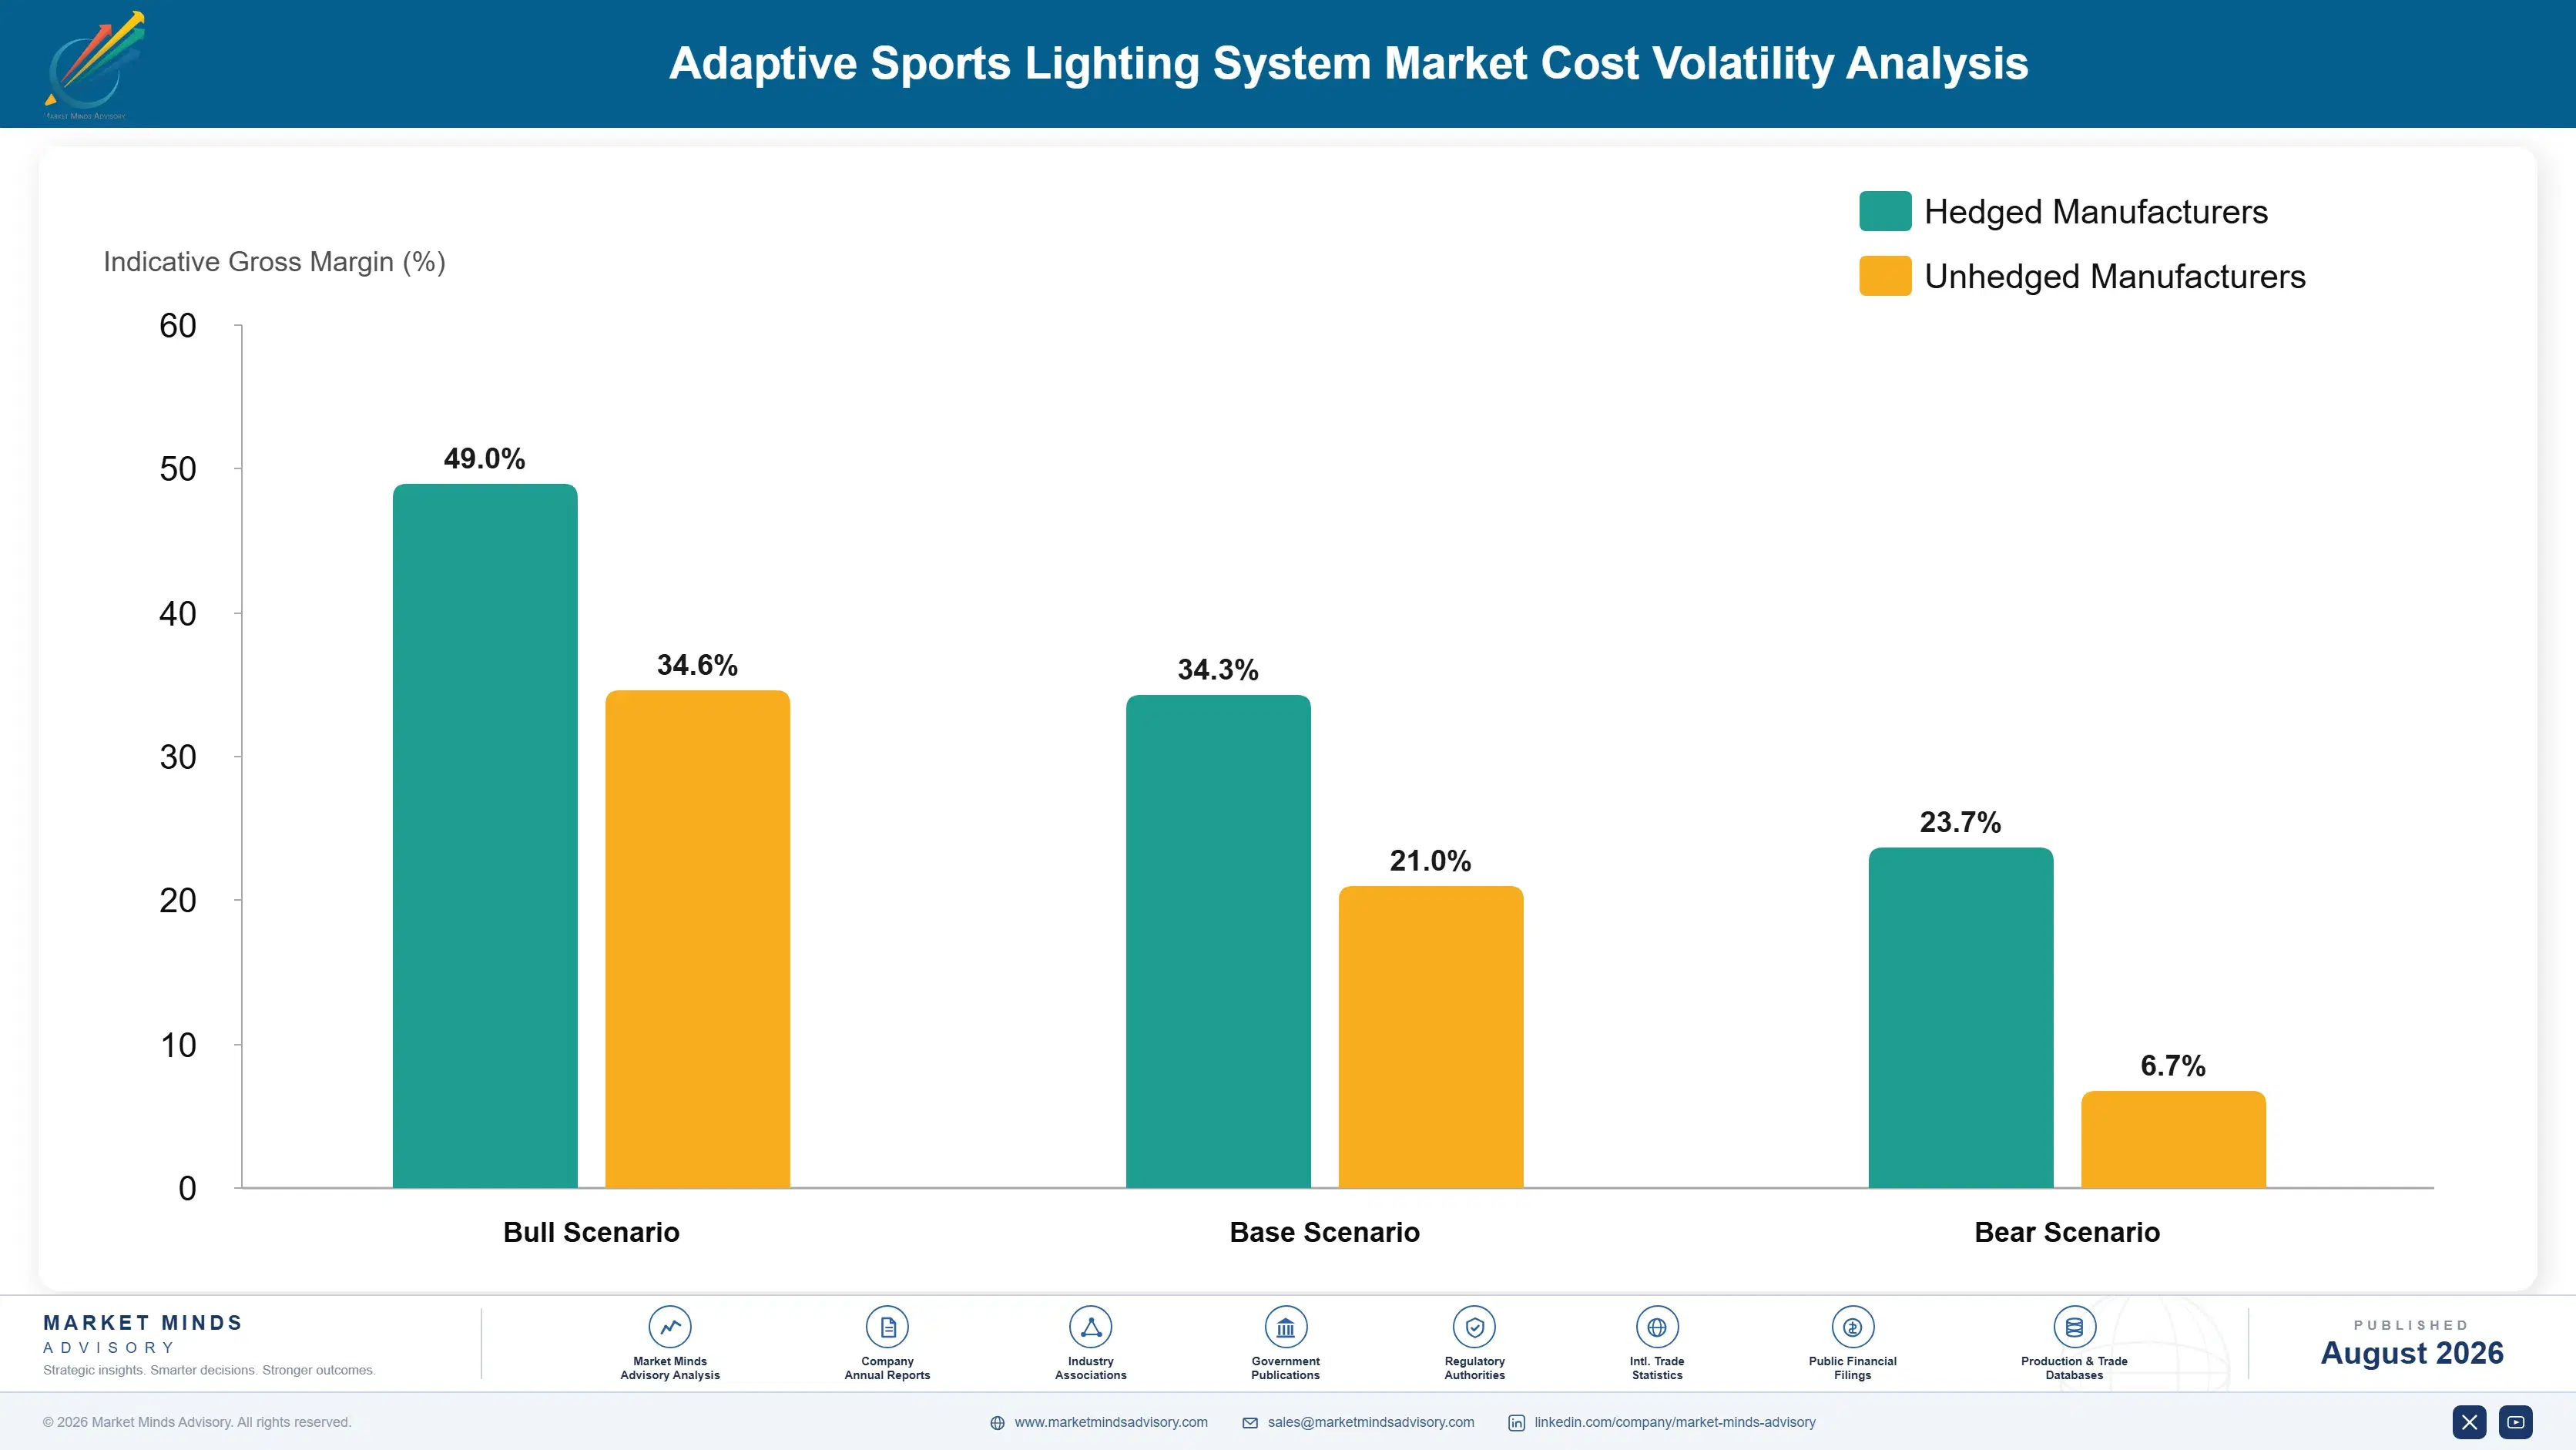
Exposure varies by contract structure rather than by geography. Suppliers on fixed-price installation contracts inside operating venues carry schedule risk that has proved worse than material risk repeatedly. Those holding service and compliance verification positions recover cost across a venue relationship. Performance contracting participants carry the asset and the savings risk, and receive a multi-year revenue stream outright sale never generates.
adaptive-sports-lighting-system-market-cost-volatility-analysis-1788165745592

Close season scheduling secured before contract award

Installation above a playing surface happens inside a close season window that cannot move, and specialist height access crews are scarce during exactly that period. Securing crews before award rather than after costs comparatively little against a schedule that slips into a playing season. Most suppliers begin recruiting once the contract is signed and the window is already fixed.

Control software priced as product rather than accessory

Control represents roughly a quarter of installed system value and is frequently bundled free to win the fixture supply, which gives away the fastest growing part of the sale. Pricing it separately reflects what venues actually now buy. Suppliers who bundle are competing on fixture price against participants charging properly for the layer that matters most.

Compliance measurement retained as a recurring service

Broadcast compliance is verified rather than declared and requires re-measurement whenever a specification changes underneath a venue. Very few venues hold that capability themselves, and most suppliers treat measurement as a cost of sale rather than a chargeable service. Retaining it recovers cost and puts the supplier in the room when the next upgrade is discussed.

Portfolio Architecture for Margin Defence

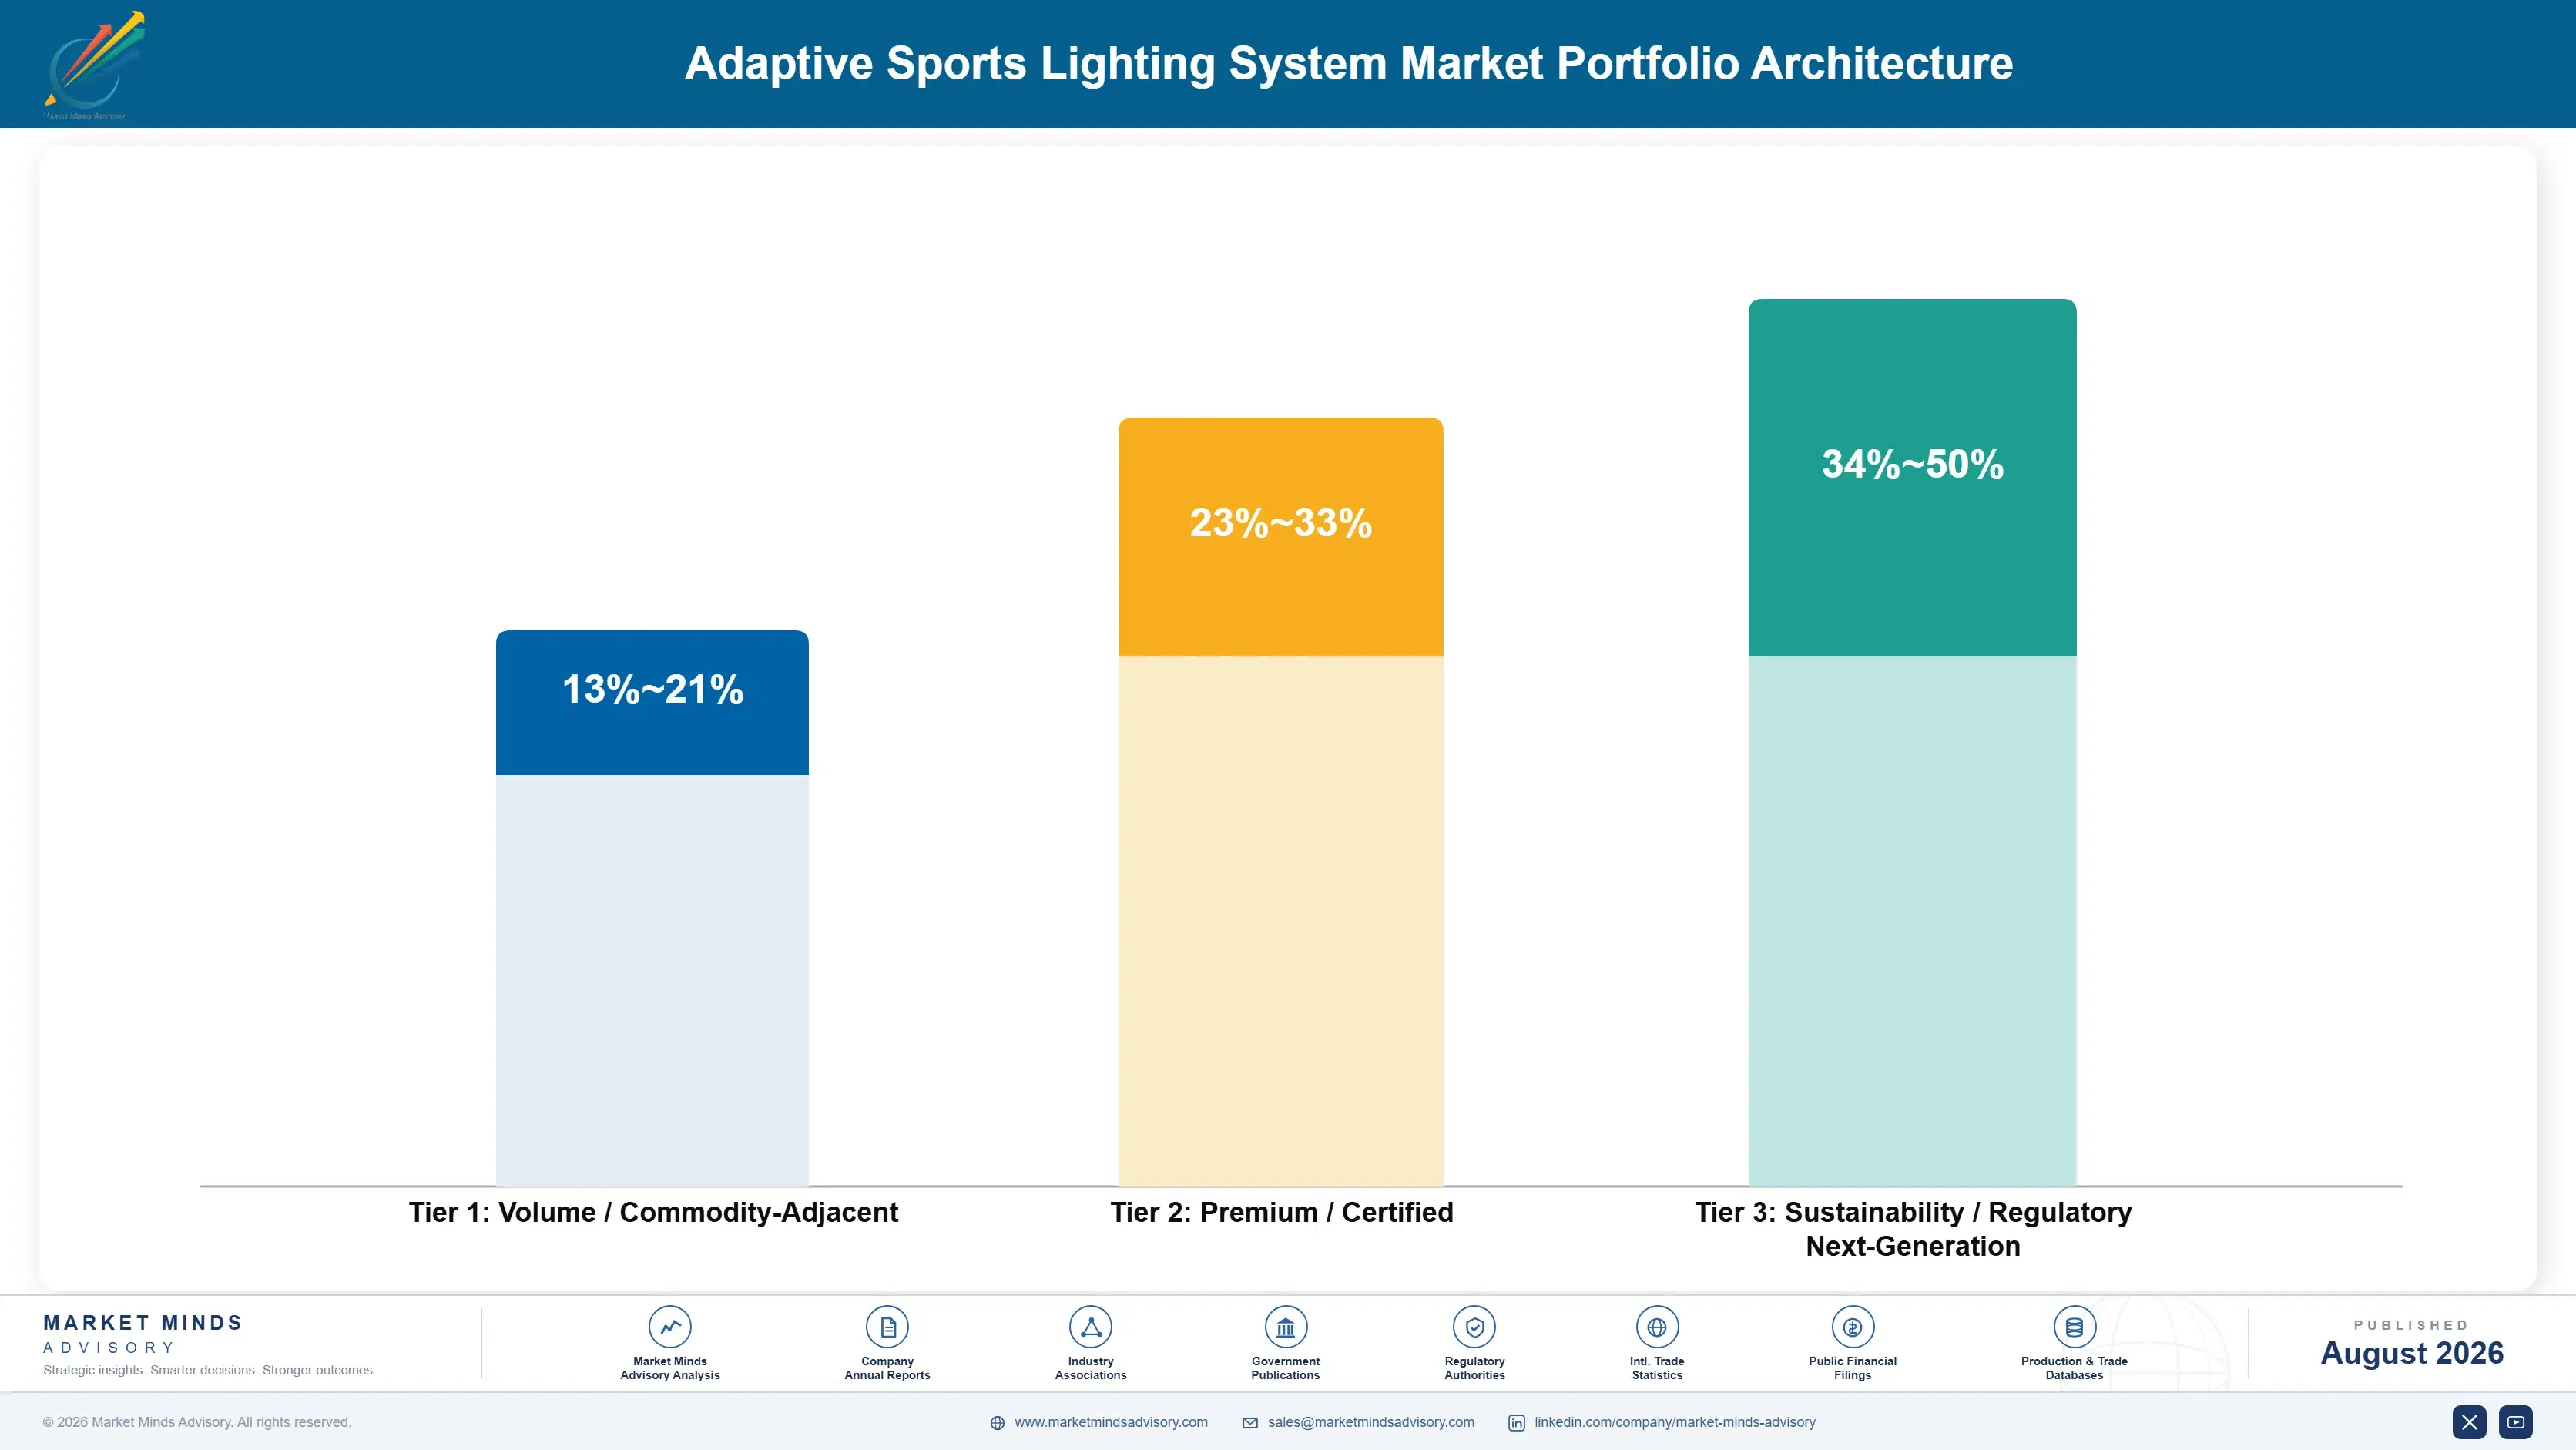
The portfolio separates by who writes the specification. Community and training facility lighting is the volume core in facility count: enormous numbers of sites, modest revenue each, purchased on energy payback and constrained by public capital that appears and disappears with political cycles rather than with any assessment of the facilities themselves. Nothing about that facility population is predictable and everybody planning against it learns so.
Margin concentrates in broadcast floodlighting and in control. Broadcast work is protected by qualification evidence that excludes otherwise capable manufacturers entirely. Control represents 24% of installed value, grows at 14.1%, and is where venue purchasing interest has migrated. Very few participants hold both convincingly, which is precisely where the competitive movement in this market is now happening. Both barriers are real ones.

The overlooked pool is compliance verification. Broadcast performance is verified rather than declared, venues almost never hold the capability, and most suppliers treat measurement as a cost of winning rather than a service worth charging for. It adds recurring revenue and puts the supplier in the conversation when the next specification change arrives. Nobody charges for it yet, which is the opportunity here.

Volume / Commodity-Adjacent

Community and training facility luminaires, installation contracting and general outdoor sports lighting. Range spans eight points because installation efficiency and project scale decide outcomes far more than product distinction does.
Gross Margin: 13-21%

Premium / Certified

Broadcast-grade floodlighting, indoor arena systems and retrofit conversion programmes at professional venues. Range spans ten points because qualification breadth and delivery scale vary considerably between suppliers in this tier. Delivery scale decides much.
Gross Margin: 23-33%

Sustainability / Regulatory / Next-Generation

Control and show systems, compliance measurement services and energy performance contracting. Range spans sixteen points because software economics and financed contracting are barely comparable businesses inside a single tier. Recurrence changes the economics.
Gross Margin: 34-50%
adaptive-sports-lighting-system-market-portfolio-architecture-1788165746106

High-value Sub-segments and Strategic Watch-out

Control, Scene Management and Show Systems

High value and high growth at 14.1%, holding 24% of installed value and rising as venues buy capability rather than light. The twelve point range separates participants pricing control as a product from those still bundling it free with fixture supply. Venues have noticed and suppliers have not.
Gross Margin: 38-50%

Broadcast-Grade Adaptive Floodlighting

High value with moderate growth at 10.7%, protected by qualification evidence that excludes otherwise capable general lighting manufacturers entirely. The ten point range reflects delivery scale, since league-wide programmes inside one close season eliminate smaller participants regularly. Evidence rather than engineering decides who can bid.
Gross Margin: 25-35%

Community and Training Facility Lighting

The volume core by facility count and the least predictable revenue anywhere in this market. Purchased on energy payback, funded from public capital budgets that vanish with political cycles, and competed almost entirely on installed price. The case is strong and the funding is not.
Gross Margin: 13-21%

Broadcast Qualification Evidence

The strategic watch-out rather than a growth pool. Requirements are set by camera technology and rights holders, tighten faster than replacement cycles, and suppliers without current evidence cannot bid for televised venue work at all. Nobody working in this industry sets that requirement themselves at all.
Gross Margin: Variable

Why Venue Positions Persist

A venue installation produces annuity economics across a replacement interval near 16 years. The supplier who commissioned a system holds the measurement baseline, the control configuration and the service relationship, and a venue changing supplier accepts an unfamiliar control architecture and a compliance history that starts again from nothing. Nobody undertakes that without cause, which makes the original specification decision considerably more consequential than its contract value suggests.
Stickiness varies by element. Control positions are the most durable, since operators learn a system, build show sequences within it and will not readily rebuild that work elsewhere. Broadcast floodlighting persists through the replacement interval and is genuinely contested at each renewal. Community facility work has no stickiness at all, being competed on installed price against whoever is cheapest whenever a budget happens to appear.

The buyer has changed in a way that favours different suppliers. Venue lighting was once specified by facility engineers evaluating illuminance and energy. It is now specified by broadcast and event operations staff asking what the system can do during a match, and by finance functions asking how it will be funded. Suppliers organised around lighting engineering find both conversations harder than they expected.
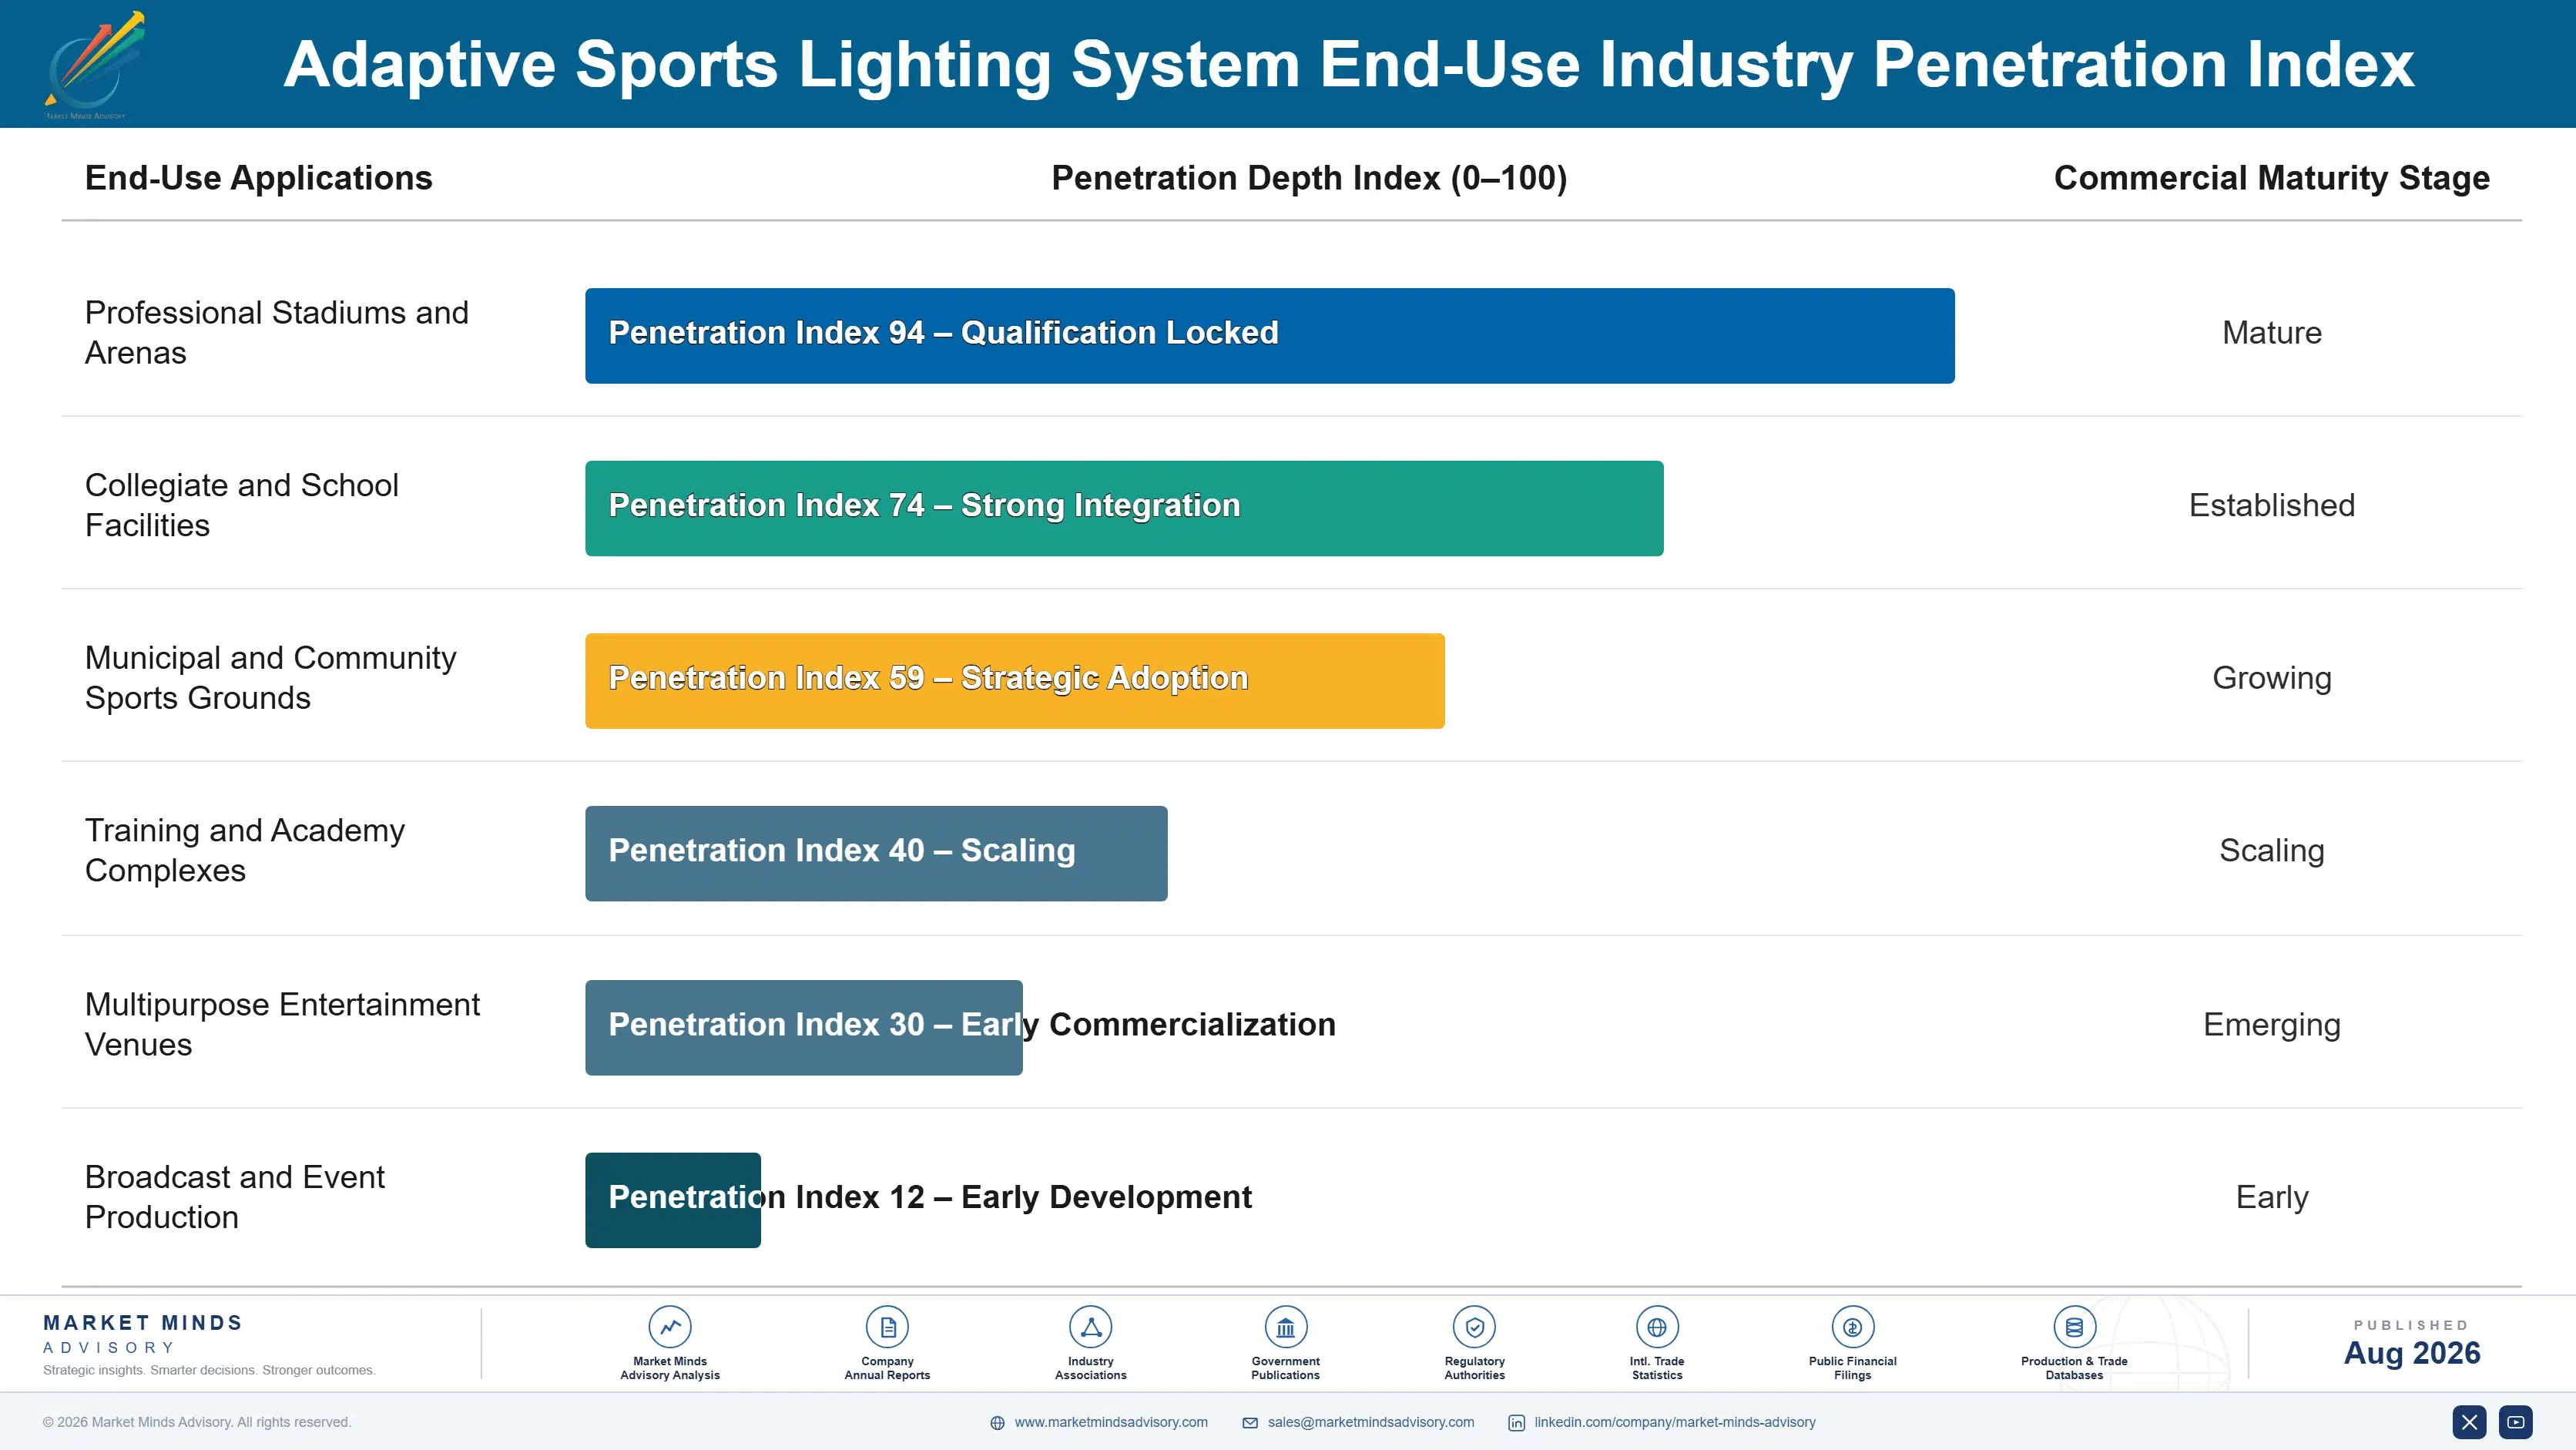
adaptive-sports-lighting-system-market-end-use-penetration-index-1788165746598

Where Suppliers Should Commit Now

These are among the four positions where our research anticipates prominent divergence between winners and laggards over the coming forecast period. Each is grounded in the demand model, the regulatory perimeter, and the announced capacity pipeline.
01 / CONTROL LAYER OWNERSHIP

Stop giving away the part venues actually buy

Control represents 24% of installed system value, grows at 14.1% against 9.4% for the wider market, and is precisely where a venue's actual purchasing interest has migrated over the course of the past decade. Suppliers bundling control software free alongside fixtures are giving away the fastest growing and highest margin part of what they sell away to anybody at all. Fixture efficiency has become a threshold requirement that every serious participant meets and nobody pays any real premium for at all.
02 / BROADCAST REQUIREMENT ANTICIPATION

Specifications arrive as obligations, not consultations

Broadcast requirements here are set by rights holders and by camera technology rather than by venues or by anybody working in the lighting industry, and they arrive as obligations rather than as invitations to comment on anything. Suppliers who hold relationships inside those discussions understand the direction of travel roughly two years before it reaches any formal tender document. That lead time decides who already has qualification evidence fully assembled when the specification finally lands on the table at all.
03 / PERFORMANCE CONTRACT FINANCING

Remove the capital decision from public authorities

Municipal facility conversion generally repays in well under five years on energy savings around 61%, and it stalls because public capital budgets compete against every other local priority rather than because the underlying financial case is at all weak anywhere. Energy performance contracting removes that capital decision from them entirely by funding the installation against the savings that it actually generates. Suppliers who offer the structure reach an entire facility population that outright sale simply cannot get to at all.
04 / COMPLIANCE SERVICE CAPTURE

Verification is a service, not a cost of sale

Broadcast compliance is verified rather than merely declared, and venues then need measurement evidence at commissioning and again whenever a specification changes underneath them without any warning at all. Very few venues hold any of that capability internally at all, and most suppliers still treat it as a cost of winning rather than as a service that anybody would actually pay for. Recurring compliance verification typically adds somewhere between six and nine percent to system revenue across the whole venue relationship.

Engagement Snapshot From the Field

A live engagement with an industry participant carrying material or product regulatory and market exposure ahead of a defining policy shift, showing how our research translates into a defensible multi-year portfolio strategy.
MARKET MINDS ADVISORY · CLIENT ENGAGEMENT SUMMARY
Adaptive Sports Lighting System Producer Strategic Portfolio Review and Transition Roadmap 2026·Investment Scenario on Adaptive Sports Lighting System Exposure Evaluation 2025-26
CLIENT PROFILE
A sports lighting manufacturer supplying broadcast-grade floodlighting to professional venues and community facility systems through electrical contractors, bundling control software free with every fixture package to win the hardware supply. Revenue was stable while margin had declined for three years, and management attributed the decline to fixture price competition from general lighting manufacturers entering the category.
STRATEGIC CHALLENGE
The board needed to establish whether bundling control software was costing more than the fixture volume it won, and whether developing control as a priced product justified the commercial disruption it would cause. It also faced a decision on whether to offer energy performance contracting for community conversion, which finance leadership regarded as balance sheet risk it had no appetite to carry.
MMA APPROACH
MMA rebuilt margin by system element across three years, separating fixture, installation, control and service revenue properly for the first time. It modelled control priced as a product against continued bundling under several volume scenarios. Expert interviews with venue operators, competition organisers, broadcasters and electrical contractors established what venues now specify and who actually makes the decision.
KEY FINDINGS
  1. Control software bundled free represented roughly a quarter of the value delivered and none of the revenue recognised, and it had never been costed as a separate element internally.
  2. Venue operators interviewed regarded control capability as the deciding factor in recent specifications, and several had begun tendering it separately from fixture supply.
  3. Compliance measurement performed at commissioning was absorbed as a cost of sale on every project, and no venue had ever been offered it as a recurring service.
  4. Community conversion projects lost on capital availability rather than on price, and none of the authorities involved had been offered any financing structure at all.
CLIENT PROFILE
A sports lighting manufacturer supplying broadcast-grade floodlighting to professional venues and community facility systems through electrical contractors, bundling control software free with every fixture package to win the hardware supply. Revenue was stable while margin had declined for three years, and management attributed the decline to fixture price competition from general lighting manufacturers entering the category.
STRATEGIC CHALLENGE
The board needed to establish whether bundling control software was costing more than the fixture volume it won, and whether developing control as a priced product justified the commercial disruption it would cause. It also faced a decision on whether to offer energy performance contracting for community conversion, which finance leadership regarded as balance sheet risk it had no appetite to carry.
MMA APPROACH
MMA rebuilt margin by system element across three years, separating fixture, installation, control and service revenue properly for the first time. It modelled control priced as a product against continued bundling under several volume scenarios. Expert interviews with venue operators, competition organisers, broadcasters and electrical contractors established what venues now specify and who actually makes the decision.
KEY FINDINGS
  1. Control software bundled free represented roughly a quarter of the value delivered and none of the revenue recognised, and it had never been costed as a separate element internally.
  2. Venue operators interviewed regarded control capability as the deciding factor in recent specifications, and several had begun tendering it separately from fixture supply.
  3. Compliance measurement performed at commissioning was absorbed as a cost of sale on every project, and no venue had ever been offered it as a recurring service.
  4. Community conversion projects lost on capital availability rather than on price, and none of the authorities involved had been offered any financing structure at all.
RECOMMENDED STRATEGY
Phase 1: Phase one: price control software as a separate product line and stop bundling it free to win fixture supply volume. Phase 2: Phase two: offer compliance measurement and re-verification as a recurring service to every venue that the company has already commissioned. Phase 3: Phase three: establish energy performance contracting through a financing partner rather than carrying any of that balance sheet exposure directly itself.
OUTCOME
The client reported margin recovering 5.4 points within four quarters as control revenue was recognised properly (client-reported, unverified by MMA). Fixture volume fell slightly and mattered less than expected. Compliance services began at eleven venues, and a financing partner was appointed for community conversion work.

Frequently Asked Questions

Foundational context covering the market sizes, CAGR, scope, country, region and competition that inform every finding below. This section is provided to cover basics and most often pre-purchase conversations, answered from the MMA Primary Research Dataset.

What is the current size of the Adaptive Sports Lighting System Market?

The market is valued at USD 3.1 billion in 2025, measured as revenue from electronically controllable lighting systems installed at sports venues across the world.

How large will the Adaptive Sports Lighting System Market be by 2036?

MMA forecasts USD 8.33 billion by 2036, up from USD 3.39 billion in 2026. That represents incremental revenue of USD 4.94 billion and an expansion multiple of 2.46 times.

What is the CAGR for the Adaptive Sports Lighting System Market 2026 to 2036?

The base case CAGR is 9.4%, with a bull case of 10.6% and a bear case of 8.1%. Broadcast requirement tightening and control adoption supply most of that growth.

Which segment is growing fastest?

Control, scene management and show systems grow at 14.1%, half again the market rate of 9.4%, because venues now buy the ability to change light rather than light itself.

Who are the major companies in the Adaptive Sports Lighting System Market?

Signify, Musco Lighting, ABB, Zumtobel Group and Stadium Lighting Solutions lead on system revenue, holding around 58% between them across the whole of this market.

Which country is growing fastest?

India grows fastest at 11.6%, driven by venue construction and by broadcast investment in domestic competitions that has raised lighting requirements sharply within a short period.

Report Segmentation Architecture

The full report scope spans multiple orthogonal segmentation dimensions, with cross-tabulated demand data provided for each dimension pair. Coverage extends further to regional breakdowns, trend trajectories, and the competitive detail needed to support segment-level decision-making.

By System Element

  • Broadcast-Grade Adaptive Floodlighting
  • Control, Scene Management and Show Systems
  • Training and Community Facility Lighting
  • Indoor Arena and Multipurpose Venue Systems
  • Retrofit and Conversion Programmes
  • Lighting Design, Measurement and Commissioning Services

By End-Use Industry

  • Professional Stadiums and Arenas
  • Collegiate and School Facilities
  • Municipal and Community Sports Grounds
  • Training and Academy Complexes
  • Multipurpose Entertainment Venues
  • Broadcast and Event Production

By Commercial Dimension

  • Direct Venue Procurement
  • Competition Organiser Programmes
  • Electrical Contractor Supply
  • Energy Performance Contracting
  • Design and Consultancy Services
  • Recurring Compliance Verification

By Region

  • East Asia
  • North America
  • Western Europe
  • South Asia and Pacific
  • Latin America
  • Middle East and Africa
  • Eastern Europe

Scope, Methodology, and Coverage

Every figure in this report is reproducible from documented input assumptions. The scope below maps the historical period, the forecast horizon, the segmentation dimensions, and the countries covered, alongside the underlying primary and qualitative methodology.
Historical Period
2020 to 2025
Forecast Period
2026 to 2036
Base Year
2025 (USD billions; MMA Primary Research Dataset, August 2026)
Market Definition
Revenue from lighting systems installed at sports venues with electronically controllable output, spanning broadcast-grade adaptive floodlighting, control, scene management and show systems, training and community facility lighting, indoor arena and multipurpose venue systems, retrofit and conversion programmes, and lighting design, measurement and commissioning services. Direct venue procurement, competition organiser programmes, electrical contractor supply, energy performance contracting, design consultancy and recurring compliance verification are all included. General architectural and street lighting, scoreboard and video display systems, stadium electrical infrastructure beyond the lighting installation, and temporary event lighting hired rather than installed are excluded.
Quantitative Units
USD billions, installed system and associated service revenue
Segmentation Dimensions
System element, venue type, commercial procurement model, region
Regions Covered
East Asia, North America, Western Europe, South Asia and Pacific, Latin America, Middle East and Africa, Eastern Europe
Countries Covered
China, Japan, South Korea, United States, Canada, United Kingdom, Germany, France, Spain, India, Australia, Brazil, Qatar, Poland
Key Companies Profiled
Signify, Musco Lighting, ABB, Zumtobel Group, Stadium Lighting Solutions, Acuity Brands, Thorn Lighting, Ephesus Lighting, Abacus Lighting, Fagerhult Group
Quantitative Methodology
Primary survey, n=3,800 respondents, Q4 2025, six countries; demand-side model with trade association cross-validation
Qualitative Methodology
47 expert interviews, Q4 2025; applied to validate demand model assumptions, identify emerging dynamics, and assess competitive positioning
Report Format
PDF and XLSX data workbook (Word format preview document)
Publisher
Market Minds Advisory
Report Code
MMA-2026-CON-461
Published
August 2026
Contact
sales@marketmindsadvisory.com | www.marketmindsadvisory.com

Purchase the full Adaptive Sports Lighting System Market Report (2026 to 2036).

The full report follows this market to the place its specifications are actually written, which is inside camera technology and broadcast rights rather than anywhere in the lighting industry. It quantifies control as a share of installed value against the fixture business it is displacing, maps broadcast requirement tightening against venue replacement cycles, and assesses energy performance contracting as the route into a facility population that capital purchase cannot reach. Segment analysis covers all six system elements, with particular attention to control where the value has quietly relocated. Competitive assessment ranks twenty participants on adaptive sports lighting system revenue.
Six system element segmentation with growth rates
Control share of installed value tracked against fixtures
Twenty participant assessment on sports lighting revenue
Broadcast requirement tightening mapped against replacement cycles
Energy performance contracting modelled across facility populations
Compliance verification assessed as recurring service revenue

Built For The People Who Decide

From boardroom strategy to bench-side execution, this report is read cover-to-cover by leaders shaping the next decade of their industry, turning demand scenarios, market dynamics and valuation benchmarks into decisions.
CXOs/ Presidents/ VPs/ Managers
M&A and Corporate Development
Strategy Teams and R&D Heads
Procurement and Product Directors
Regulatory and Compliance Leaders
Investor Relations and Equity Analysts