Market Minds Advisory
Ad Analytics Market

Ad Analytics Market: Ad Analytics Market: Attribution, Media Mix Modelling and Cross-Platform Measurement, 2026 to 2036

Signal loss removed the method the industry planned around, and the replacement answers with a range instead of a number. Advertisers promised person-level certainty are being asked to accept confidence intervals.

Lead Analyst

Published

September 2026

Make Smarter Decisions with Customized Research Insights

Request a free sample report and evaluate market opportunities, growth trends, and competitive dynamics relevant to your business needs.

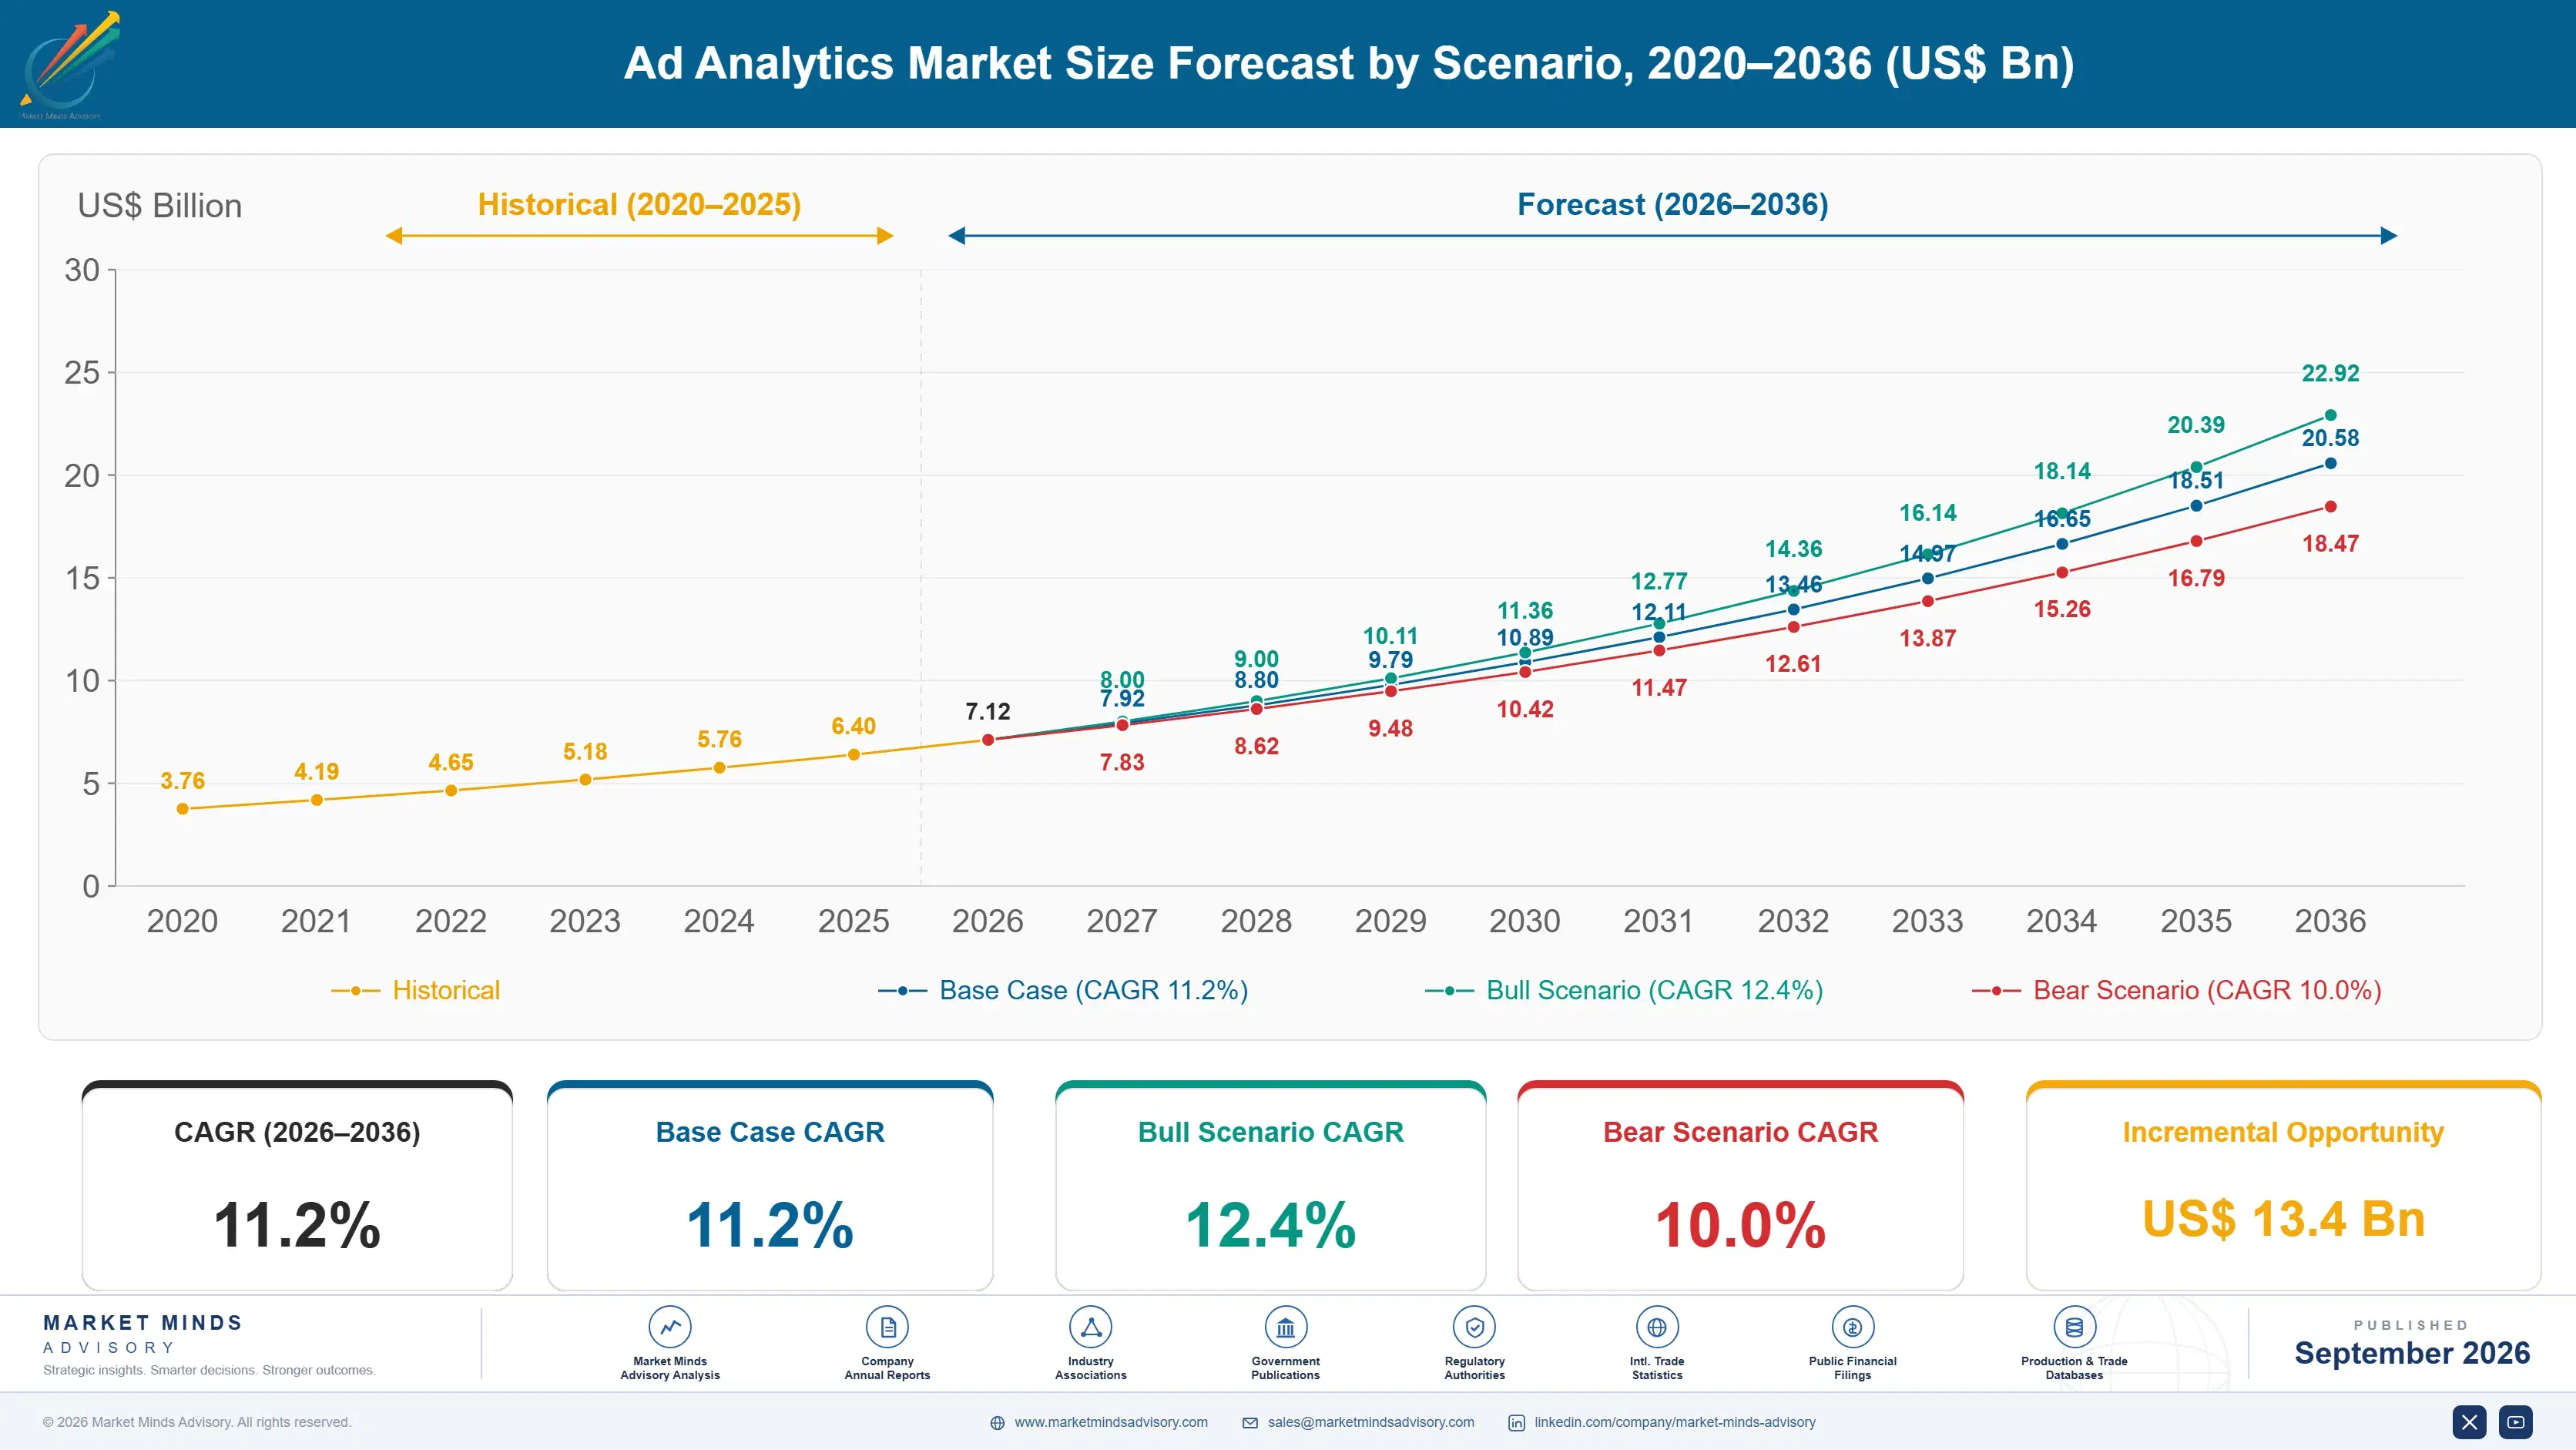
2025 MARKET VALUE$6.4BMarket Size 2025
2036 FORECAST VALUE$20.5BBase Case , 2026 to 2036
CAGR 2026 TO 203611.2 %Bull 12.4% / Bear 10.0%
INCREMENTAL OPPORTUNITY$13.4BNet 10- year value creation
EXPANSION MULTIPLE2.89x2036 value over 2026 base
Strategic Levers
M&A Pipeline
Regional Outlook
Country Rankings
Competitive Intelligence
Segmental Deep-dive
Call-Us : 91 93563 13602

Executive Snapshot and Market Trajectory.

Multi-touch attribution gave marketers a precise number that was mostly wrong. What replaced it gives a range that is roughly right, and the industry is discovering how much it disliked being told the truth. That adjustment, not any technical advance, is what is reshaping this market.
Media mix modelling and incrementality testing grow at 16.8%, half again the market rate of 11.2%, because a controlled holdout answers a question no amount of tracking can answer once the identifiers are gone. Only 17% of campaigns are validated that way today. North America holds 35% of measurement spend, since the advertisers rebuilding measurement fastest are concentrated there. The organisational barrier is larger than the statistical one.
The most awkward fact in this market is that 68% of advertising spend is measured by the company selling it. Independent verification exists and covers a fraction of that. Concentration among third-party vendors is low, with the top five holding 33%, but the real competition is not among them: it is between paid independent measurement and free platform reporting that advertisers keep accepting. Free reporting, not vendor rivalry, decides what this market is worth.
Market Definition
The ad analytics market covers software and services measuring advertising performance across channels, including multi-touch attribution and path analysis, media mix modelling and incrementality testing, data clean rooms and cross-platform measurement, retail and commerce media measurement, creative and content performance analytics, and ad verification and fraud detection. It excludes advertising buying platforms, creative production tools, customer data platforms sold for activation, and general web analytics deployed outside advertising measurement.
Base Year Value
$6.4B in 2025 (MMA Primary Research Dataset, September 2026)
Forecast Period
2026 to 2036, eleven discrete annual values
CAGR
11.2% base case. Bull 12.4%. Bear 10.0%.
Fastest Growth Segment
Media Mix Modelling And Incrementality Testing: 16.8% CAGR
Fastest Growth Country
India: 17.4% CAGR
Fastest Growth Region
South Asia and Pacific: 13.4% CAGR
Largest Region
North America: 35% of 2025 global value
Market Leaders
Nielsen, Adobe, Google, Kantar, and DoubleVerify lead the field. Source: MMA Primary Research Dataset, July 2026.
Primary Survey
n=3,800 procurement and R&D decision-makers, Q4 2025, six countries
Methodology
Demand-side build-up, cross-validated against public data, 47 expert interviews

Ad Analytics Market Forecast Scenarios

ad-analytics-market-size-forecast-scenario-1790005460734
Growth between 2020 and 2025 was disrupted rather than steady. Identifier deprecation and mobile tracking restrictions removed the data foundation under multi-touch attribution, and a large installed base of measurement tooling became progressively less useful without anybody formally retiring it. Historical growth of 9.9% is the net of collapsing attribution spend and rapid growth in modelling, testing, and clean room work that replaced it.
The base case at 11.2% rests on three mechanisms. Modelling and experimentation demand rises as advertisers accept that deterministic tracking is not returning. Commerce media networks proliferate faster than measurement standards can follow, which creates comparison problems that only third-party tooling resolves. And privacy regulation in several major jurisdictions makes clean room architecture a compliance requirement rather than a technical preference, which moves the purchase decision away from marketing entirely.
The bull case at 12.4% turns on chief financial officers requiring incrementality evidence before approving media budgets, which would convert an optional discipline into a standing obligation across large advertisers. The bear case at 10.0% is platform sufficiency: if the largest sellers improve their own reporting enough that advertisers stop paying for independent measurement, third-party spend compresses toward verification and compliance work alone.

A Range Instead Of A Number

The central difficulty here is epistemic rather than technical. Multi-touch attribution assigned credit across touchpoints with a confidence the underlying data never justified, and marketers built planning processes, incentive structures, and agency contracts on those numbers. Modelling and experimentation give better answers with explicit uncertainty attached, and a great many organisations are not set up to act on a range. Ranges do not fit neatly into a quarterly target.
TOP FIVE CONCENTRATION33%Share of measurement spend held by the leading vendors
PLATFORM REPORTED MEASUREMENT68%Share of spend measured by the company selling it
MEDIAN MODEL REFRESH11 weeksInterval between media mix model rebuilds at large advertisers
MEASUREMENT BUDGET SHARE2.4%Portion of working media budget spent on measurement
INCREMENTALITY TEST COVERAGE17%Share of campaigns validated by a controlled holdout experiment
ANALYST HEADCOUNT PER BRAND6Internal staff maintaining measurement models at a large advertiser
The evidence favours those who adjusted. Advertisers running controlled holdouts, currently just 17% of campaigns, reallocate budget on measurably better information than those relying on platform-reported conversions. Yet measurement still consumes only about 2.4% of working media budget, which for most organisations is less than they spend disputing the numbers internally each quarter. The arithmetic of that comparison is not flattering.
Then there is the conflict nobody resolves. Around 68% of spend is measured by the company that sold it, and advertisers accept this arrangement in a way they would tolerate nowhere else in procurement. Independent verification covers a fraction of inventory. The commercial question for every third-party vendor is whether an advertiser will pay for a number that free reporting already supplies, less flatteringly.
"Marketers did not lose their measurement. They lost the version of it that always agreed with them. The vendors winning now are the ones who stopped apologising for uncertainty and started explaining what a confidence interval is actually worth in a budget meeting."
Practice Director, Marketing Technology and Measurement · MMA Technology Practice · September 2026

Market Trends

Experimentation Replaces Tracking As The Evidence Standard

A controlled holdout answers whether advertising caused an outcome, which no amount of observational tracking can establish once identifiers are unavailable. Media mix modelling and incrementality testing grow at 16.8% on that logic, and the adoption gap is enormous: only 17% of campaigns are validated experimentally today. The barrier is organisational rather than technical, since running a holdout means deliberately withholding advertising from some customers, and the person who has to approve that is usually the one whose targets depend on reach. Vendors who help navigate that internal conversation win the account.
Market Impact: Covers 4 major jurisdictions
Commerce Media Networks Outpace Measurement Standards

Retailers, marketplaces, and delivery platforms have launched advertising businesses faster than any common measurement approach could develop, and each reports performance using its own definitions of a view, a click, and an attributed sale. An advertiser running across a dozen such networks cannot compare them without independent normalisation. Roughly 34% of new measurement engagements now cite commerce media comparability as the primary reason for purchase, which is a demand source that did not meaningfully exist five years ago and that platform-supplied reporting cannot address. Every new retail advertising business adds to the problem.
Market Impact: Required by 29% of advertisers

Market Opportunities and Growth Drivers

Privacy Regulation Makes Clean Rooms A Compliance Requirement

Data protection rules in Europe, several United States states, India, and Brazil restrict how advertiser and publisher data may be combined, and clean room architecture is the practical answer that legal functions accept. That moves the purchase decision away from marketing toward compliance, which changes the buying criteria entirely: auditability, data residency, and documented controls now outrank analytical capability. Engagements entered through legal review carry longer sales cycles and materially better retention, because a compliance-approved architecture is not replaced casually once counsel has signed off on it. Analytical capability now ranks below documentation discipline.
Market Impact: Covers 68% of measured spend

Finance Functions Begin Demanding Incrementality Evidence

Marketing budgets have been scrutinised harder as capital costs rose, and finance teams asking what a media budget actually produced find platform-reported conversion counts unpersuasive on inspection. Incrementality evidence answers the question in language a chief financial officer accepts. Around 29% of large advertisers now require experimental validation for at least part of the media plan, up sharply over three years. The commercial consequence is that measurement procurement increasingly involves finance, which shortens debate about methodology and lengthens debate about audit trail. Audit trail replaces methodology as the sticking point.
Market Impact: Limits validation to 17%

Market Restraints and Challenges

Sellers Measure Their Own Advertising And Advertisers Accept It

About 68% of spend is measured by the company that sold it, and the root cause is convenience compounded by cost: platform reporting is free, immediate, and integrated with buying. Independent measurement costs money and usually reports lower numbers. Commercially this caps third-party spend at roughly 2.4% of working media and forces vendors to justify a purchase against a free alternative. Participants respond by positioning as comparison across sellers rather than as a replacement for any one, by anchoring on experimental evidence, and by selling to finance rather than to marketing.
Market Impact: Validates 17% of campaigns

Holdout Testing Requires Withholding Advertising Deliberately

Incrementality measurement means not advertising to a control group, and the root cause of resistance is organisational: the executive who must approve the holdout is typically measured on reach or volume that the holdout reduces. The methodology is not disputed by anybody technical. Commercially this keeps experimental validation at 17% of campaigns despite broad agreement about its value. Vendors are mitigating through geographic rather than audience holdouts, through always-on designs that spread the cost across the year, and by presenting the test as a finance requirement rather than a marketing choice.
Market Impact: Cited in 34% of engagements
4 additional market trends, 3 additional growth drivers, and 2 additional restraints and challenges are covered in the full report. Contact sales@marketmindsadvisory.com to access the complete intelligence.

Segment CAGR and Growth Architecture

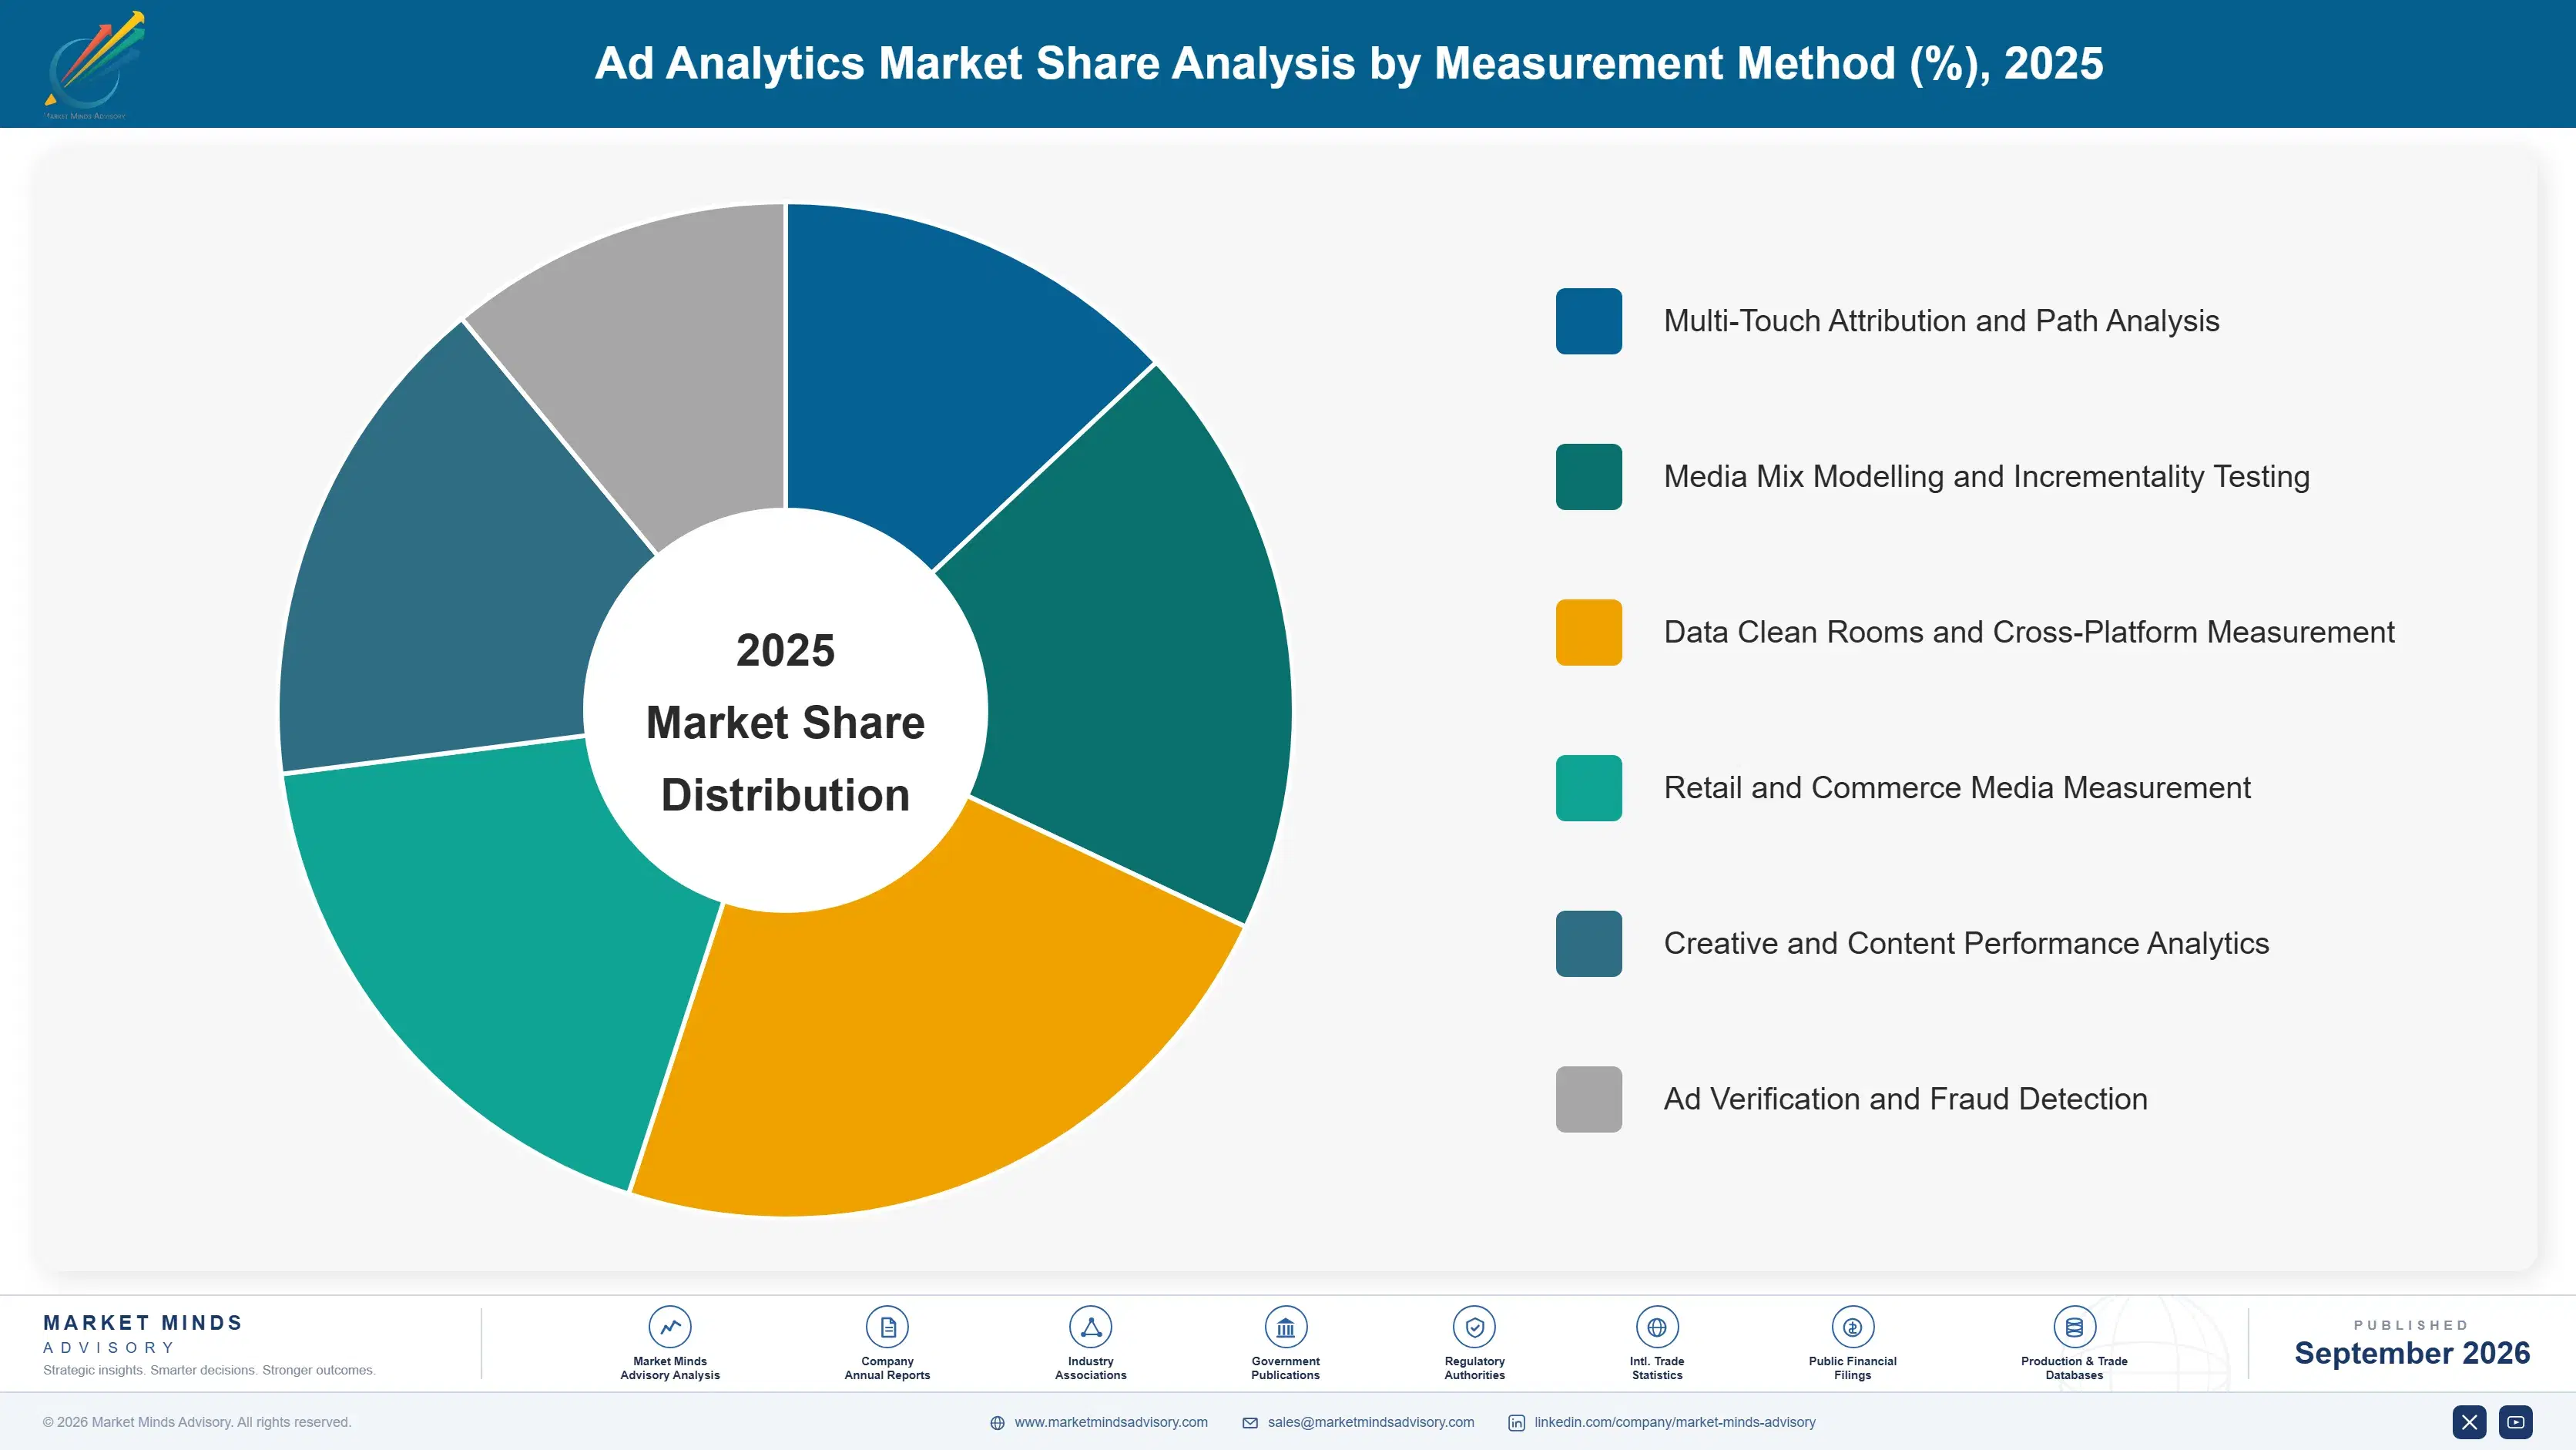
Segmentation follows measurement method. Six functional segments cover the field: multi-touch attribution and path analysis, media mix modelling and incrementality testing, data clean rooms and cross-platform measurement, retail and commerce media measurement, creative and content performance analytics, and ad verification and fraud detection. Attribution is contracting while everything else grows. Few advertisers have formally retired it.
ad-analytics-market-market-share-analysis-1790005461305

Media Mix Modelling And Incrementality Testing

Modelling and experimentation grow at 16.8%, half again the market rate of 11.2%, because a controlled holdout establishes causation that observational tracking cannot once identifiers are gone. The methodology is old, well understood, and was pushed aside during the decade when person-level tracking promised something better. What limits adoption is not technique but organisational willingness: running a holdout means withholding advertising from real customers, and the executive approving it is usually measured on the reach it removes. Only 17% of campaigns are validated experimentally, and vendors who help advertisers win that internal argument capture accounts that competitors never reach. The product being sold is really the internal argument. Statistics are rarely the obstacle.
CAGR 16.8%

Data Clean Rooms And Cross-Platform Measurement

Clean rooms grow at 15.1% on a driver that is legal rather than analytical. Privacy rules across Europe, several United States states, India, and Brazil restrict how advertiser and publisher data may be combined, and clean room architecture is the arrangement counsel will approve. That shifts the buying criteria toward auditability, data residency, and documented controls, and it moves the decision away from marketing entirely. Engagements entered through legal review take longer to close and retain considerably better afterwards, because an architecture that compliance has signed off on does not get replaced on a new chief marketing officer's preference. Documentation discipline beats analytical elegance in these evaluations. Retention follows the legal signature.
CAGR 15.1%
Full segment breakdown across 6 segments available in the complete report.

Regional Architecture and Country Demand Map

Regional shares follow where advertisers contract third-party measurement, which is not the same as where advertising is bought. Markets where the largest sellers supply comprehensive reporting of their own generate far less independent measurement spend than their advertising volume implies. Regulation explains much of the remainder.

North America

At 35% North America sits above the standard band, justified by a concentration of very large advertisers who rebuilt measurement earliest after identifier deprecation and who fund internal analytics teams averaging six people. Commerce media network proliferation is furthest advanced here, creating comparability problems that only third-party normalisation resolves. State privacy legislation has pushed clean room adoption through legal review at many large brands. Growth of 10.4% is moderate rather than rapid, because the transition away from attribution is already substantially complete and further expansion depends on advertisers raising measurement above 2.4% of working media. Internal analytics teams here are larger than anywhere else covered. Attribution retirement is largely complete.
Share: 35% | CAGR: 10.4% (2026 to 2036)

Western Europe

Regulation shapes this market more than commercial preference does. Data protection rules made clean room architecture a compliance requirement well before it became an analytical convenience, and legal functions rather than marketing teams frequently own the purchase. Advertisers here also maintained media mix modelling practice through the tracking decade more consistently than North American peers, which left capability in place when it became necessary again. Growth of 9.6% is the slowest of the seven regions, held back by advertising market growth that is itself modest and by procurement cycles that run longer than elsewhere. Modelling capability survived the tracking decade better here than elsewhere. Legal functions frequently own the purchase.
Share: 24% | CAGR: 9.6% (2026 to 2036)
Regional intelligence for 5 additional markets available in the complete report: East Asia, South Asia and Pacific, Latin America, Middle East and Africa, Eastern Europe. Contact sales@marketmindsadvisory.com.
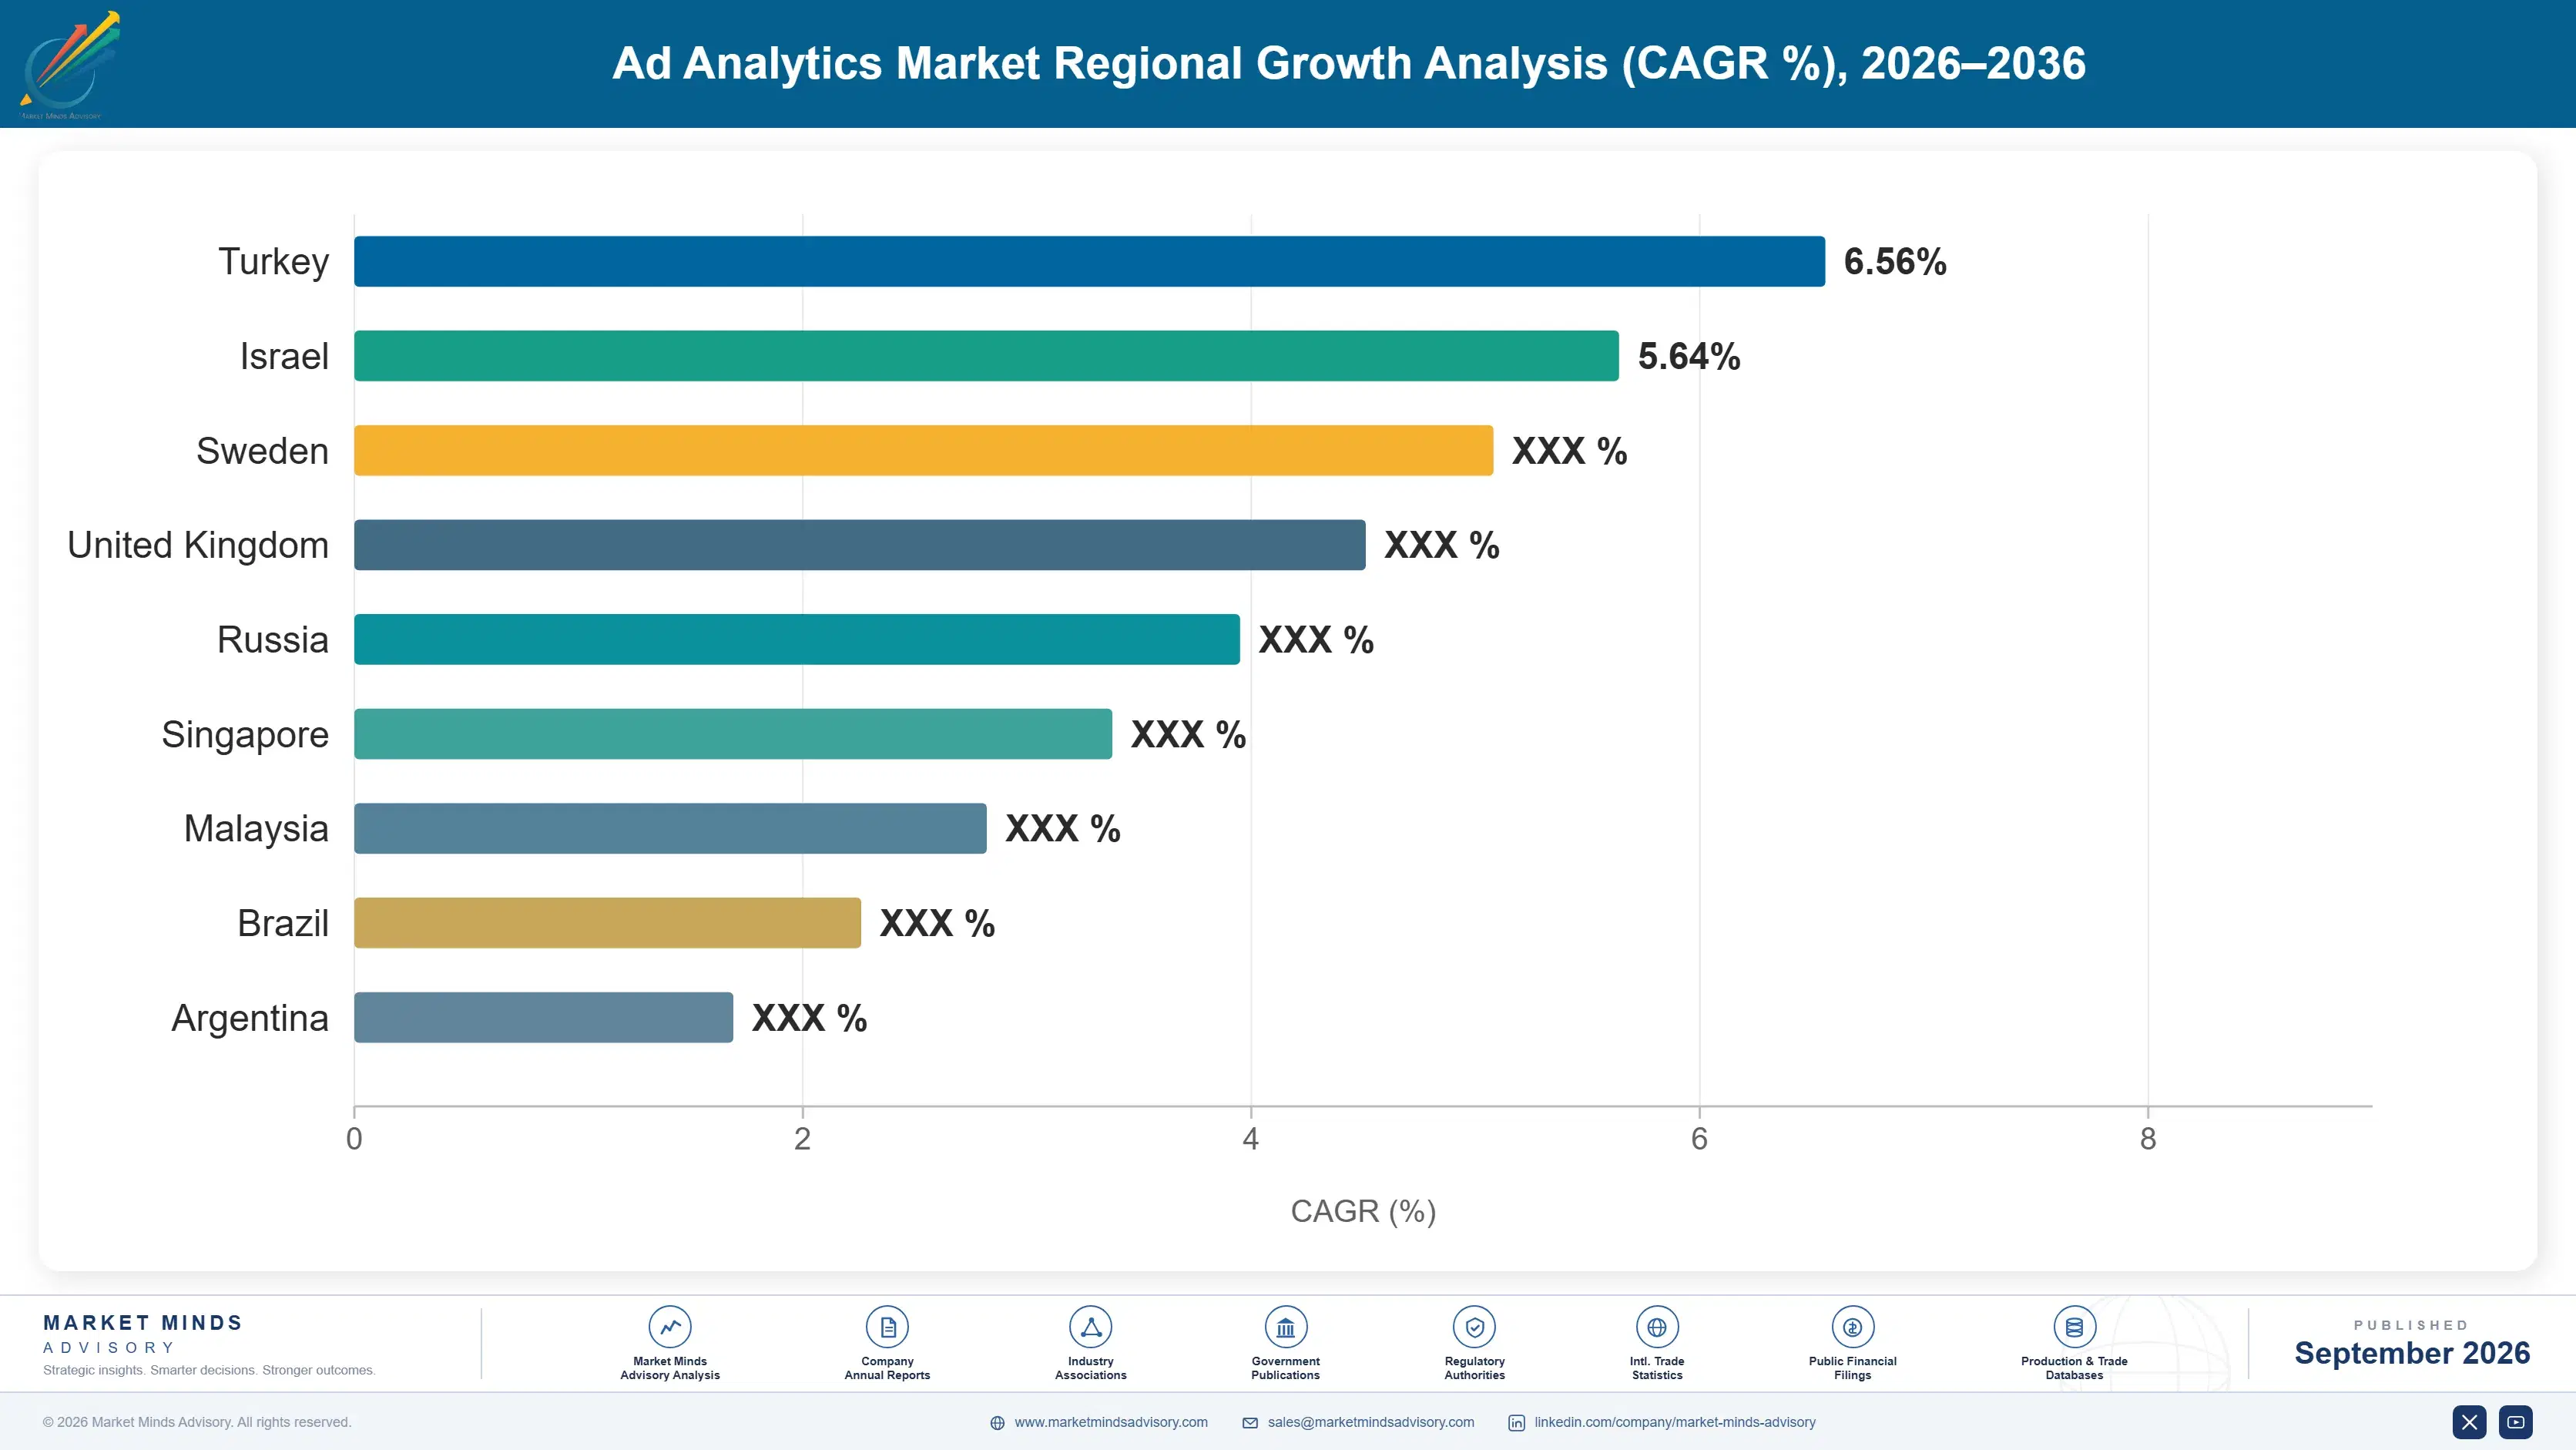
ad-analytics-market-country-cagr-analysis-1790005461841

How Vendors Beat Free Reporting

Four commercial moves separate vendors winning budget from those losing to platform reporting that costs nothing. Each accepts the same starting position: an advertiser already has numbers, they arrive free and immediately, and any paid alternative has to be worth more than the discomfort of contradicting them. Contradicting the free numbers is uncomfortable. Discomfort has a price.

Sell Comparison Across Sellers Rather Than Replacement

Positioning against any single platform's reporting invites a fight the vendor cannot win, since that reporting is free and integrated with buying. Positioning as the only view that compares sellers on consistent definitions avoids the fight entirely and answers a question no platform will ever answer. Vendors framing the offer this way close roughly 2.7 times as many engagements with advertisers running across many networks. Commerce media proliferation has made this argument considerably stronger, since a dozen incompatible reports is a problem the advertiser already feels. A dozen incompatible reports is a problem already felt.
Market Impact: Closes 2.7 times more engagements than competitors do

Enter Through Legal And Compliance Review

Clean room architecture is a compliance answer before it is an analytical one, and counsel approving a data arrangement creates a purchase that marketing preference cannot casually reverse. Engagements entered through legal review show retention roughly 34% higher than those sold to marketing teams alone, and they survive changes of chief marketing officer that routinely end other vendor relationships. Sales cycles run longer and the criteria shift toward auditability and residency, which favours vendors with documentation discipline over those with better analytical capability. Documentation discipline beats analytical capability here. Counsel rarely reopens a signed architecture.
Market Impact: Improves client retention by roughly 34% over rivals

Present Measurement As A Finance Requirement

Around 29% of large advertisers now require experimental validation for part of the media plan, and that requirement originates with finance rather than marketing. Vendors who sell to the chief financial officer's team find methodology debates shorten considerably, because a confidence interval is a familiar object in that function rather than an admission of weakness. Deals entered this way carry contract values roughly 40% to 65% above marketing-led purchases and, more usefully, are budgeted as governance rather than as discretionary marketing technology spending. Governance budgets behave very differently from discretionary ones.
Market Impact: Lifts contract value by roughly 40% to 65%

Design Holdouts That Survive Internal Objection

Experimental validation sits at 17% of campaigns because withholding advertising requires approval from someone measured on the reach it removes. Vendors who arrive with geographic rather than audience holdouts, always-on designs spreading cost across the year, and a prepared answer for the reach objection convert pilots into programmes at roughly 3.3 times the rate of those presenting methodology alone. The organisational work is the product here, and almost every vendor underestimates it while describing the statistics instead. Statistics are the easy part of this sale, and almost every vendor spends the meeting on them anyway.
Market Impact: Converts 3.3 times more pilots into full programmes

Who Controls the Margin Pool

Third-party concentration is low. The top five hold 33% of contracted measurement spend, evaluated consistently on that basis across all participants, and the field includes legacy audience measurement firms, marketing software suites, verification specialists, and modelling boutiques competing on quite different propositions. The gap between the leader and the fifth is narrow enough that a single large advertiser relationship reorders positions. No participant holds a position that resembles dominance.
Competition currently turns on three things: credibility of experimental design, compliance documentation sufficient for legal approval, and ability to normalise across sellers that report incompatibly. Analytical sophistication matters less than vendors assume, because the binding constraint is usually organisational rather than statistical. Price competition is moderate, since the comparison is against free platform reporting rather than against another paid vendor. Organisational readiness decides most engagements.

Pressure comes from two directions. Modelling boutiques with strong experimental practice are taking budget from suites whose attribution products are declining. Meanwhile the largest advertising sellers keep improving their own reporting, which compresses the case for paying anybody. Rankings will shift toward vendors holding compliance-approved clean room positions, which renew far more reliably than analytical engagements. Compliance positions renew more reliably than analytical ones do.
ad-analytics-market-company-positioning-matrix-1790005462365

Competitive Moat and Risk Dimensions

NIELSEN

Moat: Panel And Currency Position

Long-established audience measurement operates as trading currency in several markets, which means buyers and sellers both accept the numbers and settle against them. That role is extremely difficult to displace, because replacing a currency requires agreement from parties with opposing commercial interests rather than merely a better methodology.
NIELSEN

Risk: Digital Native Measurement Gap

Commerce media and platform advertising increasingly dominate spend growth, and panel-derived measurement addresses them less naturally than modelling and experimentation approaches built for the purpose. Competing there means winning on techniques where heritage confers little advantage and where several focused boutiques hold stronger practitioner reputations.
DOUBLEVERIFY

Moat: Verification Integration Across Platforms

Technical integration for viewability, fraud, and brand safety measurement sits inside the advertising delivery path across a very wide set of platforms, which is expensive and slow for competitors to replicate. Advertisers treat verification as a standing requirement rather than a discretionary purchase, which produces unusually predictable renewal behaviour.
DOUBLEVERIFY

Risk: Verification Scope Growth Limited

Verification grows more slowly than modelling, clean rooms, or commerce media measurement, and expanding into those means competing on analytical practice rather than on integration reach. The transition demands capability the company must build or acquire while defending a core business that sellers periodically attempt to absorb themselves.

Players Tracked

Prominent Players

Nielsen
Adobe
Google
Kantar
DoubleVerify

Other Key Players

Integral Ad Science
Comscore
Analytic Partners
TransUnion
Innovid
LiveRamp
Snowflake
InfoSum
AppsFlyer
Adjust
Branch
Amazon
Salesforce
Oracle
Mediaocean

Recent Developments

FEBRUARY 2026

Analytic Partners Releases Always-On Incrementality Testing Framework

Analytic Partners released a continuous experimentation framework using geographic holdouts rather than audience exclusion, designed specifically to reduce the internal objection that stops most advertisers from running controlled tests at any meaningful scale. Cost is spread across the year rather than concentrated in a single quarter.
Signal: Vendors are competing on organisational feasibility rather than statistical method, which is where adoption actually stalls.
OCTOBER 2025

LiveRamp Signs Clean Room Supply Agreement With Retail Media Group

LiveRamp entered a supply agreement providing clean room infrastructure to a group of retail media networks, allowing participating advertisers to measure across several retailers using consistent definitions without any party sharing underlying customer records. Participating retailers retain control of their own customer data throughout. Definitions are agreed in advance.
Signal: Commerce media comparability is being solved through shared infrastructure rather than through any common reporting standard.
JUNE 2025

DoubleVerify Acquires Creative Performance Analytics Specialist

DoubleVerify completed an acquisition of a creative analytics company, extending measurement beyond delivery verification into whether the advertisement itself performed, and moving the business toward the faster growing analytical segments of the category. Verification alone grows well below the category rate now. Analytical segments grow considerably faster.
Signal: Verification specialists are buying analytical capability because their core segment grows well below the category rate.

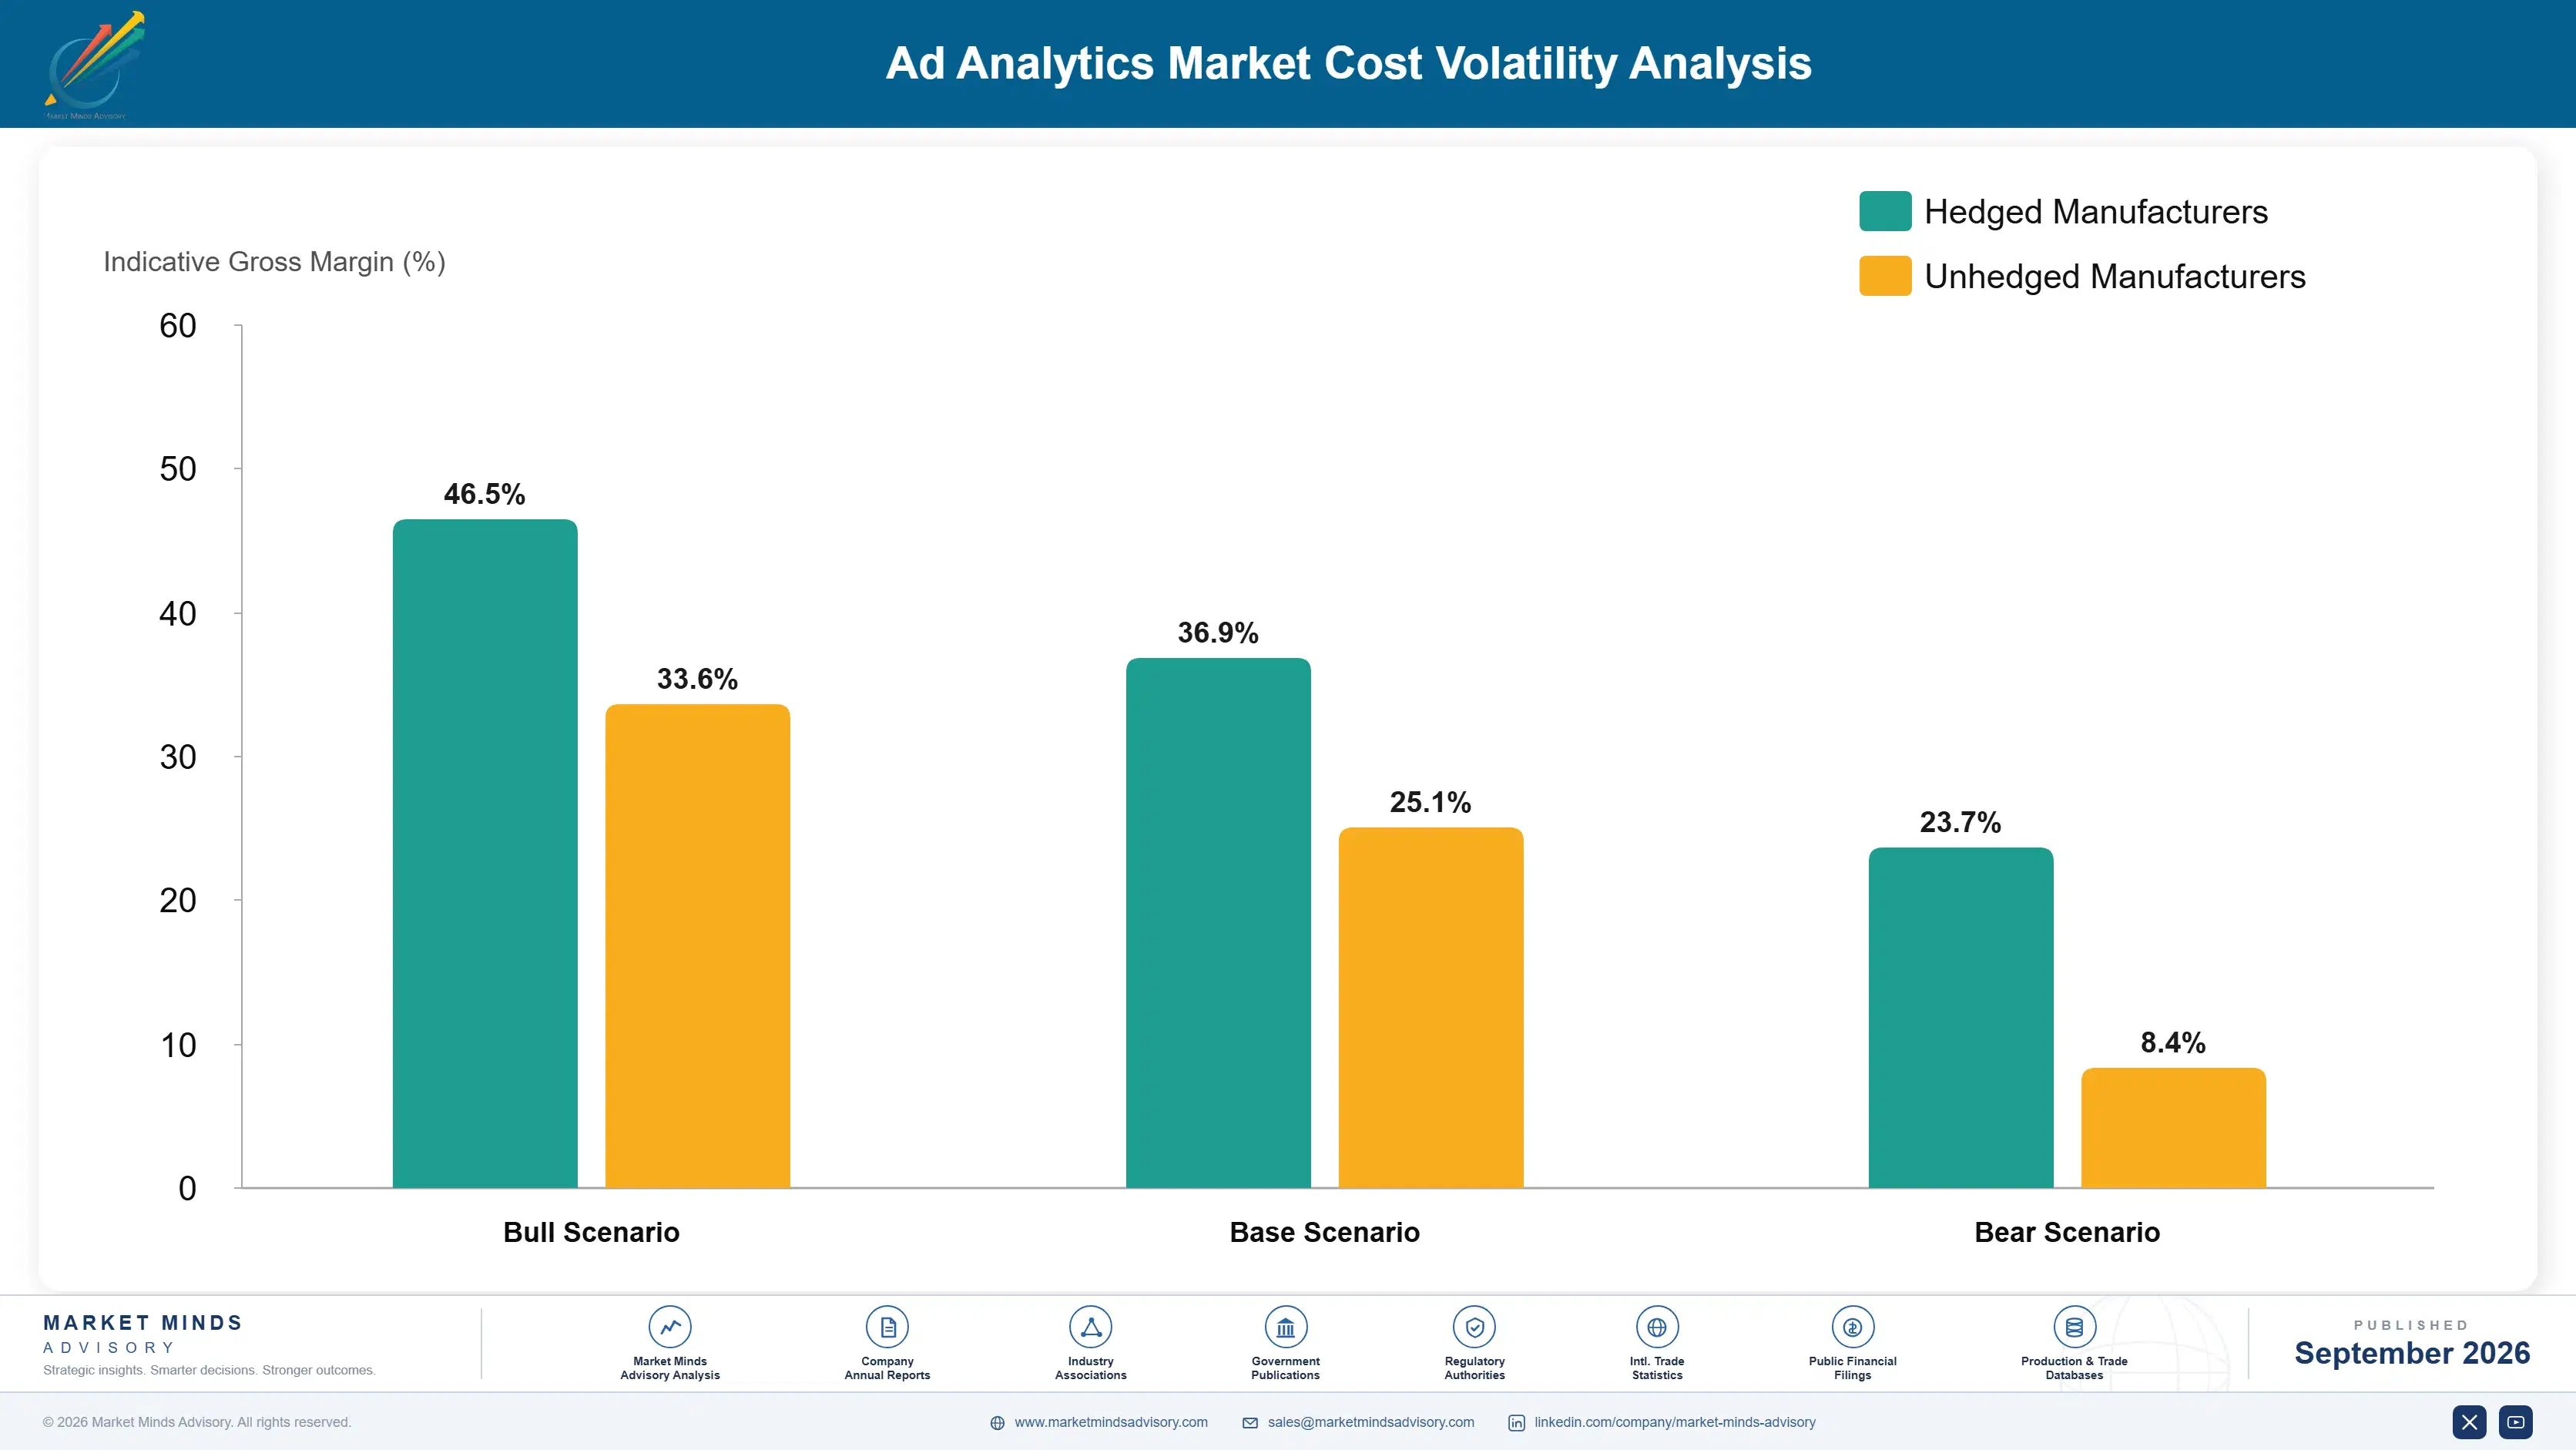
What Measurement Costs To Deliver

Three inputs dominate. Cloud compute for model estimation and clean room query execution runs 26% to 33% of cost of goods sold, third-party data licensing takes 18% to 25%, and data science and analytical services staff account for a further 24% to 31%. Licensed data comes from a small number of panel operators and identity providers, several of which also compete for the same advertiser budgets directly.
Third-party data licensing costs rose materially through 2024 and 2025 as identity providers repriced against reduced supply, and several vendors described the resulting gross margin pressure in their annual reports for those years. Fixed-fee measurement contracts signed before the movement absorbed it entirely. Pass-through clauses for licensed data have since become common in multi-year agreements with large advertisers. Large advertisers accept the arrangement, since they understand the supply position.

The competitive disadvantage mechanism runs through analytical staffing rather than through data. A vendor delivering each engagement with bespoke modelling carries service cost that a vendor with standardised model libraries does not, and cannot price against it when the alternative is free platform reporting. Exposure varies by player type. Large suites amortise licensing and infrastructure widely. Boutiques carry senior analysts against fewer engagements.
ad-analytics-market-cost-volatility-analysis-1790005462562

Standardise Model Libraries By Category And Channel

Much of a media mix modelling engagement repeats across advertisers in the same category with similar channel mixes, so reusable model structures move work from senior statisticians to less scarce analysts. Vendors who invested in this report engagement effort falling by roughly a third, with no measurable reduction in the quality of the delivered result.

Pass Licensed Data Cost Through To Advertisers

Third-party identity and panel data is repriced by suppliers who also compete for the same budgets, which makes it an unattractive exposure to carry. Structuring contracts so licensed data is passed through at cost removes the volatility, and large advertisers generally accept it because they understand the supply position perfectly well. Volatility moves off the vendor balance sheet.

Move Query Execution Into Advertiser Cloud Environments

Running clean room queries inside the advertiser's own cloud account shifts compute cost to a party that has already negotiated committed discounts and often has capacity to absorb. The vendor keeps the analytical value and sheds the infrastructure exposure, which improves margin without any change to what the advertiser actually receives. Analytical value stays with the vendor.

Portfolio Architecture for Margin Defence

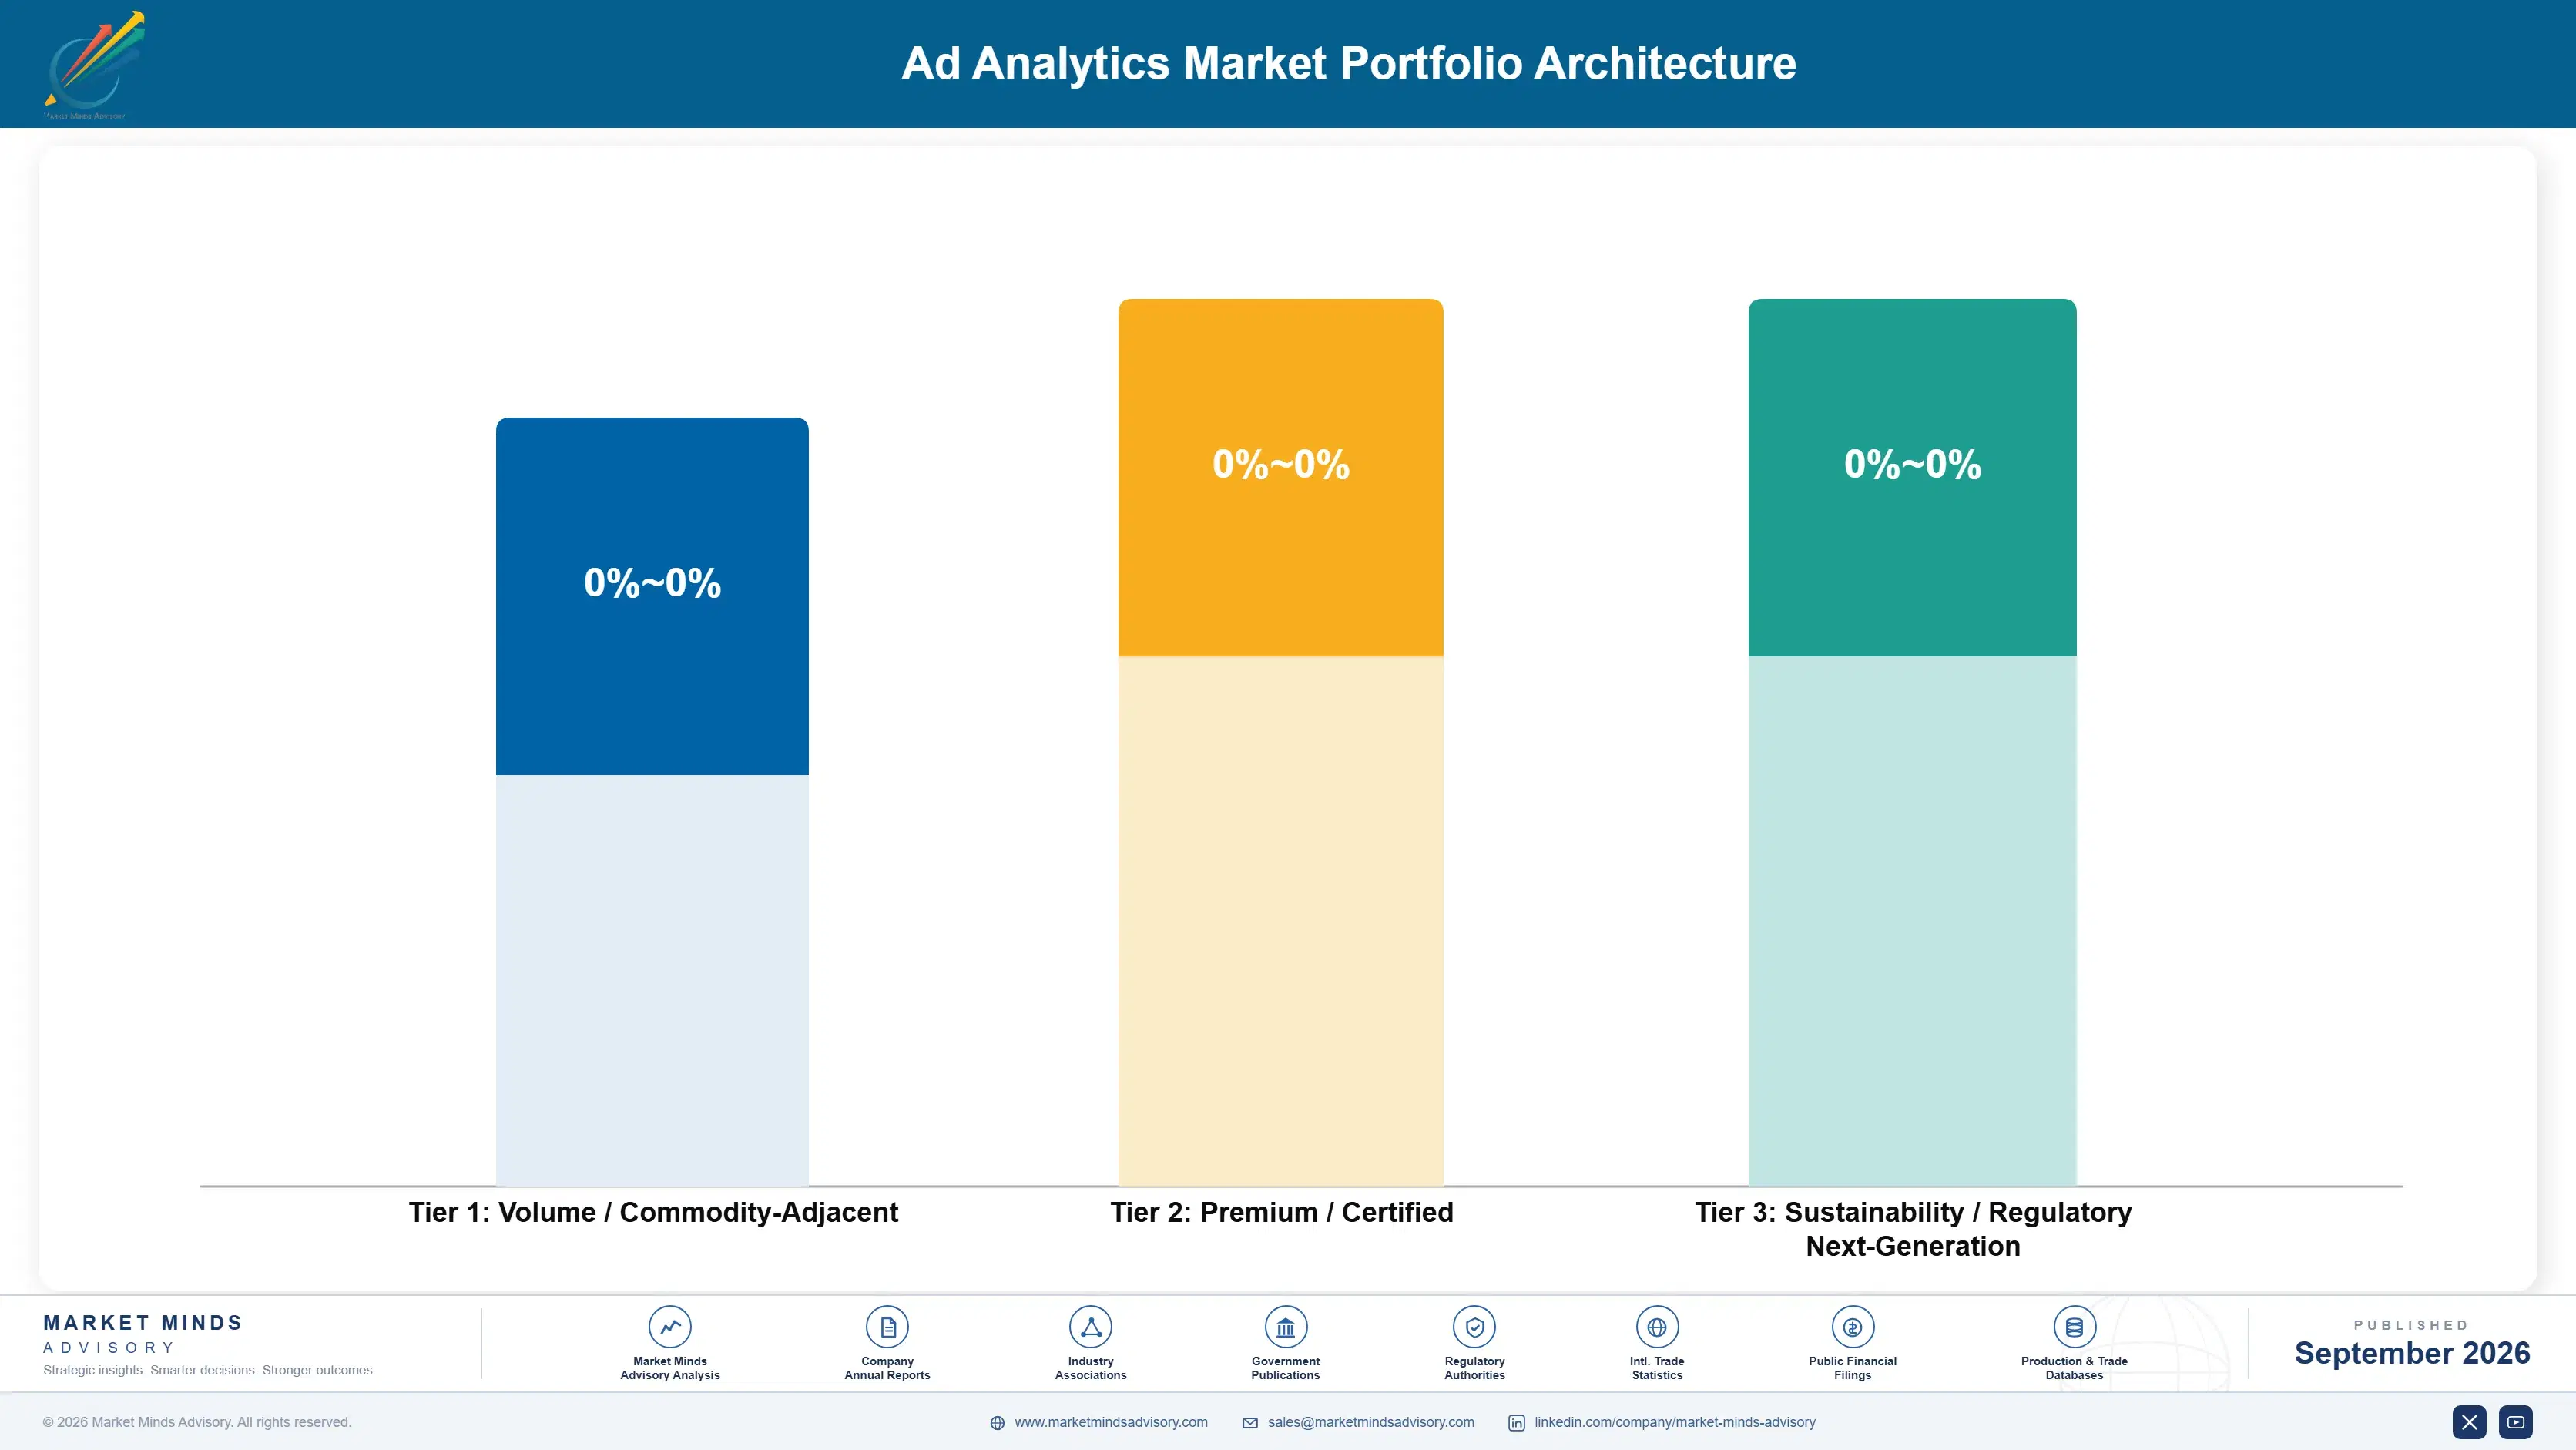
Margin follows what free reporting cannot supply. Attribution and basic channel reporting are close to worthless commercially, since platforms provide equivalents at no cost and the underlying data no longer supports the method. Verification and creative analytics earn moderately. Experimental validation and compliance-approved clean rooms earn most, because neither is available from the seller of the advertising at any price. Free reporting sets the floor on everything else.
The tension between volume and premium runs through analytical staffing. High-volume reporting work carries service cost that fixed fees barely cover, and vendors delivering every engagement bespoke lose money while looking busy. Premium experimental and clean room work carries far better economics but scales only with senior analytical capacity and with the number of advertisers willing to have the internal argument about holdouts. Senior analytical capacity is the binding constraint.

High-value pools concentrate where a decision carries real money and free reporting cannot settle it: incrementality validation for large media budgets, clean rooms under legal approval, and commerce media normalisation across many networks. These share a buyer with a specific unanswered question. Where the question is merely how the campaign performed, the platform already answered it, for nothing.

Volume / Commodity-Adjacent

Multi-touch attribution, channel reporting, and dashboard delivery. Platform reporting supplies equivalents free and the underlying data no longer supports the method credibly. The nine-point range reflects wide variation in whether vendors deliver from standardised templates or rebuild per client.
Gross Margin: 42% to 51%

Premium / Certified

Media mix modelling, creative analytics, and verification across platforms. Analytical practice and integration reach limit the credible field considerably. The eight-point range separates vendors with reusable model libraries from those mobilising senior statisticians for every individual engagement.
Gross Margin: 58% to 66%

Sustainability / Regulatory / Next-Generation

Compliance-approved clean rooms and controlled incrementality programmes. Neither is available from the seller of the advertising, and legal approval makes replacement difficult once granted. The ten-point range reflects how differently vendors structure infrastructure cost against the advertiser's own cloud environment.
Gross Margin: 68% to 78%
ad-analytics-market-portfolio-architecture-1790005463068

High-value Sub-segments and Strategic Watch-out

Controlled Incrementality Programmes

Highest value and fastest growth at 16.8%, answering a causal question no observational method can address once identifiers are gone. Adoption sits at 17% of campaigns, limited by organisational rather than technical objection. The nine-point range reflects differences in how vendors structure always-on designs. Organisational work decides adoption.
Gross Margin: 70% to 79%

Compliance Approved Clean Rooms

High value with strong growth at 15.1%, bought through legal review rather than marketing preference and retained roughly a third longer as a result. Buying criteria favour auditability and residency over analytical capability. Replacement requires counsel to reapprove an arrangement they already signed off. Legal approval is the moat.
Gross Margin: 66% to 74%

Commerce Media Normalisation

The growth core of comparison work, cited in roughly a third of new engagements as the primary purchase reason. Networks report using incompatible definitions and show no sign of converging. Demand rises with every new retail advertising business launched, which is a reliable pipeline. Convergence looks unlikely.
Gross Margin: 56% to 64%

Attribution And Channel Reporting

The strategic watch-out. Platforms supply equivalents at no cost, the underlying data no longer supports the method, and advertisers increasingly know both. The fifteen-point range reflects the gap between vendors delivering from templates and those still rebuilding attribution models for each client. Advertisers increasingly know this.
Gross Margin: 38% to 53%

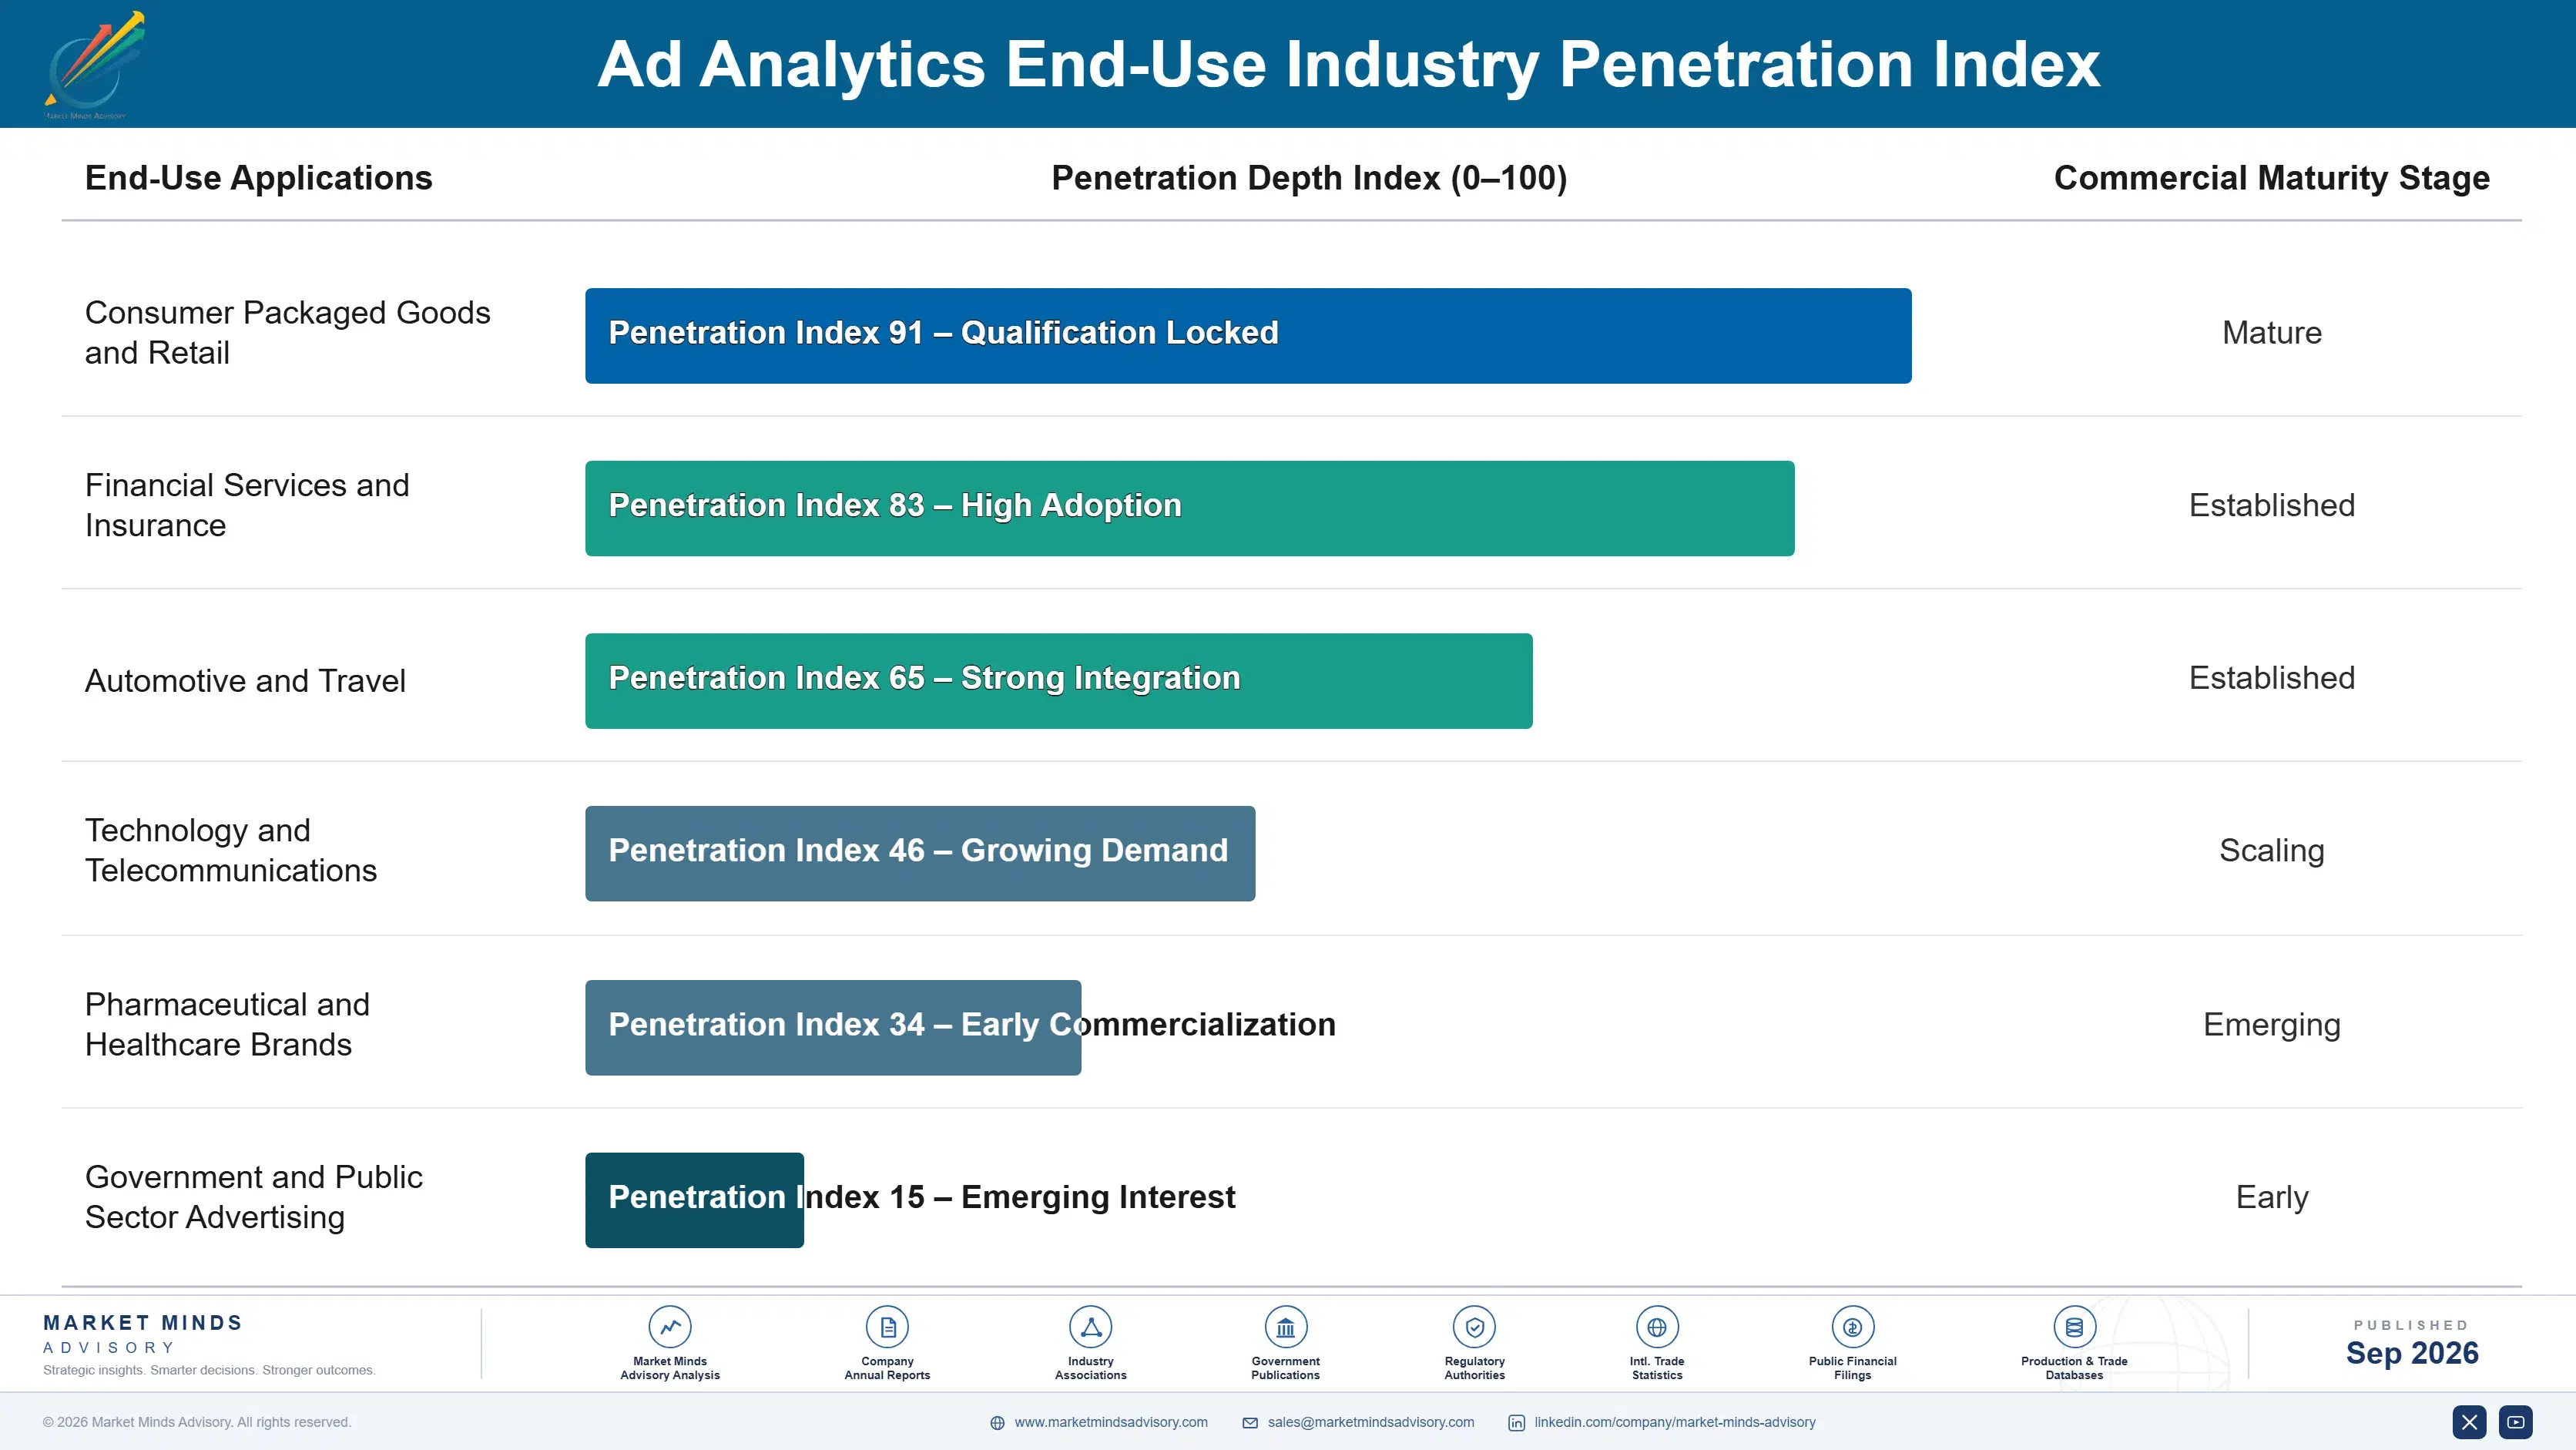
Why Measurement Budgets Persist

Recurring revenue here depends almost entirely on who approved the purchase. Marketing-led measurement contracts churn with leadership changes, since a new chief marketing officer generally arrives with preferred vendors and a reason to question the previous numbers. Compliance-approved clean room arrangements behave completely differently, renewing at rates roughly a third higher because counsel signed off on a data architecture nobody wants to reopen.
Depth of adoption varies sharply by advertiser type. Large consumer brands with internal analytics teams averaging six people embed measurement into planning cycles and rarely remove it. Mid-market advertisers treat it as a project, buying around a specific budget question and stopping once answered. Commerce media sellers themselves are becoming buyers, purchasing normalisation to prove their networks perform against comparisons they cannot make internally.

The buyer profile has moved in two directions at once. Marketing analytics leaders still evaluate methodology, but legal counsel now gates clean room decisions and finance increasingly sets the evidence requirement. Vendors selling on analytical sophistication alone are addressing the one participant in that group with the least budget authority, which explains a good deal of the frustration expressed by technically excellent boutiques.
ad-analytics-market-end-use-penetration-index-1790005463558

Where This Market Rewards

These are among the four positions where our research anticipates prominent divergence between winners and laggards over the coming forecast period. Each is grounded in the demand model, the regulatory perimeter, and the announced capacity pipeline.
01 / CAUSAL EVIDENCE DISCIPLINE

Experiments answer what tracking no longer can

A controlled holdout establishes whether advertising caused an outcome, which observational tracking cannot do once identifiers are unavailable, and media mix modelling with incrementality testing grows at 16.8% against a market rate of 11.2% for exactly that reason. Only 17% of campaigns are validated experimentally, and the barrier is organisational rather than statistical. Vendors who arrive with a prepared answer to the reach objection convert pilots into programmes 3.3 times more often than those presenting the statistics alone in a first meeting.
02 / LEGAL CHANNEL ENTRY

Counsel approval outlasts every marketing leadership change

Clean room architecture is a compliance answer before it is an analytical one, and privacy rules across Europe, several United States states, India, and Brazil make it a requirement rather than a preference. Engagements entered through legal review retain roughly 34% better than marketing-led sales and survive the leadership changes that routinely end other vendor relationships. Buying criteria shift toward auditability and documentation, which rewards discipline over analytical elegance, which favours vendors who document carefully over those who model beautifully.
03 / COMPARISON VALUE POSITIONING

Never compete directly against free platform reporting

Roughly 68% of advertising spend is measured by the company that sold it, using reporting that arrives free and integrated with buying, so positioning as a replacement invites a fight no vendor wins on price. Positioning as the only consistent comparison across sellers answers a question platforms will never answer for themselves. Vendors framing it this way close about 2.7 times as many engagements with advertisers running across many networks, and commerce media proliferation strengthens the argument each year for everybody involved.
04 / FINANCE FUNCTION ALIGNMENT

A confidence interval is normal language to finance

Around 29% of large advertisers now require experimental validation for part of the media plan, and that requirement originates in finance rather than in marketing departments uncomfortable with uncertainty. Selling to the chief financial officer's team shortens methodology debate considerably, because ranges and error bars are ordinary objects in that function. Deals entered this way carry contract values roughly 40% to 65% higher and are budgeted as governance rather than discretionary spending, which changes how the renewal conversation goes entirely.

Engagement Snapshot From the Field

A live engagement with an industry participant carrying material or product regulatory and market exposure ahead of a defining policy shift, showing how our research translates into a defensible multi-year portfolio strategy.
MARKET MINDS ADVISORY · CLIENT ENGAGEMENT SUMMARY
Ad Analytics Producer Strategic Portfolio Review and Transition Roadmap 2026·Investment Scenario on Ad Analytics Exposure Evaluation 2025-26
CLIENT PROFILE
A global consumer goods advertiser with working media spend above USD 1.8 billion annually across 40 markets (client-reported, unverified by MMA), running an internal analytics function of eleven people alongside three separate measurement vendors. Attribution tooling purchased in 2019 remained under contract despite producing results the analytics team had stopped using for planning decisions. Nobody had formally retired the contract.
STRATEGIC CHALLENGE
Regional teams reported campaign performance using platform figures, global planning used a media mix model refreshed twice yearly, and the two disagreed by a wide margin on almost every channel. Finance had begun questioning the media budget on the basis that nobody could reconcile them. No incrementality testing was running anywhere in the business.
MMA APPROACH
MMA reconciled the two measurement sources channel by channel to establish where and why they diverged, assessed the attribution contract against what the underlying data could still support, and designed a geographic holdout programme for three markets. Vendor capability was evaluated on experimental design and compliance documentation rather than on analytical feature comparison.
KEY FINDINGS
  1. Platform reported conversions exceeded modelled contribution by a factor of roughly 2.4 across paid social, and the divergence had widened each year since identifier deprecation began.
  2. The 2019 attribution contract consumed 31% of measurement budget while producing outputs no planning process had used for at least two years.
  3. Geographic holdouts were feasible in seven of the 40 markets without disrupting national retail listings or promotional commitments already agreed with partners.
  4. Only two of six candidate vendors could supply the compliance documentation the company's legal function required for a clean room arrangement covering European data.
CLIENT PROFILE
A global consumer goods advertiser with working media spend above USD 1.8 billion annually across 40 markets (client-reported, unverified by MMA), running an internal analytics function of eleven people alongside three separate measurement vendors. Attribution tooling purchased in 2019 remained under contract despite producing results the analytics team had stopped using for planning decisions. Nobody had formally retired the contract.
STRATEGIC CHALLENGE
Regional teams reported campaign performance using platform figures, global planning used a media mix model refreshed twice yearly, and the two disagreed by a wide margin on almost every channel. Finance had begun questioning the media budget on the basis that nobody could reconcile them. No incrementality testing was running anywhere in the business.
MMA APPROACH
MMA reconciled the two measurement sources channel by channel to establish where and why they diverged, assessed the attribution contract against what the underlying data could still support, and designed a geographic holdout programme for three markets. Vendor capability was evaluated on experimental design and compliance documentation rather than on analytical feature comparison.
KEY FINDINGS
  1. Platform reported conversions exceeded modelled contribution by a factor of roughly 2.4 across paid social, and the divergence had widened each year since identifier deprecation began.
  2. The 2019 attribution contract consumed 31% of measurement budget while producing outputs no planning process had used for at least two years.
  3. Geographic holdouts were feasible in seven of the 40 markets without disrupting national retail listings or promotional commitments already agreed with partners.
  4. Only two of six candidate vendors could supply the compliance documentation the company's legal function required for a clean room arrangement covering European data.
RECOMMENDED STRATEGY
Phase 1: Phase one: terminate the attribution contract at renewal and redirect the entire budget toward a geographic holdout programme across the seven feasible markets. Phase 2: Phase two: adopt a single reconciled reporting standard, requiring regional teams to plan against modelled contribution rather than against platform reported conversion figures. Phase 3: Phase three: procure a clean room from one of the two compliant vendors, entering through legal review to establish the architecture before any analytical scope is agreed.
OUTCOME
The holdout programme found paid social contribution roughly 58% below platform reported figures, and budget was reallocated accordingly across the following planning cycle (client-reported, unverified by MMA). Finance withdrew its challenge to the media budget. Measurement spend fell slightly while the proportion supporting experimental evidence rose from nothing to a majority.

Frequently Asked Questions

Foundational context covering the market sizes, CAGR, scope, country, region and competition that inform every finding below. This section is provided to cover basics and most often pre-purchase conversations, answered from the MMA Primary Research Dataset.

What is the current size of the Ad Analytics Market?

The market was worth USD 6.4 billion in 2025 and reaches USD 7.1 billion in 2026. Value covers contracted third-party measurement spend, excluding platform supplied reporting.

How large will the Ad Analytics Market be by 2036?

MMA forecasts USD 20.5 billion by 2036, an increase of USD 13.4 billion across the forecast period. That represents 2.89 times the 2026 base of USD 7.1 billion.

What is the CAGR for the Ad Analytics Market 2026 to 2036?

The base case compound annual growth rate is 11.2%, with a bull case at 12.4% and a bear case at 10.0%. Historical growth from 2020 to 2025 ran at 9.9%.

Which segment is growing fastest?

Media mix modelling and incrementality testing grow at 16.8%, half again the market rate of 11.2%. Controlled holdouts establish causation that observational tracking no longer can.

Who are the major companies in the Ad Analytics Market?

Nielsen, Adobe, Google, Kantar, and DoubleVerify lead the field, holding 33% of contracted measurement spend between them. Beneath those five the market remains notably fragmented.

Which country is growing fastest?

India grows at 17.4%, driven by digital advertising expansion and commerce media networks launched in rapid succession by marketplaces. Contract values sit below the global median.

Report Segmentation Architecture

The full report scope spans multiple orthogonal segmentation dimensions, with cross-tabulated demand data provided for each dimension pair. Coverage extends further to regional breakdowns, trend trajectories, and the competitive detail needed to support segment-level decision-making.

By Measurement Method

  • Multi-Touch Attribution and Path Analysis
  • Media Mix Modelling and Incrementality Testing
  • Data Clean Rooms and Cross-Platform Measurement
  • Retail and Commerce Media Measurement
  • Creative and Content Performance Analytics
  • Ad Verification and Fraud Detection

By End-Use Industry

  • Consumer Packaged Goods and Retail
  • Financial Services and Insurance
  • Automotive and Travel
  • Technology and Telecommunications
  • Pharmaceutical and Healthcare Brands
  • Government and Public Sector Advertising

By Commercial Dimension

  • Direct Advertiser Contract
  • Agency Delivered Measurement
  • Publisher and Seller Purchased
  • Commerce Media Network Contract
  • Cloud Marketplace Subscription
  • Managed Analytics Service

By Region

  • North America
  • Western Europe
  • East Asia
  • South Asia and Pacific
  • Latin America
  • Middle East and Africa
  • Eastern Europe

Scope, Methodology, and Coverage

Every figure in this report is reproducible from documented input assumptions. The scope below maps the historical period, the forecast horizon, the segmentation dimensions, and the countries covered, alongside the underlying primary and qualitative methodology.
Historical Period
2020 to 2025
Forecast Period
2026 to 2036
Base Year
2025 (USD billions; MMA Primary Research Dataset, September 2026)
Market Definition
The ad analytics market covers software and services measuring advertising performance across channels, including multi-touch attribution and path analysis, media mix modelling and incrementality testing, data clean rooms and cross-platform measurement, retail and commerce media measurement, creative and content performance analytics, and ad verification and fraud detection. It excludes advertising buying platforms, creative production tools, customer data platforms sold for activation, and general web analytics deployed outside advertising measurement.
Quantitative Units
USD billions, contracted third-party measurement spend
Segmentation Dimensions
Measurement method, end-use industry, commercial dimension, region
Regions Covered
North America, Western Europe, East Asia, South Asia and Pacific, Latin America, Middle East and Africa, Eastern Europe
Countries Covered
United States, Canada, United Kingdom, Germany, France, Netherlands, Spain, Italy, Sweden, China, Japan, South Korea, India, Australia, Indonesia, Brazil, Mexico, Argentina, Saudi Arabia, United Arab Emirates, South Africa, Poland, Czech Republic
Key Companies Profiled
Nielsen, Adobe, Google, Kantar, DoubleVerify, Integral Ad Science, Comscore, Analytic Partners, TransUnion, Innovid, LiveRamp, Snowflake, InfoSum, AppsFlyer, Adjust, Branch, Amazon, Salesforce, Oracle, Mediaocean
Quantitative Methodology
Primary survey, n=3,800 respondents, Q4 2025, six countries; demand-side model with trade association cross-validation
Qualitative Methodology
47 expert interviews, Q4 2025; applied to validate demand model assumptions, identify emerging dynamics, and assess competitive positioning
Report Format
PDF and XLSX data workbook (Word format preview document)
Publisher
Market Minds Advisory
Report Code
MMA-2026-TEC-421
Published
September 2026
Contact
sales@marketmindsadvisory.com | www.marketmindsadvisory.com

Purchase the full Ad Analytics Market Report (2026 to 2036).

The full report sizes the ad analytics market across six measurement methods, seven regions, and twenty-three countries, with forecasts to 2036 under base, bull, and bear cases. It examines why attribution collapsed after identifier deprecation, what experimentation and modelling replaced it with, and why organisational rather than statistical barriers limit adoption. Competitive analysis covers twenty participants evaluated consistently on contracted measurement spend, with detailed treatment of platform-supplied reporting as the principal competitive alternative. Cost structure, margin architecture by method, and regional regulatory and commerce media drivers are analysed in full. Primary research includes 3,800 survey responses and 47 expert interviews.
Six measurement methods sized and forecast separately
Twenty participants evaluated on contracted measurement spend
Regional regulatory and commerce media drivers assessed
Margin architecture by method and buying channel
Platform reporting versus independent measurement competitive analysis
Incrementality adoption benchmarks by advertiser size and category

Built For The People Who Decide

From boardroom strategy to bench-side execution, this report is read cover-to-cover by leaders shaping the next decade of their industry, turning demand scenarios, market dynamics and valuation benchmarks into decisions.
CXOs/ Presidents/ VPs/ Managers
M&A and Corporate Development
Strategy Teams and R&D Heads
Procurement and Product Directors
Regulatory and Compliance Leaders
Investor Relations and Equity Analysts