Market Minds Advisory
Active Smart and Intelligent Packaging Market

Active Smart and Intelligent Packaging Market: Compliance Turns a Niche Into Infrastructure

Pharmaceutical serialization mandates and e-commerce anti-counterfeiting demands are forcing packaging lines to adopt sensors and RFID tags faster than converters can retrofit equipment, leaving cost and integration complexity as the real barrier to full rollout.

Lead Analyst

Bilal Shaikh

Published

September 2026

Make Smarter Decisions with Customized Research Insights

Request a free sample report and evaluate market opportunities, growth trends, and competitive dynamics relevant to your business needs.

2025 MARKET VALUE$24.5BMarket Size 2025
2036 FORECAST VALUE$64.5BBase Case , 2026 to 2036
CAGR 2026 TO 20369.2 %Bull 10.5% / Bear 7.9%
INCREMENTAL OPPORTUNITY$37.8BNet 10- year value creation
EXPANSION MULTIPLE2.41x2036 value over 2026 base
Strategic Levers
M&A Pipeline
Regional Outlook
Country Rankings
Competitive Intelligence
Segmental Deep-dive
Call-Us : 91 93563 13602

Executive Snapshot and Market Trajectory

Active and intelligent packaging is shifting from a specialty niche into a mandated compliance requirement across pharmaceutical and food supply chains, as serialization regulation and traceability expectations convert what was once a premium differentiator into baseline infrastructure that converters and brand owners can no longer treat as optional.
RFID and NFC smart tags grow fastest at 13.8%, exactly 1.50 times the overall rate, as e-commerce anti-counterfeiting programs and expanding pharmaceutical serialization mandates pull packaging lines toward embedded traceability technology. East Asia holds the largest regional share at 29%, anchored by China's dominant RFID chip and smart label manufacturing base, while India's compressed pharma serialization compliance timeline makes it the fastest-growing single country worldwide by a wide margin across every tracked application.
Competitive intensity remains fragmented, with the top five holding just over a third of revenue, since converters, formulators, and RFID specialists compete from different starting points rather than converging on one dominant model. Integration complexity compounds this, since brand owners increasingly demand active and intelligent features bundled into existing formats rather than sold as standalone technology, forcing suppliers to partner across segments that used to operate independently.
Market Definition
The active and intelligent packaging market covers packaging technologies that interact with or monitor packaged products, including oxygen scavengers, antimicrobial films, moisture absorbers, time-temperature indicators, and RFID or NFC smart tags. It excludes conventional passive barrier packaging, standalone IoT logistics tracking devices not integrated into the package itself, and unrelated printed packaging graphics.
Base Year Value
$24.5B in 2025 (MMA Primary Research Dataset, August 2026)
Forecast Period
2026 to 2036, eleven discrete annual values
CAGR
9.2% base case. Bull 10.5%. Bear 7.9%.
Fastest Growth Segment
RFID and NFC Smart Tags: 13.8% CAGR
Fastest Growth Country
India: 15.8% CAGR
Fastest Growth Region
South Asia and Pacific: 11.2% CAGR
Largest Region
East Asia: 29% of 2025 global value
Market Leaders
Sealed Air, Amcor, Avery Dennison, Multisorb Technologies, CCL Industries. Source: MMA Analysis based on company annual reports.
Primary Survey
n=3,800 procurement and R&D decision-makers, Q4 2025, six countries
Methodology
Demand-side build-up, cross-validated against public data, 47 expert interviews

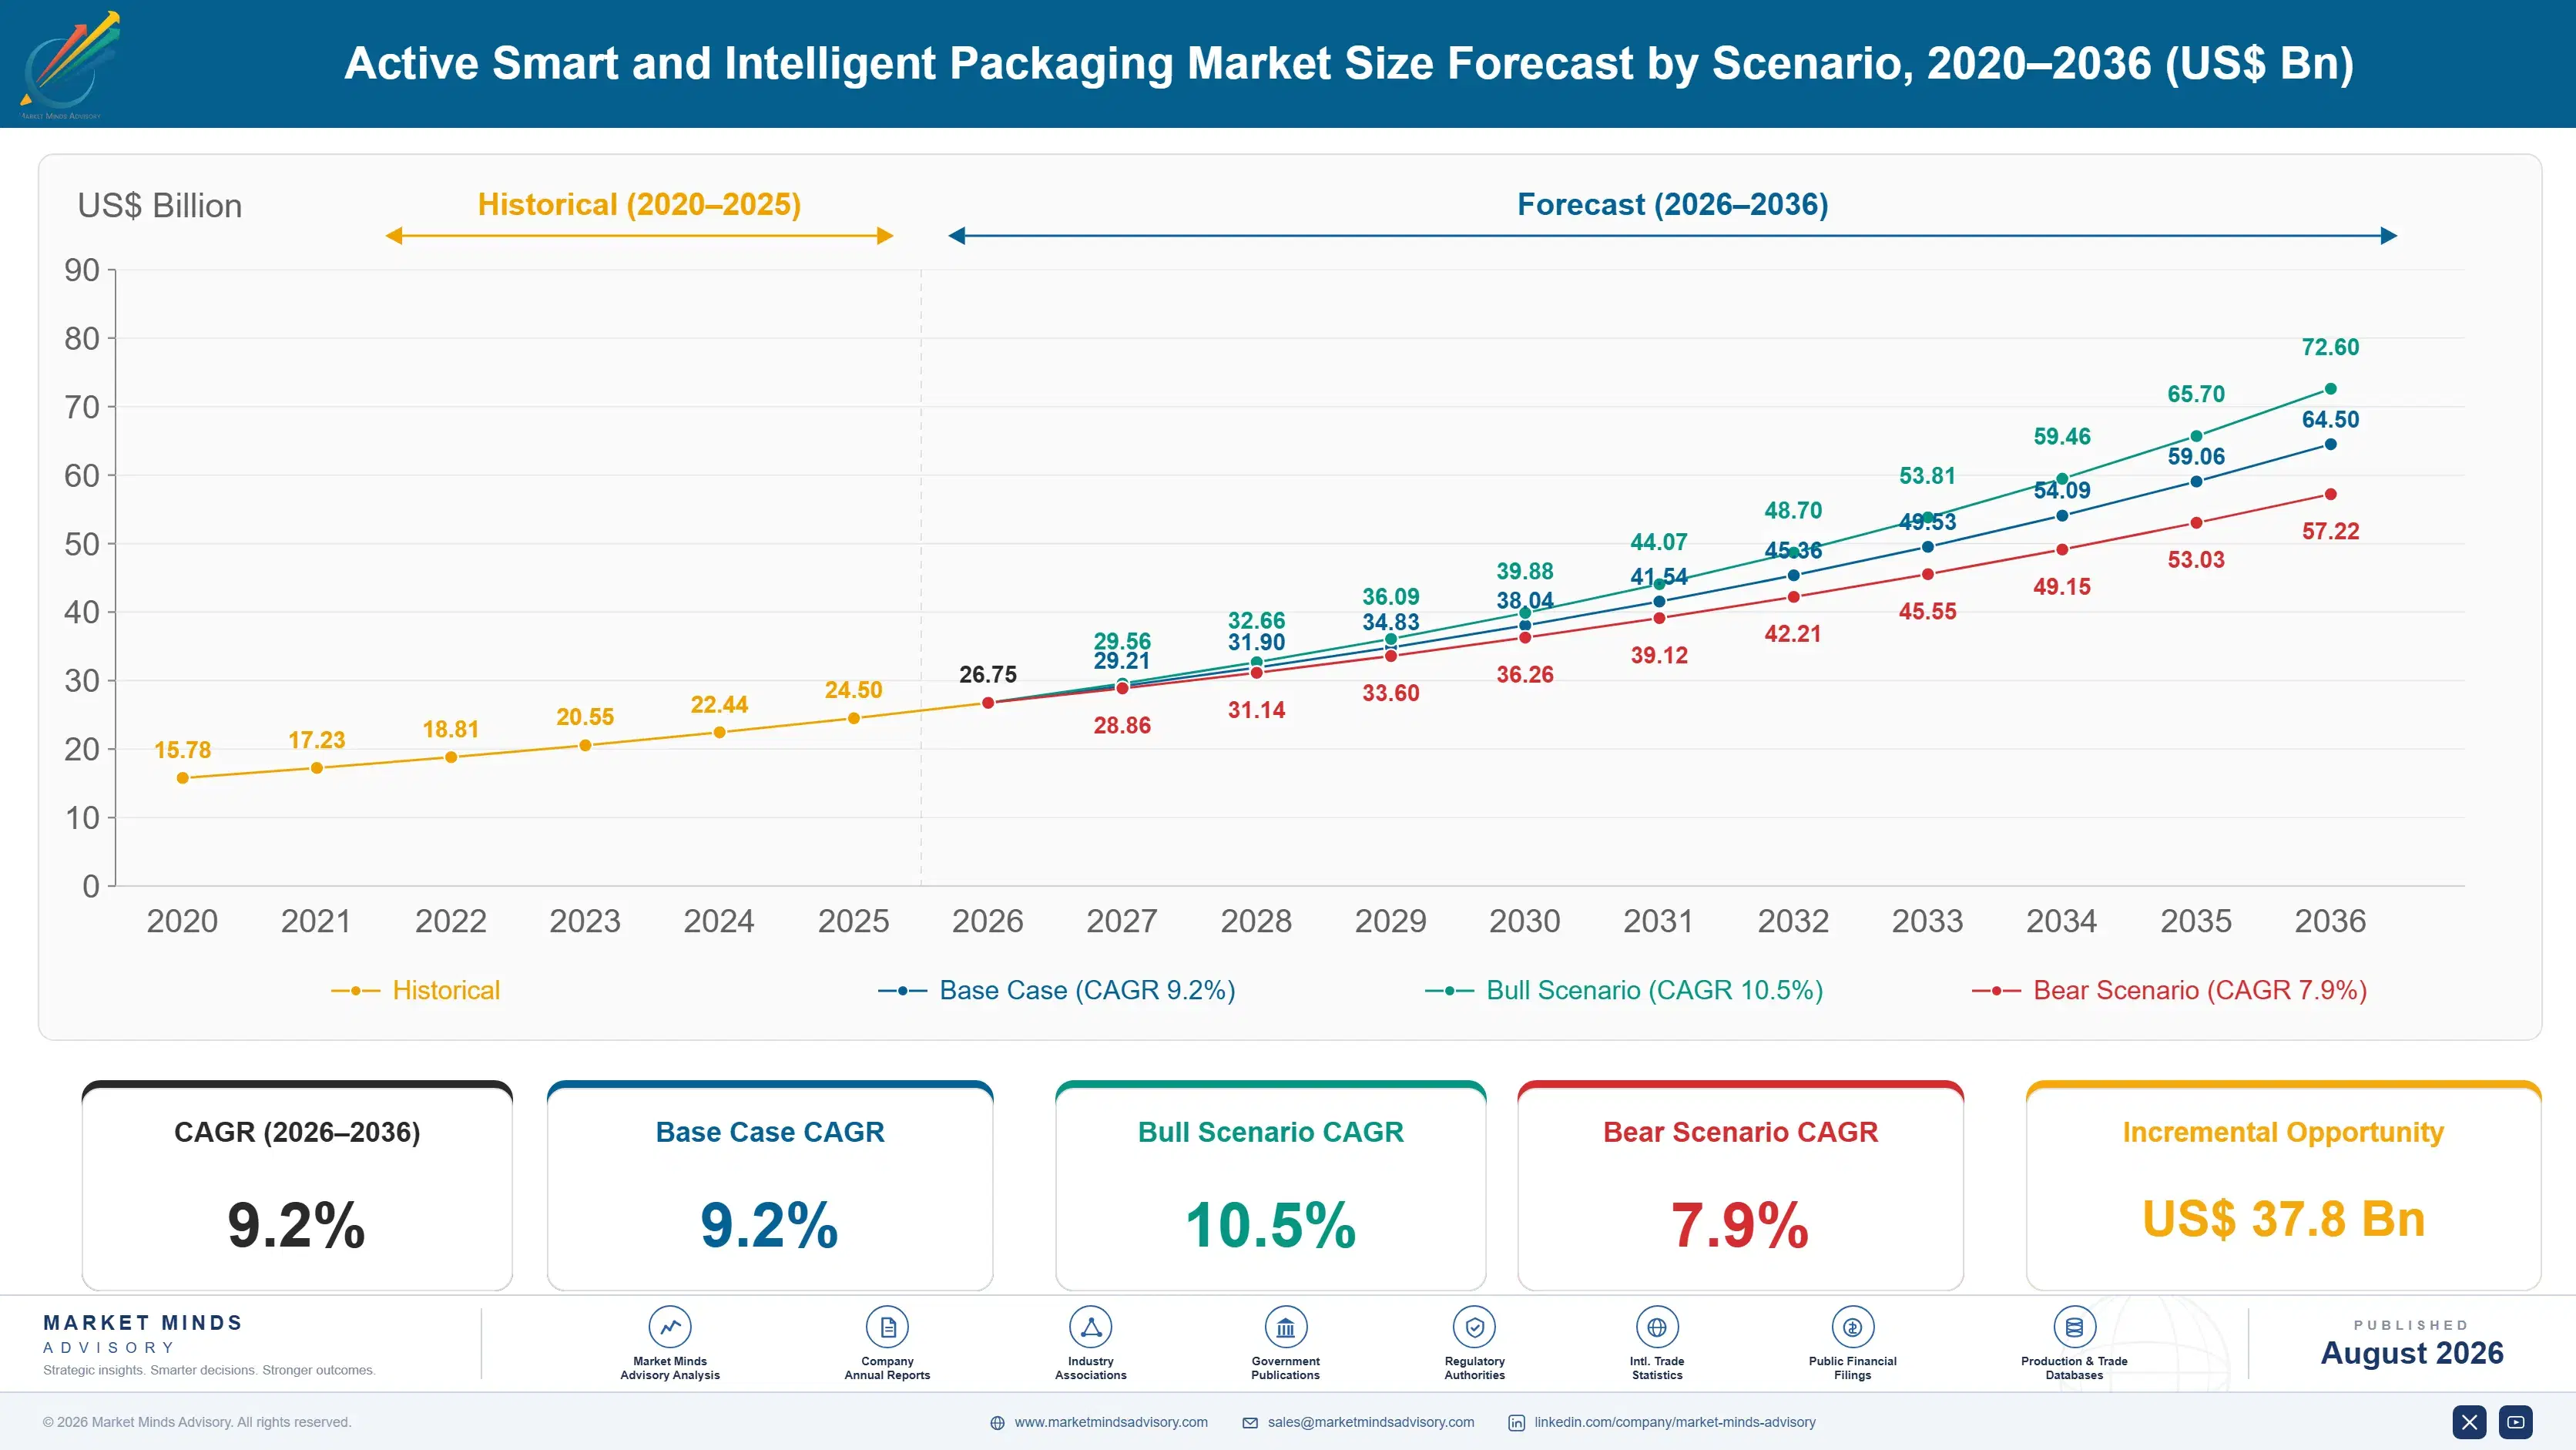
Active Smart and Intelligent Packaging Market Forecast Scenarios

active-smart-and-intelligent-packaging-market-size-forecast-scenario-1787300664134
Between 2020 and 2025 the market grew at roughly 8.0% annually, accelerating sharply as pandemic-era food safety concerns and e-commerce growth pulled both active preservation technology and traceability features into mainstream packaging specification. Pharmaceutical serialization deadlines across the United States, European Union, and India added a second demand wave, converting regulatory compliance into guaranteed smart tag volume regardless of broader packaging industry growth trends.
The base case carries the market to 9.2% annual growth through three mechanisms. First, expanding pharmaceutical serialization mandates across additional countries keep converting regulatory compliance into guaranteed RFID demand. Second, e-commerce anti-counterfeiting programs are pulling luxury goods, electronics, and pharmaceutical brands toward embedded traceability technology independent of any single regulatory requirement. Third, food safety concerns keep expanding time-temperature indicator adoption across cold chain logistics, particularly in markets building modern retail infrastructure for the first time.
The bull case, 10.5%, assumes additional major markets adopt comprehensive pharmaceutical serialization mandates within the forecast window, pulling forward smart tag demand faster than currently planned. The bear case, 7.9%, assumes cost and integration complexity slow adoption among smaller converters and brand owners who lack the capital or technical capability to retrofit existing packaging lines quickly.

Compliance Turns a Niche Into Infrastructure

Three forces converge on this market simultaneously. Pharmaceutical serialization mandates keep expanding across new jurisdictions, converting regulatory compliance directly into guaranteed RFID and smart label demand regardless of underlying cost competitiveness. E-commerce anti-counterfeiting programs keep pulling brand owners toward embedded traceability technology independent of any single regulatory requirement. And food safety expectations keep expanding active preservation and freshness i
MARKET CONCENTRATIONCR5: 38%Fragmented supplier base spans chemicals, tech, and packaging
AVERAGE UNIT COST PREMIUM5% to 25% vs passivePremium varies sharply by technology type and application
TOP PRODUCING COUNTRYChina: 27% of outputDomestic RFID chip and smart label manufacturing anchors output
CAPACITY UTILIZATION71%Specialized production lines run below typical industry benchmarks
ELECTRONICS COST SHARE34% of COGSChips, antennas, and sensor components dominate intelligent packaging cost
SERIALIZATION COMPLIANCE DEADLINE2027 to 2030Major pharmaceutical markets face staggered mandatory rollout timelines
Commercially, this market behaves like a technology integration business layered onto conventional packaging manufacturing. Suppliers compete on chip cost, sensor reliability, and integration simplicity as much as on price, since brand owners increasingly demand active and intelligent features that integrate smoothly within existing production line speeds. That integration capability, more than raw technology sophistication, increasingly separates competitive suppliers from specialists who cannot scale beyond pilot programs.
Over the next decade expect continued convergence between active and intelligent technologies as brand owners demand combined solutions rather than single-function add-ons across every category. Pharmaceutical serialization compliance will keep anchoring baseline RFID demand for years to come. And electronics cost deflation, more than packaging industry growth alone, will increasingly determine how quickly smart features spread into lower-value consumer categories worldwide.
"Ten years ago this was a science project on packaging. Now a regulator can shut down your pharmaceutical shipment if the tag isn't there."
Director, Packaging Technology and Innovation Practice · MMA Packaging Practice

Market Trends

Pharmaceutical Serialization Mandates Keep Expanding Globally

The United States Drug Supply Chain Security Act, the European Union's Falsified Medicines Directive, and India's staggered national serialization rules have progressively required pharmaceutical packaging to carry unique, traceable identifiers readable at each point in the distribution chain. Additional countries across Southeast Asia, Latin America, and the Middle East are adopting comparable requirements on rolling implementation timelines through 2030, creating a predictable multi-year demand pipeline for RFID and serialized label technology. Manufacturers report multi-year order backlogs for compliant packaging lines as pharmaceutical companies race to meet deadlines rather than risk shipment holds or market access restrictions in regulated jurisdictions specifically.
Market Impact: Cuts RFID unit costs 30%
E-Commerce Growth Drives Anti-Counterfeiting Technology Adoption

Online marketplaces have made counterfeit goods a larger commercial problem for luxury, electronics, and pharmaceutical brands, since buyers cannot physically inspect products before purchase the way they could in traditional retail channels. Brand owners increasingly embed NFC tags and QR-linked authentication features directly into packaging, letting consumers verify product authenticity through a smartphone scan at the point of purchase or delivery. Major luxury goods conglomerates and several global electronics manufacturers have publicly committed to embedding authentication technology across their full product portfolios within defined multi-year timelines, creating sustained demand independent of any single pharmaceutical or food safety regulatory driver specifically.
Market Impact: Adds 11.5% freshness indicator segment growth

Market Opportunities and Growth Drivers

RFID Chip Costs Keep Falling With Scale

Unit costs for passive RFID inlays and NFC chips have declined meaningfully as manufacturing volume scales and semiconductor production processes mature, making embedded smart tag technology commercially viable for a widening range of packaging categories that could not previously justify the added cost. Avery Dennison and Impinj both report meaningful per-unit cost reduction across recent product generations, and continued scale economics are expected to keep narrowing the cost gap between smart and conventional packaging further. This cost trajectory determines how quickly RFID adoption spreads beyond pharmaceutical and luxury goods into mainstream consumer packaged goods categories where margins are thinner.
Market Impact: Raises line conversion costs by 25%

Cold Chain Food Safety Concerns Boost Indicator Demand

Retailers and food safety regulators increasingly require verifiable temperature monitoring across cold chain logistics, particularly for fresh and perishable goods where undetected temperature excursions create genuine food safety risk rather than simply a quality concern. Time-temperature indicators and gas sensor labels give retailers and regulators visible, tamper-evident proof of cold chain integrity that internal logistics data alone cannot provide to end consumers at point of sale. Growing modern retail infrastructure across emerging markets is expanding the addressable base for this technology considerably faster than mature market grocery categories, where cold chain infrastructure has already been substantially built out.
Market Impact: Cuts recyclability scores up to 20%

Market Restraints and Challenges

Integration Complexity Slows Adoption Among Smaller Converters

Retrofitting existing packaging production lines to incorporate sensors, chips, or active chemistry requires meaningful capital investment and technical expertise that many smaller regional packaging converters lack, leaving large multinational suppliers with a genuine advantage in capturing smart packaging contracts. The root cause is capital intensity: specialized equipment and quality control processes needed for reliable chip placement or active chemistry dosing cost more than conventional line investment. The commercial impact concentrates smart packaging capability among larger suppliers, limiting how quickly the broader converter base can respond to growing demand. Some smaller converters are responding by partnering with technology specialists instead.
Market Impact: Adds compliance deadlines across 40-plus countries

Recycling Complications Limit Sensor Material Adoption

Embedded electronics, adhesives, and multi-material laminates used in intelligent packaging complicate recycling in ways similar to bi-metal or multi-layer flexible packaging, creating tension between traceability functionality and the mono-material recyclability increasingly demanded by packaging sustainability regulation. The root cause is a design tradeoff: electronic and adhesive components that make smart features work reliably are difficult to separate from the base substrate using standard recycling processes. The commercial impact falls hardest on brand owners marketing sustainability claims alongside smart packaging features, since the two objectives currently pull in different directions. Some suppliers are developing removable tag designs to address this.
Market Impact: Cuts counterfeit losses by roughly 18%
3 additional market trends, 2 additional growth drivers, and 4 additional restraints and challenges are covered in the full report. Contact sales@marketmindsadvisory.com to access the complete intelligence.

Segment CAGR and Growth Architecture

Segmentation follows technology type, the single classification logic that determines whether a solution actively modifies package conditions or simply monitors and communicates them. Oxygen scavengers, antimicrobial films, freshness indicators, RFID tags, moisture control, and gas sensors each demand distinct integration methods and cost structures, so commercial position tracks underlying technology mechanism rather than end-use application or packaging material specifically.
active-smart-and-intelligent-packaging-market-market-share-analysis-1787300664673

RFID and NFC Smart Tags

RFID and NFC smart tags grow fastest at 13.8%, exactly 1.50 times the overall market rate, as pharmaceutical serialization mandates and e-commerce anti-counterfeiting programs both converge on embedded traceability as the preferred compliance and brand protection mechanism. These tags carry unique digital identifiers readable via radio frequency or near-field communication, letting supply chain participants and end consumers verify authenticity and track product movement without physical inspection. Avery Dennison and Impinj lead this segment's chip and inlay supply, while Zebra Technologies and CCL Industries lead label conversion and system integration for pharmaceutical and retail brand customers. Falling per-unit chip costs are the primary factor expanding this segment's addressable base into broader consumer packaged goods categories.
CAGR 13.8%

Time-Temperature and Freshness Indicators

Time-temperature and freshness indicators grow second-fastest at 11.5%, about 1.25 times the overall rate, as retailers and food safety regulators increasingly require verifiable cold chain monitoring for fresh and perishable goods rather than relying on internal logistics data alone. These indicators use color-changing chemical reactions or embedded sensors to provide visible, tamper-evident proof of temperature exposure across a product's full distribution journey. Vitsab International and Timestrip lead this segment's specialized indicator technology, while Cryolog and Freshpoint compete on food industry-specific application expertise and regulatory documentation support. Growing modern retail and grocery infrastructure across emerging markets is expanding this segment's addressable base considerably faster than in mature markets with already-established cold chain logistics.
CAGR 11.5%
Full segment breakdown across 6 segments available in the complete report.

Regional Architecture and Country Demand Map

East Asia leads on value at 29% of the global total, anchored by China's RFID manufacturing base. North America follows on pharmaceutical serialization demand. South Asia and Pacific posts strong growth on India's compliance timeline, while Western Europe, Latin America, the Middle East, and Eastern Europe complete the distribution.

North America

The Drug Supply Chain Security Act's staggered enhanced drug distribution security requirements, more than any single food safety regulation, explain why North America holds 24% of global value, with pharmaceutical serialization compliance anchoring the region's largest demand category by a considerable margin. The United States hosts the region's largest converter and technology supplier base, including Avery Dennison and Sealed Air's core North American operations serving both pharmaceutical and retail food customers. Canada's comparable pharmaceutical traceability requirements add incremental demand beyond American volume specifically. E-commerce anti-counterfeiting adoption is expanding fastest among luxury goods and electronics brands headquartered in the region. Growth of 8.8% reflects steady multi-sector demand more than any single regulatory catalyst alone.
Share: 24% | CAGR: 8.8% (2026 to 2036)

Western Europe

The European Union's Falsified Medicines Directive anchors virtually all pharmaceutical demand across this region, having required serialized, tamper-evident packaging for prescription medicines since 2019 and pushed converters toward compliant RFID and printed serialization technology specifically. Germany, France, and the United Kingdom represent the region's largest national markets, each layering additional national food safety and packaging waste regulation on top of the EU-wide directive. The region's 20% share, near the lower half of its typical band, reflects mature market saturation: most addressable pharmaceutical serialization conversion opportunity has already been captured. Growth of 7.7%, the softest pace among the seven regions tracked, reflects this underlying market maturity rather than weakening demand across the region's largest national markets.
Share: 20% | CAGR: 7.7% (2026 to 2036)
Regional intelligence for 5 additional markets available in the complete report: East Asia, South Asia and Pacific, Latin America, Middle East and Africa, Eastern Europe. Contact sales@marketmindsadvisory.com.
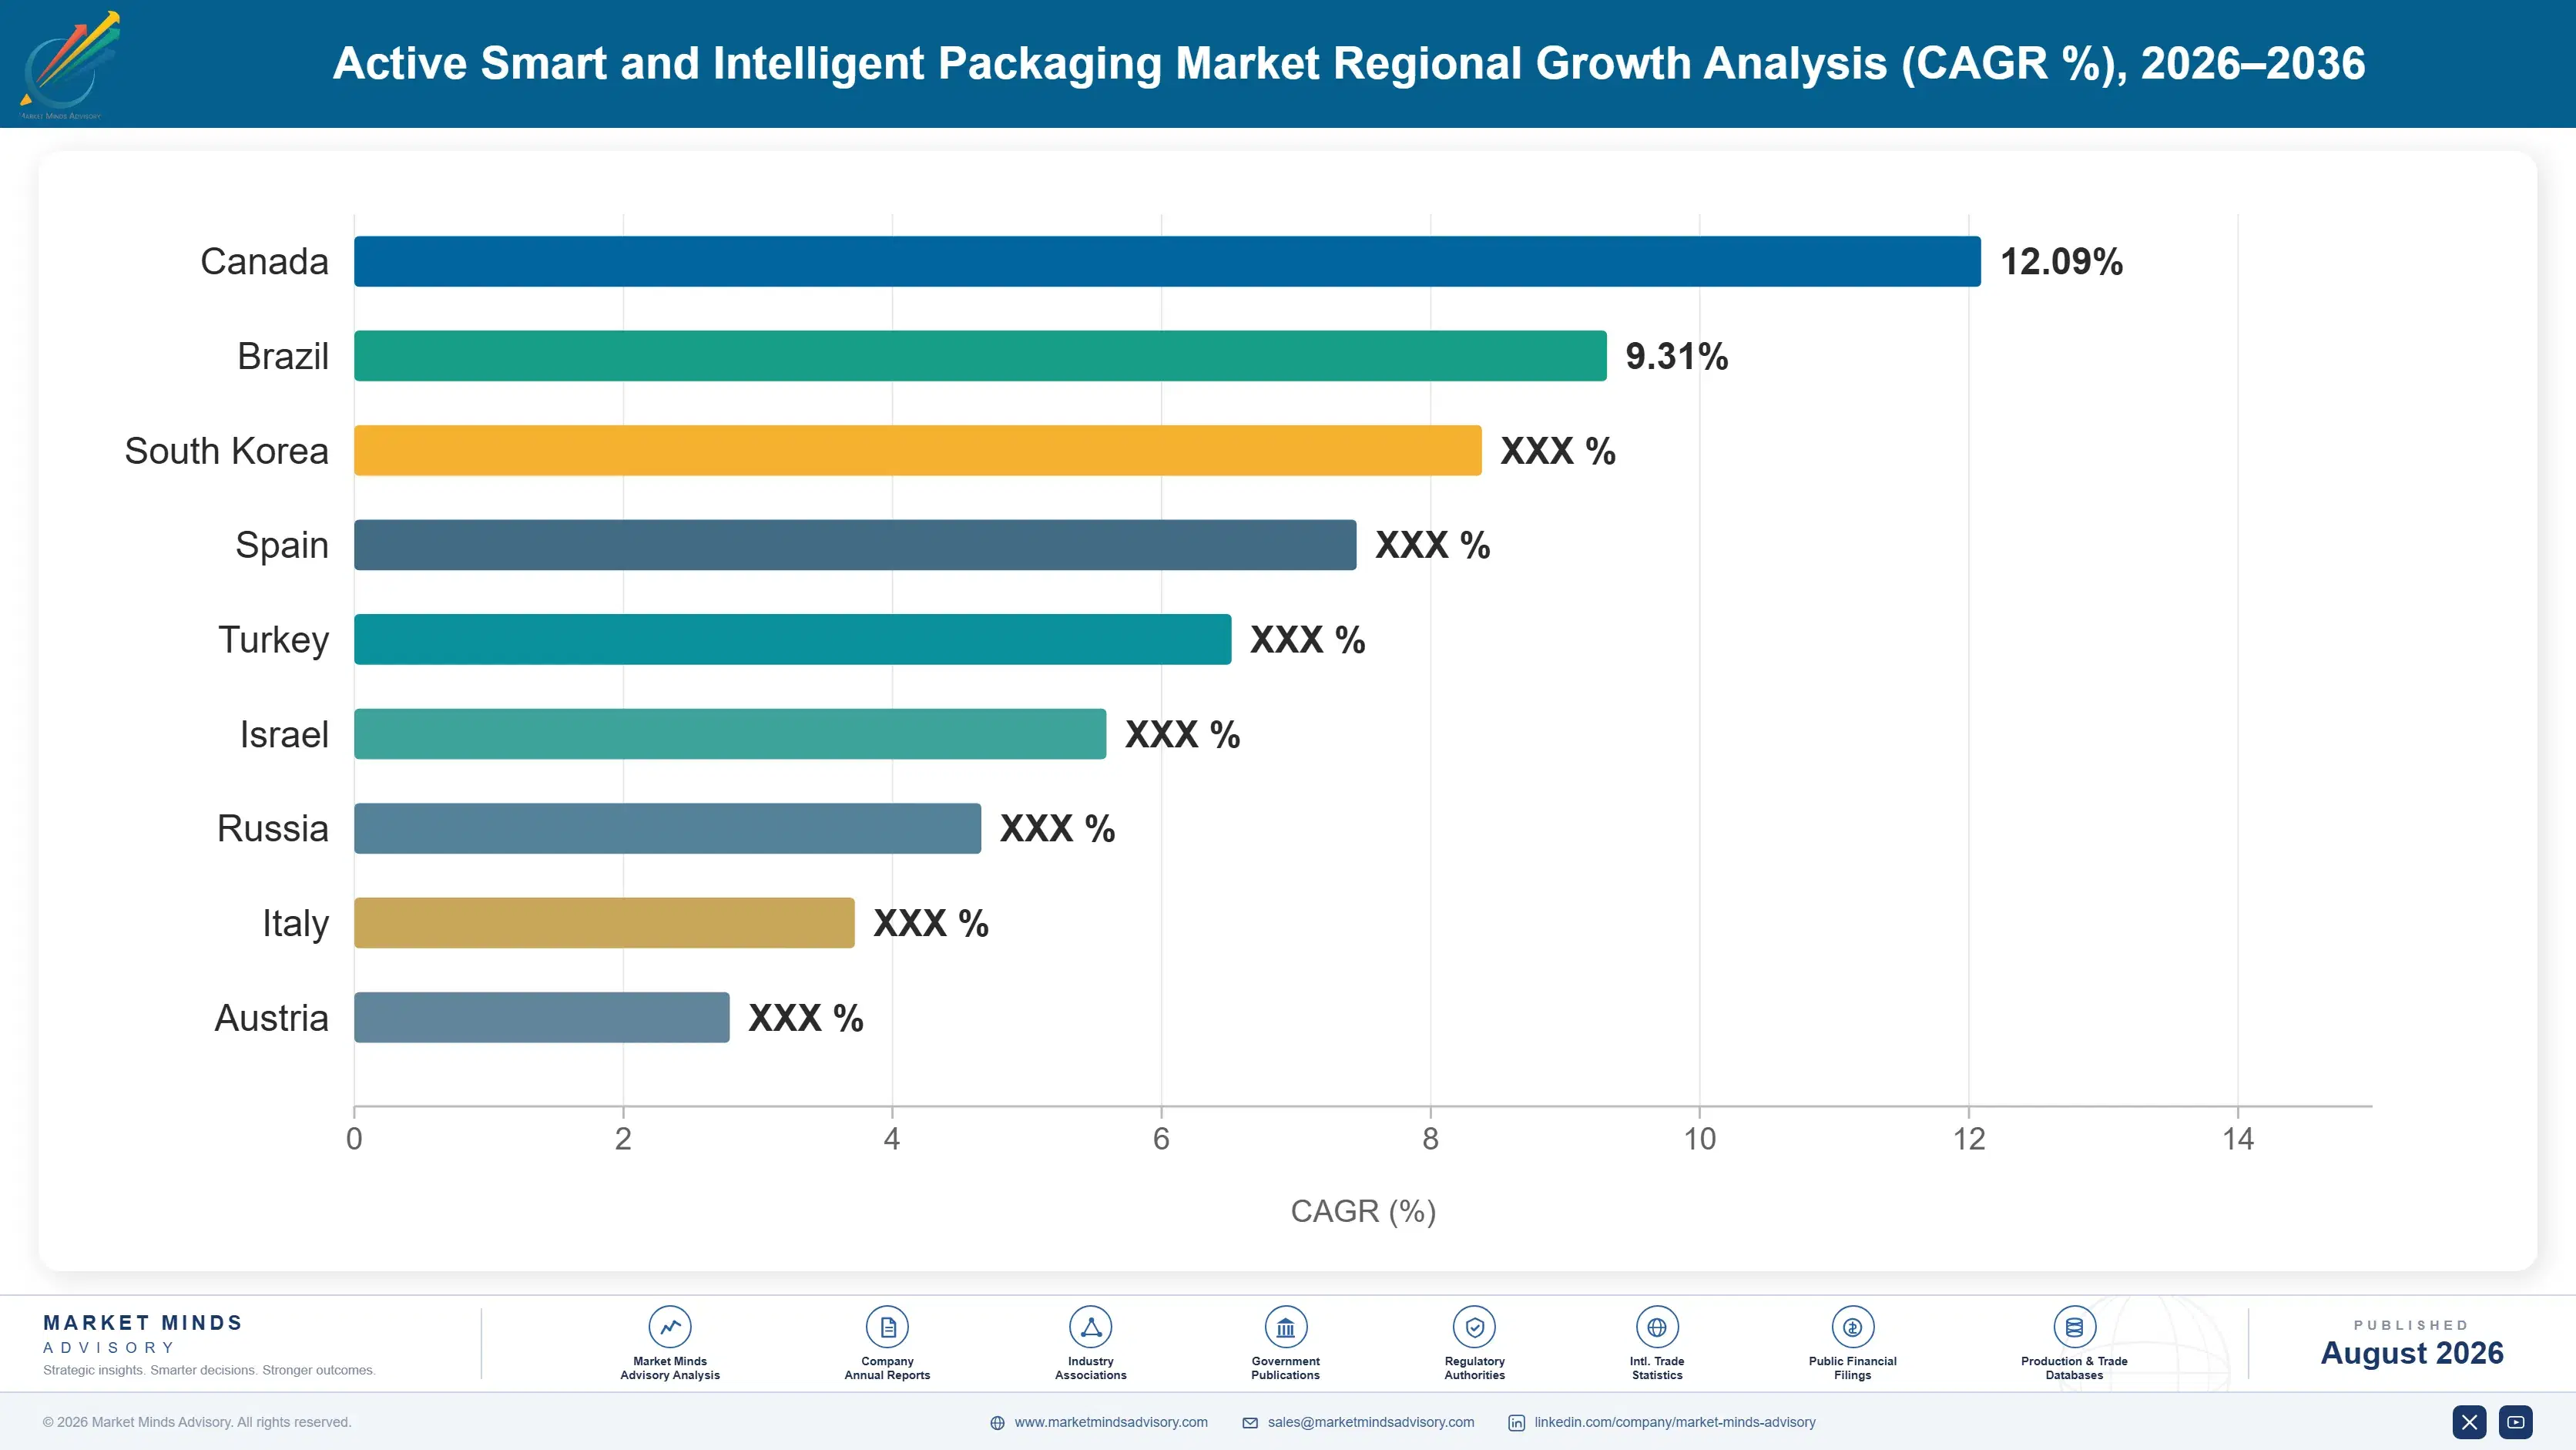
active-smart-and-intelligent-packaging-market-country-cagr-analysis-1787300665181

How Suppliers Can Defend Smart Packaging Margin

Margin increasingly depends on integration capability and regulatory documentation support rather than raw technology cost alone, as brand owners demand combined active and intelligent solutions rather than standalone add-on features. The four levers below target integration, data, and compliance revenue that smart packaging suppliers have historically left underexploited, converting a component sale into a longer, more defensible customer relationship.

Bundle Regulatory Compliance Documentation With Tag Sales

Suppliers who bundle serialization compliance documentation and regulatory filing support alongside physical RFID tag sales gain access to pharmaceutical procurement contracts that increasingly require documented compliance capability rather than component supply alone. Avery Dennison and CCL Industries both report that compliance documentation depth directly determines which pharmaceutical tenders they can even bid for, independent of raw tag pricing. Building this capability requires meaningful upfront investment in regulatory affairs expertise, often exceeding $2 million annually, but suppliers who complete it early lock in multi-year pharmaceutical contracts before compliance support becomes table stakes rather than a genuine differentiator.
Market Impact: Wins multi-year pharma contracts worth over $2 million

Sell Anonymized Supply Chain Data Analytics Services

Every RFID scan and sensor reading generates supply chain visibility data that, aggregated across thousands of shipments, has real value to brand owners and logistics providers optimizing inventory and cold chain performance. Suppliers running their own data platforms can offer analytics subscriptions layered on top of physical tag sales, a revenue stream several adjacent technology categories have already built successfully. Zebra Technologies and Impinj both report recurring revenue equal to 15% to 25% of tag sales from analytics subscriptions, smoothing income against the lumpy nature of packaging line conversion projects that otherwise concentrate revenue around initial deployment events.
Market Impact: Generates 15% to 25% recurring subscription analytics revenue

Expand Direct To Brand Authentication Program Contracts

Suppliers increasingly sell authentication and anti-counterfeiting programs directly to luxury and electronics brand owners rather than through packaging converter intermediaries, capturing margin that pure component suppliers leave entirely on the table. These programs bundle physical NFC tags with consumer-facing verification apps and ongoing fraud monitoring services, commanding 20% to 40% premium pricing above component cost alone since brand owners pay for the complete authentication experience rather than just the underlying chip. Building this direct brand relationship channel requires marketing and software investment most component-focused suppliers have historically avoided, but the margin differential justifies that investment for suppliers with differentiated technology.
Market Impact: Commands 20% to 40% premium on brand programs

Build Regional Manufacturing To Cut Chip Import Cost

Import tariffs and shipping cost on RFID chips and sensor components manufactured outside the destination market have risen enough that regional assembly, closer to major pharmaceutical and e-commerce demand centers, increasingly beats import economics even at higher local labor cost. Suppliers building assembly capacity in India, Southeast Asia, and parts of Europe, rather than relying entirely on Chinese-manufactured components, cut landed cost by roughly 15% while also shortening lead times that matter increasingly to pharmaceutical customers managing regulatory compliance deadlines. This shift requires upfront capital, but suppliers who move early capture share from competitors dependent on longer import chains.
Market Impact: Cuts landed chip import costs by roughly 15%

Who Controls the Margin Pool

Five suppliers control just over a third of global revenue, a fragmented picture for a technology category spanning chemicals, electronics, and packaging conversion. Sealed Air and Avery Dennison both lead on scale, though Sealed Air leads active chemistry while Avery Dennison leads RFID and label technology, occupying different points in the value chain. Revenue, the basis used throughout this assessment, favors suppliers with broader technology range.
Competitive activity currently runs across three dimensions. Suppliers race to complete compliance documentation before rivals lock in serialization contracts requiring proven regulatory expertise. Data analytics and authentication offerings have become a genuine differentiator, as brand owners increasingly prefer suppliers who extend value beyond the physical tag. Chinese RFID manufacturers are winning export orders in markets once held by Western suppliers.

Pressure is building from two directions that could reshuffle rankings within the decade. Indian and Southeast Asian regional integrators, absent from the key player list, are scaling compliance capacity to serve compressed local deadlines. Semiconductor manufacturers, technically outside this market but competing for the same chip supply chain, are proving vertical integration can command margin pure converters struggle to match, forcing established players to decide whether to build chip capability or deepen partnerships.
active-smart-and-intelligent-packaging-market-company-positioning-matrix-1787300665706

Competitive Moat and Risk Dimensions

SEALED AIR CORPORATION

Moat: Deep Active Packaging Chemistry Expertise

Sealed Air holds decades of formulation expertise in oxygen scavenging, antimicrobial, and moisture control chemistry that newer technology-focused entrants cannot easily replicate, built on extensive food safety and shelf-life extension application knowledge. That chemistry depth supports premium positioning in demanding food safety applications requiring proven, validated performance rather than experimental technology.
SEALED AIR CORPORATION

Risk: Limited Smart Tag Presence

Sealed Air's core strength in active packaging chemistry leaves it less positioned to capture the market's fastest-growing intelligent packaging segments, since RFID and smart tag technology requires electronics and software capability meaningfully different from chemical formulation expertise the company has traditionally built its business around.
AVERY DENNISON CORPORATION

Moat: Broadest RFID Portfolio Depth

Avery Dennison ships RFID inlays and smart labels across the widest range of applications of any single supplier, spanning pharmaceutical serialization, retail apparel tagging, and luxury goods authentication from one integrated global platform. That breadth reduces dependence on any single end-market's demand cycle for overall order volume.
AVERY DENNISON CORPORATION

Risk: Exposure To Semiconductor Supply Volatility

Avery Dennison's RFID business depends on semiconductor chip supply that has proven volatile in recent years, exposing the company to allocation constraints and pricing pressure during industry-wide chip shortages that chemistry-focused competitors do not face to the same degree given their different input cost structure.

Key Players

Sealed Air Corporation
Amcor plc
Avery Dennison Corporation
Multisorb Technologies LLC
CCL Industries Inc.

Others

Mitsubishi Gas Chemical Company, Inc.
Sonoco Products Company
Impinj, Inc.
Zebra Technologies Corporation
Thin Film Electronics ASA
Timestrip UK Ltd.
Vitsab International AB
BASF SE
Tetra Pak International S.A.
DuPont de Nemours, Inc.
3M Company
Cryolog SAS
Freshpoint Quality Assurance Ltd.
Honeywell International Inc.
Toppan Inc.

Recent Developments

FEBRUARY 2025

Avery Dennison Expands RFID Inlay Production Capacity In India

Avery Dennison expanded RFID inlay production capacity at a facility in India, aiming to meet growing demand from the country's compressed pharmaceutical serialization compliance timeline. The expansion adds meaningful annual capacity without requiring an entirely new greenfield manufacturing site or additional permitting delays this year.
Signal: Signals established global suppliers are investing directly in Indian capacity ahead of the country's approaching compliance deadlines.
JUNE 2025

Sealed Air And A Regional Converter Sign Licensing Agreement

Sealed Air signed a licensing agreement with a regional Southeast Asian converter to manufacture its active packaging chemistry locally for regional food safety customers. The agreement was structured as a licensing arrangement rather than any joint venture or equity investment between the two companies involved.
Signal: Signals established chemistry suppliers are localizing production through licensing rather than direct capital investment abroad each year.
OCTOBER 2025

Impinj Acquires Specialty Authentication Software Startup

Impinj completed the acquisition of a small specialty authentication software company, adding consumer-facing verification app technology to its existing RFID chip and reader portfolio. The transaction was a full acquisition, not a licensing or minority equity investment arrangement between the two parties involved in the deal.
Signal: Signals chip manufacturers are acquiring software capability to capture more of the authentication value chain themselves.

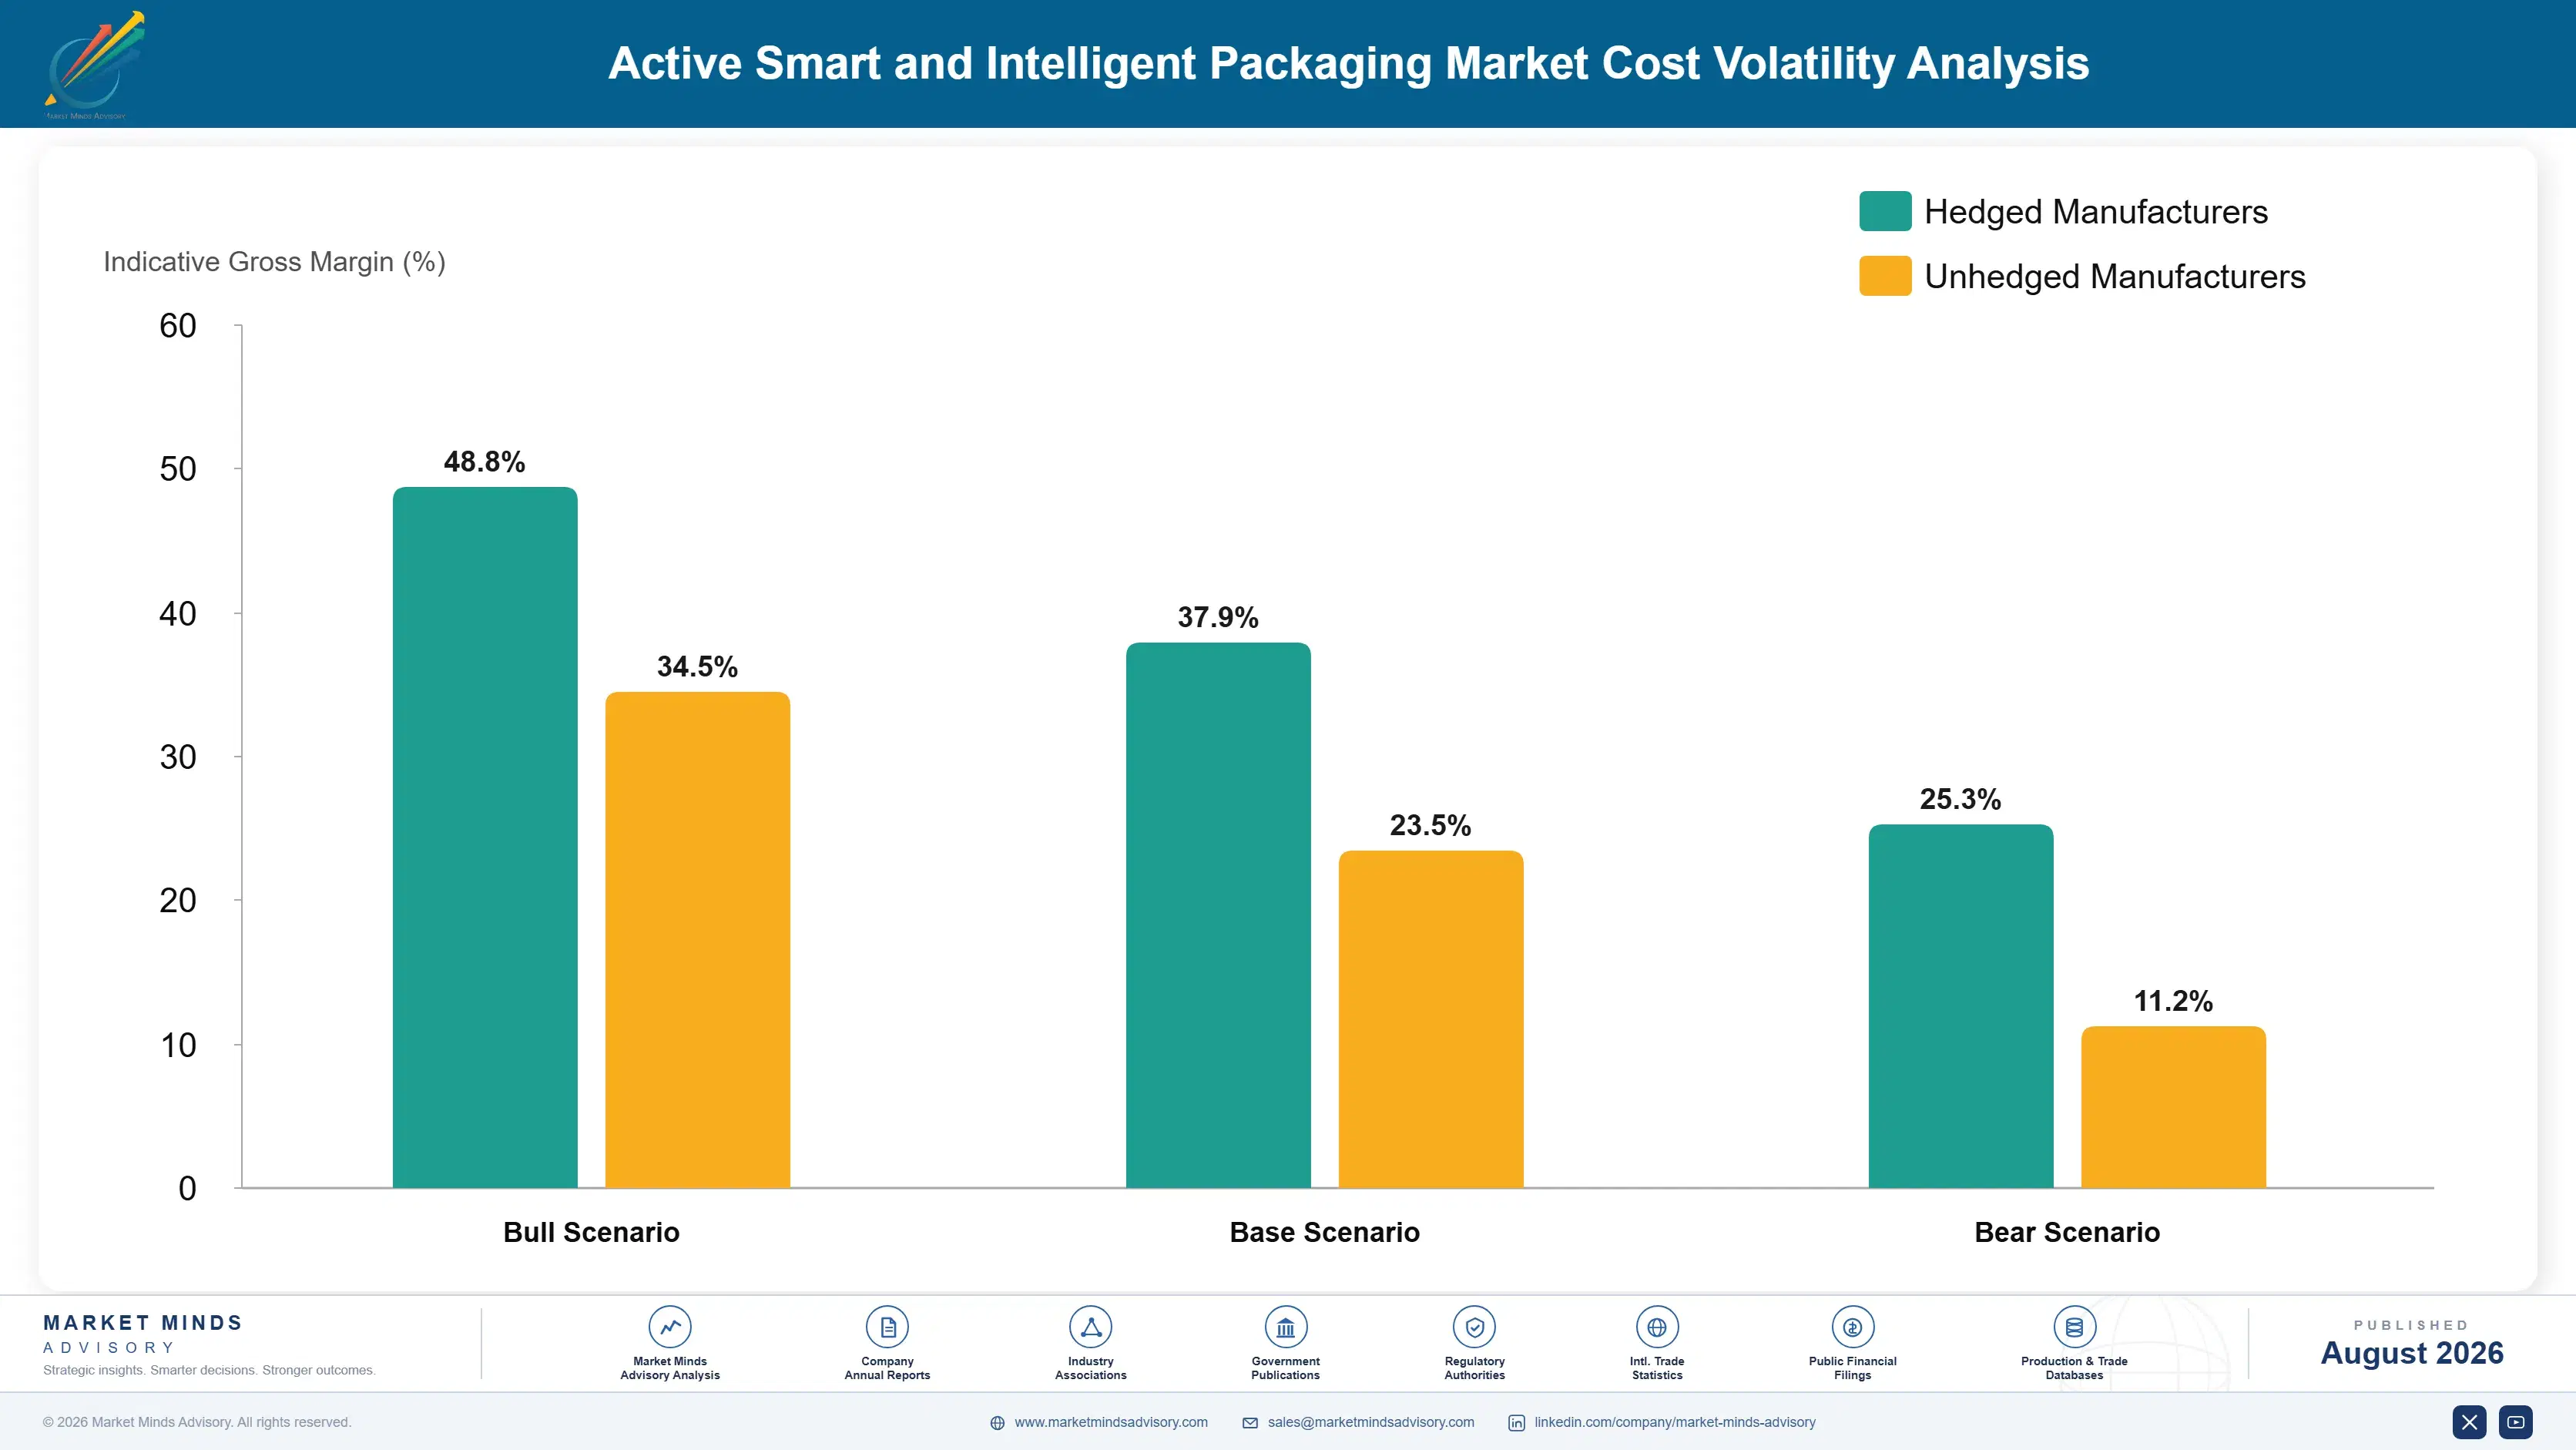
What Actually Drives Smart Packaging Cost

Electronics components, RFID chips, antennas, and sensor elements, account for roughly 34% of intelligent packaging production cost, sourced primarily from semiconductor foundries and antenna manufacturers concentrated in Taiwan, China, and South Korea. Active chemistry inputs, oxygen scavenging and antimicrobial compounds, add another 22% for active packaging products specifically, while label substrate and converting costs make up most of the remainder.
Semiconductor chip supply tightened sharply in 2021 and 2022 as automotive and consumer electronics demand competed directly with RFID chip manufacturers for the same foundry capacity. Avery Dennison's 2022 annual report cited chip allocation constraints as a direct pressure on smart label production that year, and several suppliers reported similar pressure, pushing some smaller converters toward extended lead times until foundry capacity expanded meaningfully into 2023 and 2024.

Smaller regional suppliers carry the sharpest exposure, since they lack the purchase volume to negotiate priority chip allocation that Avery Dennison and Impinj secure directly with foundries years in advance. Geographic exposure varies too: suppliers assembling outside East Asia face higher landed component cost since most chip packaging and testing capacity remains concentrated there, a gap that widens whenever cross-border logistics costs move against non-Asian assemblers.
active-smart-and-intelligent-packaging-market-cost-volatility-analysis-1787300665900

Lock Multi-Year Semiconductor Supply Agreements Early

Suppliers with sufficient purchase volume are negotiating multi-year allocation agreements directly with semiconductor foundries, trading pricing flexibility for guaranteed capacity during industry-wide shortages. This approach favors the largest suppliers disproportionately, since minimum volume commitments required for priority allocation sit well beyond what smaller regional converters can commit to reliably given typical purchase volumes and contract terms.

Qualify Multiple Chip Suppliers For Key Components

Some suppliers now qualify two or three interchangeable chip suppliers for critical RFID components rather than depending on a single source, trading some engineering complexity for meaningfully improved supply resilience during regional shortages or export restrictions affecting any single semiconductor origin, keeping production schedules intact through most disruptions and allocation constraints across the industry.

Build Regional Assembly Capacity Near Demand Centers

Opening assembly facilities closer to major pharmaceutical and e-commerce demand regions, as Avery Dennison has done in India, cuts tariff exposure and logistics cost even when core chip components still ship from concentrated foundry locations, shortening the exposed portion of the value chain meaningfully overall for regionally integrated suppliers and their contracted customers across every market served.

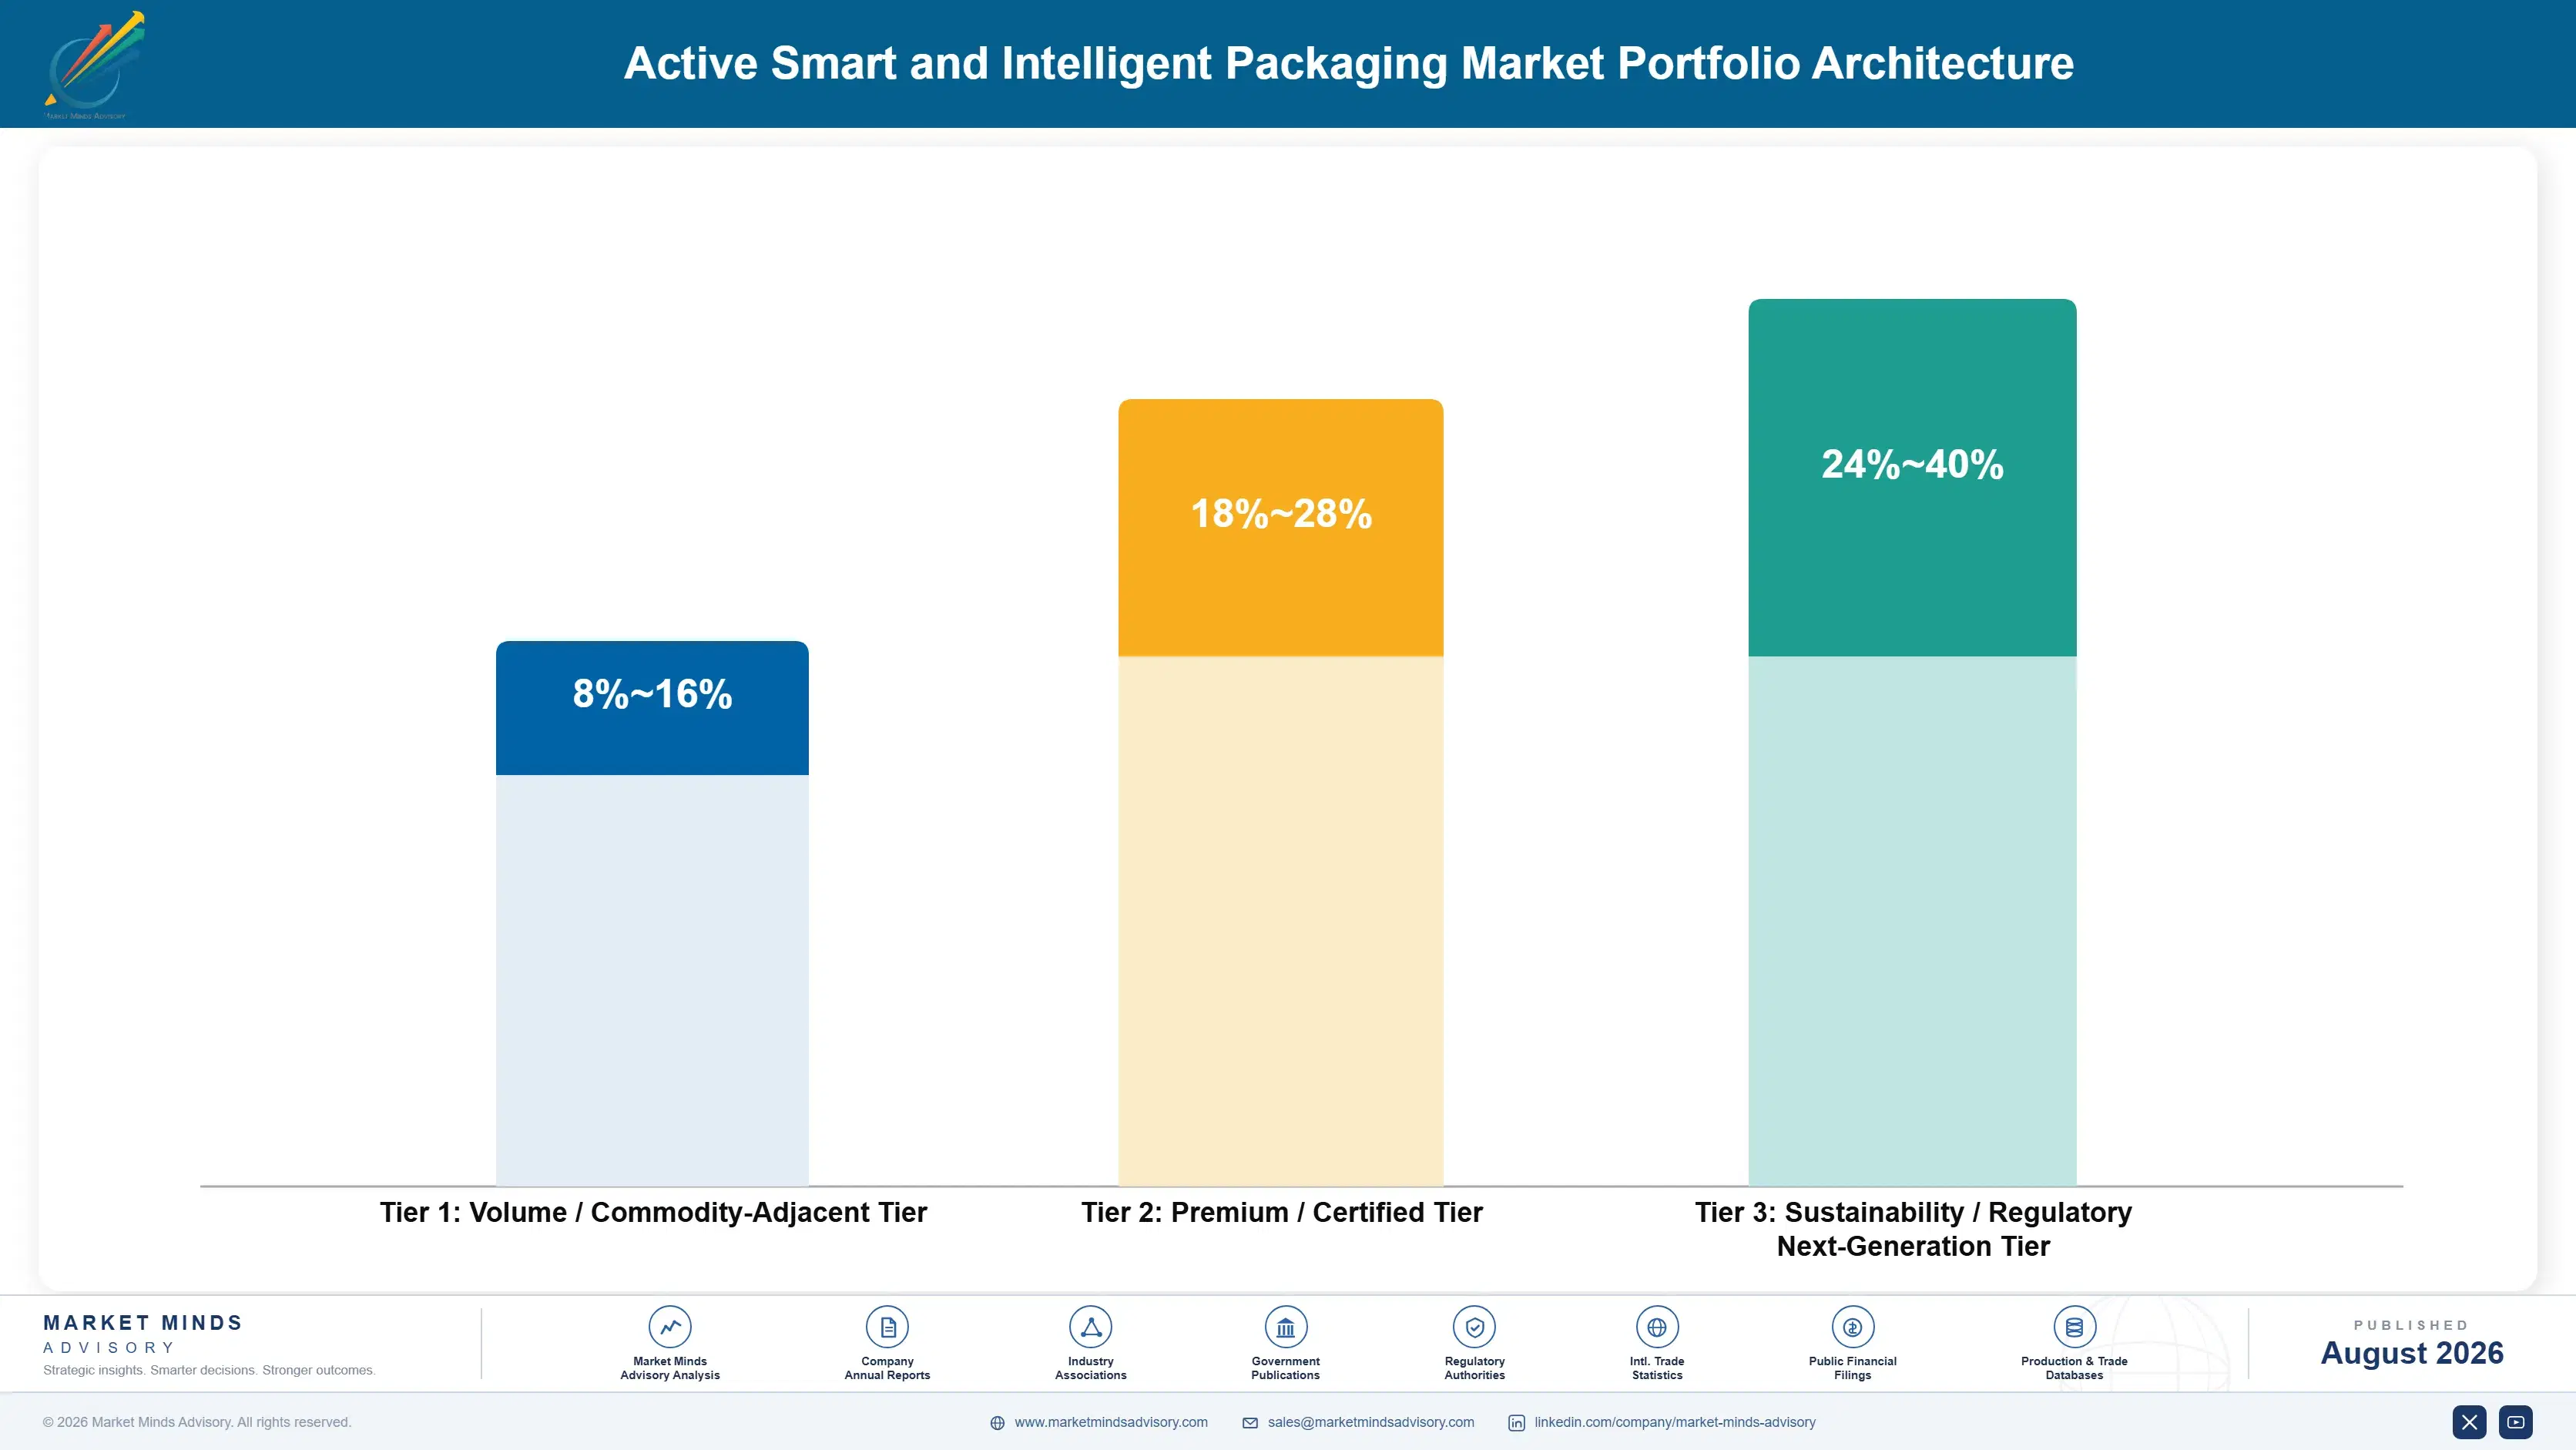
Portfolio Architecture for Margin Defence

The portfolio splits into three tiers with margin separation. Volume-tier products, basic oxygen scavengers and standard serialization labels sold largely on price into commoditized food and pharmaceutical channels, compete hard, earning modestly. Premium certified products, covering RFID tags and validated active chemistry meeting documented regulatory specifications, earn more because compliance certification and technical performance support pricing. Next-generation authentication and analyti
The tension here is familiar to any technology-adjacent packaging business: volume products fund the manufacturing scale and distribution relationships premium products depend on, yet volume growth alone cannot fund the software and compliance investment next-generation solutions require. Suppliers leaning too heavily into premium positioning risk losing the manufacturing scale that makes market entry viable in price-sensitive channels, while pure volume players cede that segment to rivals.

High-value pools concentrate where regulatory compliance, technical sophistication, and data service depth intersect: pharmaceutical serialization and brand authentication programs serving customers willing to pay for verified, documented performance. That intersection is still a minority of revenue globally but expanding quickly, which is why the next-generation tier grows fastest even while representing a modest share of total volume today.

Volume / Commodity-Adjacent Tier

Basic oxygen scavengers and standard printed serialization labels sold largely on price into commoditized food and pharmaceutical channels, competing directly against low-cost regional suppliers across most mature markets worldwide today.
Gross Margin: 8%-16%

Premium / Certified Tier

RFID tags and validated active chemistry meeting documented regulatory specifications, sold to pharmaceutical and food safety buyers willing to pay for compliance certification and proven performance across every market tracked.
Gross Margin: 18%-28%

Sustainability / Regulatory / Next-Generation Tier

Authentication and analytics-bundled solutions representing the technology and data services frontier, priced at a premium justified by brand protection value and ongoing subscription revenue streams across the entire global industry.
Gross Margin: 24%-40%
active-smart-and-intelligent-packaging-market-portfolio-architecture-1787300666394

High-value Sub-segments and Strategic Watch-out

RFID and NFC Smart Tags

The fastest-growing and highest-margin segment, expanding at 13.8% as pharmaceutical serialization mandates and e-commerce authentication programs converge on embedded traceability technology. Suppliers with chip supply security and compliance documentation capture the majority of this segment's growth worldwide, well ahead of smaller rivals still building compliance and chip supply capability.
Gross Margin: 24%-40%

Time-Temperature and Freshness Indicators

High value with strong growth as retailers and regulators demand verifiable cold chain monitoring, though overall expansion trails RFID tags since food safety indicator adoption moves more gradually than pharmaceutical compliance deadlines across most regional producing markets and application categories tracked here today across every major producing region.
Gross Margin: 18%-28%

Oxygen Scavenger and Absorber Systems

The volume core by shipment, covering the bulk of active food packaging demand worldwide, generating steady but moderate margins as basic scavenger technology becomes commoditized across nearly every mature market tracked in this year's full segmentation, competitive, and regional review process across all product categories evaluated.
Gross Margin: 8%-16%

Moisture and Humidity Control Systems

The strategic watch-out, as buyers increasingly favor integrated multi-function active packaging over standalone moisture control products, leaving this category's standalone growth trailing even as total active packaging volume keeps expanding across most global markets tracked in this year's full competitive, regional, and application-level report overall.
Gross Margin: 10%-18%

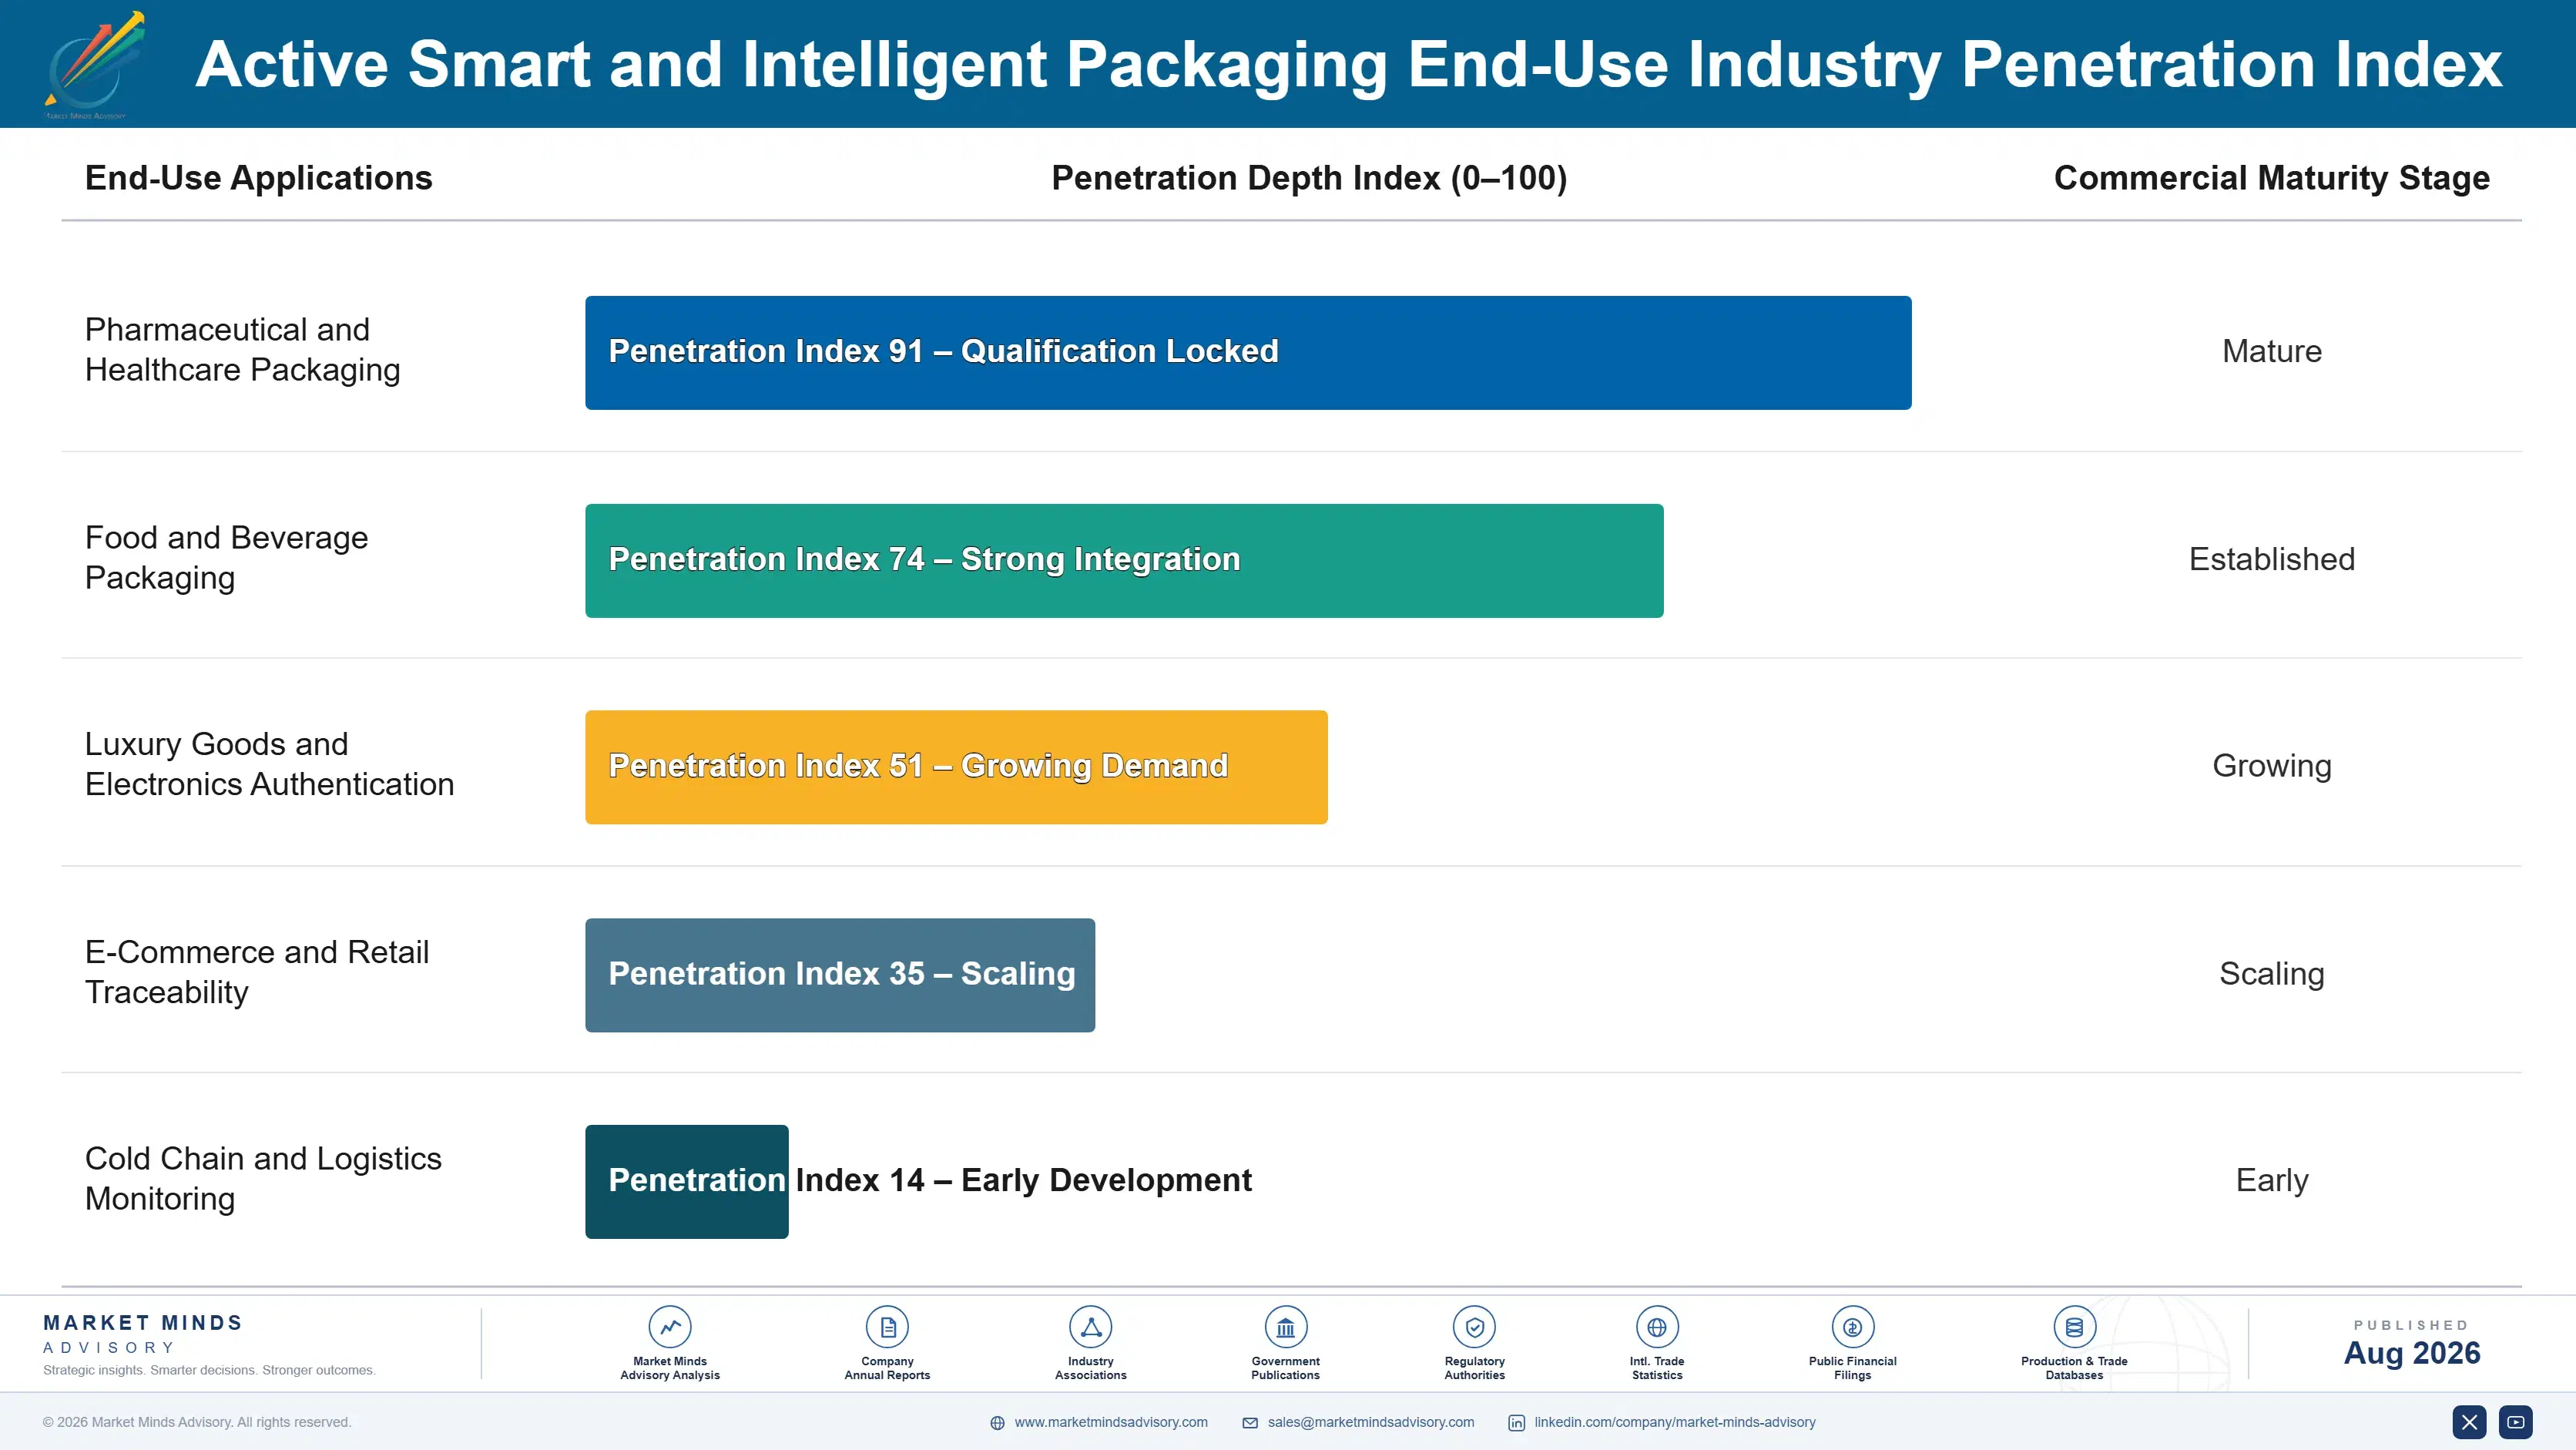
How Smart Packaging Demand Actually Commits

Demand here commits through regulatory-driven compliance cycles layered onto recurring packaging consumption. A pharmaceutical manufacturer facing a serialization deadline typically signs a multi-year technology and label supply agreement covering continuous production line output, since compliance is not a one-time capital purchase but an ongoing packaging requirement for every unit shipped. That recurring-compliance structure makes this market behave like an infrastructure annuity once a brand
Adoption depth varies sharply by regulatory exposure. Pharmaceutical manufacturers adopt fastest once serialization mandates force compliance, since market access restrictions and shipment holds leave little room for delayed implementation. Food and beverage brands adopt more gradually, often driven by retailer requirements or voluntary sustainability positioning rather than binding legal mandate. Luxury goods and electronics brands occupy a middle position, adopting authentication technology selectively based on counterfeit exposure rather than any single dominant regulatory pattern.

Younger brand protection and packaging procurement managers increasingly research technology specifications and supplier compliance track records directly rather than relying on distributor recommendations that previous purchasing generations accepted without independent verification. That shift is pushing suppliers toward more transparent technical documentation, even though long-term supply contracts remain the actual purchasing mechanism for most transactions today.
active-smart-and-intelligent-packaging-market-end-use-penetration-index-1787300666882

Where This Market Rewards Integration

These are among the four positions where our research anticipates prominent divergence between winners and laggards over the coming forecast period. Each is grounded in the demand model, the regulatory perimeter, and the announced capacity pipeline.
01 / REGULATORY COMPLIANCE STRATEGY

Winners will build compliance depth before mandates force it

Raw technology capability alone no longer separates leading suppliers, since most competitors can eventually match a given chip or chemistry specification within a few product cycles. What actually separates winners is the depth of documented regulatory compliance capability across major pharmaceutical jurisdictions, because a technically capable supplier without compliance documentation cannot win the procurement tenders that increasingly require it. Suppliers building dedicated regulatory affairs and compliance documentation capability, rather than treating it as an afterthought, will out-earn technically comparable rivals over the coming decade.
02 / REGIONAL MANUFACTURING FOOTPRINT

Local assembly capacity will decide compressed-deadline market access

Trade cost and lead time, not raw manufacturing cost alone, increasingly determine which suppliers can serve markets like India where compressed compliance deadlines leave little room for long-distance import lead times. Suppliers who build regional assembly capacity early will capture access that purely import-dependent competitors cannot match, regardless of how competitive their underlying chip pricing might otherwise be under normal conditions. Those relying entirely on distant manufacturing will find themselves increasingly unable to meet the fastest-growing compressed-deadline markets within this decade.
03 / DATA AND ANALYTICS REVENUE

Recurring subscription revenue will matter more than tag sales

Suppliers still competing purely on physical tag price per unit are leaving durable revenue on the table that analytics subscriptions and authentication services already capture successfully for data-forward competitors across major markets. These recurring revenue streams persist between the lumpy packaging line conversion cycles that otherwise define this market's uneven revenue pattern tied to deployment timing. Companies that build genuine data and analytics capability early will earn materially more per customer relationship over a decade than those still selling only hardware.
04 / SEMICONDUCTOR SUPPLY RESILIENCE

Chip sourcing resilience will constrain growth more than demand

Even where regulatory demand and brand adoption align favorably for a given supplier, growth is capped by the availability of RFID chips, a constraint that automotive and consumer electronics demand competes directly for and that neither suppliers nor converters fully control today. Suppliers who invest early in multi-year chip supply agreements and dual-sourcing strategies will effectively expand their own addressable market ahead of competitors still exposed to single-source semiconductor dependency. This constraint will matter more to realized growth over the next decade than any single regulatory decision alone.

Engagement Snapshot From the Field

A live engagement with an industry participant carrying material or product regulatory and market exposure ahead of a defining policy shift, showing how our research translates into a defensible multi-year portfolio strategy.
MARKET MINDS ADVISORY · CLIENT ENGAGEMENT SUMMARY
Active Smart and Intelligent Packaging Producer Strategic Portfolio Review and Transition Roadmap 2026·Investment Scenario on Active Smart and Intelligent Packaging Exposure Evaluation 2025-26
CLIENT PROFILE
A mid-sized pharmaceutical manufacturer exporting to several regulated markets approached MMA while evaluating supplier options ahead of India's compressed national serialization compliance deadline. The client reported annual packaging procurement spend near USD 18 million, with roughly 70% of export volume destined for markets requiring documented serialization compliance within the next eighteen months (client-reported, unverified by MMA).
STRATEGIC CHALLENGE
Leadership needed to select a technology supplier capable of meeting the compressed compliance timeline across multiple production lines simultaneously, but faced meaningfully different pricing and implementation timeline proposals across four shortlisted suppliers with no clear internal framework for weighing deadline risk against total cost and long-term supplier reliability across the full engagement.
MMA APPROACH
MMA benchmarked implementation track records and technical capability across all four shortlisted suppliers, modeled total cost of ownership including chip supply risk over a five-year horizon, and interviewed operations leads at three comparable pharmaceutical manufacturers on real-world serialization implementation experience, cost overruns, and timeline outcomes across each completed project and vendor relationship.
KEY FINDINGS
  1. The lowest-bid supplier's implementation track record showed meaningful timeline slippage on comparable prior projects, creating real compliance deadline risk despite attractive headline pricing (client-reported, unverified by MMA).
  2. A mid-priced supplier with dedicated regulatory affairs support offered materially lower total compliance risk than the lowest bid once implementation timeline reliability was properly weighted.
  3. Splitting implementation across two production lines with different suppliers reduced single-supplier dependency risk without meaningfully increasing blended per-unit cost across the full rollout.
  4. Chip supply security mattered more to on-time compliance than supplier size alone, since suppliers with direct foundry relationships avoided allocation delays entirely.
CLIENT PROFILE
A mid-sized pharmaceutical manufacturer exporting to several regulated markets approached MMA while evaluating supplier options ahead of India's compressed national serialization compliance deadline. The client reported annual packaging procurement spend near USD 18 million, with roughly 70% of export volume destined for markets requiring documented serialization compliance within the next eighteen months (client-reported, unverified by MMA).
STRATEGIC CHALLENGE
Leadership needed to select a technology supplier capable of meeting the compressed compliance timeline across multiple production lines simultaneously, but faced meaningfully different pricing and implementation timeline proposals across four shortlisted suppliers with no clear internal framework for weighing deadline risk against total cost and long-term supplier reliability across the full engagement.
MMA APPROACH
MMA benchmarked implementation track records and technical capability across all four shortlisted suppliers, modeled total cost of ownership including chip supply risk over a five-year horizon, and interviewed operations leads at three comparable pharmaceutical manufacturers on real-world serialization implementation experience, cost overruns, and timeline outcomes across each completed project and vendor relationship.
KEY FINDINGS
  1. The lowest-bid supplier's implementation track record showed meaningful timeline slippage on comparable prior projects, creating real compliance deadline risk despite attractive headline pricing (client-reported, unverified by MMA).
  2. A mid-priced supplier with dedicated regulatory affairs support offered materially lower total compliance risk than the lowest bid once implementation timeline reliability was properly weighted.
  3. Splitting implementation across two production lines with different suppliers reduced single-supplier dependency risk without meaningfully increasing blended per-unit cost across the full rollout.
  4. Chip supply security mattered more to on-time compliance than supplier size alone, since suppliers with direct foundry relationships avoided allocation delays entirely.
RECOMMENDED STRATEGY
Phase 1: Phase 1 (0 to 4 months): Award implementation to the supplier with the strongest regulatory affairs support and direct chip supply relationships. Phase 2: Phase 2 (4 to 14 months): Complete line-by-line implementation, prioritizing production lines serving the nearest compliance deadlines first and most rigorously. Phase 3: Phase 3 (14 to 24 months): Extend serialization capability across remaining production lines ahead of subsequent market deadlines and audits.
OUTCOME
The client met its compressed compliance deadline across all priority production lines, avoiding the implementation risk MMA had flagged with the lowest-bid supplier. The client reported the phased approach kept total implementation cost within budget while preserving export market access worth an estimated USD 40 million annually (client-reported, unverified by MMA).

Frequently Asked Questions

Foundational context covering the market sizes, CAGR, scope, country, region and competition that inform every finding below. This section is provided to cover basics and most often pre-purchase conversations, answered from the MMA Primary Research Dataset.

What is the current size of the Active Smart and Intelligent Packaging Market?

The market stood at USD 24.5 billion in 2025, based on MMA Primary Research Dataset findings. Pharmaceutical serialization compliance increasingly drives growth alongside food safety demand.

How large will the Active Smart and Intelligent Packaging Market be by 2036?

MMA projects the market will reach USD 64.52 billion by 2036 under the base case scenario, representing roughly 2.41 times the 2026 opening value across the eleven-year forecast period.

What is the CAGR for the Active Smart and Intelligent Packaging Market 2026 to 2036?

The base case CAGR is 9.2% annually. MMA's bull scenario reaches 10.5% while the bear scenario, reflecting integration cost barriers, runs closer to 7.9% over the forecast period.

Which segment is growing fastest?

RFID and NFC smart tags lead at 13.8% CAGR, exactly 1.50 times the overall market rate, as pharmaceutical serialization and e-commerce authentication programs both converge on embedded traceability.

Who are the major companies in the Active Smart and Intelligent Packaging Market?

Sealed Air, Amcor, Avery Dennison, Multisorb Technologies, and CCL Industries lead the market, together controlling an estimated 38% of global revenue on a consistent basis.

Which country is growing fastest?

India posts the fastest national growth at 15.8% CAGR, driven by its compressed national pharmaceutical serialization compliance timeline and rapidly expanding pharmaceutical export sector volume.

Report Segmentation Architecture

The full report scope spans multiple orthogonal segmentation dimensions, with cross-tabulated demand data provided for each dimension pair. Coverage extends further to regional breakdowns, trend trajectories, and the competitive detail needed to support segment-level decision-making.

By Technology Type

  • Oxygen Scavenger and Absorber Systems
  • Antimicrobial and Antioxidant Active Packaging
  • Time-Temperature and Freshness Indicators
  • RFID and NFC Smart Tags
  • Moisture and Humidity Control Systems
  • Gas Sensor and Leak Detection Indicators

By End-Use Industry

  • Pharmaceutical and Healthcare Packaging
  • Food and Beverage Packaging
  • Luxury Goods and Electronics Authentication
  • E-Commerce and Retail Traceability
  • Cold Chain and Logistics Monitoring

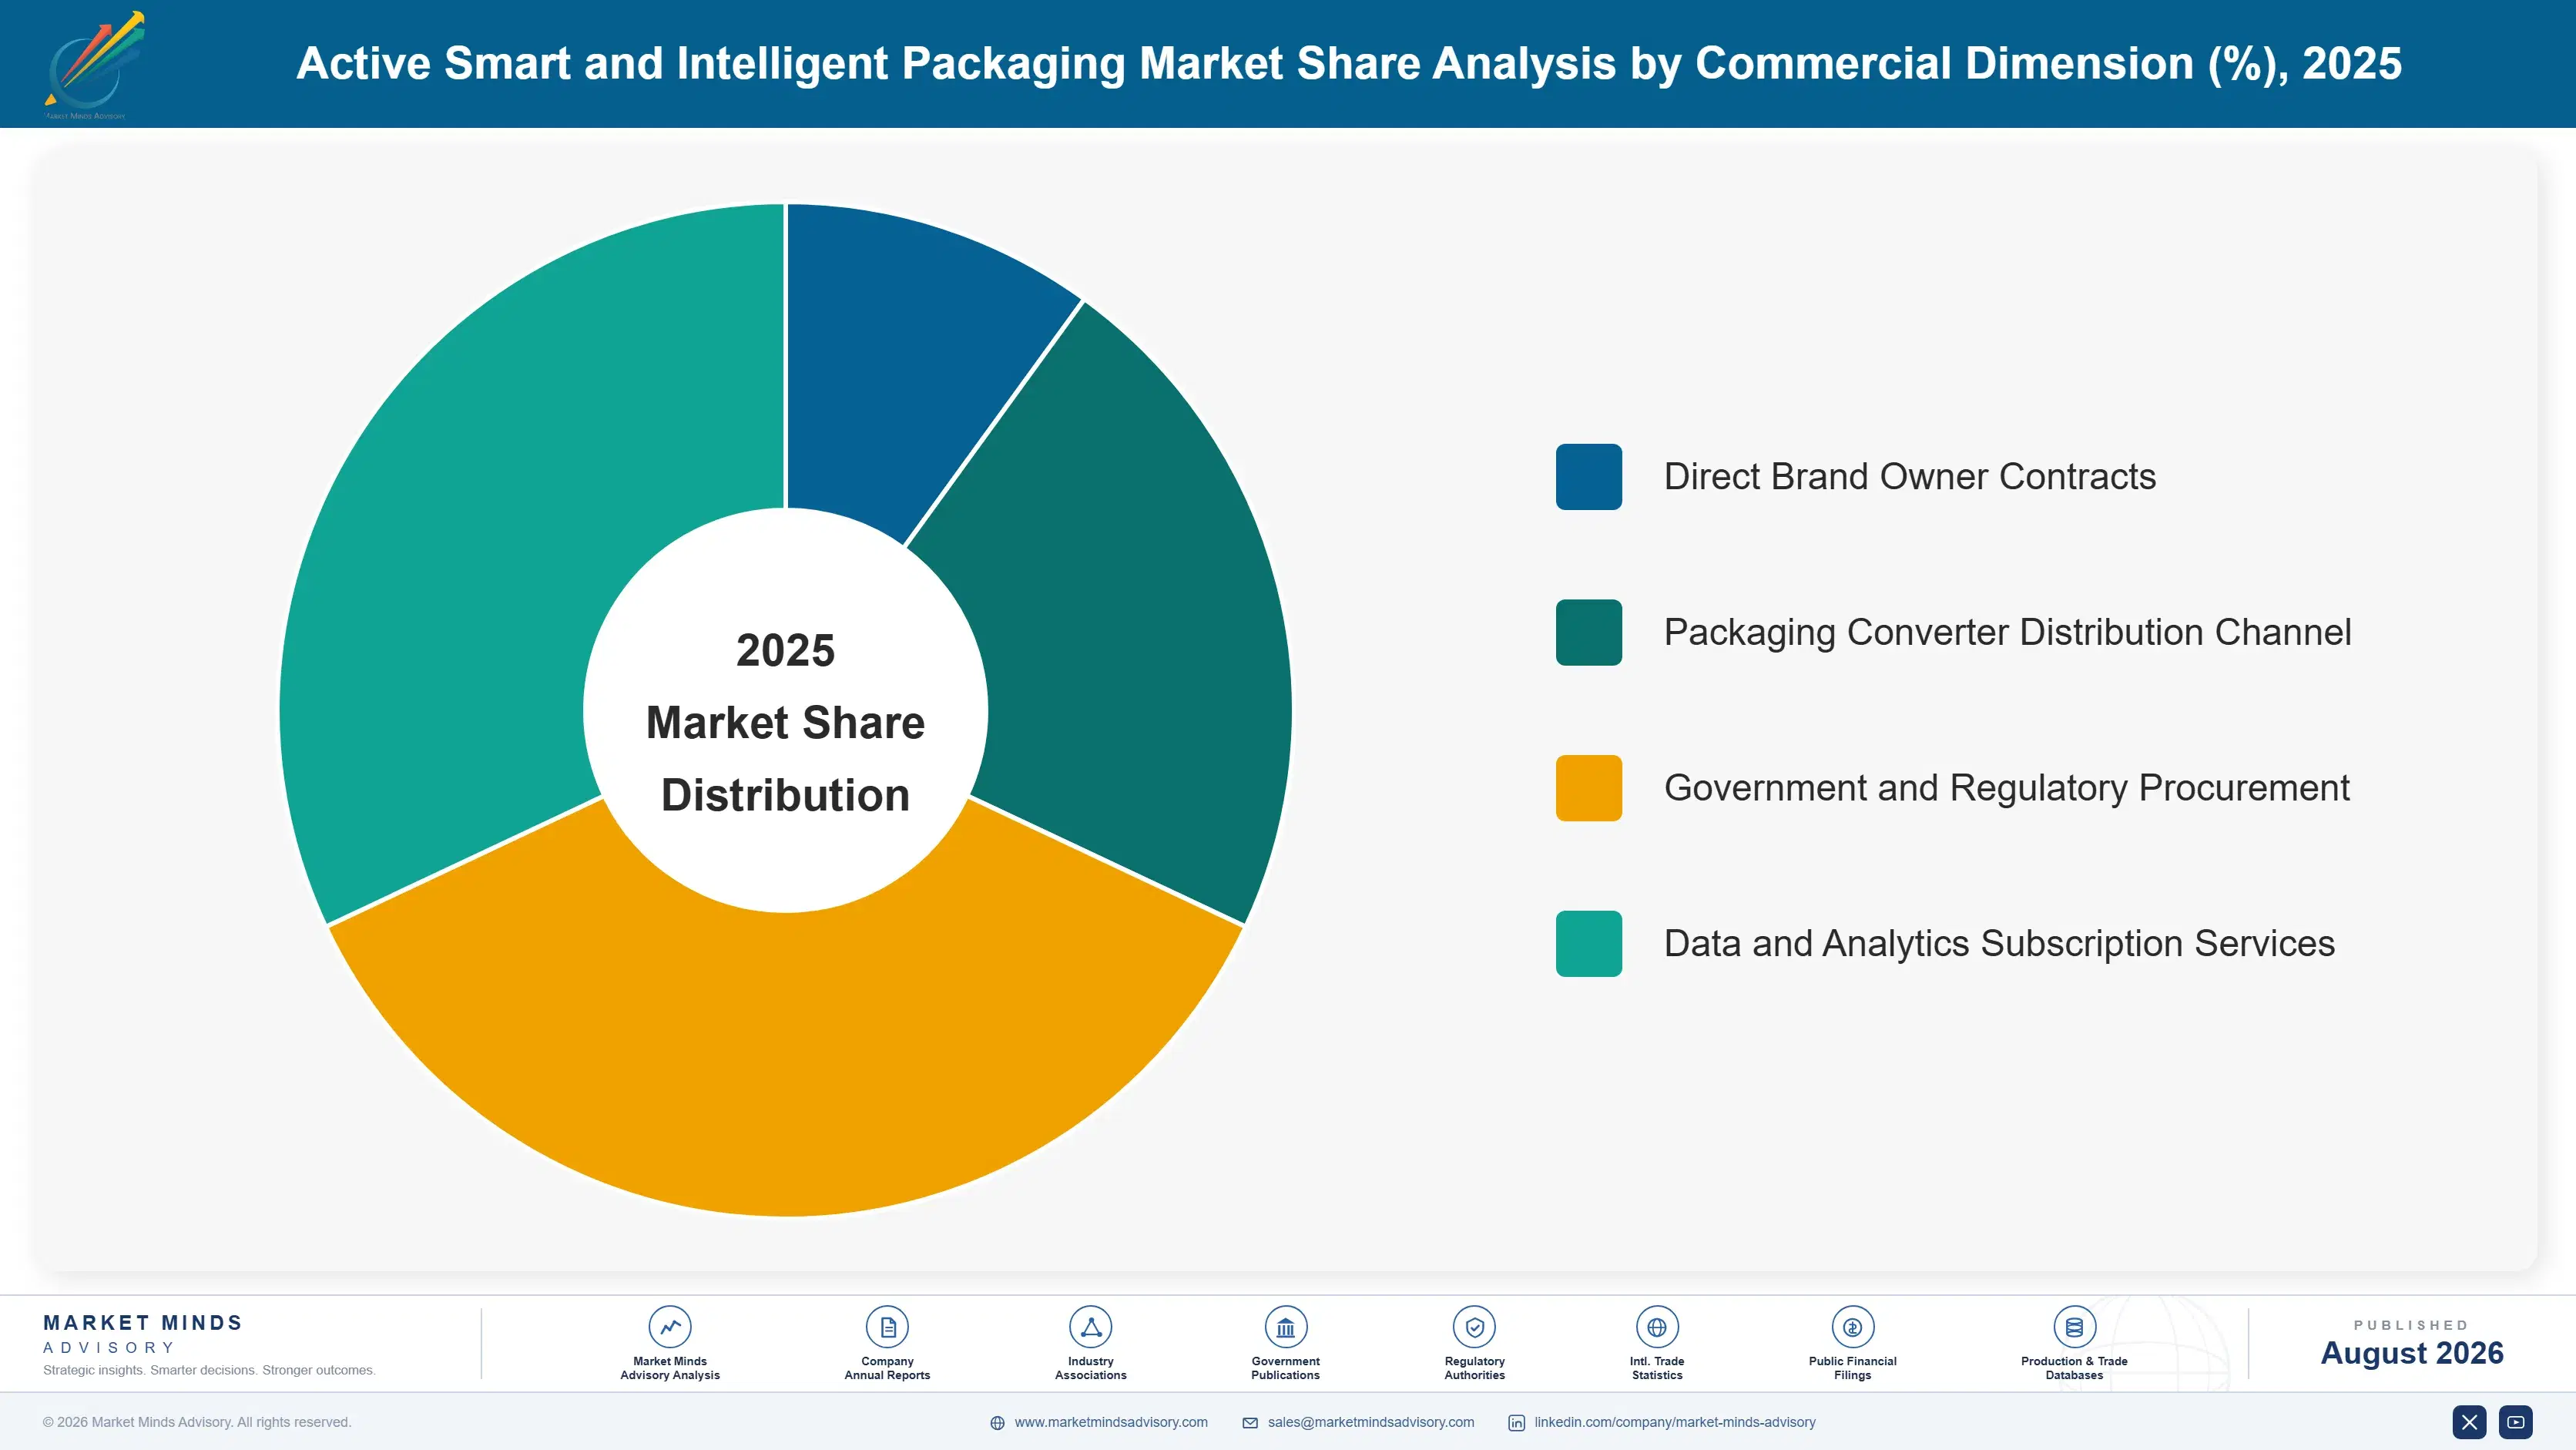
By Commercial Dimension

  • Direct Brand Owner Contracts
  • Packaging Converter Distribution Channel
  • Government and Regulatory Procurement
  • Data and Analytics Subscription Services

By Region

  • North America
  • Western Europe
  • East Asia
  • South Asia and Pacific
  • Latin America
  • Middle East and Africa
  • Eastern Europe

Scope, Methodology, and Coverage

Every figure in this report is reproducible from documented input assumptions. The scope below maps the historical period, the forecast horizon, the segmentation dimensions, and the countries covered, alongside the underlying primary and qualitative methodology.
Historical Period
2020 to 2025
Forecast Period
2026 to 2036
Base Year
2025 (USD billions; MMA Primary Research Dataset, August 2026)
Market Definition
The active and intelligent packaging market covers packaging technologies that interact with or monitor packaged products, including oxygen scavengers, antimicrobial films, moisture absorbers, time-temperature indicators, and RFID or NFC smart tags. It excludes conventional passive barrier packaging, standalone IoT logistics tracking devices not integrated into the package itself, and unrelated printed packaging graphics.
Quantitative Units
USD billions (current prices); unit shipment volume in billions of tags and labels where applicable
Segmentation Dimensions
By Technology Type; By End-Use Industry; By Commercial Dimension; By Region
Regions Covered
North America, Western Europe, East Asia, South Asia and Pacific, Latin America, Middle East and Africa, Eastern Europe
Countries Covered
USA, China, Germany, France, UK, Japan, South Korea, India, Australia, Canada, Brazil, Mexico, Indonesia, Vietnam, Thailand, Malaysia, UAE, Saudi Arabia, South Africa, Nigeria, Turkey, Poland, Netherlands, Italy, Spain, Sweden, Switzerland, Argentina, Colombia, Singapore, and additional markets relevant to this sector
Key Companies Profiled
Sealed Air Corporation, Amcor plc, Avery Dennison Corporation, Multisorb Technologies LLC, CCL Industries Inc., Mitsubishi Gas Chemical Company, Inc., Sonoco Products Company, Impinj, Inc., Zebra Technologies Corporation, Thin Film Electronics ASA, Timestrip UK Ltd., Vitsab International AB, BASF SE, Tetra Pak International S.A., DuPont de Nemours, Inc., 3M Company, Cryolog SAS, Freshpoint Quality Assurance Ltd., Honeywell International Inc., Toppan Inc.
Quantitative Methodology
Primary survey, n=3,800 respondents, Q4 2025, six countries; demand-side model with trade association cross-validation
Qualitative Methodology
47 expert interviews, Q4 2025; applied to validate demand model assumptions, identify emerging dynamics, and assess competitive positioning
Report Format
PDF and XLSX data workbook (Word format preview document)
Publisher
Market Minds Advisory
Report Code
MMA-2026-PAC-134
Published
August 2026
Contact
sales@marketmindsadvisory.com | www.marketmindsadvisory.com

Purchase the full Active Smart and Intelligent Packaging Market Report (2026 to 2036).

The full MMA Active Smart and Intelligent Packaging report sizes the market across six technology categories, five end-use verticals, four commercial channels, and seven regions through 2036. It profiles 20 participants on a consistent revenue basis, scoring the top five on regulatory compliance breadth, chip supply security, and data services capability. Scenario models quantify how pharmaceutical serialization mandates, e-commerce authentication demand, and semiconductor supply constraints move both demand and realizable pricing. The report also includes delivered-cost modelling by technology category, a regional serialization and compliance policy tracker, and a competitive benchmarking tool built for supplier strategy, brand owner procurement, and investor due diligence teams.
Six-category technology segmentation with regional cross-tabulation
Serialization and compliance policy tracker across twelve major markets
Competitive benchmarking on consistent revenue basis
Delivered-cost modelling by technology category and region
Scenario models for regulatory mandates and chip supply
Semiconductor supply resilience analysis by supplier footprint

Built For The People Who Decide

From boardroom strategy to bench-side execution, this report is read cover-to-cover by leaders shaping the next decade of their industry, turning demand scenarios, market dynamics and valuation benchmarks into decisions.
CXOs/ Presidents/ VPs/ Managers
M&A and Corporate Development
Strategy Teams and R&D Heads
Procurement and Product Directors
Regulatory and Compliance Leaders
Investor Relations and Equity Analysts