Market Minds Advisory
Active Pharmaceutical Ingredients Market

Active Pharmaceutical Ingredients Market: Regulatory Filings Decide Who Supplies, Not Chemistry

A commercial reading of drug substance manufacturing, where a filed and inspected site holds volume that better chemistry cannot take, and one inspection finding can remove a qualified supplier from the market overnight.

Lead Analyst

Alice Ballenger

Published

September 2026

Make Smarter Decisions with Customized Research Insights

Request a free sample report and evaluate market opportunities, growth trends, and competitive dynamics relevant to your business needs.

2025 MARKET VALUE$231.7BMarket Size 2025
2036 FORECAST VALUE$458.4BBase Case , 2026 to 2036
CAGR 2026 TO 20366.4 %Bull 7.6% / Bear 5.2%
INCREMENTAL OPPORTUNITY$211.9BNet 10- year value creation
EXPANSION MULTIPLE1.86x2036 value over 2026 base
Strategic Levers
M&A Pipeline
Regional Outlook
Country Rankings
Competitive Intelligence
Segmental Deep-dive
Call-Us : 91 93563 13602

Executive Snapshot and Market Trajectory

Chemistry is rarely what decides an API contract. A filed site named in a marketing authorisation holds that volume until somebody funds a variation, revalidates the process, and accepts the regulatory risk of doing so. Cheaper synthesis does not change that.
The market stands at USD 231.7 billion in 2025 and reaches USD 458.44 billion by 2036 at a 6.4% CAGR. Biologic drug substances grow fastest at 10.8%, about 1.69 times the overall rate, as monoclonal antibodies and newer modalities take a widening share of approvals. East Asia holds 28% of value on Chinese and Indian intermediate and finished API capacity, while India posts the quickest national growth at 9.8%.
Fragmentation is extreme, with the top five holding roughly 19% of drug substance revenue across captive manufacturing and contract supply that answer to quite different economics. Two forces pull against each other. Regulatory filing lock-in keeps established sites supplying products for a decade or more, while supply security policy in the United States and Europe is funding reshoring of molecules that Asian producers currently make far more cheaply. Both arguments reach the same quality committee.
Market Definition
The active pharmaceutical ingredients market covers the manufacture and sale of drug substances used as the therapeutically active component of finished medicines, spanning small molecule synthetic actives, biologic drug substances, high-potency actives, peptides and oligonucleotides, and fermentation-derived actives. Finished dosage form manufacturing, excipients and formulation aids, key starting materials and regulatory intermediates sold below drug substance specification, diagnostic reagents, and veterinary-only actives are excluded.
Base Year Value
$231.7B in 2025 (MMA Primary Research Dataset, August 2026)
Forecast Period
2026 to 2036, eleven discrete annual values
CAGR
6.4% base case. Bull 7.6%. Bear 5.2%.
Fastest Growth Segment
Biologic Drug Substances: 10.8% CAGR
Fastest Growth Country
India: 9.8% CAGR
Fastest Growth Region
South Asia and Pacific: 8.6% CAGR
Largest Region
East Asia: 28% of 2025 global value
Market Leaders
Lonza, Samsung Biologics, Divi's Laboratories, Teva API, Catalent. Source: MMA Analysis based on company annual reports.
Primary Survey
n=3,800 procurement and R&D decision-makers, Q4 2025, six countries
Methodology
Demand-side build-up, cross-validated against public data, 47 expert interviews

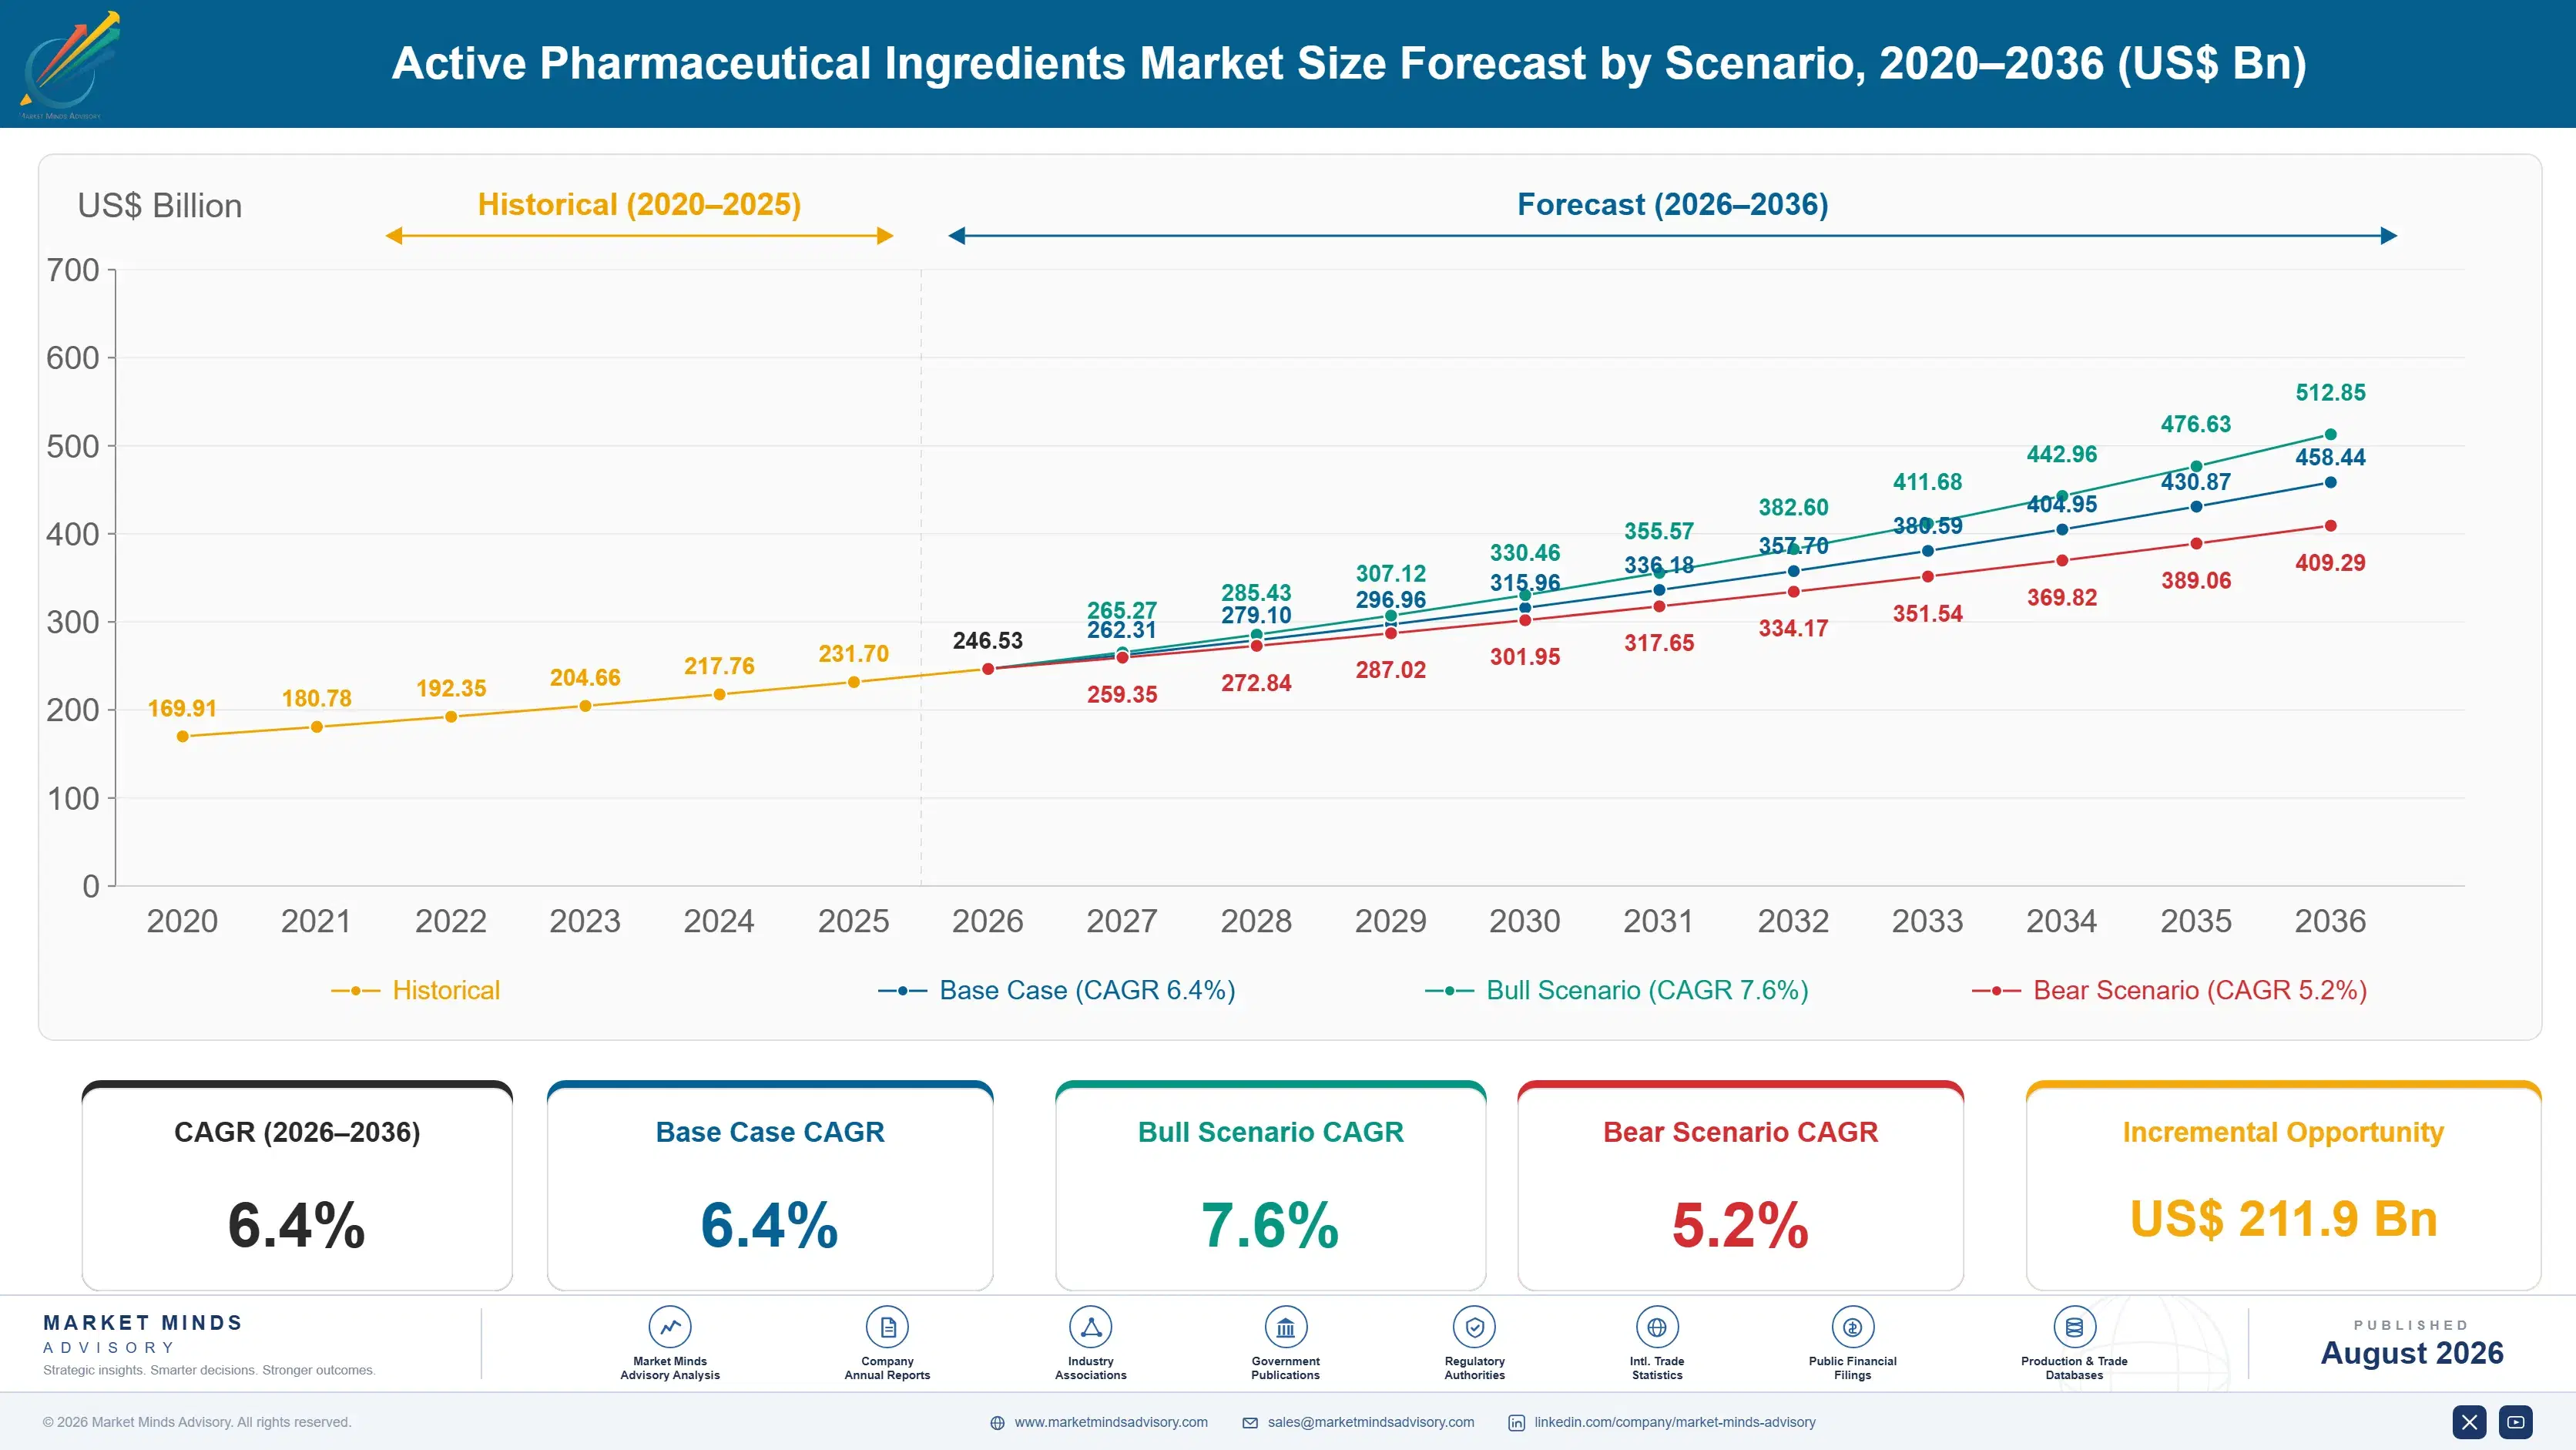
Active Pharmaceutical Ingredients Market Forecast Scenarios

active-pharmaceutical-ingredients-market-size-forecast-scenario-1787324444022
Growth from 2020 to 2025 compounded near 5.3%, and supply disruption rather than demand shaped the period. Export restrictions and freight failures through 2020 and 2021 exposed how much intermediate supply sat in a handful of Chinese provinces, and every major buyer started a dual-sourcing programme. Very few finished them. Biologic drug substance capacity meanwhile expanded faster than any other part of the market.
Three mechanisms carry the base case to 6.4%. First, biologics mix, as monoclonal antibodies, conjugates, and newer modalities take a widening share of approvals and command drug substance economics small molecules never did. Second, patent expiry volume, which moves molecules into generic manufacture at high tonnage and thin margin. Third, supply security policy, where reshoring incentives in the United States and Europe are funding capacity that pure cost comparison would never have built.
The bull case at 7.6% assumes reshoring incentives convert into committed capacity and biologic approvals arrive on schedule. The bear case at 5.2% assumes generic price erosion accelerates on small molecule actives, Chinese and Indian producers hold cost positions that reshored capacity cannot approach, and buyers quietly abandon dual-sourcing programmes once the immediate disruption memory fades, which is what happened after previous shortages.

The Filed Site Is The Commercial Position

Demand rests on three foundations. Prescription volume provides the base, since drug substance consumption tracks dispensed medicine tonnage almost mechanically. Approval mix provides the value growth, as biologics and high-potency actives command economics that commodity synthetic actives lost long ago. And regulatory filing provides the defensibility, because a site named in a marketing authorisation keeps that volume until the buyer funds a variation and accepts the risk attached.
MARKET CONCENTRATIONCR5: 19%Among the most fragmented supply bases in pharmaceutical manufacturing
FILING VARIATION TIMELINE12 to 30 monthsRegulatory work behind naming an alternative manufacturing site
CONTRACT MANUFACTURING SHAREAbout 41%Drug substance volume outsourced rather than made captively
SUBSTANCE COST SHARE8% to 35%Drug substance as a portion of finished medicine cost
CAPACITY UTILISATIONAbout 79%Running rate across qualified drug substance manufacturing assets
INSPECTION CYCLE LENGTH2 to 4 yearsTypical interval between regulatory inspections of a site
Commercially, the striking feature is how little the substance costs relative to the medicine. Drug substance runs 8% to 35% of finished medicine cost depending on molecule and modality, so a buyer negotiating hard on price is often arguing about a small fraction of the product's economics while carrying enormous exposure to a supply failure. That asymmetry explains why quality record and inspection history usually beat price.
The decade ahead turns on where capacity physically sits. Chinese and Indian producers hold cost positions that Western manufacturers cannot match on established synthetic actives, and reshoring incentives are attempting to change that with public money rather than commercial logic. Biologic drug substance capacity is being built at scale in Korea, Ireland, and the United States. Contract manufacturing already handles about 41% of volume.
"Buyers say they want dual sourcing and then decline to pay for the second filing. That gap between stated intent and funded intent is the single most reliable thing in this industry, and it is why the incumbent site usually still holds the volume five years after the shortage that supposedly changed everything."
Director, Pharmaceutical Manufacturing and Fine Chemicals Practice · MMA Chemica

Market Trends

Biologic Drug Substances Take Approval Share Steadily

Biologic drug substances grow at 10.8% against a market at 6.4%, and approval mix rather than pricing explains it. Monoclonal antibodies, antibody drug conjugates, cell and gene therapy substances, and newer modalities now account for a substantial share of new approvals, and each requires mammalian cell culture or specialist capability that synthetic chemical plants cannot provide at all. Capacity is the practical constraint, since a large-scale biologics facility takes four to six years to build, qualify, and inspect. Korean, Irish, and American capacity has expanded hardest. Titre gains have partly offset the constraint.
Market Impact: Variations take 12 to 30 months
Supply Security Policy Funds Capacity Cost Cannot Justify

Both the United States and the European Union have introduced measures aimed at reducing dependence on Asian drug substance supply, from critical medicines lists to manufacturing incentives and procurement preferences. The commercial reality is uncomfortable: reshored capacity for established synthetic actives cannot match Chinese or Indian cost, so the volume only moves where policy pays the difference or a buyer accepts a higher price for security. Several announced projects have quietly stalled once incentive terms were finalised. Antibiotics and sterile injectables have attracted most of the committed support so far.
Market Impact: Generic entry cuts price 80%

Market Opportunities and Growth Drivers

Filed Sites Hold Volume For A Decade

A manufacturing site named in a marketing authorisation supplies that product until somebody funds a variation, and the variation takes 12 to 30 months of regulatory work, comparability data, and process validation before a single kilogram ships. Quality organisations carry the liability for that decision, which makes them consistently reluctant to initiate it. The result is drug substance revenue that behaves more like an annuity than a chemical contract, and it explains why incumbents survive cost disadvantages that would be fatal anywhere else in chemicals. Cost disadvantage alone rarely dislodges an incumbent.
Market Impact: Alerts stop shipment within 1 day

Patent Expiries Move Volume Into Generic Manufacture

Every major patent expiry converts a molecule from protected supply at protected pricing into generic manufacture at high tonnage and thin margin, and the tonnage usually rises because generic entry expands prescribing. Indian and Chinese producers capture most of that volume because their cost position on established synthetic routes is genuinely difficult to match. For the innovator's original supplier the transition is brutal, since the same plant now competes against a dozen filings on price alone. Volume grows while value per kilogram collapses. The original supplier usually loses the molecule entirely.
Market Impact: Pricing falls 6% to 12% yearly

Market Restraints and Challenges

Inspection Findings Can Remove A Supplier Overnight

A regulatory inspection finding at a drug substance site can trigger import alerts, warning letters, or consent decrees that stop shipment immediately, regardless of whether the product itself was affected. The root cause is that data integrity and process control failures undermine confidence in every batch from that facility, not just the ones examined. Commercially this makes quality record the first screen in any sourcing decision. Participants mitigate through independent data integrity audits, multi-site filings for critical products, remediation investment ahead of inspection cycles, and buyer-funded second sources on the highest-risk molecules.
Market Impact: Biologics grow at 10.8% annually

Generic Price Erosion Removes Margin From Established Actives

Once a molecule is off patent and several producers hold filings, drug substance pricing falls year after year with no mechanism to recover it. The root cause is that buyers treat an established active as a specification to be met at lowest cost, and a dozen approved sites make that comparison easy. Commercially this leaves capital-intensive plants running commodity economics. Producers mitigate by moving mix toward high-potency and biologic substances, integrating backward into key starting materials, exiting molecules that no longer cover fixed cost, and taking contract development work that carries different pricing.
Market Impact: Lists cover 300 critical molecules
4 additional market trends, 3 additional growth drivers, and 2 additional restraints and challenges are covered in the full report. Contact sales@marketmindsadvisory.com to access the complete intelligence.

Segment CAGR and Growth Architecture

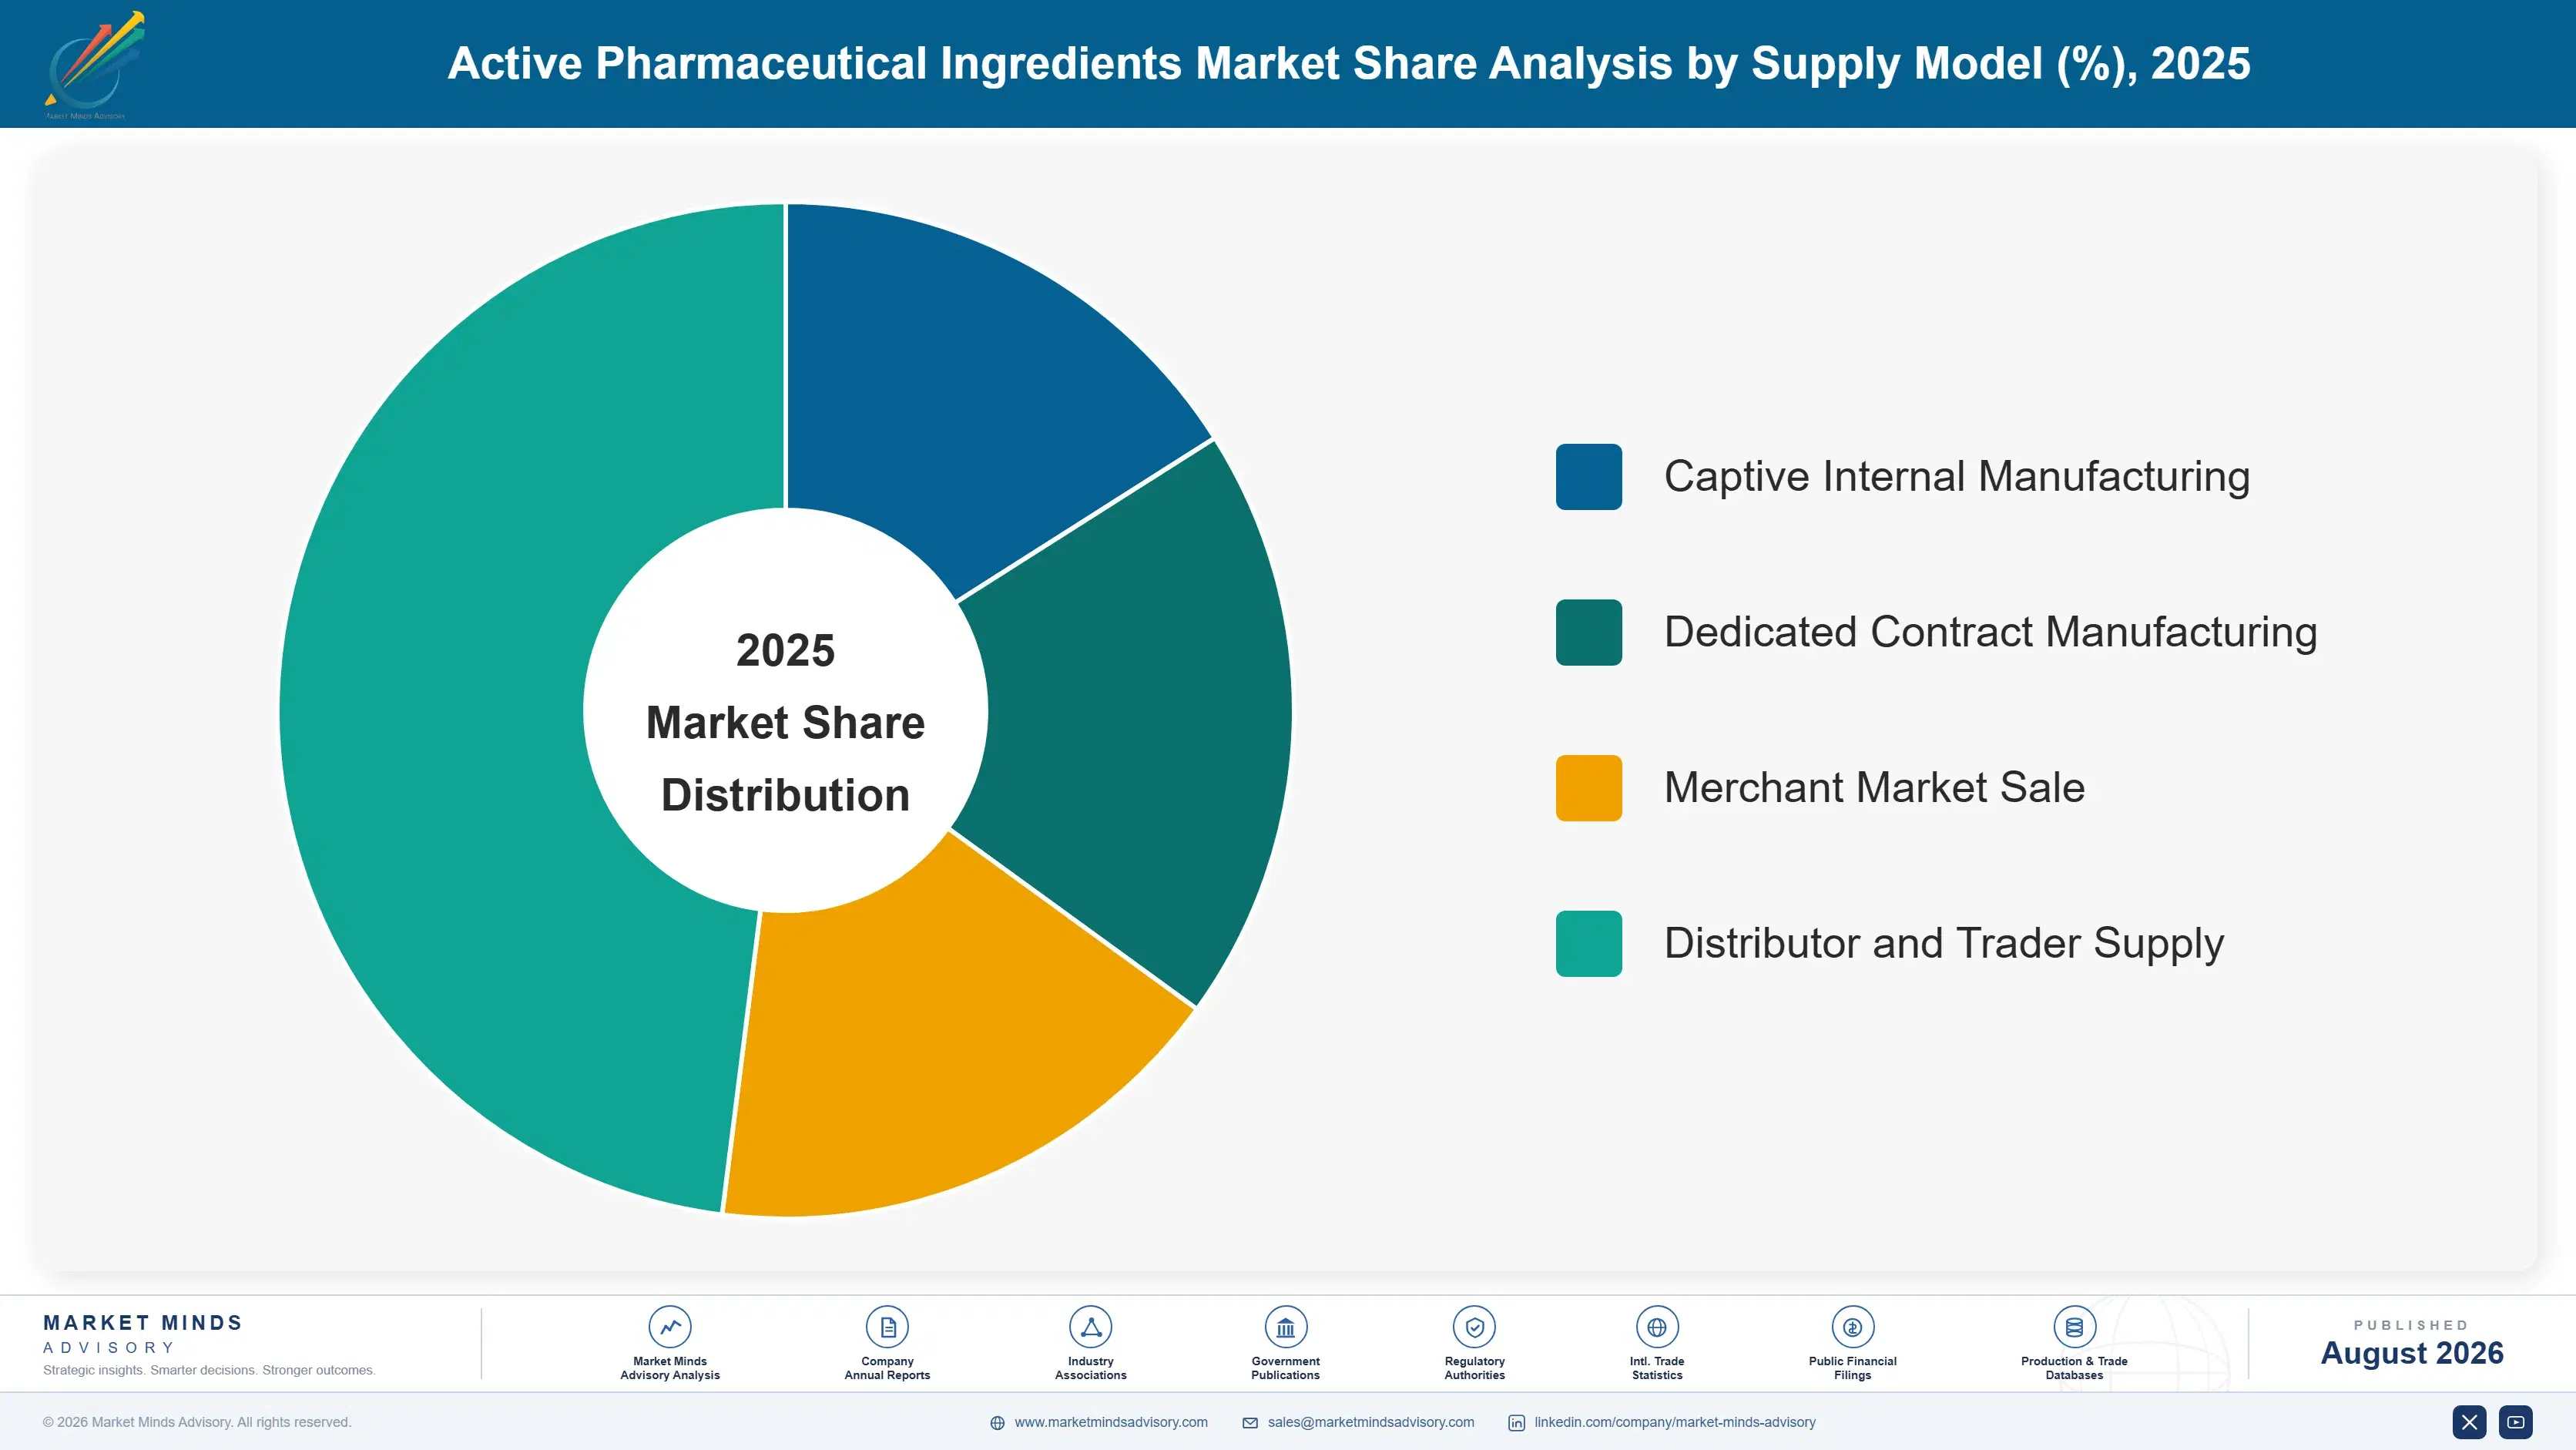
Segmentation follows drug substance class, a single classification describing the molecular nature of the active being manufactured. Each class carries its own production platform, containment requirement, regulatory pathway, and cost structure, so commercial economics track the class rather than the therapy area it serves. End-use industry and supply model appear separately within the framework as their own distinct dimensions.
active-pharmaceutical-ingredients-market-market-share-analysis-1787324444583

Biologic Drug Substances

Biologic drug substances grow fastest at 10.8%, about 1.69 times the overall 6.4% rate, and approval mix rather than pricing drives almost all of it. Monoclonal antibodies, antibody drug conjugates, fusion proteins, and cell and gene therapy substances all require mammalian or microbial cell culture, downstream purification, and containment that synthetic chemical plants cannot provide at any price. Capacity is the binding constraint: a large-scale facility takes four to six years to build, qualify, and pass inspection, so supply decisions precede demand by half a decade. Titre improvements have partly offset that by raising output from existing bioreactors considerably. Korean and Irish capacity dominates recent additions. Pricing follows available bioreactor volume closely.
CAGR 10.8%

Peptides and Oligonucleotides

Peptides and oligonucleotides grow at 9.2%, the second-fastest class, and metabolic and rare disease pipelines explain most of it. Incretin analogues alone have created drug substance demand at a scale nobody planned capacity for, and solid phase synthesis at that tonnage is a genuinely different manufacturing problem from making kilograms for a trial. Oligonucleotide actives follow similar chemistry with their own purification difficulty and reagent supply constraints. Qualified capacity remains tight and lead times long, which has kept pricing considerably firmer than small molecule equivalents. Several producers are converting synthetic capacity toward this class rather than building new plants. Reagent and resin supply is the other quiet constraint on this class.
CAGR 9.2%
Full segment breakdown across 5 segments available in the complete report.

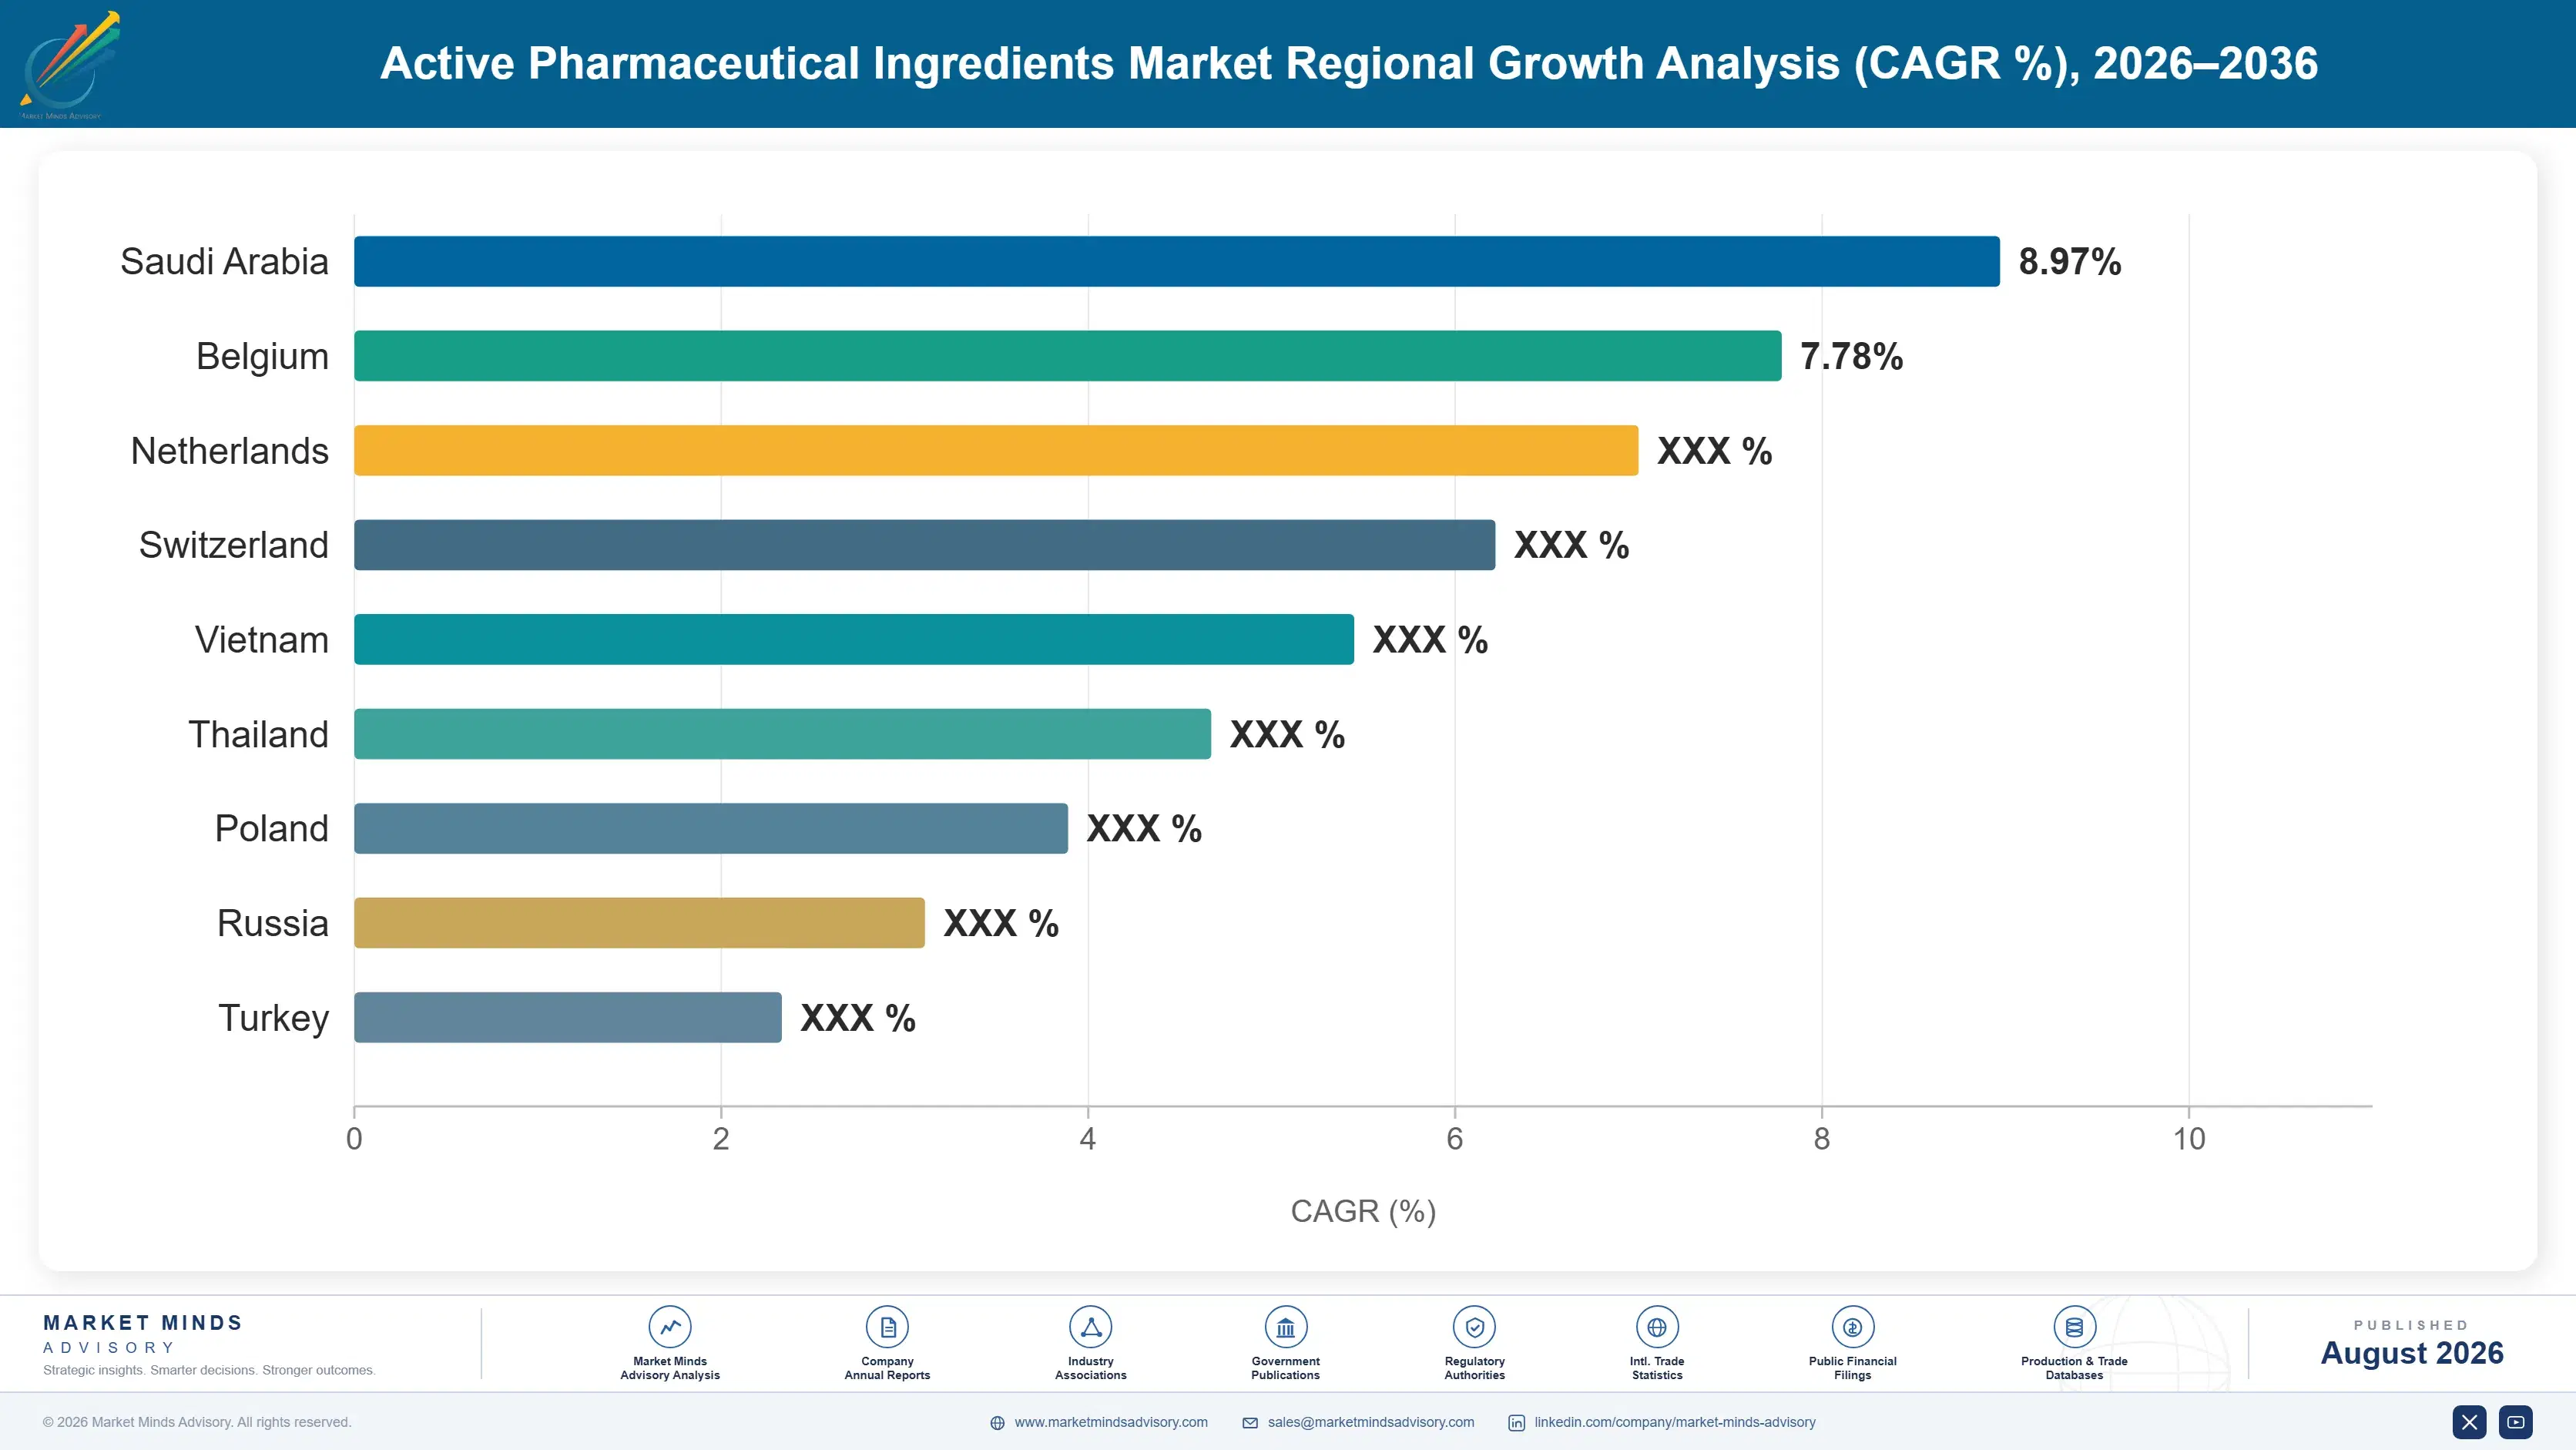
Regional Architecture and Country Demand Map

Manufacturing cost and regulatory filing history together set this distribution rather than consumption does. East Asia leads on Chinese and Indian synthetic capacity, while South Asia and Pacific grows quickest as Indian producers move up from intermediates into finished drug substance supply. Filing history matters more than proximity.

North America

North America holds 24% of value, weighted heavily toward biologic drug substance and high-potency manufacturing rather than commodity synthetic actives that left decades ago. Federal supply security measures, critical medicines designation, and procurement preference have all attempted to bring established molecules back, with genuine commitments concentrated in antibiotics and sterile injectables where shortage consequences are most visible. Contract development and manufacturing capacity has expanded substantially around Boston, North Carolina, and Indiana. Inspection intensity is the highest anywhere, which raises operating cost and also protects incumbents whose records are clean. Growth of 6.0% reflects biologics strength against continued erosion in established synthetic actives. Commodity synthetic actives are unlikely to return at any realistic price.
Share: 24% | CAGR: 6.0% (2026 to 2036)

Western Europe

Cost position rather than capability constrains this market. Western Europe holds 23% of value, with Swiss, Irish, German, and Italian producers holding strong positions in biologics, high-potency actives, and complex synthesis while having largely conceded commodity actives to Asian competition. Energy costs since 2022 have widened that gap considerably on energy-intensive synthesis and fermentation. The critical medicines initiative and related measures aim to rebuild supply for essential molecules, though funding has lagged ambition. Irish biologics capacity continues expanding on multinational investment. Growth of 4.9% is the slowest of the seven regions, reflecting a mature base under persistent cost pressure. Nearshoring interest has grown considerably faster than committed funding has followed it.
Share: 23% | CAGR: 4.9% (2026 to 2036)
Regional intelligence for 5 additional markets available in the complete report: East Asia, South Asia and Pacific, Latin America, Middle East and Africa, Eastern Europe. Contact sales@marketmindsadvisory.com.
active-pharmaceutical-ingredients-market-country-cagr-analysis-1787324445100

Where Drug Substance Margin Is Defended

Competing on cost per kilogram against an integrated Chinese producer is a losing position and always was. The four moves below shift earnings toward ground that cost cannot reach: getting named in the original filing, moving mix into containment and biologics, integrating backward into starting materials, and selling inspection record as the product it actually is.

Get Named In The Original Marketing Authorisation

A site written into the first filing supplies that product until somebody funds a variation costing 12 to 30 months of regulatory work and comparability data, which quality organisations initiate reluctantly because they own the risk. Winning development-stage supply therefore secures commercial volume years before the product exists. Development batches are small, technically demanding, and unattractive on their own margin, which is exactly why competitors decline them. That is the wrong comparison, since the development kilogram decides the commercial tonne behind it. Development supply is the only genuine entry point that exists.
Market Impact: Each variation costs 12 to 30 month

Move Mix Into Containment And Biologics

High-potency actives and biologic substances require containment, cell culture, and purification capability that a dozen commodity producers cannot replicate, and pricing reflects that scarcity rather than a cost-plus calculation. Established synthetic actives lose 6% to 12% of price a year with no recovery mechanism, so holding mix constant is a slow decline dressed as stability. Conversion is capital-intensive and takes years to qualify, which is precisely why the position holds once built. Producers who waited for volume commitments before investing are now bidding for capacity. Qualified capacity in these classes now trades at a premium.
Market Impact: Established actives lose 6% to 12%

Integrate Backward Into Key Starting Materials

Most Western drug substance producers buy intermediates and key starting materials from the same Chinese suppliers their competitors use, which caps both cost position and supply security no matter what the final step costs. Backward integration converts a purchased input into an internal one and removes the single point of failure that buyers increasingly ask about during qualification. Indian producers have moved this way deliberately with government incentive support. The capital requirement is substantial and only justified on molecules with genuine long-term volume behind them. Roughly 40% of synthetic cost sits in those purchased inputs.
Market Impact: Backward integration removes 1 majo

Sell The Inspection Record As The Product

An import alert or warning letter stops shipment within a day and can remove a supplier from a market for years, which makes inspection history the first screen in any serious sourcing decision rather than a compliance footnote. Producers with clean records across multiple regulatory authorities should price that explicitly and document it in every tender, because buyers are paying for it whether or not anybody says so. Remediation spending ahead of a 2 to 4 year inspection cycle is commercial investment, not overhead. Buyers screen on it before they screen on price.
Market Impact: Inspection cycles come every 2 to 4

Who Controls the Margin Pool

Fragmentation is extreme: the top five hold roughly 19% of drug substance revenue, across captive manufacturers, dedicated contract producers, and generic companies selling surplus capacity. The gap between leaders and challengers is regulatory filing position and inspection record rather than synthetic capability, which is widely held. All participants here are assessed on one basis, revenue from drug substance manufacture and supply, excluding finished dosage form work, excipients, and interme
Competition runs along four dimensions. First, filed position on marketed products, since a named site holds volume for years. Second, inspection record across regulatory authorities, which decides whether a producer is considered at all. Third, platform capability in biologics, containment, and peptide synthesis, where scarcity supports pricing. Fourth, backward integration into starting materials, which sets both cost floor and supply security.

Pressure is building from two directions. Indian producers are moving up from intermediate supply into their own drug substance filings and selling directly into regulated markets. Supply security policy is meanwhile funding Western capacity that commercial logic alone would not build. Rankings should favour producers with biologics and containment capability and clean multi-authority inspection records over those defending commodity synthetic positions on cost.
active-pharmaceutical-ingredients-market-company-positioning-matrix-1787324445630

Competitive Moat and Risk Dimensions

LONZA

Moat: Biologics platform breadth and scale

Lonza operates one of the broadest drug substance platforms in contract manufacturing, spanning mammalian and microbial biologics, high-potency small molecules, and specialist modalities that few competitors cover together. Customers filing a development molecule with it frequently keep that site through commercial launch. Its inspection record across major authorities supports the premium that platform breadth alone would not justify.
LONZA

Risk: Capital intensity and customer concentration

Large-scale biologics capacity requires capital committed four to six years before revenue arrives, and utilisation gaps are expensive when a customer programme fails in clinical development. Several large customers account for a meaningful share of loading, which concentrates that exposure. Korean contract manufacturers competing on scale and cost have also compressed pricing on standard antibody work considerably.
SAMSUNG BIOLOGICS

Moat: Bioreactor scale and delivery record

Samsung Biologics holds among the largest single-site mammalian bioreactor capacity in the industry, which matters for commercial antibody supply where volume and reliability outrank technical novelty. Its build and qualification record is unusually fast for this industry, letting it commit capacity to customer timelines competitors cannot promise. Clean inspection outcomes across major authorities underpin the whole proposition.
SAMSUNG BIOLOGICS

Risk: Modality concentration and single geography

Revenue leans heavily on mammalian antibody manufacture, where capacity additions across the industry are now substantial and pricing has softened. Newer modalities including cell and gene therapy substances require capability the company is still building against established specialists. Concentrating capacity in one country also sits awkwardly with the supply security policies Western buyers are increasingly asked to satisfy.

Players Tracked

Prominent Players

Lonza
Samsung Biologics
Divi's Laboratories
Teva API
Catalent

Other Key Players

WuXi AppTec
Boehringer Ingelheim BioXcellence
Fujifilm Diosynth Biotechnologies
Siegfried
Cambrex
Aurobindo Pharma
Dr Reddy's Laboratories
Sun Pharmaceutical Industries
Piramal Pharma Solutions
Asymchem
Zhejiang Huahai Pharmaceutical
Bachem
PolyPeptide Group
Recipharm
Hovione

Recent Developments

APRIL 2025

European critical medicines measures advance toward implementation

European proposals on critical medicines supply moved further through the legislative process, adding procurement preference and manufacturing support mechanisms aimed at drug substance made within the region. This was European policy development rather than a commercial transaction, and it kept reshoring economics under discussion without settling who pays the difference.
Signal: Policy can name a critical molecule easily
NOVEMBER 2024

Peptide drug substance capacity expansions announced across suppliers

Several producers committed to expanding solid phase peptide synthesis capacity as incretin analogue demand outpaced qualified supply by a wide margin. These were organic capacity expansions rather than acquisitions or joint ventures, and they reflect qualified capacity rather than chemistry being the constraint on this class of actives.
Signal: Capacity committed years ahead of firm ord
JULY 2024

Inspection findings disrupt supply at major drug substance sites

Regulatory findings at several drug substance facilities triggered import restrictions and customer requalification programmes, removing supply from markets while remediation proceeded. These were regulatory enforcement actions rather than corporate events, and they demonstrated again how quickly a filed position can become worthless. Requalification programmes ran for months afterwards.
Signal: One finding removes a supplier faster than

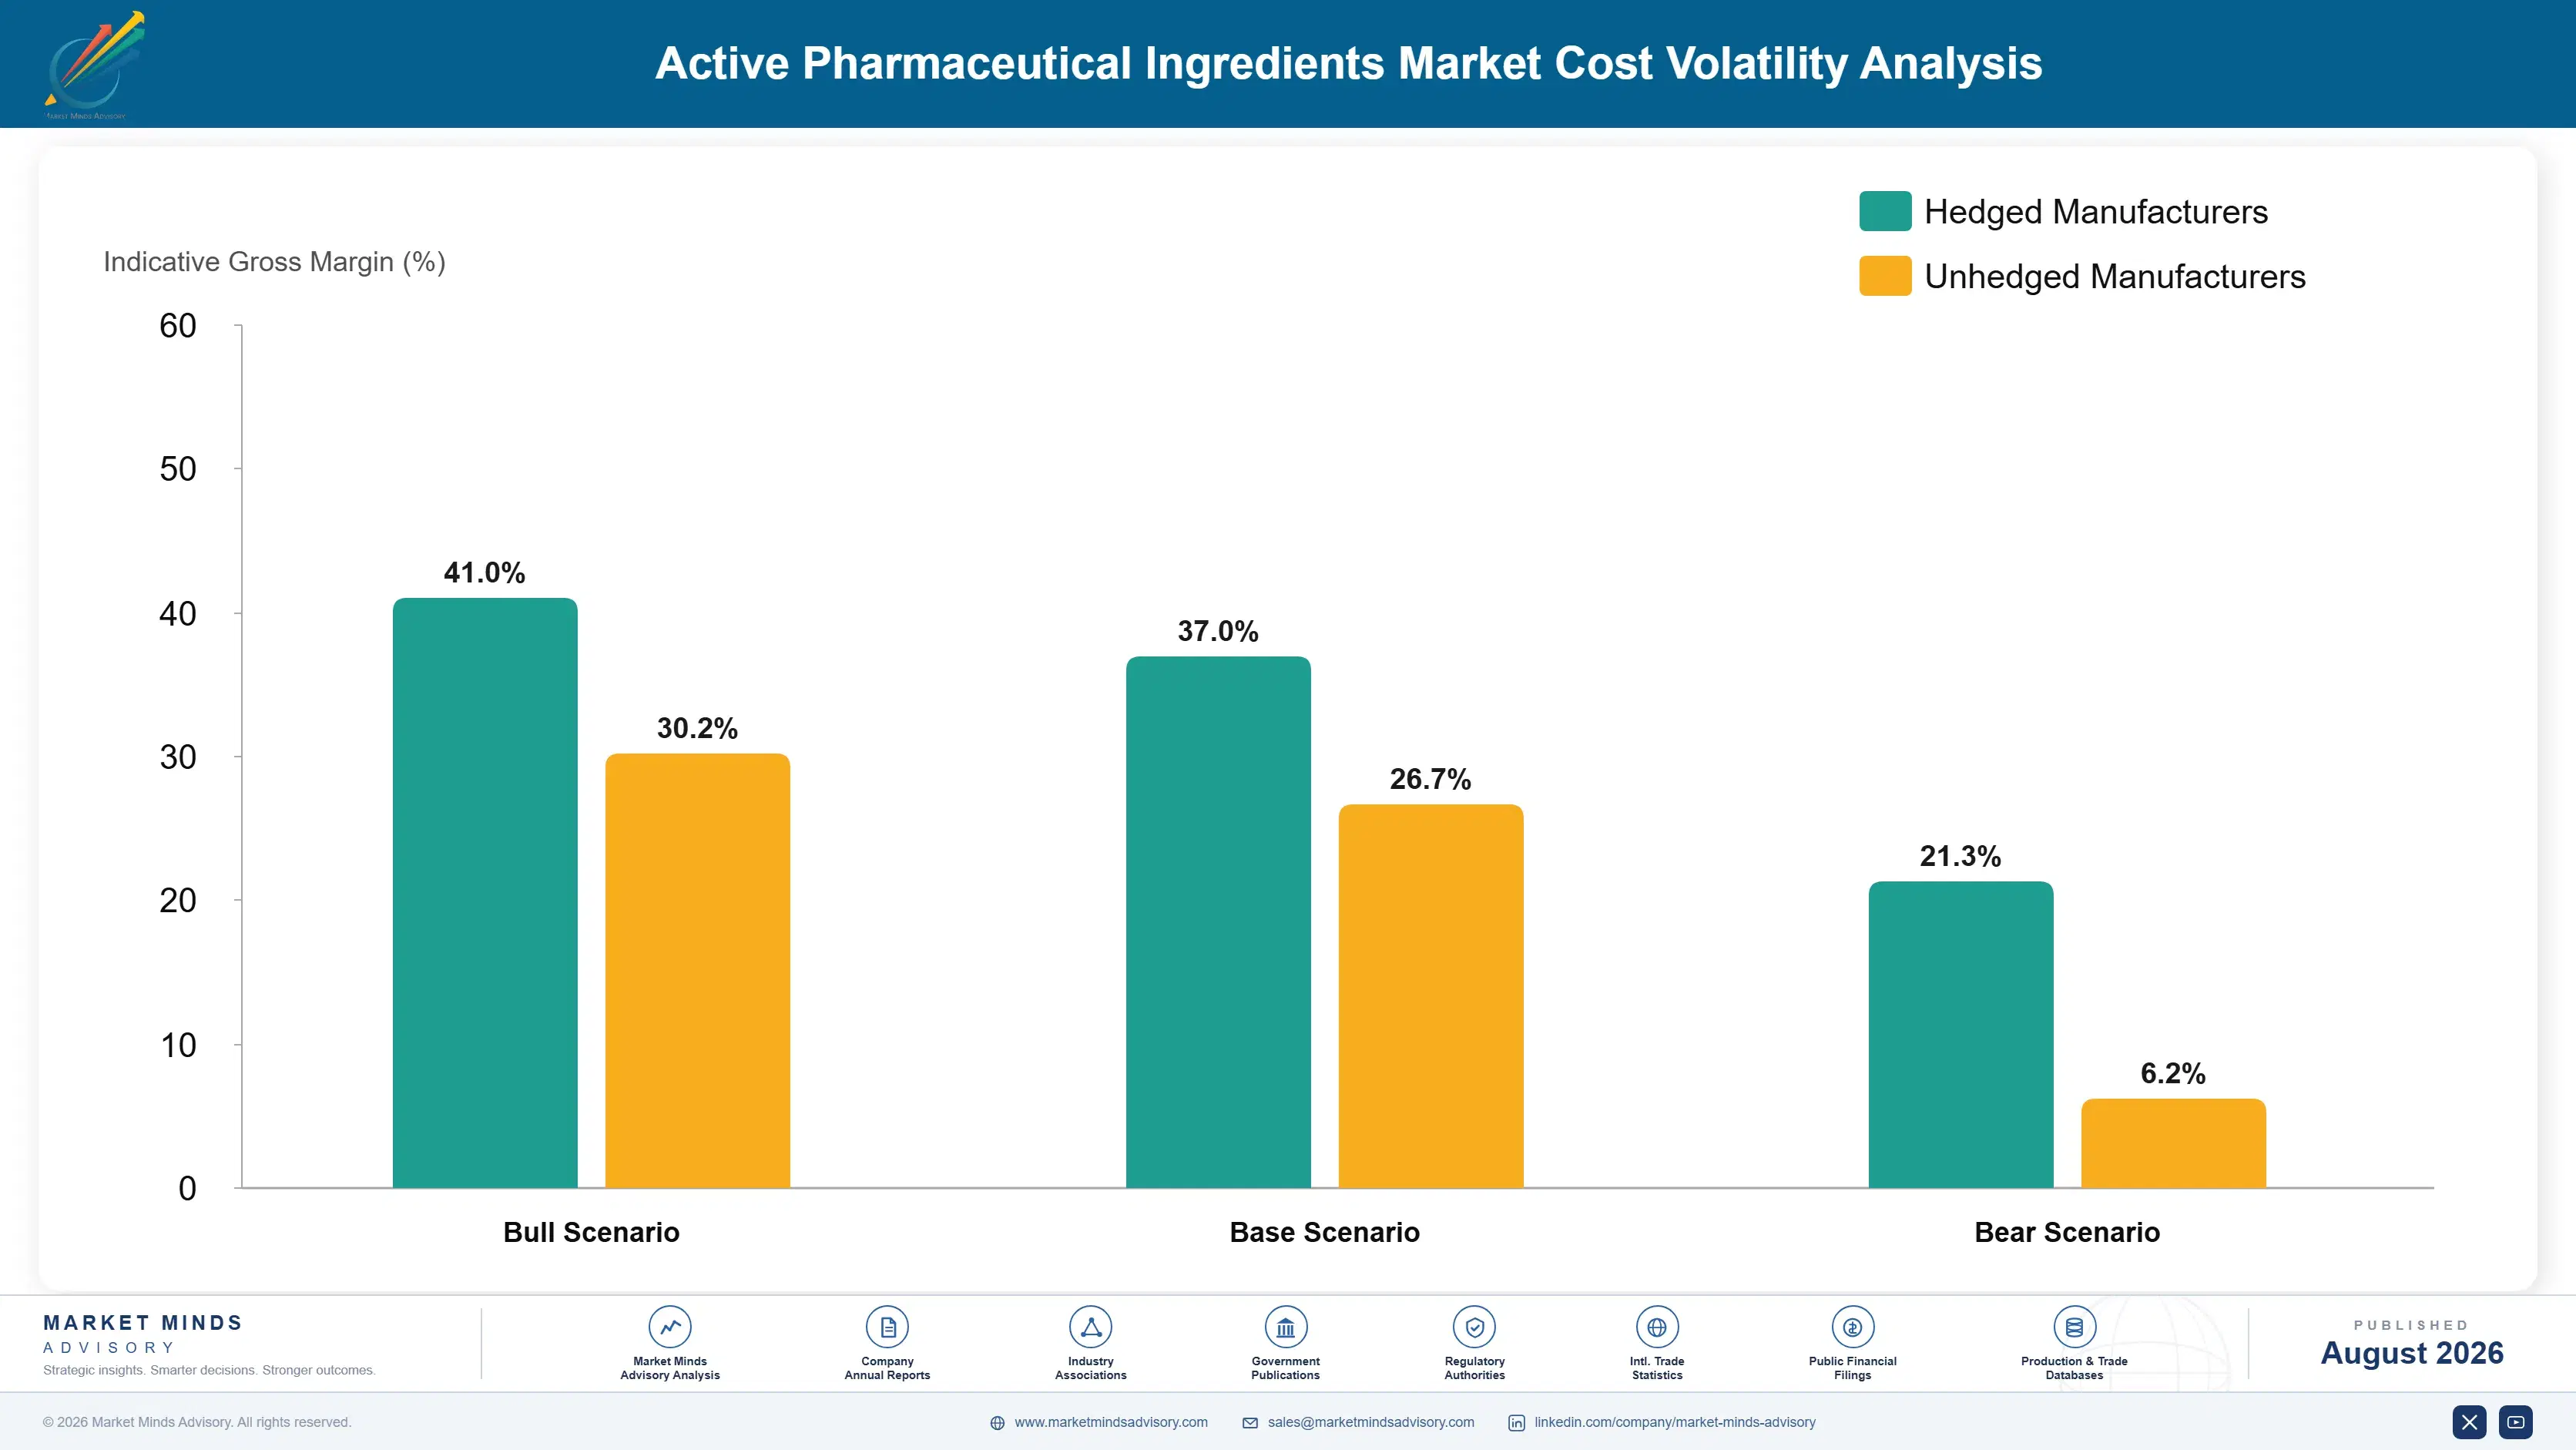
Key Starting Materials, Solvents, Energy, Media

Cost structure separates sharply by production platform. For synthetic actives, key starting materials and intermediates run 38% to 55% of cost, sourced overwhelmingly from Chinese and Indian producers regardless of where the final step happens. Solvents and reagents add 12% to 18%, energy 8% to 14% across multi-step synthesis. For biologics the picture inverts: media and single-use consumables dominate at 30% to 44%.
The 2022 European energy crisis hit multi-step synthesis and fermentation hardest, with IEA analysis recording European industrial gas at several times prior-year levels and several producers curtailing energy-intensive steps rather than lose money. Siegfried and Lonza both disclosed input and energy cost pressure across that period. Chinese environmental enforcement compounded it separately, closing older intermediate capacity and lifting starting material prices on molecules with few qualified alternatives.

Exposure separates by backward integration, not by scale. A producer making its own key starting materials controls both cost and continuity, while one buying them from a single Chinese supplier carries that supplier's pricing, compliance status, and export policy with no alternative inside a year. Geography compounds it, since European synthesis carries energy costs Asian production does not, on processes where energy is a tenth of cost.
active-pharmaceutical-ingredients-market-cost-volatility-analysis-1787324445825

Qualify a second source for every critical starting material

Key starting material qualification takes months and often requires regulatory notification, which means a single-sourced input is an unmanaged risk rather than a purchasing decision. Qualifying an alternative costs analytical work once and provides continuity permanently. Regulators and buyers both now ask for documented supply continuity during qualification, so compliance and commercial cases point the same way.

Integrate backward on molecules with durable volume

Buying intermediates from the suppliers competitors also use caps cost position and leaves the same chokepoint everybody else has. Producing key starting materials internally converts a supplier's pricing decision into an internal cost and removes an exposure buyers now probe. The capital requirement is substantial and payback depends on volume durability, so this suits established molecules rather than speculative programmes.

Shift energy-intensive steps toward lower-cost sites

Multi-step synthesis and fermentation consume energy at levels where regional price differences decide competitiveness outright, not marginally. Running the energy-heavy steps at sites with cheaper power while keeping final steps and quality release where filings require them preserves regulatory position at lower cost. Splitting a process across sites adds filing complexity and validation work, which only pays on substantial volume.

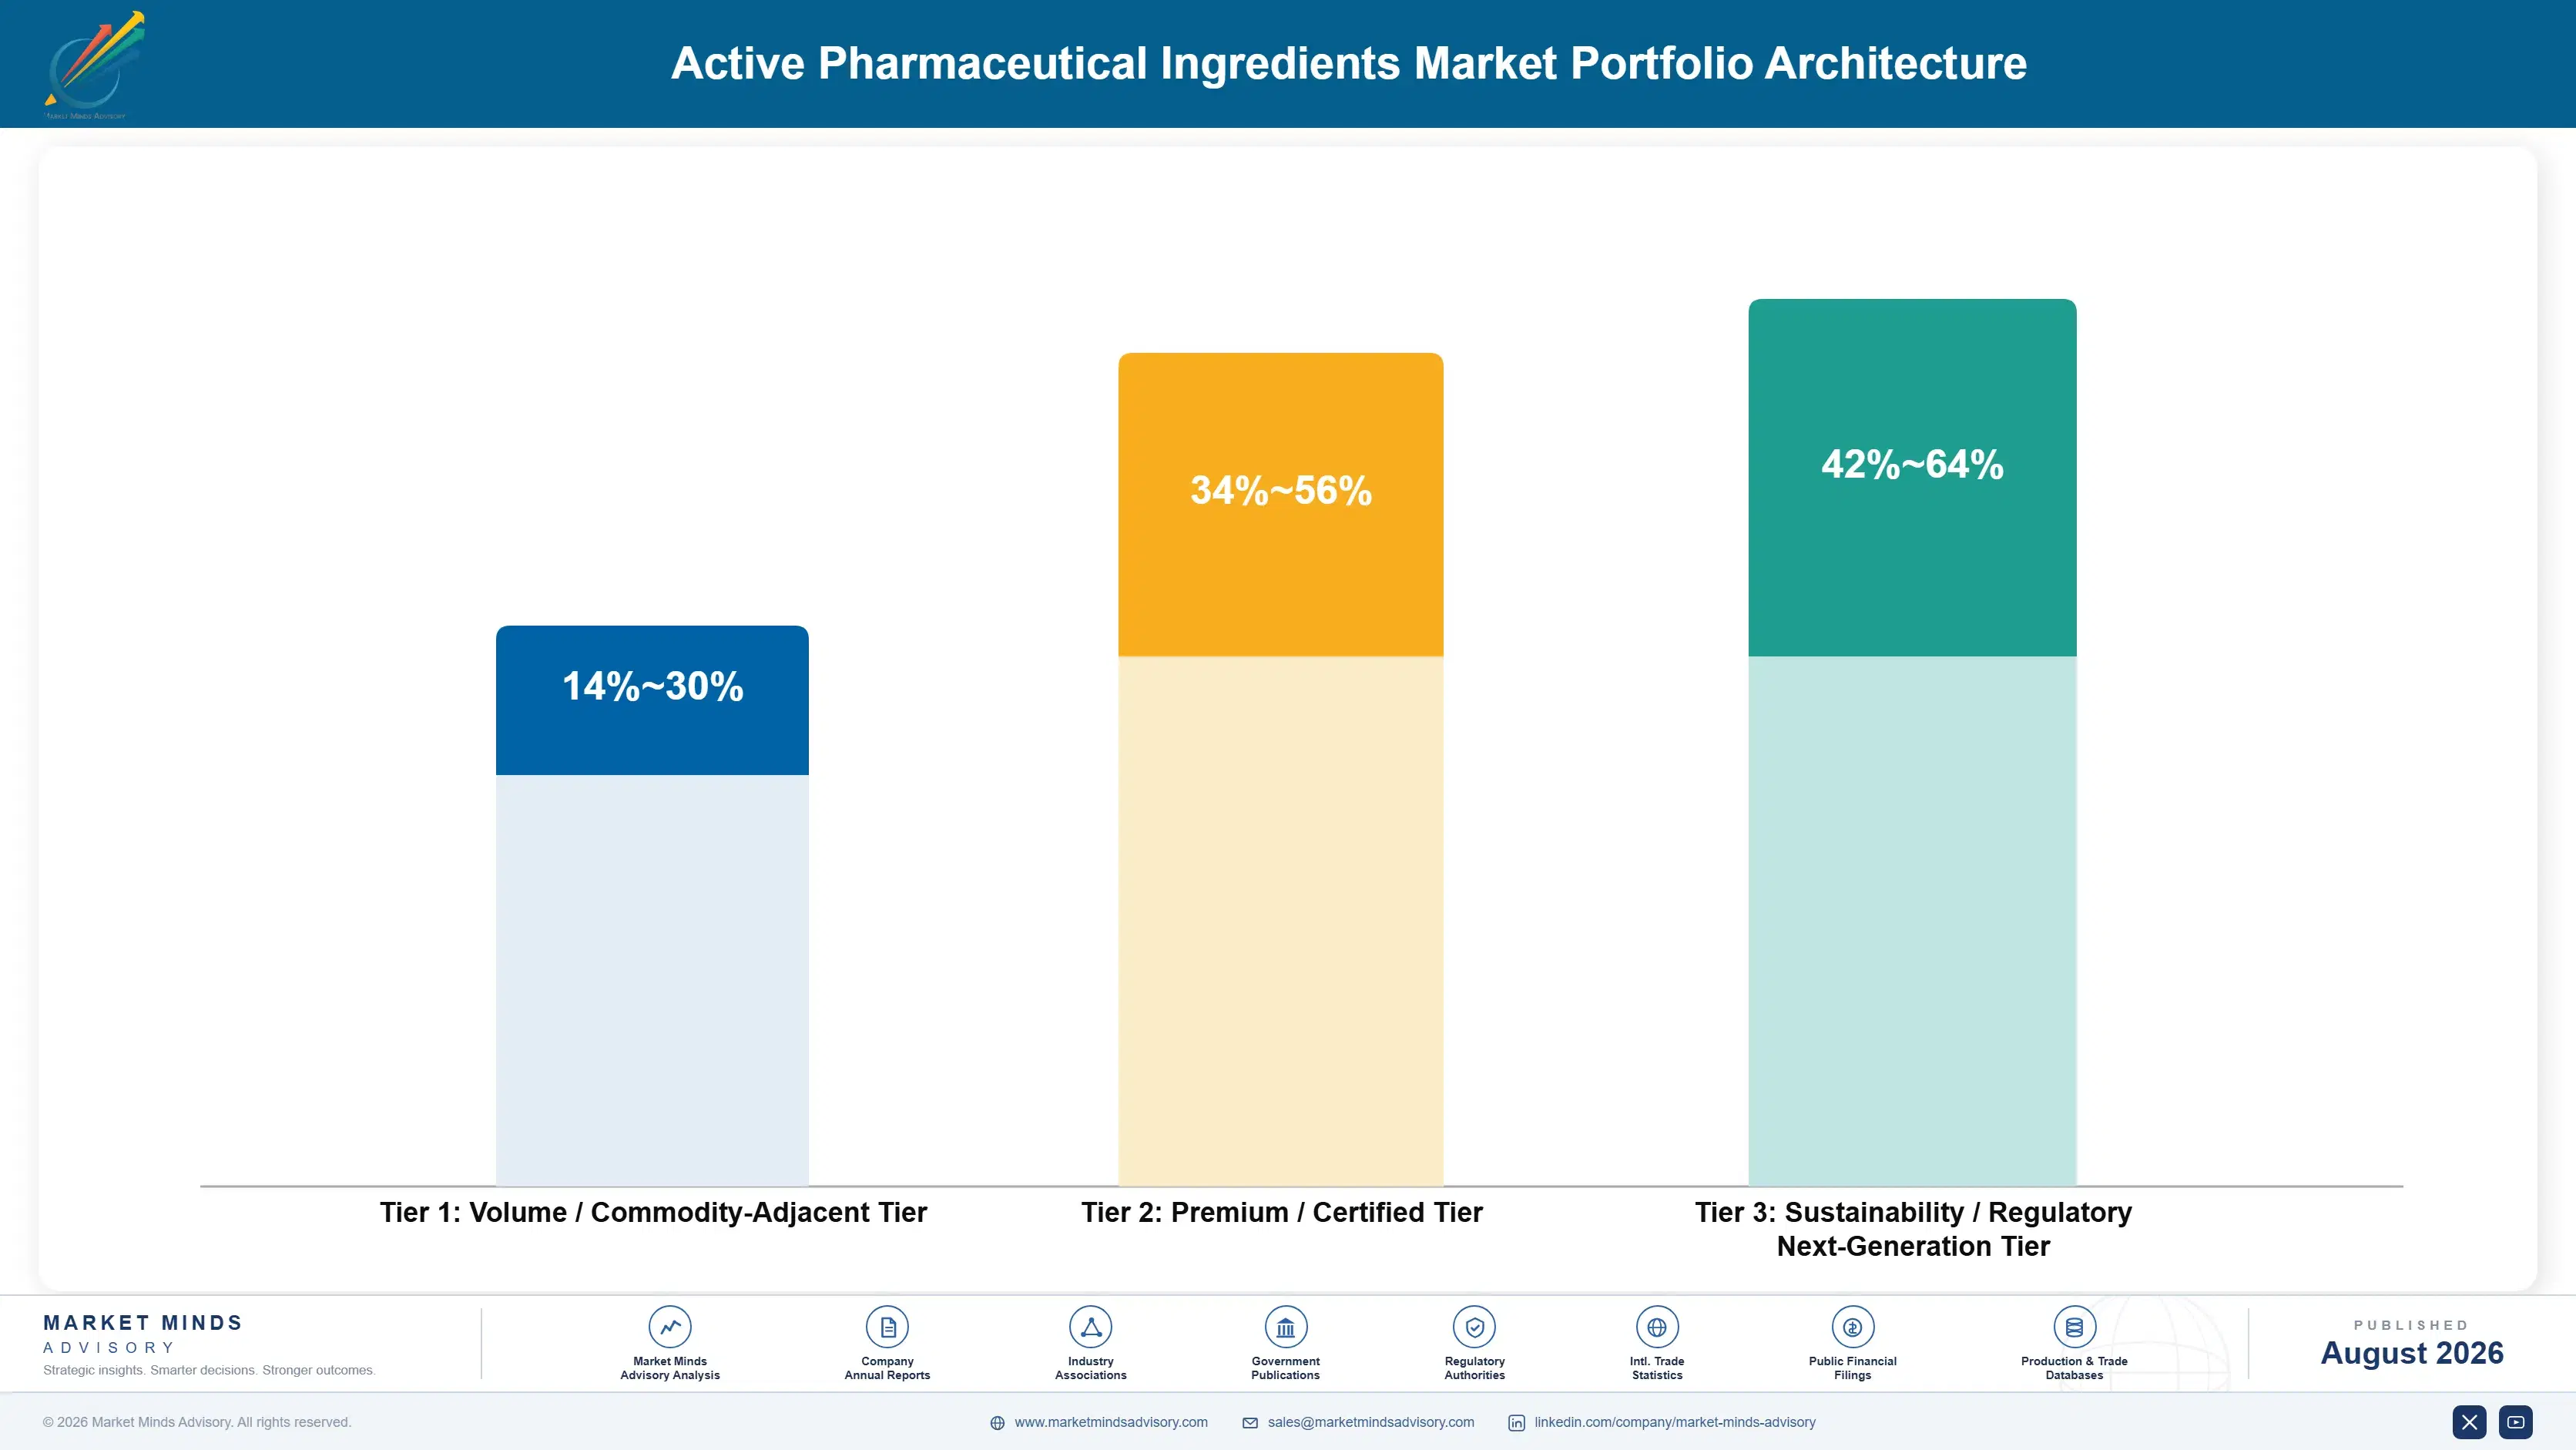
Portfolio Architecture for Margin Defence

The portfolio splits into three tiers with different economics. Established off-patent synthetic actives form the volume tier, where a dozen approved sites hold filings and pricing falls annually with no recovery mechanism. High-potency actives, complex synthesis, and peptides earn more because containment and capability narrow the field. Biologic drug substances and newer modalities price against scarce qualified capacity rather than a competing quotation.
The tension runs between commodity actives that fill the plant and specialist classes that earn the return. Established synthetic molecules keep reactors loaded, cover the fixed cost of qualified assets, and maintain the relationships through which development work arrives. Yet they compete against integrated Asian producers on cost Western plants cannot reach. Producers handling this well run commodity volume for utilisation while converting capacity toward containment, peptides, and biologics.

High-value pools concentrate where capability or filing position limits competition: biologic substances with qualified capacity, high-potency actives requiring containment, peptides and oligonucleotides at commercial tonnage, and any molecule where the producer is the named site in an original marketing authorisation. All four escape cost-per-kilogram comparison. Established synthetic actives sit at the other end, where a dozen filings compete and the tender sets the price every year.

Volume / Commodity-Adjacent Tier

Established off-patent synthetic actives sold on cost per kilogram against multiple approved sites. The range is wide because backward integration into starting materials and regional energy cost separate producers enormously at identical selling prices.
Gross Margin: 14-30%

Premium / Certified Tier

High-potency actives, complex multi-step synthesis, controlled substances, and peptides carrying containment or capability barriers. The range is wide because capacity tightness varies sharply by class and filed position protects some molecules far better than others.
Gross Margin: 34-56%

Sustainability / Regulatory / Next-Generation Tier

Biologic drug substances, oligonucleotides, cell and gene therapy substances, and continuous or greener synthesis platforms. The range is wide because qualified capacity scarcity supports pricing while newer modalities still carry unrecovered development and validation cost.
Gross Margin: 42-64%
active-pharmaceutical-ingredients-market-portfolio-architecture-1787324446320

High-value Sub-segments and Strategic Watch-out

Biologic Drug Substances

High value and high growth at 10.8%, the fastest class, on approval mix shifting toward antibodies and newer modalities. Capacity takes four to six years to build, qualify, and inspect, so supply commitments precede demand by half a decade and pricing follows available bioreactor volume.
Gross Margin: 42-64%

Peptides and Oligonucleotides

High value with strong growth at 9.2%, driven by incretin analogues and rare disease pipelines that outran qualified capacity entirely. Solid phase synthesis at commercial tonnage is a different manufacturing problem from trial quantities, which has kept pricing unusually firm. Qualified capacity remains genuinely tight across the class.
Gross Margin: 38-58%

Small Molecule Synthetic Actives

The volume core by a wide margin, growing at 4.6% and squeezed between generic price erosion and integrated Asian cost positions. Tonnage keeps rising as patents expire, but value per kilogram falls every year and no producer has found a way to reverse it. Exiting molecules is often correct.
Gross Margin: 14-30%

High-Potency Active Ingredients

The strategic watch-out, growing at 8.4% on oncology and conjugate pipelines that require containment few sites hold. Capital cost per suite is severe and utilisation depends on clinical programmes that fail unpredictably, which makes capacity planning genuinely difficult here. Containment suites cost multiples of standard synthesis capacity.
Gross Margin: 36-58%

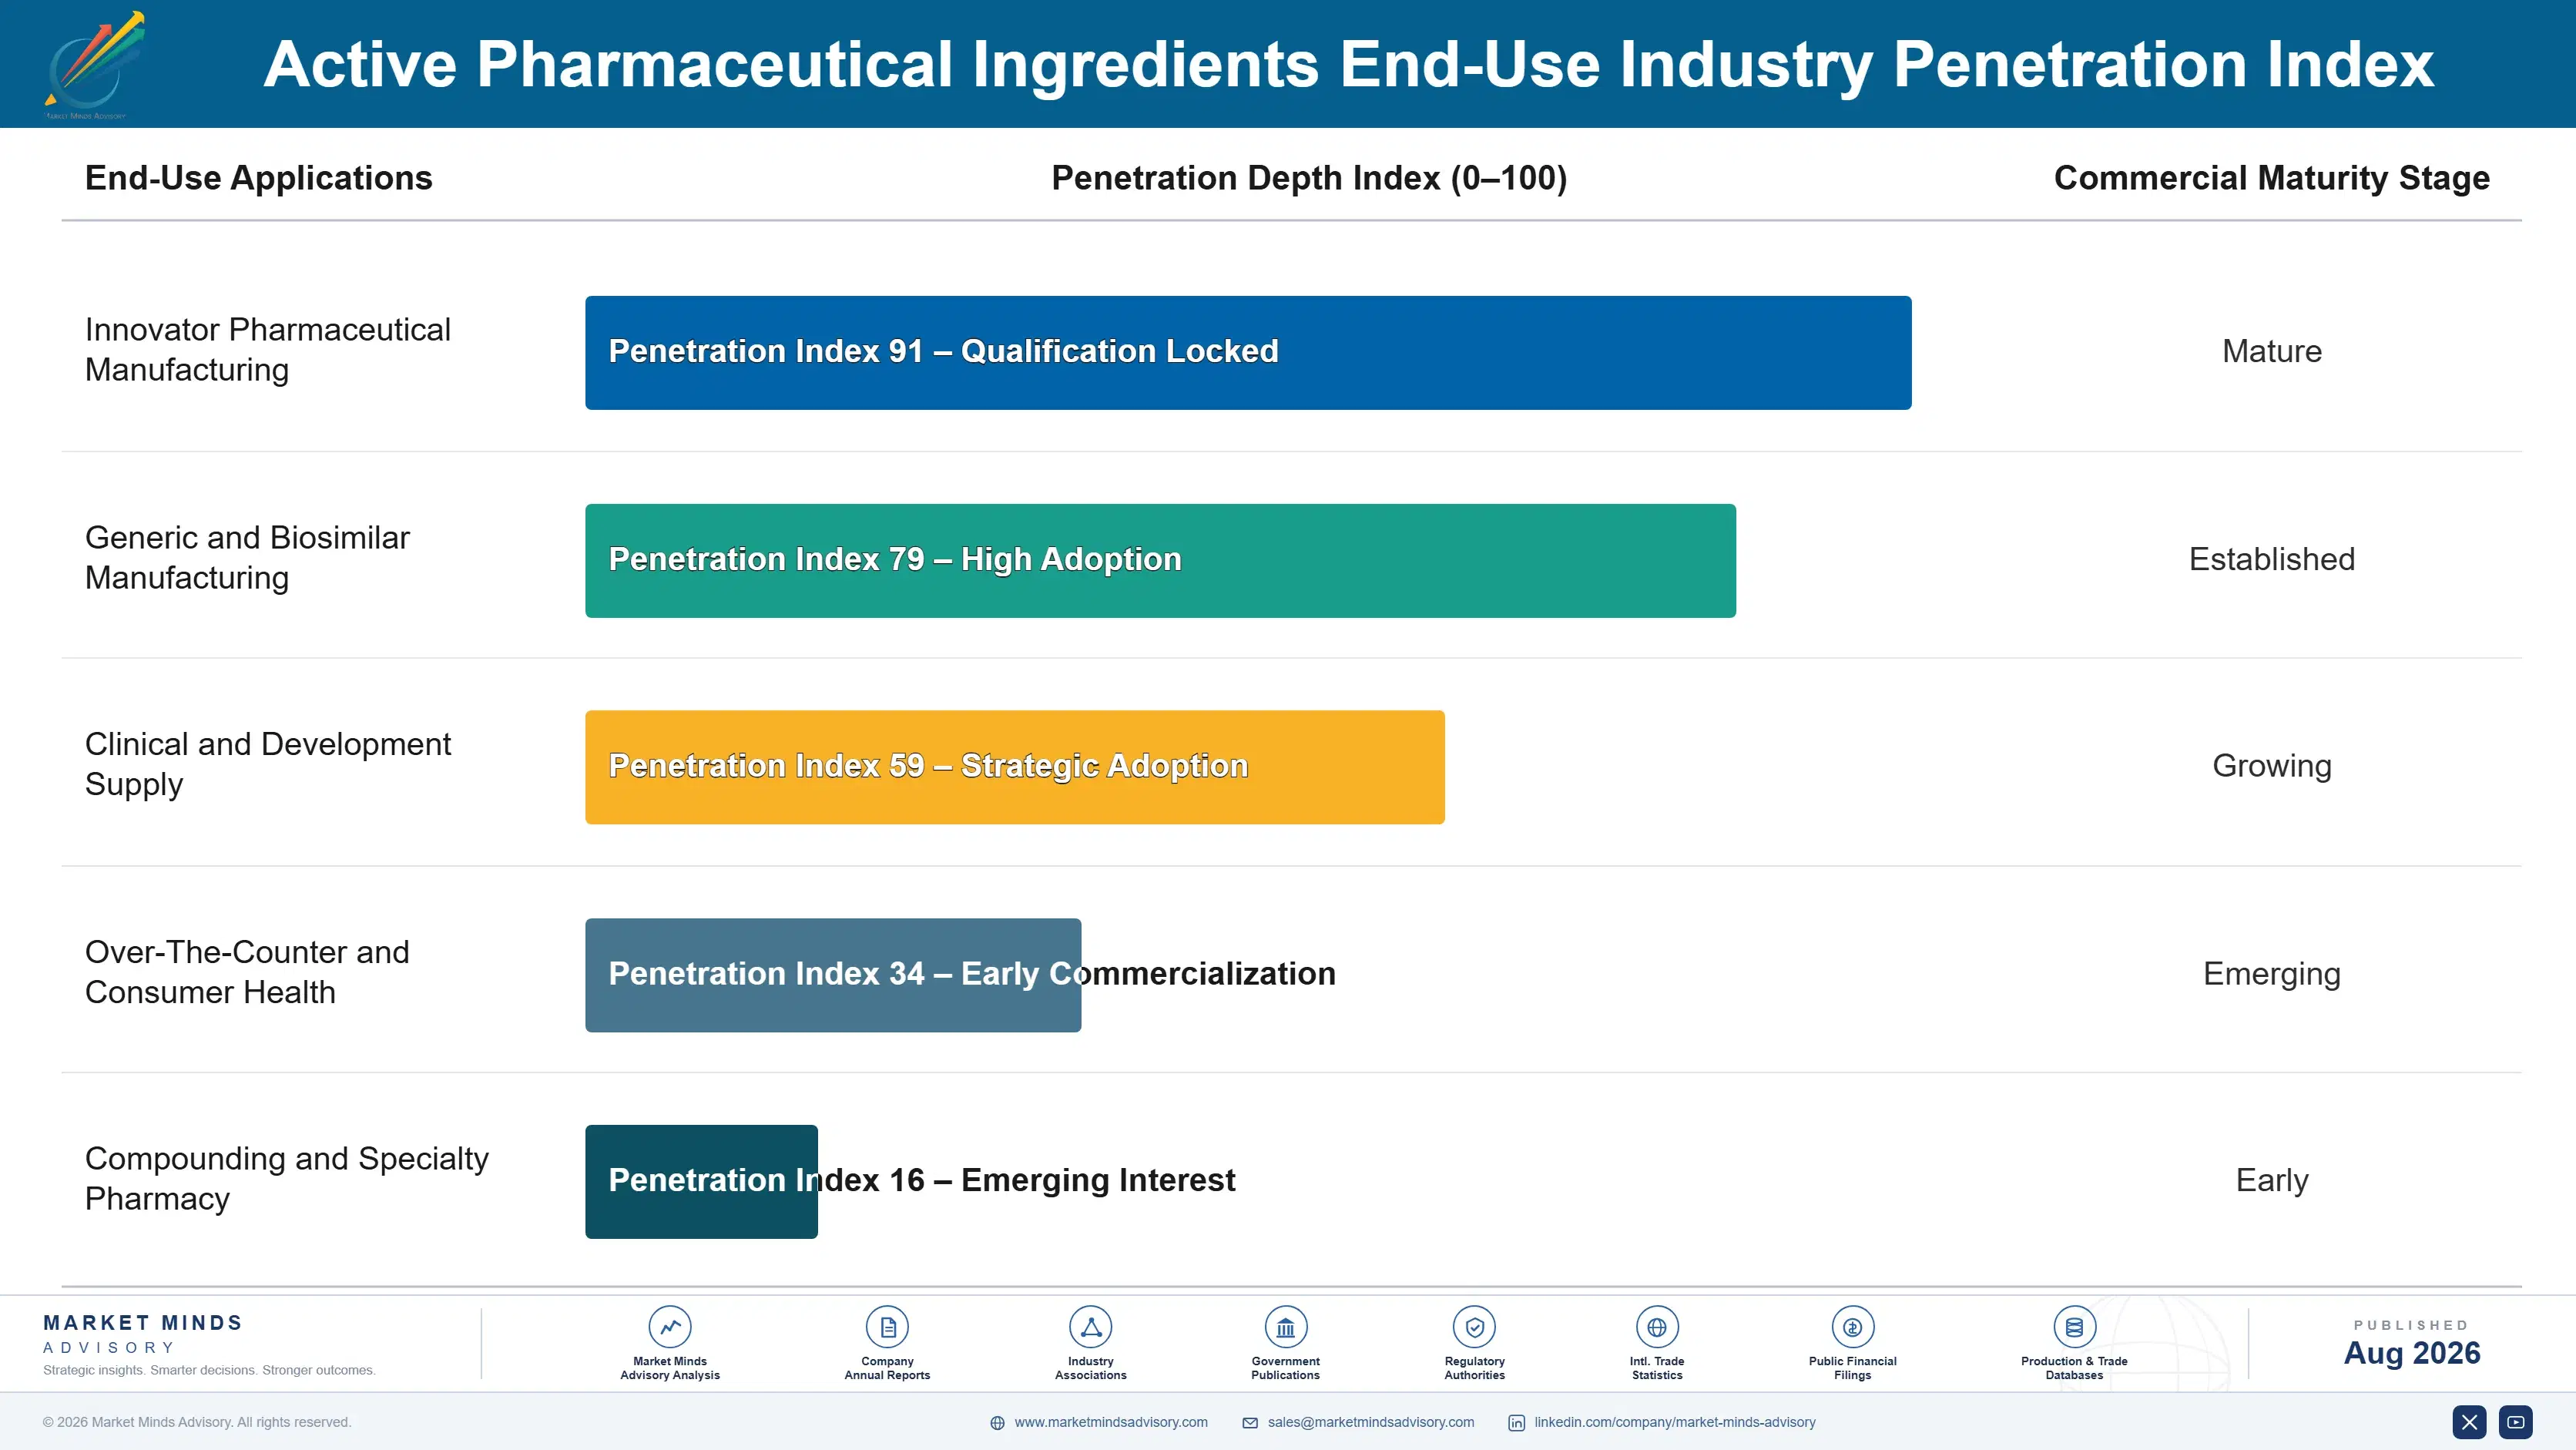
How Filed Positions Actually Hold

Demand commits at regulatory filing and repeats as commercial orders for the life of the product. A site named in a marketing authorisation has been through process validation, comparability work, and inspection, and replacing it requires a variation costing 12 to 30 months plus regulatory risk that whoever signs it carries personally. That protects incumbents more completely than anything in chemicals, and the genuine competitive moments are development-stage supply and post-expiry generic entr
Stickiness varies by modality and filing complexity. Biologic substances stick hardest, since comparability requirements make a site change close to a new product submission. High-potency actives stick nearly as firmly through containment qualification. Peptides stick through capacity scarcity rather than regulation. Established synthetic actives stick least, moving on price at every tender to whichever approved site quotes lowest that year.

Buyer profiles have moved from procurement teams negotiating cost per kilogram toward quality and supply security functions holding a veto that price alone cannot override. Inspection history is now the first screen rather than a final check. That change rewards producers who bring clean multi-authority records, documented starting material continuity, and second-site options alongside a quotation, and it penalises those still competing purely on delivered cost.
active-pharmaceutical-ingredients-market-end-use-penetration-index-1787324446812

Our Call On Drug Substances

These are among the four positions where our research anticipates prominent divergence between winners and laggards over the coming forecast period. Each is grounded in the demand model, the regulatory perimeter, and the announced capacity pipeline.
01 / ORIGINAL FILING POSITION

Win the development kilogram to hold the tonne

A site named in the first marketing authorisation supplies that product until somebody funds a variation costing 12 to 30 months of regulatory work, and quality organisations initiate that work reluctantly because they personally own the regulatory risk. Development-stage batches are small, technically awkward, and unattractive on their own margin, which is exactly why competitors decline them. That is the wrong comparison entirely, since the development kilogram decides the commercial tonnage sitting behind it for a decade or more after launch.
02 / CAPABILITY OVER COST

Nobody wins a kilogram price war with Asia

Established synthetic actives lose 6% to 12% of their price every year with no recovery mechanism at all, and integrated Chinese and Indian producers hold cost positions that Western plants cannot approach on any of those molecules. Holding portfolio mix constant is therefore a slow decline presented to the board as stability. Converting capacity toward containment, peptides, and biologics is expensive and takes years to qualify, which is precisely why the position defends itself once the investment is finally finished and inspected.
03 / INSPECTION RECORD VALUE

Clean records are a product, not an overhead

An import alert or warning letter stops shipment within a day and can remove a producer from a market for years, whatever its cost position looked like the week before. That makes inspection history the first screen in serious sourcing rather than a compliance formality, and buyers are already paying for it whether anybody prices it explicitly. Remediation spending ahead of a 2 to 4 year inspection cycle should be treated as commercial investment with a measurable return rather than as overhead.
04 / STARTING MATERIAL INTEGRATION

The chokepoint sits upstream of the final step

Most Western producers buy key starting materials from the same Chinese suppliers their competitors use, which caps cost position and leaves the identical single point of failure that buyers now probe closely during qualification. Backward integration converts a supplier's pricing decision into an internal cost and removes that exposure permanently rather than temporarily. The capital requirement is substantial, so it only justifies itself on molecules with durable remaining volume rather than on speculative programmes that may never reach approval at all.

Engagement Snapshot From the Field

A live engagement with an industry participant carrying material or product regulatory and market exposure ahead of a defining policy shift, showing how our research translates into a defensible multi-year portfolio strategy.
MARKET MINDS ADVISORY · CLIENT ENGAGEMENT SUMMARY
Active Pharmaceutical Ingredients Producer Strategic Portfolio Review and Transition Roadmap 2026·Investment Scenario on Active Pharmaceutical Ingredients Exposure Evaluation 2025-26
CLIENT PROFILE
A mid-size generic formulator with roughly USD 1.4 billion in annual revenue engaged MMA after an import alert at a supplier site removed drug substance for four marketed products without warning. The client reported single-sourced supply on 61 of its 94 marketed molecules and no ranked view of which of those exposures actually mattered commercially (client-reported, unverified by MMA).
STRATEGIC CHALLENGE
Filing second sources across 61 molecules would have consumed the regulatory affairs function for years and cost more than the products earned. Suppliers had proposed dual sourcing everything, which was neither affordable nor necessary. The board needed to know which exposures could end a product line and which were merely uncomfortable, before committing the variation budget.
MMA APPROACH
MMA ranked every single-sourced molecule by revenue contribution, substitutability, and supplier inspection history rather than treating exposures uniformly. We examined which suppliers shared upstream key starting material sources, since two filed sites buying from one Chinese intermediate producer is not dual sourcing at all. We then modelled variation cost and timeline per molecule against the revenue genuinely at risk.
KEY FINDINGS
  1. Roughly 14% of single-sourced molecules carried about 68% of the revenue exposure, which made a ranked programme affordable where a uniform one was not (client-reported, unverified by MMA).
  2. Nine molecules already dual-filed shared a single upstream key starting material supplier, so the second filing provided no genuine supply security whatsoever.
  3. Four suppliers had inspection histories that internal sourcing reviews had never examined, and two of those carried findings within the previous three years.
  4. Variation cost averaged well below one quarter of a year's contribution on the highest-exposure molecules, making the business case straightforward once ranked (client-reported, unverified by MMA).
CLIENT PROFILE
A mid-size generic formulator with roughly USD 1.4 billion in annual revenue engaged MMA after an import alert at a supplier site removed drug substance for four marketed products without warning. The client reported single-sourced supply on 61 of its 94 marketed molecules and no ranked view of which of those exposures actually mattered commercially (client-reported, unverified by MMA).
STRATEGIC CHALLENGE
Filing second sources across 61 molecules would have consumed the regulatory affairs function for years and cost more than the products earned. Suppliers had proposed dual sourcing everything, which was neither affordable nor necessary. The board needed to know which exposures could end a product line and which were merely uncomfortable, before committing the variation budget.
MMA APPROACH
MMA ranked every single-sourced molecule by revenue contribution, substitutability, and supplier inspection history rather than treating exposures uniformly. We examined which suppliers shared upstream key starting material sources, since two filed sites buying from one Chinese intermediate producer is not dual sourcing at all. We then modelled variation cost and timeline per molecule against the revenue genuinely at risk.
KEY FINDINGS
  1. Roughly 14% of single-sourced molecules carried about 68% of the revenue exposure, which made a ranked programme affordable where a uniform one was not (client-reported, unverified by MMA).
  2. Nine molecules already dual-filed shared a single upstream key starting material supplier, so the second filing provided no genuine supply security whatsoever.
  3. Four suppliers had inspection histories that internal sourcing reviews had never examined, and two of those carried findings within the previous three years.
  4. Variation cost averaged well below one quarter of a year's contribution on the highest-exposure molecules, making the business case straightforward once ranked (client-reported, unverified by MMA).
RECOMMENDED STRATEGY
Phase 1: Phase 1 (0 to 9 months): File second sources on the highest-exposure molecules only, ranked by revenue at risk rather than by molecule count. Phase 2: Phase 2 (9 to 24 months): Map upstream starting material origin for every dual-filed molecule and replace the sources that converge on one producer. Phase 3: Phase 3 (24 to 36 months): Build supplier inspection history into sourcing approval permanently rather than reviewing it after a disruption.
OUTCOME
The client filed second sources on eleven molecules within two years, covering most of the revenue exposure at roughly a fifth of the cost of the programme suppliers had proposed. Upstream mapping revealed further convergence that was corrected on four products, and no marketed line was interrupted during the following inspection cycle (client-reported, unverified by MMA).

Frequently Asked Questions

Foundational context covering the market sizes, CAGR, scope, country, region and competition that inform every finding below. This section is provided to cover basics and most often pre-purchase conversations, answered from the MMA Primary Research Dataset.

What is the current size of the Active Pharmaceutical Ingredients Market?

The global active pharmaceutical ingredients market is valued at USD 231.7 billion in 2025, covering small molecule synthetic actives, biologic drug substances, high-potency actives, peptides, and fermentation-derived actives. Finished dosage manufacturing and excipients are excluded.

How large will the Active Pharmaceutical Ingredients Market be by 2036?

The market is forecast to reach USD 458.44 billion by 2036 in the base case, about 1.86 times the 2026 level. That represents incremental value of roughly USD 211.91 billion across the decade.

What is the CAGR for the Active Pharmaceutical Ingredients Market 2026 to 2036?

The market grows at a 6.4% CAGR in the base case, with bull and bear scenarios at 7.6% and 5.2%. The spread turns mainly on reshoring commitments and the pace of generic price erosion.

Which segment is growing fastest?

Biologic drug substances grow fastest at 10.8%, about 1.69 times the overall rate, as antibodies and newer modalities take approval share. Peptides and oligonucleotides follow at 9.2% on incretin demand.

Who are the major companies in the Active Pharmaceutical Ingredients Market?

Leading producers include Lonza, Samsung Biologics, Divi's Laboratories, Teva API, and Catalent. Fragmentation is extreme, with the top five holding roughly 19% of drug substance revenue across captive and contract supply.

Which country is growing fastest?

India grows fastest at a 9.8% CAGR, as producers move from intermediate supply into their own drug substance filings for regulated markets. China and South Korea follow on capacity scale.

Report Segmentation Architecture

The full report scope spans multiple orthogonal segmentation dimensions, with cross-tabulated demand data provided for each dimension pair. Coverage extends further to regional breakdowns, trend trajectories, and the competitive detail needed to support segment-level decision-making.

By Drug Substance Class

  • Small Molecule Synthetic Actives
  • Biologic Drug Substances
  • High-Potency Active Ingredients
  • Peptides and Oligonucleotides
  • Fermentation-Derived Actives

By End-Use Industry

  • Innovator Pharmaceutical Manufacturing
  • Generic and Biosimilar Manufacturing
  • Clinical and Development Supply
  • Over-The-Counter and Consumer Health
  • Compounding and Specialty Pharmacy

By Supply Model

  • Captive Internal Manufacturing
  • Dedicated Contract Manufacturing
  • Merchant Market Sale
  • Distributor and Trader Supply

By Region

  • North America
  • Western Europe
  • East Asia
  • South Asia and Pacific
  • Latin America
  • Middle East and Africa
  • Eastern Europe

Scope, Methodology, and Coverage

Every figure in this report is reproducible from documented input assumptions. The scope below maps the historical period, the forecast horizon, the segmentation dimensions, and the countries covered, alongside the underlying primary and qualitative methodology.
Historical Period
2020 to 2025
Forecast Period
2026 to 2036
Base Year
2025 (USD billions; MMA Primary Research Dataset, August 2026)
Market Definition
The active pharmaceutical ingredients market comprises the manufacture and supply of drug substances that constitute the therapeutically active component of finished medicines, valued at producer selling prices to pharmaceutical formulators, generic manufacturers, and distributors, and including transfer value of captive internal production. It spans small molecule synthetic actives, biologic drug substances produced by mammalian or microbial culture, high-potency active ingredients requiring containment, peptides and oligonucleotides, and fermentation-derived actives, together with the process validation and regulatory documentation supplied with them. Finished dosage form manufacturing and packaging, excipients and formulation aids, key starting materials and regulatory intermediates sold below drug substance specification, diagnostic reagents, research-use-only compounds, cannabis and nutraceutical actives, and veterinary-only active ingredients are excluded.
Quantitative Units
USD billions (current prices); production volume in thousand tonnes and kilograms for high-potency classes
Segmentation Dimensions
By Drug Substance Class; By End-Use Industry; By Supply Model; By Region
Regions Covered
North America, Western Europe, East Asia, South Asia and Pacific, Latin America, Middle East and Africa, Eastern Europe
Countries Covered
USA, China, Germany, France, UK, Japan, South Korea, India, Australia, Canada, Brazil, Mexico, Indonesia, Vietnam, Thailand, Malaysia, UAE, Saudi Arabia, South Africa, Nigeria, Turkey, Poland, Netherlands, Italy, Spain, Sweden, Switzerland, Argentina, Colombia, Singapore, and additional markets relevant to this sector
Key Companies Profiled
Lonza, Samsung Biologics, Divi's Laboratories, Teva API, Catalent, WuXi AppTec, Boehringer Ingelheim BioXcellence, Fujifilm Diosynth Biotechnologies, Siegfried, Cambrex, Aurobindo Pharma, Dr Reddy's Laboratories, Sun Pharmaceutical Industries, Piramal Pharma Solutions, Asymchem, Zhejiang Huahai Pharmaceutical, Bachem, PolyPeptide Group, Recipharm, Hovione
Quantitative Methodology
Primary survey, n=3,800 respondents, Q4 2025, six countries; demand-side model with trade association cross-validation
Qualitative Methodology
47 expert interviews, Q4 2025; applied to validate demand model assumptions, identify emerging dynamics, and assess competitive positioning
Report Format
PDF and XLSX data workbook (Word format preview document)
Publisher
Market Minds Advisory
Report Code
MMA-2026-CHM-274
Published
August 2026
Contact
sales@marketmindsadvisory.com | www.marketmindsadvisory.com

Purchase the full Active Pharmaceutical Ingredients Market Report (2026 to 2036).

The full MMA Active Pharmaceutical Ingredients report sizes the market across five drug substance classes, five end-use industries, four supply models, and seven regions through 2036. It profiles 20 producers on a consistent basis of drug substance manufacturing and supply revenue, scoring each on filed position breadth, inspection record, platform capability, and backward integration depth. Scenario models quantify how filing lock-in, reshoring policy, and generic price erosion move both volume and achievable margin by class. The report also includes filed site concentration mapping by molecule, upstream starting material origin analysis, inspection outcome tracking across major authorities, and variation cost benchmarking for second-source decisions.
Five-class and four-model market sizing to 2036
Twenty-producer benchmark on drug substance supply revenue
Filed site concentration mapping by marketed molecule
Upstream key starting material origin and convergence analysis
Inspection outcome tracking across major regulatory authorities
Variation cost benchmarking for second-source sourcing decisions

Built For The People Who Decide

From boardroom strategy to bench-side execution, this report is read cover-to-cover by leaders shaping the next decade of their industry, turning demand scenarios, market dynamics and valuation benchmarks into decisions.
CXOs/ Presidents/ VPs/ Managers
M&A and Corporate Development
Strategy Teams and R&D Heads
Procurement and Product Directors
Regulatory and Compliance Leaders
Investor Relations and Equity Analysts