Market Minds Advisory
Acetic Acid Esters Market

Acetic Acid Esters Market: Acetic Acid Esters Market. Chinese Capacity, VOC Rules, and High-Purity and Bio-Based Grades Shape Global Solvent Demand.

Acetic acid esters are a mature solvent market anchored in coatings, inks, and adhesives, where Chinese overcapacity and VOC rules squeeze commodity grades while electronic, pharmaceutical, and bio-based grades earn premiums and carry growth.

Lead Analyst

Published

September 2026

Make Smarter Decisions with Customized Research Insights

Request a free sample report and evaluate market opportunities, growth trends, and competitive dynamics relevant to your business needs.

2025 MARKET VALUE$6.8BMarket Size 2025
2036 FORECAST VALUE$10.9BBase Case , 2026 to 2036
CAGR 2026 TO 20364.4 %Bull 5.8% / Bear 3.0%
INCREMENTAL OPPORTUNITY$3.8BNet 10- year value creation
EXPANSION MULTIPLE1.54x2036 value over 2026 base
Strategic Levers
M&A Pipeline
Regional Outlook
Country Rankings
Competitive Intelligence
Segmental Deep-dive
Call-Us : 91 93563 13602

Executive Snapshot and Market Trajectory.

Acetic acid esters, mainly ethyl, butyl, isopropyl, and propyl acetate, are fast-evaporating solvents made from acetic acid and alcohols. They dissolve resins in coatings, inks, adhesives, and pharmaceutical processing. Demand is mature and tied to industrial output, while stricter VOC rules and Chinese capacity additions push producers toward specialty grades.
Electronic and High-Purity Grade Acetate Esters grow fastest as semiconductor, display, and photoresist makers need ultra-clean solvents with metal and moisture limits. East Asia holds the largest share, since Chinese plants make most ethyl and butyl acetate and Korean, Japanese, and Taiwanese fabs buy the high-purity grades. Acetic acid cost sets margins. Utilisation sets pricing. Quality certificates set access. Buyers audit suppliers yearly. Contracts decide renewal.
Competition is concentrated at the top, with two US acetyl chain producers, a UK-based solvent group, and a South African chemicals firm leading on integrated acetic acid, plant scale, and logistics, while Chinese producers add capacity and compete on price. VOC rules in the United States, European Union, and China shape which solvents coatings makers can use. Integration gates cost. Purity gates premium accounts. Buyers audit plants every year, and delivery failures cost contracts.
Market Definition
The market covers global sales of acetic acid esters, valued at producer level, including ethyl acetate, n-butyl and isobutyl acetate, isopropyl and n-propyl acetate, and methyl acetate, sold as industrial solvent grade, food and flavour grade, pharmaceutical grade, electronic and high-purity grade, and bio-based grade. The scope excludes vinyl acetate monomer, cellulose acetate, glycol ether acetates, acetic acid and acetic anhydride sold on their own, and finished coatings, inks, and adhesives.
Base Year Value
$6.8B in 2025 (MMA Primary Research Dataset, September 2026)
Forecast Period
2026 to 2036, eleven discrete annual values
CAGR
4.4% base case. Bull 5.8%. Bear 3.0%.
Fastest Growth Segment
Electronic and High-Purity Grade Acetate Esters: 8.6% CAGR
Fastest Growth Country
India: 6.6% CAGR
Fastest Growth Region
South Asia and Pacific: 6.4% CAGR
Largest Region
East Asia: 40% of 2025 global value
Market Leaders
Celanese, Eastman Chemical, INEOS, Sasol, Resonac. Source: MMA Analysis, company annual reports.
Primary Survey
n=3,800 procurement and R&D decision-makers, Q4 2025, six countries
Methodology
Demand-side build-up, cross-validated against public data, 47 expert interviews

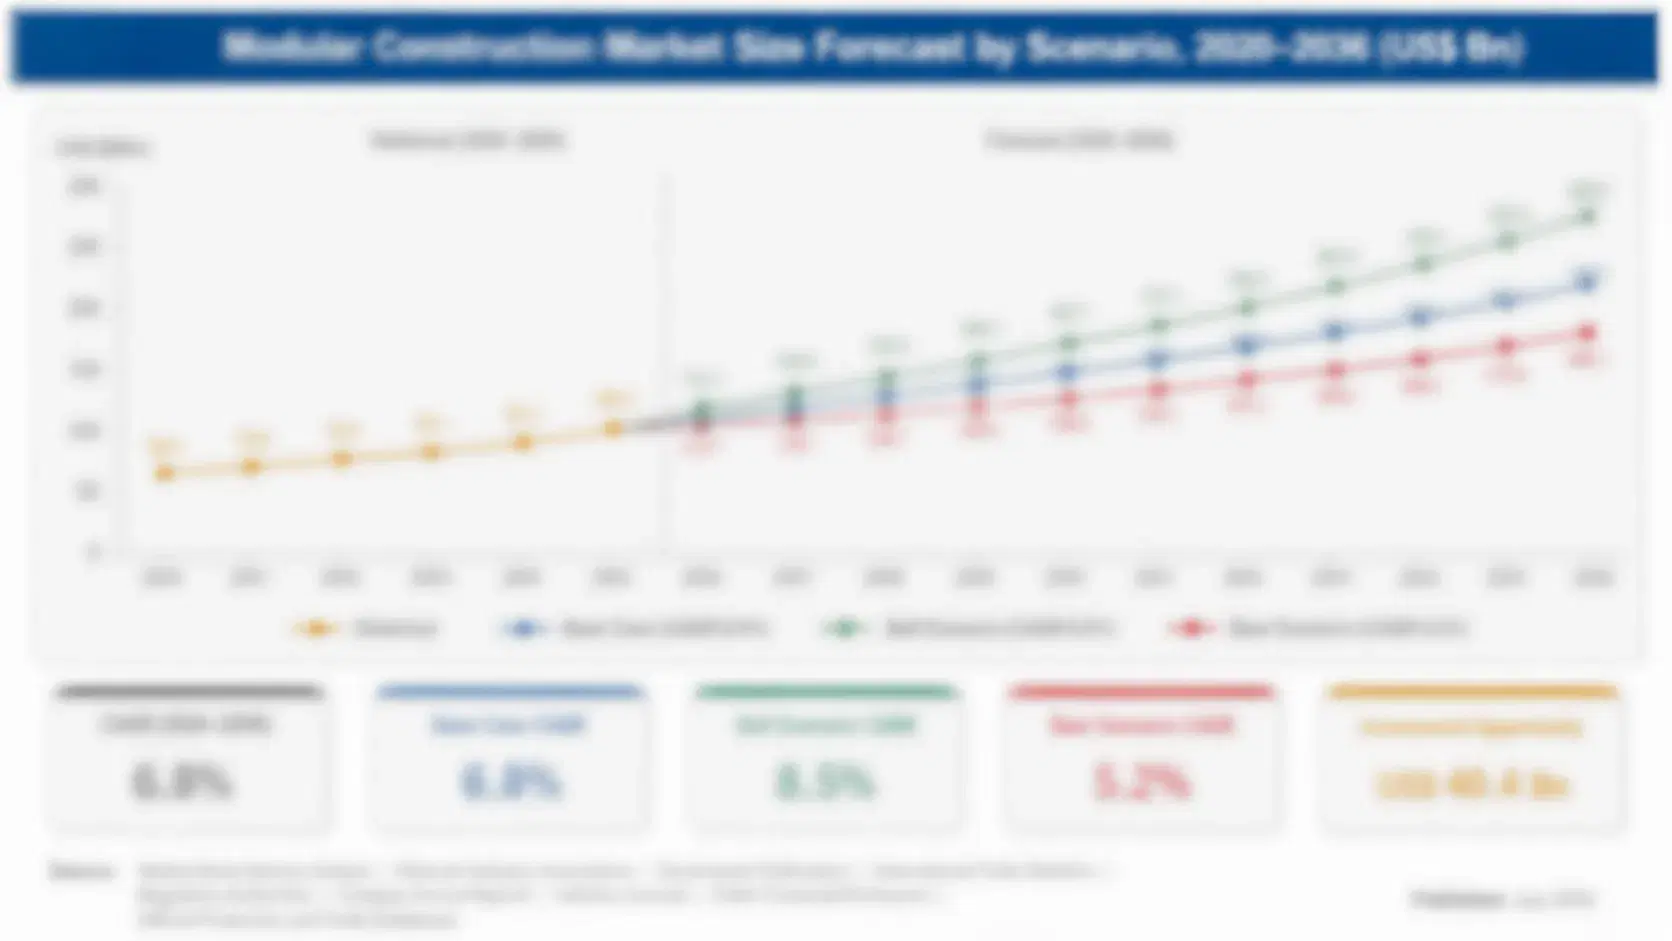
Acetic Acid Esters Market Forecast Scenarios

acetic-acid-esters-of-mono-and-diglycerides-of-fat-size-forecast-scenario-1789845302096
Between 2020 and 2025, acetic acid ester demand grew slowly as flexible packaging, adhesive, and pharmaceutical output rose while solvent-borne coatings lost share to waterborne systems in Europe and North America. Chinese capacity additions cut prices, energy costs spiked in 2022, and freight costs jumped in 2021. Value growth lagged volume as prices fell in oversupplied regions. Brands reward consistency over novelty.
The base case rests on three commercial mechanisms. First, flexible packaging inks and adhesives in Asia keep absorbing ethyl and butyl acetate at steady rates. Second, semiconductor, display, and pharmaceutical makers add demand for high-purity grades that carry premiums. Third, producers add bio-based and integrated capacity, which improves cost position and meets brand owner sustainability targets. Suppliers plan feedstock contracts and quality investment around all three. Supply contracts decide renewal. Delivery reliability decides supplier rankings.
The bull case needs faster semiconductor and packaging growth and slower Chinese capacity additions, which would lift utilisation and prices. The bear case is a coatings downturn combined with another feedstock spike, which would squeeze margins and delay investment in specialty grades. Margins follow sourcing discipline. Buyers review suppliers every season. Batch records protect future sales.

Chinese Capacity, VOC Rules, and High-Purity Grades Set Acetate Ester Outcomes

Acetate ester production starts with acetic acid, made from methanol and carbon monoxide at large acetyl chain sites, and alcohols such as ethanol, butanol, and isopropanol. Reactors combine them over acid catalysts, distillation columns separate water and impurities, and tanks store the finished ester. Tankers, isotanks, and drums move product to paint, ink, adhesive, and pharmaceutical customers. Integration with acetic acid decides cost position.
MARKET CONCENTRATION34% CR5Leading five producers hold a low combined share
CHINESE CAPACITY SHARE58%Portion of global ethyl acetate capacity located in China
FEEDSTOCK COST SHARE78%Portion of goods cost taken by acetic acid and alcohols
COATINGS AND INKS SHARE46%Portion of ester demand used in coatings and inks
CAPACITY UTILISATION71%Typical share of installed ester capacity running each year
EXPORT INTENSITY22%Portion of output traded across borders rather than consumed locally
Purity, water content, odour, and evaporation rate decide value. Coatings and ink makers buy on price and consistency, while pharmaceutical and electronics buyers set tight specifications, and high-purity lots earn premiums of 40% to 150% over industrial grade. Integrated producers win on cost, and specialists win on quality. Suppliers with audited plants win, since regulated buyers inspect closely. Audits repeat yearly.
Buyers judge acetate esters on cost, performance, and compliance. Coatings makers want fast drying at low cost, ink makers want flexo and gravure performance, and pharmaceutical makers want residual solvent compliance. Price sensitivity is high in industrial grade, since ethyl and butyl acetate trade like commodities, though substitutes such as ketones and glycol ethers cap prices only where regulations allow. Delivery reliability matters.
"Ethyl acetate is priced like a commodity and bought like a compliance product. The tonnes are in coatings and inks, but the profit is in the few thousand tonnes that go into a chip fab or a drug plant, where a metal specification matters more than a price per tonne."
Senior Analyst, Industrial Solvents and Specialty Chemicals Practice · MMA Acetic Acid Esters Practice · September 2026

Market Trends

Semiconductor and Display Makers Specify High-Purity Acetate Solvents

Semiconductor, display, and photoresist makers use high-purity ethyl and butyl acetate for cleaning, thinning, and coating steps, and they set limits of parts per billion on metals and tight moisture specifications. Electronic and High-Purity Grade Acetate Esters grow about 8.6% a year, and qualified lots sell at premiums of 40% to 150% over industrial grade. The trend needs purification and cleanroom packaging and rewards early qualifiers. Cost control separates leaders from followers. Clear specifications build buyer trust. Small importers feel every input swing. Technical reach compounds over time. Brands reward consistency over novelty.
Market Impact: flexible packaging grows 5-6% yearly
Bio-Based Ethyl Acetate Wins Brand Owner Sustainability Programmes

Brand owners in food packaging, cosmetics, and household goods set targets for bio-based content and lower carbon footprint, and ethyl acetate made from bioethanol meets them for inks and adhesives. Bio-Based and Low-Carbon Grade Acetate Esters grow about 7.4% a year, and certified lots add 10% to 25% to realised price. The trend needs bioethanol access and certification and rewards producers integrated with sugarcane or corn ethanol. Supply contracts decide renewal. Delivery reliability decides supplier rankings. Margins follow sourcing discipline. Buyers review suppliers every season. Batch records protect future sales. Cost control separates leaders from followers.
Market Impact: pharma grade grows 5.6% yearly

Market Opportunities and Growth Drivers

Flexible Packaging and Adhesive Growth Sustains Asian Demand

Flexible packaging, laminating adhesives, and gravure inks use ethyl and n-propyl acetate for fast drying and good solvency, and Asian packaging output is growing as food and e-commerce volumes rise. Flexible packaging demand grows 5% to 6% a year in Asia. The driver sustains steady industrial grade volume and rewards producers with cost position, reliable supply, and logistics that serve many converters across large countries. Clear specifications build buyer trust. Small importers feel every input swing. Technical reach compounds over time. Brands reward consistency over novelty. Supply contracts decide renewal. Delivery reliability decides supplier rankings.
Market Impact: utilisation near 71% squeezes margins

Pharmaceutical Solvent Substitution Favours Lower-Toxicity Esters

Pharmaceutical makers replace higher-toxicity solvents such as toluene, dichloromethane, and some ketones with ethyl and isopropyl acetate, which fall in lower residual solvent classes under ICH Q3C guidance. Pharmaceutical Grade Acetate Esters grow about 5.6% a year, and pharmaceutical lots earn gross margins of 25% to 35%. The driver sustains steady demand and rewards producers with documented quality systems and audit-ready plants. Margins follow sourcing discipline. Buyers review suppliers every season. Batch records protect future sales. Cost control separates leaders from followers. Clear specifications build buyer trust. Small importers feel every input swing.
Market Impact: solvent-borne share falls 1-2 points yearly

Market Restraints and Challenges

Chinese Overcapacity Compresses Commodity Ester Margins

Chinese producers hold about 58% of global ethyl acetate capacity and utilisation across the industry runs near 71%, which keeps industrial grade prices low and pushes exports into Asia, Europe, and Latin America. The root cause is fast capacity additions ahead of demand. Producers respond with specialty grades, integration, and exports, though smaller plants outside China run below cost in weak years. Technical reach compounds over time. Brands reward consistency over novelty. Supply contracts decide renewal. Delivery reliability decides supplier rankings. Margins follow sourcing discipline. Buyers review suppliers every season. Batch records protect future sales.
Market Impact: electronic grade grows 8.6% yearly

VOC Rules Push Coatings Toward Waterborne and Exempt Solvents

VOC limits in the United States, European Union, and China push coatings makers toward waterborne systems and exempt solvents, and the solvent-borne share of coatings falls by one to two points a year in mature markets. The root cause is air quality regulation. Producers respond with methyl acetate and tert-butyl acetate blends where exemptions apply, though ethyl and butyl acetate demand in coatings still erodes. Cost control separates leaders from followers. Clear specifications build buyer trust. Small importers feel every input swing. Technical reach compounds over time. Brands reward consistency over novelty.
Market Impact: bio-based grade grows 7.4% yearly
3 additional market trends, 2 additional growth drivers, and 4 additional restraints and challenges are covered in the full report. Contact sales@marketmindsadvisory.com to access the complete intelligence.

Segment CAGR and Growth Architecture

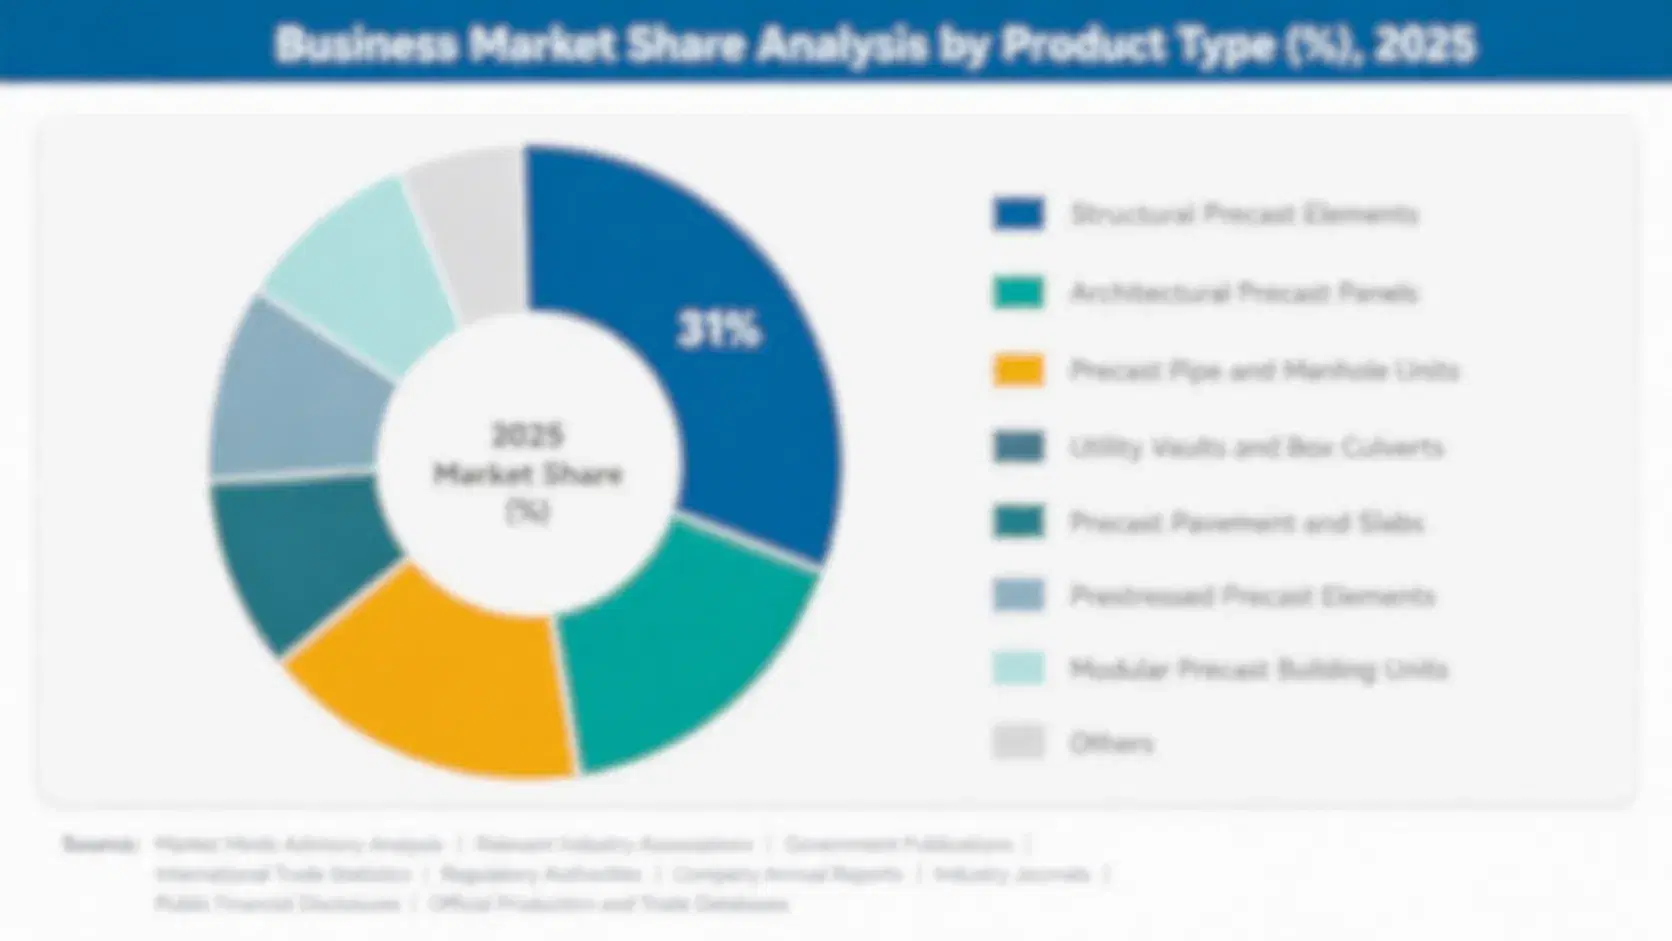
The global acetic acid esters market is segmented by grade, which shows where purity and certification create pricing power. Five segments cover industrial solvent grade, food and flavour grade, pharmaceutical grade, electronic and high-purity grade, and bio-based and low-carbon grade. Electronic and bio-based grades grow fastest as semiconductor demand and brand owner targets outpace mature coatings volumes.
acetic-acid-esters-of-mono-and-diglycerides-of-fat-market-share-analysis-1789845302406

Electronic and High-Purity Grade Acetate Esters

Electronic and High-Purity Grade Acetate Esters is the fastest-growing segment at 8.6% a year, about 1.95 times the overall market rate, from a small base. Semiconductor, display, and photoresist makers need ultra-clean solvents, and premiums of 40% to 150% over industrial grade support gross margins of 30% to 42%. Purification cost and qualification cycles are the main constraints. Producers with cleanroom packaging and metal control win. Supply contracts decide renewal. Delivery reliability decides supplier rankings. Margins follow sourcing discipline. Buyers review suppliers every season. Batch records protect future sales. Cost control separates leaders from followers. Clear specifications build buyer trust. Small importers feel every input swing. Technical reach compounds over time. Brands reward consistency over novelty.
CAGR 8.6%

Bio-Based and Low-Carbon Grade Acetate Esters

Bio-Based and Low-Carbon Grade Acetate Esters grows at 7.4% a year, because brand owners in packaging, cosmetics, and household goods set bio-based content targets, and buyers accept premiums that add 10% to 25% to realised price. Bioethanol access and certification cost are the main constraints, since supply concentrates in Brazil, India, and the United States. Producers with integrated ethanol supply hold price better than followers. Supply contracts decide renewal. Delivery reliability decides supplier rankings. Margins follow sourcing discipline. Buyers review suppliers every season. Batch records protect future sales. Cost control separates leaders from followers. Clear specifications build buyer trust. Small importers feel every input swing. Technical reach compounds over time. Brands reward consistency over novelty.
CAGR 7.4%
Full segment breakdown across 5 segments available in the complete report.

Regional Architecture and Country Demand Map

East Asia holds the largest share because China dominates ethyl and butyl acetate capacity and Korean, Japanese, and Taiwanese fabs buy high-purity grades, so its share sits far above the usual band. North America sits below its band on flat coatings demand. Western Europe, South Asia and Pacific.

East Asia

East Asia holds 40% share, far above its usual band, because the value sits where the plants and buyers are: China holds roughly 58% of ethyl acetate capacity through producers such as Yip's Chemical and many Shandong, Jiangsu, and Guangdong plants, Japan's Daicel and Resonac supply high-purity grades, and Korean and Taiwanese fabs buy electronic grade. Growth exceeds the global rate as semiconductor and packaging output rises. Overcapacity, VOC rules, and feedstock swings restrain margins, while exports and high-purity mix lift returns. Supply contracts decide renewal. Delivery reliability decides supplier rankings. Margins follow sourcing discipline. Buyers review suppliers every season. Batch records protect future sales. Cost control separates leaders from followers. Clear specifications build buyer trust.
Share: 40% | CAGR: 5.4% (2026 to 2036)

North America

North America holds 20% share, below its usual band, because domestic ester output is modest and coatings, ink, and adhesive demand has stayed flat while VOC rules push formulators toward waterborne and exempt solvents. Eastman, Celanese, Dow, and LyondellBasell supply the region, and imports from Asia fill gaps. Growth runs slightly below the global rate. EPA VOC rules, acetic acid cost, and import competition restrain margins, and producers respond with pharmaceutical and electronic grades and methyl acetate as an exempt solvent. Small importers feel every input swing. Technical reach compounds over time. Brands reward consistency over novelty. Supply contracts decide renewal. Delivery reliability decides supplier rankings. Margins follow sourcing discipline. Buyers review suppliers every season.
Share: 20% | CAGR: 4.0% (2026 to 2036)
Regional intelligence for 5 additional markets available in the complete report: Western Europe, South Asia and Pacific, Latin America, Middle East and Africa, Eastern Europe. Contact sales@marketmindsadvisory.com.
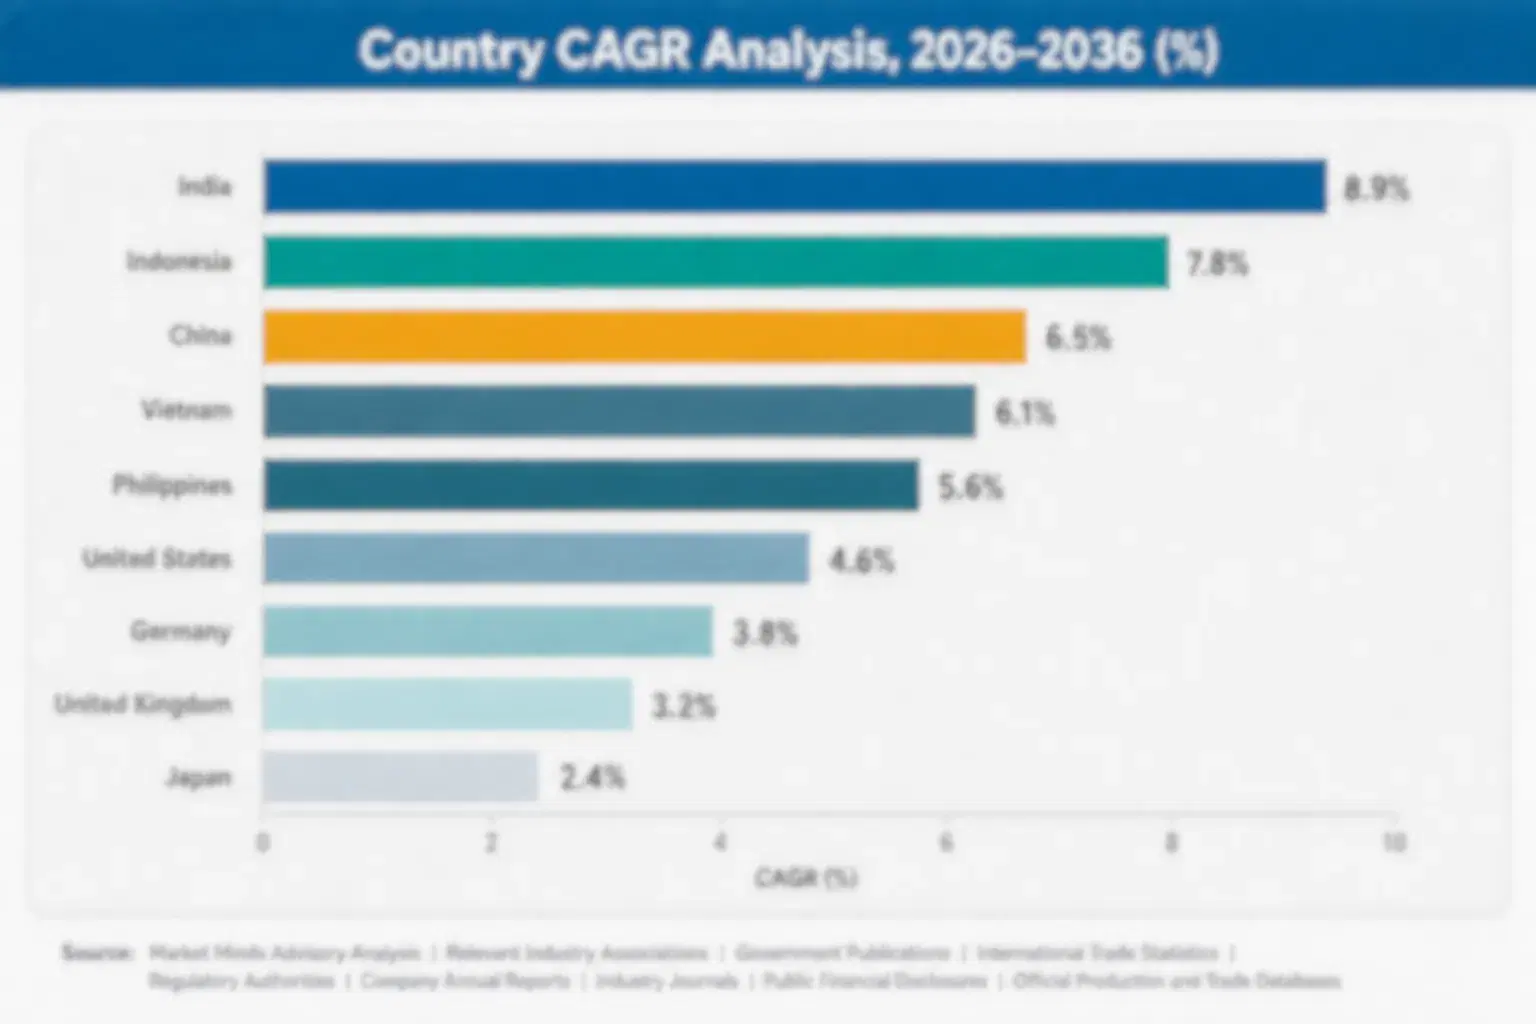
acetic-acid-esters-of-mono-and-diglycerides-of-fat-country-cagr-analysis-1789845302756

Four Margin Routes for Acetate Ester Producers

Margin in acetate esters comes from high-purity grades, feedstock integration, bio-based supply, and VOC compliance support rather than commodity volume. The routes below apply to integrated acetyl producers, regional solvent makers, and distributors, and each can start inside one planning cycle, with clear measures in gross margin points, cost per tonne, and customer programmes served.

Investing in Electronic Grade Purification and Metal Control

Electronic grade esters earn premiums of 40% to 150% over industrial grade and gross margins of 30% to 42% against 8% to 14%, so producers that add distillation, filtration, and cleanroom packaging report gross margin gains of 3 to 6 points on the mix. Lines cost $10 million to $30 million each. Qualification with two fabs or photoresist makers confirms demand. Cost control separates leaders from followers. Clear specifications build buyer trust. Small importers feel every input swing. Technical reach compounds over time. Brands reward consistency over novelty. Supply contracts decide renewal.
Market Impact: electronic grade earns premiums of 40-150% over industrial

Integrating Backward Into Acetic Acid and Alcohol Feedstocks

Acetic acid and alcohols take about 78% of cost, so producers that secure acetic acid through integration or long contracts cut feedstock cost by 5% to 10% per tonne. Integration projects cost $20 million to $100 million, while contracts need index clauses and volume commitments. Producers should start with contracts, add index terms to customer agreements, and consider joint ventures with acetic acid producers. Delivery reliability decides supplier rankings. Margins follow sourcing discipline. Buyers review suppliers every season. Batch records protect future sales. Cost control separates leaders from followers. Clear specifications build buyer trust.
Market Impact: integration cuts feedstock cost by 5-10% per tonne

Building Bio-Based Ester Lines Linked to Bioethanol Supply

Bio-based ethyl acetate adds 10% to 25% to realised price per tonne, so producers that secure bioethanol from Brazil, India, or the United States and certify bio-based content win brand owner programmes in inks and adhesives. Lines cost $5 million to $15 million each. Producers should sign programmes with two brand owners, document carbon footprints, and expand as demand is confirmed. Small importers feel every input swing. Technical reach compounds over time. Brands reward consistency over novelty. Supply contracts decide renewal. Delivery reliability decides supplier rankings. Margins follow sourcing discipline. Buyers review suppliers every season.
Market Impact: bio-based premiums add 10-25% to realised price per tonne

Adding Methyl Acetate and Exempt-Solvent Blends for VOC-Regulated Buyers

VOC rules push coatings makers toward exempt solvents, so producers that offer methyl acetate and tert-butyl acetate blends and compliance data protect volume. Exempt blends protect 10% to 20% of coatings volume that might otherwise switch to waterborne systems. Blend development costs $0.5 million to $2 million. Producers should target regulated regions first, publish evaporation and solvency data, and support customer reformulation trials. Batch records protect future sales. Cost control separates leaders from followers. Clear specifications build buyer trust. Small importers feel every input swing. Technical reach compounds over time. Brands reward consistency over novelty.
Market Impact: exempt solvent blends protect 10-20% of coatings volume

Who Controls the Margin Pool

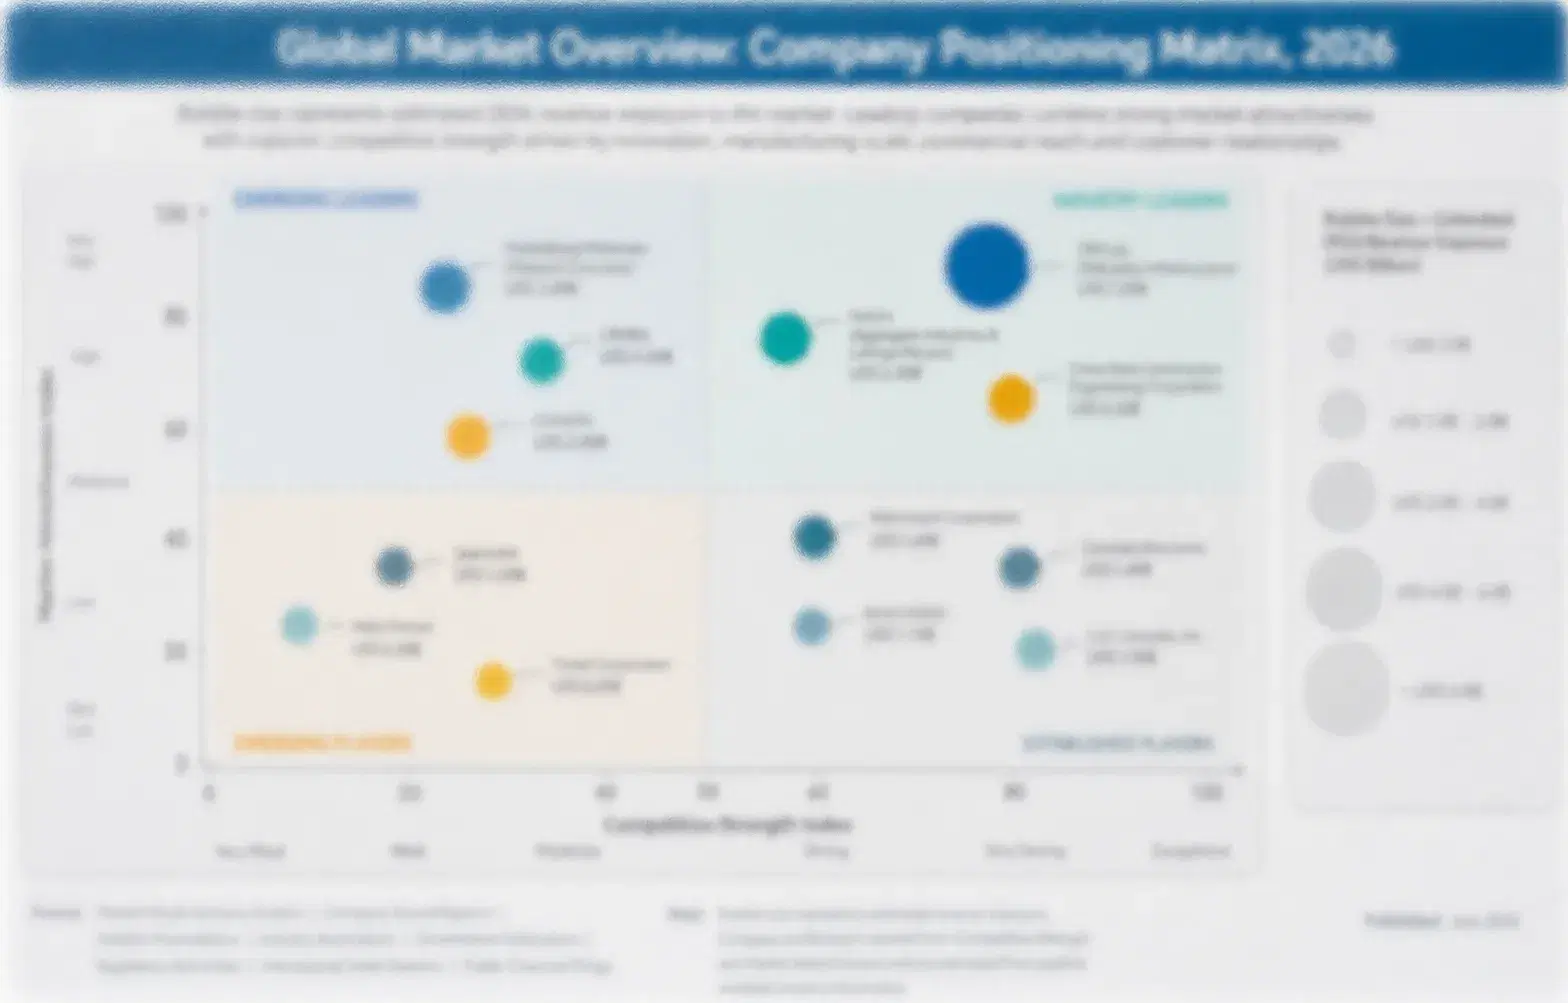
The global acetic acid esters market is fragmented at the tail and concentrated at the top, with a CR5 of 34%, and hundreds of Chinese plants, regional producers, and distributors sit outside the leading five. This assessment measures participants on estimated acetate ester production capacity, held constant across all players. Celanese leads through integrated acetyl chain scale, while Eastman Chemical, INEOS, Sasol, and Resonac follow, with a clear gap between
Competition runs on four dimensions today: acetic acid integration and cost, plant scale and utilisation, purity and specialty grade breadth, and logistics. Integrated Western producers win on reliability and grades, while Chinese plants win on price and volume. Imitators copy industrial grade quickly, so premiums outside electronic and bio-based grades erode within a season, and price competition appears in bulk ethyl and butyl acetate. Supply contracts decide renewal.

Emerging pressure comes from Chinese producers moving into high-purity grades, bio-based entrants linked to sugarcane ethanol, and coatings makers switching to waterborne systems. Rankings shift where a producer wins fab qualification, secures brand owner programmes, or closes an inefficient plant. Chinese producers can move up quickly, since scale can outweigh legacy brands. Delivery reliability decides supplier rankings.
acetic-acid-esters-of-mono-and-diglycerides-of-fat-company-positioning-matrix-1789845303071

Competitive Moat and Risk Dimensions

CELANESE

Moat: Integrated Acetyl Chain Scale

Celanese, a US chemicals group, makes acetic acid and downstream acetyl products at large integrated sites in the United States, Europe, and Asia, which gives it low-cost feedstock for ester production. Its scale, logistics network, and long customer relationships give it cost defensibility, and its position supports steady contracts with coatings, ink, and adhesive makers across regions.
CELANESE

Risk: Commodity Price Exposure

Celanese depends heavily on commodity grades exposed to Chinese overcapacity and VOC-driven demand decline in mature markets. Rivals with specialty purity and bio-based positions can win higher-margin programmes. Margins follow sourcing discipline. Buyers review suppliers every season. Batch records protect future sales. Cost control separates leaders from followers.
EASTMAN CHEMICAL

Moat: Specialty Ester and Solvent Breadth

Eastman Chemical, a US specialty materials company, sells a broad range of acetate esters and other solvents from integrated sites and serves coatings, adhesive, and pharmaceutical customers. Its technical service, product breadth, and regulatory support give it credibility, and its ability to supply several solvents together helps formulators manage VOC compliance across regions.
EASTMAN CHEMICAL

Risk: Portfolio Focus Trade-Offs

Eastman treats acetate esters as one part of a wide portfolio, so capital may favour higher-growth materials. Focused rivals in high-purity and bio-based grades can win specialist programmes. Clear specifications build buyer trust. Small importers feel every input swing. Technical reach compounds over time. Brands reward consistency over novelty.

Players Tracked

Prominent Players

Celanese
Eastman Chemical
INEOS
Sasol
Resonac

Other Key Players

BASF
Dow
Mitsubishi Chemical Group
Daicel
Sekab
Godavari Biorefineries
Jubilant Ingrevia
Yip's Chemical
Merck
Brenntag
Univar Solutions
Kanto Chemical
SABIC
Shell Chemicals
LyondellBasell

Recent Developments

JANUARY 2026

Celanese Extends Ethyl Acetate Supply Agreements With Coatings and Ink Distributors

Celanese extended ethyl acetate supply agreements with coatings and ink distributors, fixing volumes and index-linked pricing for the year. It is a supply agreement programme, not an acquisition, and it tests whether index terms can steady margins. Volumes were not disclosed. Supply contracts decide renewal. Margins follow sourcing discipline.
Signal: Suggests integrated producers are locking in volumes with index pricing to defend margins against Chinese export competition.
FEBRUARY 2026

Eastman Expands High-Purity Solvent Offering for Electronics and Pharmaceutical Customers

Eastman expanded its high-purity solvent offering for electronics and pharmaceutical customers, adding grades with tighter metal and water limits. It is a product range extension, and it tests premium pricing for qualified lots. Sales volumes were not disclosed. Buyers review suppliers every season. Batch records protect future sales.
Signal: Indicates Western producers are moving steadily toward high-purity grades where quality, not price, decides supplier selection.
MARCH 2026

Godavari Biorefineries Expands Bio-Based Ethyl Acetate Capacity in India

Godavari Biorefineries expanded bio-based ethyl acetate capacity in India, using its own sugarcane ethanol supply. It is organic capacity expansion, and it tests whether integrated bioethanol can win brand owner programmes. Volumes were not disclosed. Cost control separates leaders from followers. Clear specifications build buyer trust.
Signal: Shows Indian producers are using bioethanol integration to build bio-based ester supply for export and brand owner programmes.

What Drives Acetate Ester Production Costs

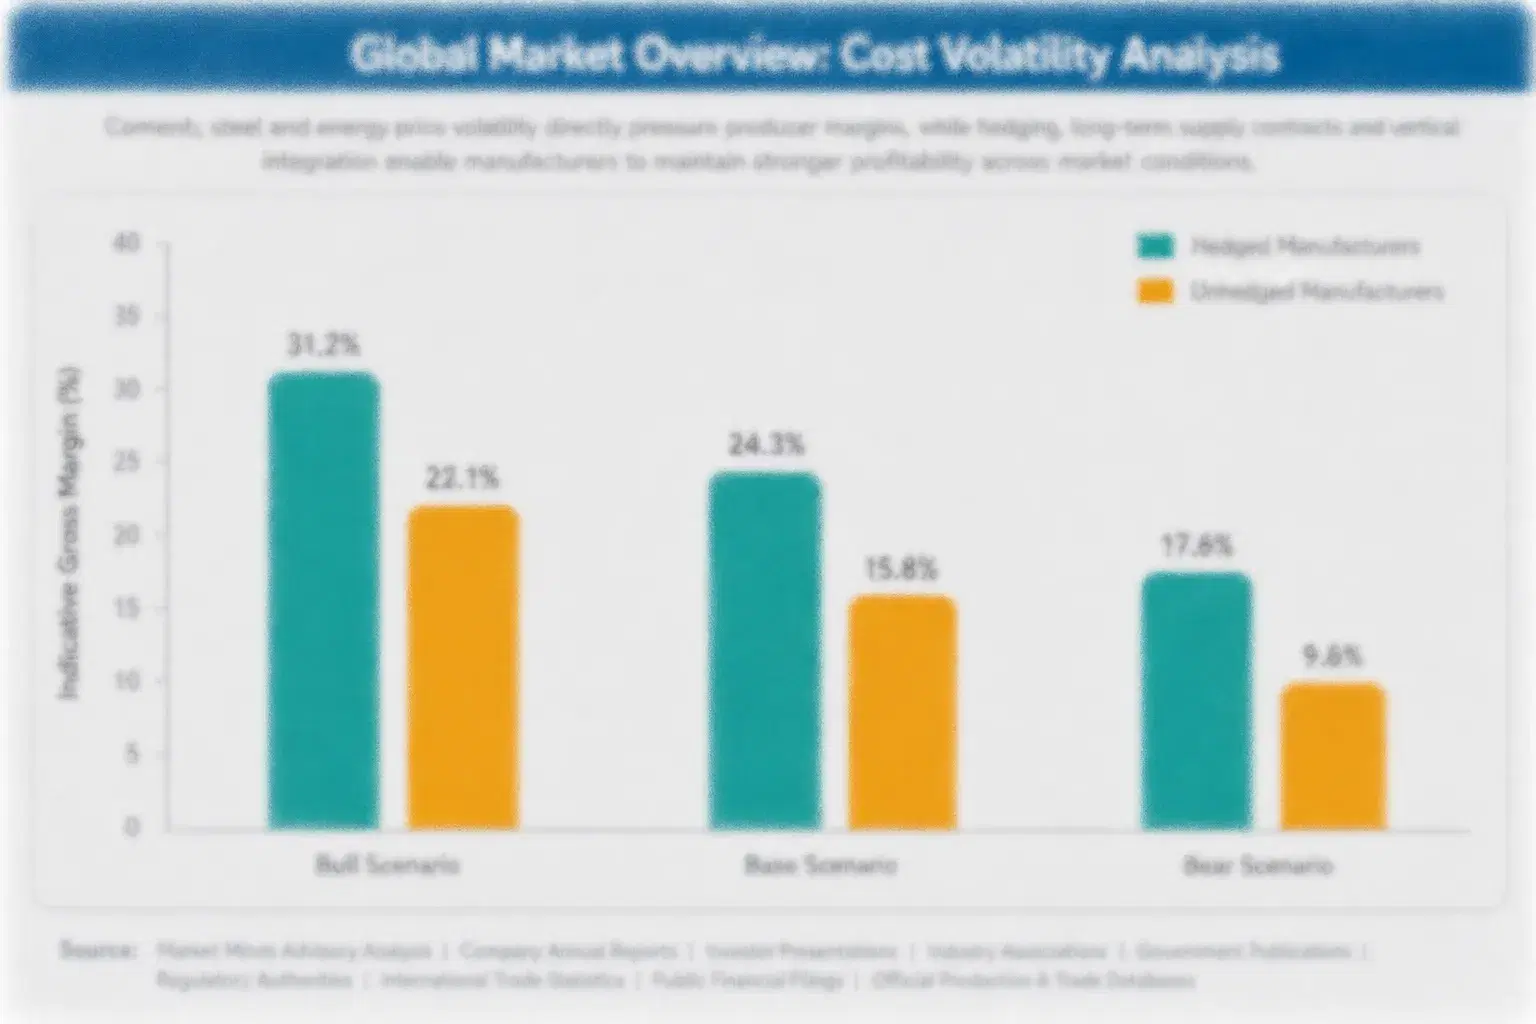
Acetic acid and alcohols account for roughly 78% of cost of goods, with acetic acid about 45% and ethanol, butanol, or isopropanol about 33%, while energy takes about 8%, catalysts and utilities about 3%, and labour and maintenance about 5%. Acetic acid comes from methanol and carbon monoxide plants in the United States, China, and Europe, and ethanol from sugarcane and corn.
The clearest recent shock came from energy and feedstock. European gas prices surged in 2022, as the IEA reported, acetic acid and butanol prices swung with methanol and propylene, and Eastman noted in its 2023 Form 10-K that raw material and energy costs affected results. Producers raised prices by 8% to 15% and some cut runs at high-cost sites. Delivery reliability decides supplier rankings. Margins follow sourcing discipline.

The competitive disadvantage falls on non-integrated producers, which buy acetic acid and alcohols at market prices, run smaller plants, and lack logistics scale. Integrated producers hold internal transfer prices and spread costs across many products. Exposure also varies by geography, since European plants carry high energy cost while Chinese plants face feedstock swings and environmental limits. Buyers review suppliers every season.
acetic-acid-esters-of-mono-and-diglycerides-of-fat-cost-volatility-analysis-1789845303445

Securing Acetic Acid Through Contracts or Integration

Producers secure acetic acid through long contracts, joint ventures, or integration and add index clauses to customer agreements. Contracts cut spot purchases by roughly half, and index clauses cut margin swings by 10% to 20% in volatile years. The main challenge is capital and volume commitment, so smaller producers rely on contracts and toll arrangements.

Improving Energy Efficiency and Heat Integration

Producers invest in heat integration, reactive distillation, and efficient columns that cut steam use per tonne. Upgrades cut energy cost by 10% to 20% and reduce emissions. Payback runs three to six years, so larger producers invest first, while smaller plants rely on incentives, shared services, and consolidation to survive weak demand. Batch records protect future sales.

Shifting Mix Toward High-Purity and Bio-Based Grades

Producers shift mix toward high-purity, pharmaceutical, and bio-based grades that carry higher margins and hold price against Chinese industrial grade. Mix shift cuts commodity exposure by 15% to 30%. The main challenge is qualification and certification time, so producers start early, sign development partnerships, and document quality systems and carbon footprints. Cost control separates leaders from followers.

Portfolio Architecture for Margin Defence

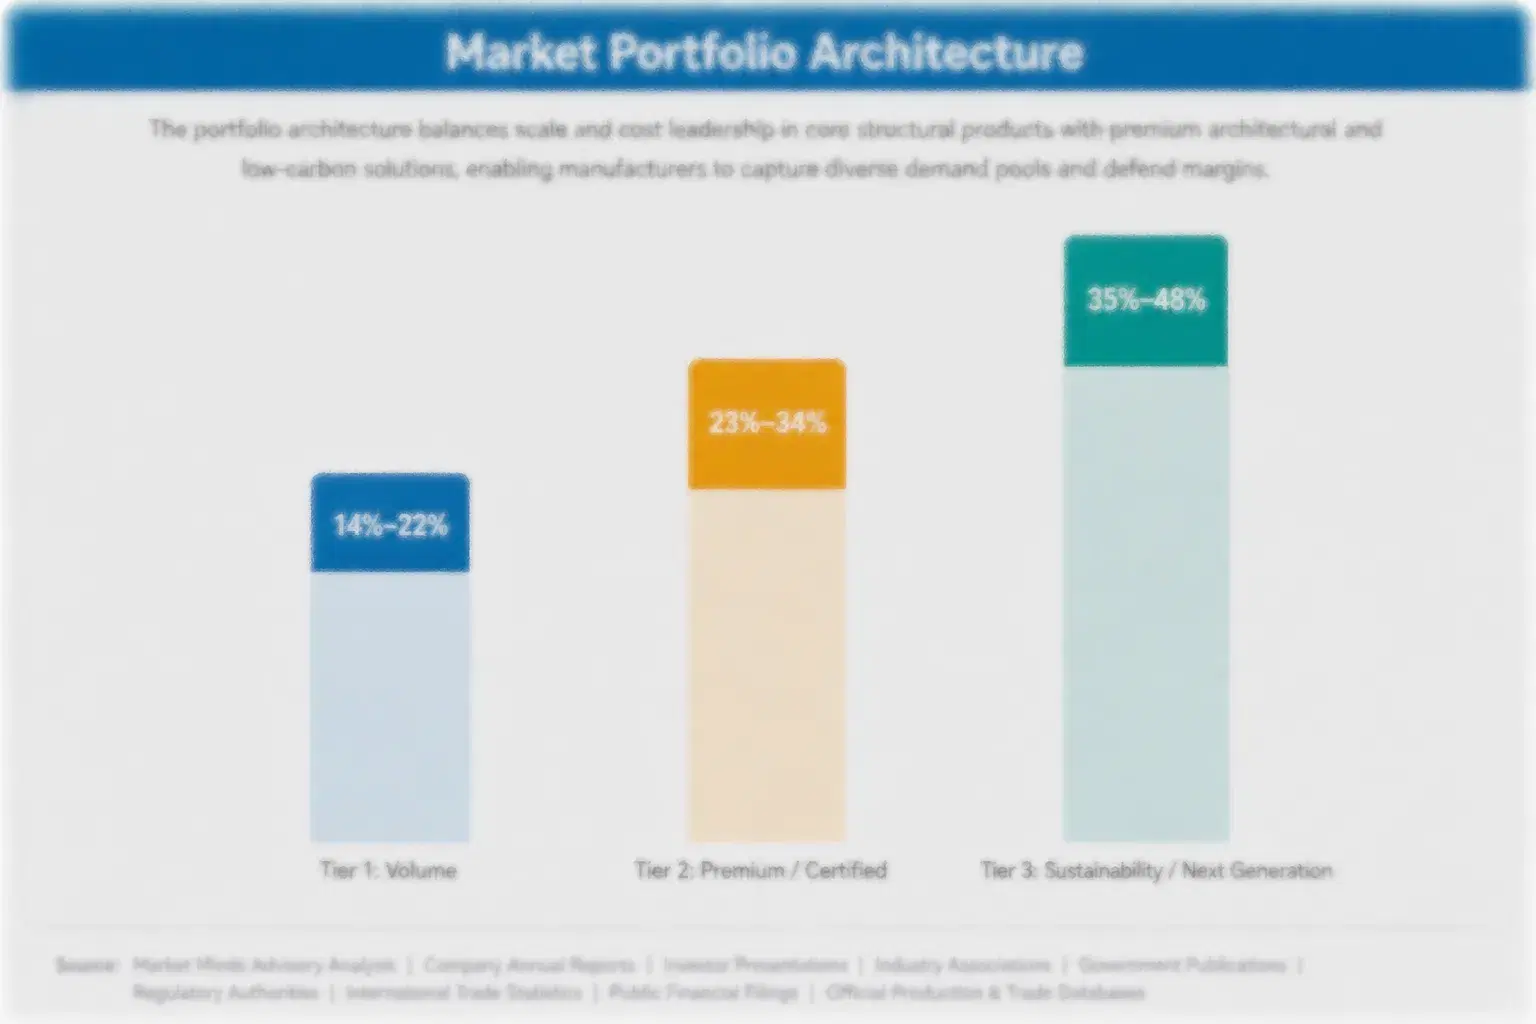
Margins run from thin returns on industrial ethyl and butyl acetate sold in bulk to strong returns on electronic, pharmaceutical, and bio-based grades sold with certification. Three tiers separate volume products, certified premium lines, and next-generation formats, and each tier draws on different customer groups, feedstock positions, and qualification paths in a mature market. Small importers feel every input swing.
The tension between volume and premium is sharp. Industrial grade protects plant utilisation and distributor relationships but faces constant price pressure from Chinese exports and feedstock swings, while electronic and bio-based grades earn higher margins on smaller volumes and depend on purification skill, certification, and customer trust. Producers that run only volume struggle to fund purification lines, while producers that run only premium lack the volume to cover fixed cost.

High-value pools concentrate in electronic and high-purity grades sold to semiconductor and display makers and in bio-based grades sold to packaging brand owners. They gather where buyers pay for metal control, certification, and carbon data rather than tonnes. Pharmaceutical grades add further value, since regulated buyers ask for documented quality systems and reliable supply. Technical reach compounds over time.

Volume / Commodity-Adjacent Tier

Industrial ethyl, butyl, and propyl acetate sold in bulk and by tanker to coatings, ink, and adhesive makers under annual contracts at thin margins, with feedstock exposure and price competition from Chinese exports.
Gross Margin: 6%-14%

Premium / Certified Tier

Pharmaceutical and food and flavour grade esters with documented composition, low residual impurities, and audit certificates, sold to regulated customers that require reliable delivery and quality records. Brands reward consistency over novelty. Supply contracts decide renewal.
Gross Margin: 20%-32%

Sustainability / Regulatory / Next-Generation Tier

Electronic and high-purity grades and bio-based esters with metal control, cleanroom packaging, and certified bio-based content, sold to fabs and brand owners that pay premiums for verified performance. Delivery reliability decides supplier rankings.
Gross Margin: 30%-42%
acetic-acid-esters-of-mono-and-diglycerides-of-fat-portfolio-architecture-1789845303775

High-value Sub-segments and Strategic Watch-out

Electronic and High-Purity Grade Acetate Esters

Electronic and high-purity grade acetate esters combine the fastest growth with strong pricing, since semiconductor and display makers pay 40% to 150% premiums over industrial grade for ultra-clean solvents. Purification cost and qualification cycles limit competition, and producers with cleanroom packaging win. Volume compounds as fab capacity expands.
Gross Margin: 30%-42%

Bio-Based and Low-Carbon Grade Acetate Esters

Bio-based and low-carbon grade acetate esters deliver strong growth and premium pricing, since packaging brand owners pay 10% to 25% above conventional price for certified bio-based content. Bioethanol access and certification form the entry barrier, and producers with integrated ethanol win. Repeat supply builds through multi-year programmes.
Gross Margin: 22%-34%

Industrial Solvent Grade Acetate Esters

Industrial solvent grade acetate esters are the volume core, sold to coatings, ink, and adhesive makers at thin margins under annual contracts. Value grows about 3.6% a year, and feedstock cost, Chinese exports, and delivery reliability decide profit. Producers anchor sales on long contracts with large converters and distributors.
Gross Margin: 6%-14%

Food and Flavour Grade Acetate Esters

Food and flavour grade acetate esters are the strategic watch-out, since growth of about 4.8% a year is only modestly above the market, volumes are small, and certification cost limits returns. Producers should manage this line for steady cash and redirect capacity toward higher-value pharmaceutical and electronic grades.
Gross Margin: 16%-26%

Why Converters Keep Reordering Acetates

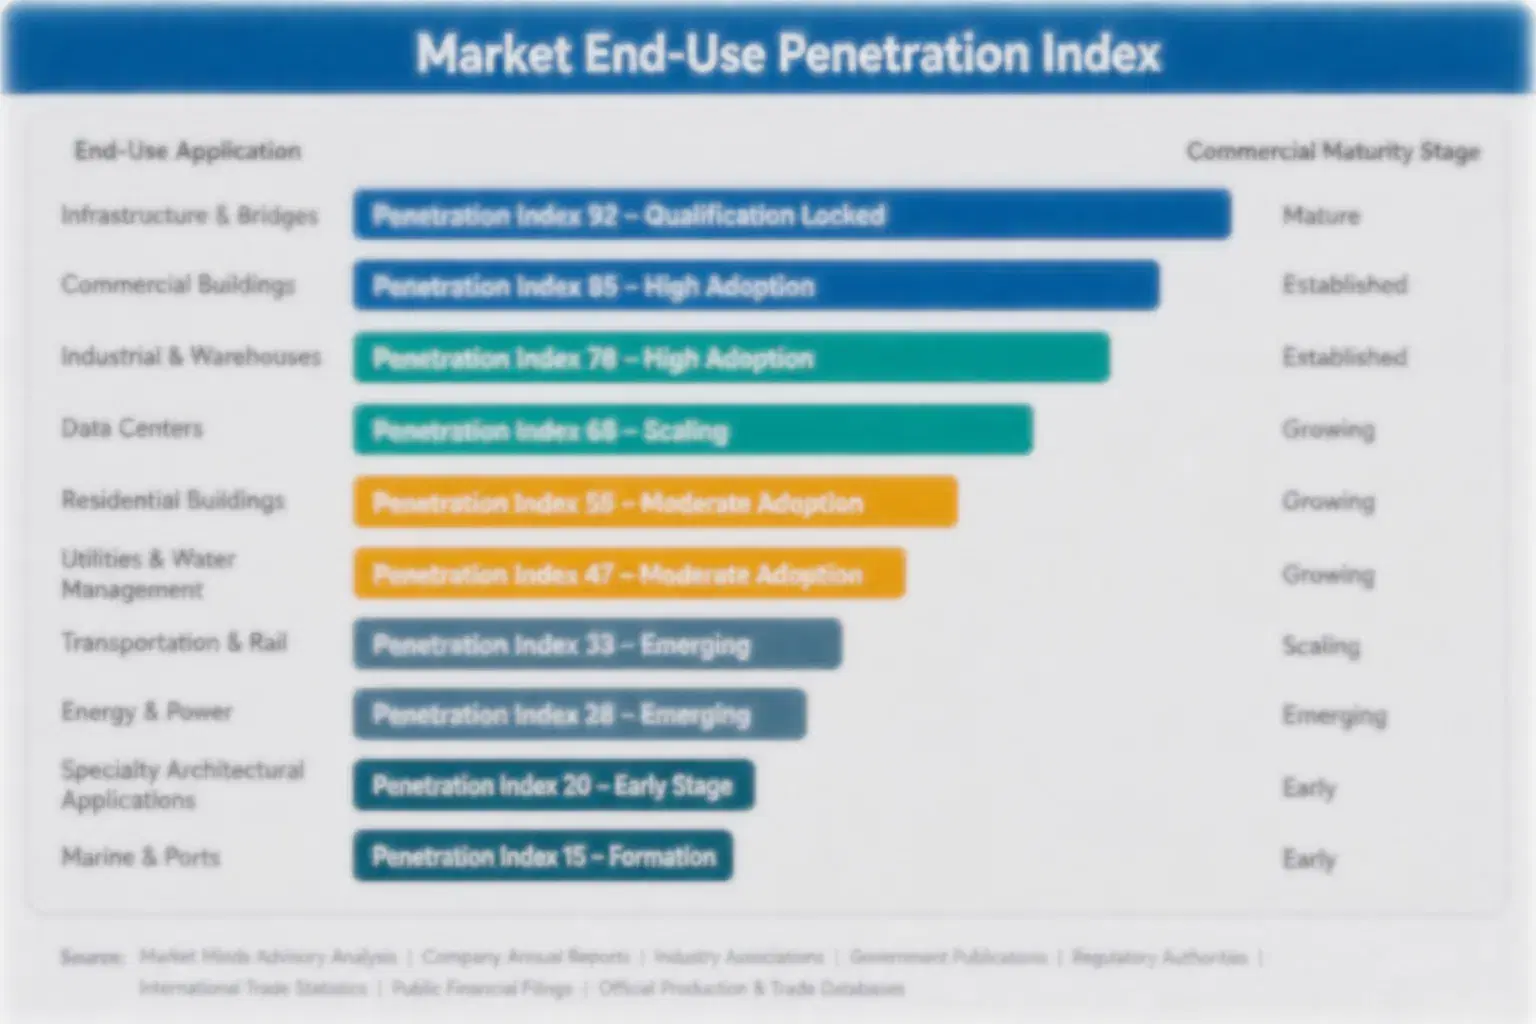
Acetate ester demand behaves like an annuity attached to approved coatings, ink, and adhesive formulas. Once a converter qualifies a grade whose evaporation rate, purity, and documentation it trusts, it repeats the order every month, and switching means new press trials and possible compliance updates. Buyers use last quarter's audit results and delivery record to fix renewals, so producers with clean records earn steadier volume than sellers reliant
Adoption stickiness differs by end-use vertical. Pharmaceutical and electronics makers are the deepest, since solvents are written into validated processes and change only when supply or quality fails. Flexible packaging and ink makers follow press trials. Coatings and adhesive makers are moderate and switch on cost, while industrial cleaning buyers are shallow and switch on price. Margins follow sourcing discipline. Buyers review suppliers every season.

Buyer profiles are shifting between generations. Older buyers bought solvents on price and long relationships, while younger procurement teams ask for carbon data, bio-based certificates, dual sourcing, and clean documentation. Brand owners add a third group that demands sustainability proof from suppliers. Producers that publish carbon footprints and offer fast sampling win younger buyers and keep them as regulation tightens.
acetic-acid-esters-of-mono-and-diglycerides-of-fat-end-use-penetration-index-1789845304088

MMA Verdict on Acetate Ester Strategy

These are among the four positions where our research anticipates prominent divergence between winners and laggards over the coming forecast period. Each is grounded in the demand model, the regulatory perimeter, and the announced capacity pipeline.
01 / ELECTRONIC GRADE POSITIONING

Build Electronic Grade Purification Before Fabs Standardise on Rival Solvent Suppliers

Electronic and High-Purity Grade Acetate Esters grows at 8.6% a year, about 1.95 times the overall market rate, and producers that add purification, metal control, and cleanroom packaging earn premiums of 40% to 150% over industrial grade. Winners will invest $10 million to $30 million per line and qualify with two fabs or photoresist makers each year. Producers with only industrial grade will fight on price, and rivals with qualified electronic grades will capture the fastest-growing programmes across the forecast decade.
02 / FEEDSTOCK INTEGRATION STRATEGY

Integrate Into Acetic Acid Before Feedstock Swings Erode Ester Margins Again

Acetic acid and alcohols take about 78% of cost of goods and prices swung 20% to 50% in recent years, while Chinese overcapacity keeps selling prices under pressure. Producers should secure acetic acid through integration or long contracts, add index clauses to customer contracts, and invest $5 million to $20 million in efficiency, cutting feedstock cost by 5% to 10% per tonne. Those that buy on the spot market will absorb 3% lower margins in swing years, and integrated producers will hold price, supply, and customer trust.
03 / BIO-BASED ESTER STRATEGY

Link Ester Production to Bioethanol Before Brand Owners Set Sourcing Rules

Bio-Based and Low-Carbon Grade Acetate Esters grows at 7.4% a year and sells at premiums that add 10% to 25% to realised price, while brand owners set sustainability targets for packaging inks and adhesives. Producers should secure bioethanol from Brazil, India, or the United States, certify mass balance or bio-based content, invest $5 million to $15 million per line, and sign programmes with two brand owners. Those that wait will find sourcing rules set by rivals, and producers with certified lines will hold premiums and accounts.
04 / VOC COMPLIANCE STRATEGY

Offer Exempt Solvent Blends Before Coatings Buyers Switch to Waterborne Systems

VOC rules in the United States, European Union, and China push coatings makers toward waterborne and exempt solvents, and the solvent-borne share falls by one to two points a year. Producers should offer methyl acetate and tert-butyl acetate blends where regulators exempt them, support customers with compliance data, and keep ethyl and butyl acetate for uses that cannot change, protecting 10% to 20% of coatings volume. Those that ignore the rules will lose accounts as formulas change, and producers with compliance support will hold price and loyalty.

Engagement Snapshot From the Field

A live engagement with an industry participant carrying material or product regulatory and market exposure ahead of a defining policy shift, showing how our research translates into a defensible multi-year portfolio strategy.
MARKET MINDS ADVISORY · CLIENT ENGAGEMENT SUMMARY
Acetic Acid Esters Producer Strategic Portfolio Review and Transition Roadmap 2026·Investment Scenario on Acetic Acid Esters Exposure Evaluation 2025-26
CLIENT PROFILE
The client is a mid-sized European solvent distributor and blender with annual sales near $180 million (client-reported, unverified by MMA), selling ethyl and butyl acetate to coatings, ink, and adhesive customers. It bought industrial grade on spot terms, had no high-purity range, and had two customers accounting for 42% of ester sales. Batch records protect future sales.
STRATEGIC CHALLENGE
Coatings customers were shifting to waterborne systems, Asian imports had cut industrial grade margins by a third, and pharmaceutical customers were asking for certified grades. Management needed to decide whether to build a high-purity line, add exempt solvent blends, or sign a bio-based supply agreement, with limited capital and one terminal. Cost control separates leaders from followers.
MMA APPROACH
MMA analysed sales, cost, and customer data across 26 products, interviewed 12 coatings, ink, and pharmaceutical buyers, five producers, and four regulatory advisers, and ran a buyer survey on purity, compliance, and price across three countries. It modelled margin by grade and customer, tested feedstock scenarios, and ranked options by payback and execution risk.
KEY FINDINGS
  1. A pharmaceutical and high-purity range could reach 15% of ester sales in three years at margins near 30% (client-reported, unverified by MMA). Clear specifications build buyer trust.
  2. Index-linked supply contracts and a second source would cut cost volatility by about a third across the range. Small importers feel every input swing.
  3. Exempt solvent blends would protect about 12% of coatings volume at risk from waterborne switching. Technical reach compounds over time. Brands reward consistency over novelty.
  4. A bio-based supply agreement would win two brand owner programmes at premiums of about 15%. Supply contracts decide renewal. Delivery reliability decides supplier rankings.
CLIENT PROFILE
The client is a mid-sized European solvent distributor and blender with annual sales near $180 million (client-reported, unverified by MMA), selling ethyl and butyl acetate to coatings, ink, and adhesive customers. It bought industrial grade on spot terms, had no high-purity range, and had two customers accounting for 42% of ester sales. Batch records protect future sales.
STRATEGIC CHALLENGE
Coatings customers were shifting to waterborne systems, Asian imports had cut industrial grade margins by a third, and pharmaceutical customers were asking for certified grades. Management needed to decide whether to build a high-purity line, add exempt solvent blends, or sign a bio-based supply agreement, with limited capital and one terminal. Cost control separates leaders from followers.
MMA APPROACH
MMA analysed sales, cost, and customer data across 26 products, interviewed 12 coatings, ink, and pharmaceutical buyers, five producers, and four regulatory advisers, and ran a buyer survey on purity, compliance, and price across three countries. It modelled margin by grade and customer, tested feedstock scenarios, and ranked options by payback and execution risk.
KEY FINDINGS
  1. A pharmaceutical and high-purity range could reach 15% of ester sales in three years at margins near 30% (client-reported, unverified by MMA). Clear specifications build buyer trust.
  2. Index-linked supply contracts and a second source would cut cost volatility by about a third across the range. Small importers feel every input swing.
  3. Exempt solvent blends would protect about 12% of coatings volume at risk from waterborne switching. Technical reach compounds over time. Brands reward consistency over novelty.
  4. A bio-based supply agreement would win two brand owner programmes at premiums of about 15%. Supply contracts decide renewal. Delivery reliability decides supplier rankings.
RECOMMENDED STRATEGY
Phase 1: Phase 1 (Months 1-6): Sign index-linked contracts, qualify a second source, and plan pharmaceutical certification. Margins follow sourcing discipline. Buyers review suppliers every season. Phase 2: Phase 2 (Months 7-24): Launch pharmaceutical and exempt solvent blends and sign a bio-based agreement. Batch records protect future sales. Cost control separates leaders from followers. Phase 3: Phase 3 (Months 25-42): Scale certified ranges, extend to electronics, and review margin and cost quarterly. Clear specifications build buyer trust.
OUTCOME
Within 42 months, certified and exempt ranges reached 20% of ester sales, cost volatility fell by 26%, and gross margin on the range rose to 28% (client-reported, unverified by MMA). The client won four pharmaceutical programmes, cut top-two customer share to 36%, and held stockouts below 3%. Small importers feel every input swing.

Frequently Asked Questions

Foundational context covering the market sizes, CAGR, scope, country, region and competition that inform every finding below. This section is provided to cover basics and most often pre-purchase conversations, answered from the MMA Primary Research Dataset.

What is the current size of the Acetic Acid Esters Market?

The global acetic acid esters market was valued at $6.8 billion in 2025 on a producer-value basis. Growth is supported by packaging, pharmaceutical, and electronic demand, offset by Chinese overcapacity and VOC rules.

How large will the Acetic Acid Esters Market be by 2036?

The market is projected to reach $10.9 billion by 2036, up from $7.1 billion in 2026. The increase of $3.8 billion reflects high-purity grades, bio-based esters, and steady packaging demand.

What is the CAGR for the Acetic Acid Esters Market 2026 to 2036?

The market is forecast to grow at a 4.4% CAGR from 2026 to 2036. The bull case reaches 5.8% and the bear case 3.0%, depending on semiconductor growth, Chinese capacity, and VOC regulation.

Which segment is growing fastest?

Electronic and High-Purity Grade Acetate Esters is the fastest-growing segment at 8.6% CAGR, roughly 1.95 times the overall market rate. Bio-Based and Low-Carbon Grade Acetate Esters follows at 7.4% CAGR each year.

Who are the major companies in the Acetic Acid Esters Market?

Major companies include Celanese, Eastman Chemical, INEOS, Sasol, and Resonac. BASF, Dow, Daicel, Jubilant Ingrevia, and Yip's Chemical also hold meaningful positions in regional and specialty supply.

Which country is growing fastest?

India is growing fastest at about 6.6% CAGR, because pharmaceutical, paint, and flexible packaging output is expanding and producers are adding bio-based ethanol-linked capacity. China follows as semiconductor and packaging output rises.

Report Segmentation Architecture

The full report scope spans multiple orthogonal segmentation dimensions, with cross-tabulated demand data provided for each dimension pair. Coverage extends further to regional breakdowns, trend trajectories, and the competitive detail needed to support segment-level decision-making.

By Primary Market Dimension

  • Industrial Solvent Grade Acetate Esters
  • Food and Flavour Grade Acetate Esters
  • Pharmaceutical Grade Acetate Esters
  • Electronic and High-Purity Grade Acetate Esters
  • Bio-Based and Low-Carbon Grade Acetate Esters

By End-Use Industry

  • Paints and Coatings
  • Printing Inks and Flexible Packaging
  • Adhesives and Sealants
  • Pharmaceuticals and Fine Chemicals
  • Electronics and Semiconductors

By Commercial Dimension

  • Direct Supply Contracts
  • Chemical Distributors
  • Bulk and Tanker Sales
  • Spot and Trader Sales
  • Toll Blending Arrangements

By Region

  • East Asia
  • North America
  • Western Europe
  • South Asia and Pacific
  • Latin America
  • Middle East and Africa
  • Eastern Europe

Scope, Methodology, and Coverage

Every figure in this report is reproducible from documented input assumptions. The scope below maps the historical period, the forecast horizon, the segmentation dimensions, and the countries covered, alongside the underlying primary and qualitative methodology.
Historical Period
2020 to 2025
Forecast Period
2026 to 2036
Base Year
2025 (USD billions; MMA Primary Research Dataset, September 2026)
Market Definition
The market covers global sales of acetic acid esters, valued at producer level, including ethyl acetate, n-butyl and isobutyl acetate, isopropyl and n-propyl acetate, and methyl acetate, sold as industrial solvent grade, food and flavour grade, pharmaceutical grade, electronic and high-purity grade, and bio-based grade. The scope excludes vinyl acetate monomer, cellulose acetate, glycol ether acetates, acetic acid and acetic anhydride sold on their own, and finished coatings, inks, and adhesives.
Quantitative Units
USD billions (producer value); kilotonnes for volume references
Segmentation Dimensions
By Grade; By End-Use Industry; By Commercial Dimension; By Region
Regions Covered
East Asia, North America, Western Europe, South Asia and Pacific, Latin America, Middle East and Africa, Eastern Europe
Countries Covered
China, Japan, South Korea, India, United States, Germany, France, Italy, United Kingdom, Brazil, Mexico, South Africa, Poland, and additional markets relevant to this sector
Key Companies Profiled
Celanese, Eastman Chemical, INEOS, Sasol, Resonac, BASF, Dow, Mitsubishi Chemical Group, Daicel, Sekab, Godavari Biorefineries, Jubilant Ingrevia, Yip's Chemical, Merck, Brenntag, Univar Solutions, Kanto Chemical, SABIC, Shell Chemicals, LyondellBasell
Quantitative Methodology
Primary survey, n=3,800 respondents, Q4 2025, six countries; demand-side model with trade association cross-validation
Qualitative Methodology
47 expert interviews, Q4 2025; applied to validate demand model assumptions, identify emerging dynamics, and assess competitive positioning
Report Format
PDF and XLSX data workbook (Word format preview document)
Publisher
Market Minds Advisory
Report Code
MMA-2026-CHM-598
Published
September 2026
Contact
sales@marketmindsadvisory.com | www.marketmindsadvisory.com

Purchase the full Acetic Acid Esters Market Report (2026 to 2036).

The full report delivers a detailed assessment of the global acetic acid esters market through 2036, covering grade, end-use, and regional forecasts, competitive benchmarking of leading producers, and input cost analysis. It combines MMA primary research, including a six-country survey of 3,800 respondents and 47 expert interviews, with public statistical and company data. Analysts also model feedstock scenarios, VOC regulation paths, and bio-based adoption. Clients receive segment margin ranges, sourcing maps, and a case study on portfolio strategy. Customer programme and supply contract frameworks are also included for planning.
Ten-year grade and end-use demand forecasts
Acetic acid, alcohol, and energy cost tracking
Competitive benchmarking of top twenty producers
VOC and REACH regulatory tracker updates
Regional supply chain comparative analysis included
Quarterly primary survey data update access

Built For The People Who Decide

From boardroom strategy to bench-side execution, this report is read cover-to-cover by leaders shaping the next decade of their industry, turning demand scenarios, market dynamics and valuation benchmarks into decisions.
CXOs/ Presidents/ VPs/ Managers
M&A and Corporate Development
Strategy Teams and R&D Heads
Procurement and Product Directors
Regulatory and Compliance Leaders
Investor Relations and Equity Analysts